
Menu Dilemmas: An Integrated Assessment of the Nutritional Quality, Environmental Impact, and Cost of Vegan, Vegetarian, and Meat-Based Versions of Meals


Abstract
1. Introduction
2. Materials and Methods
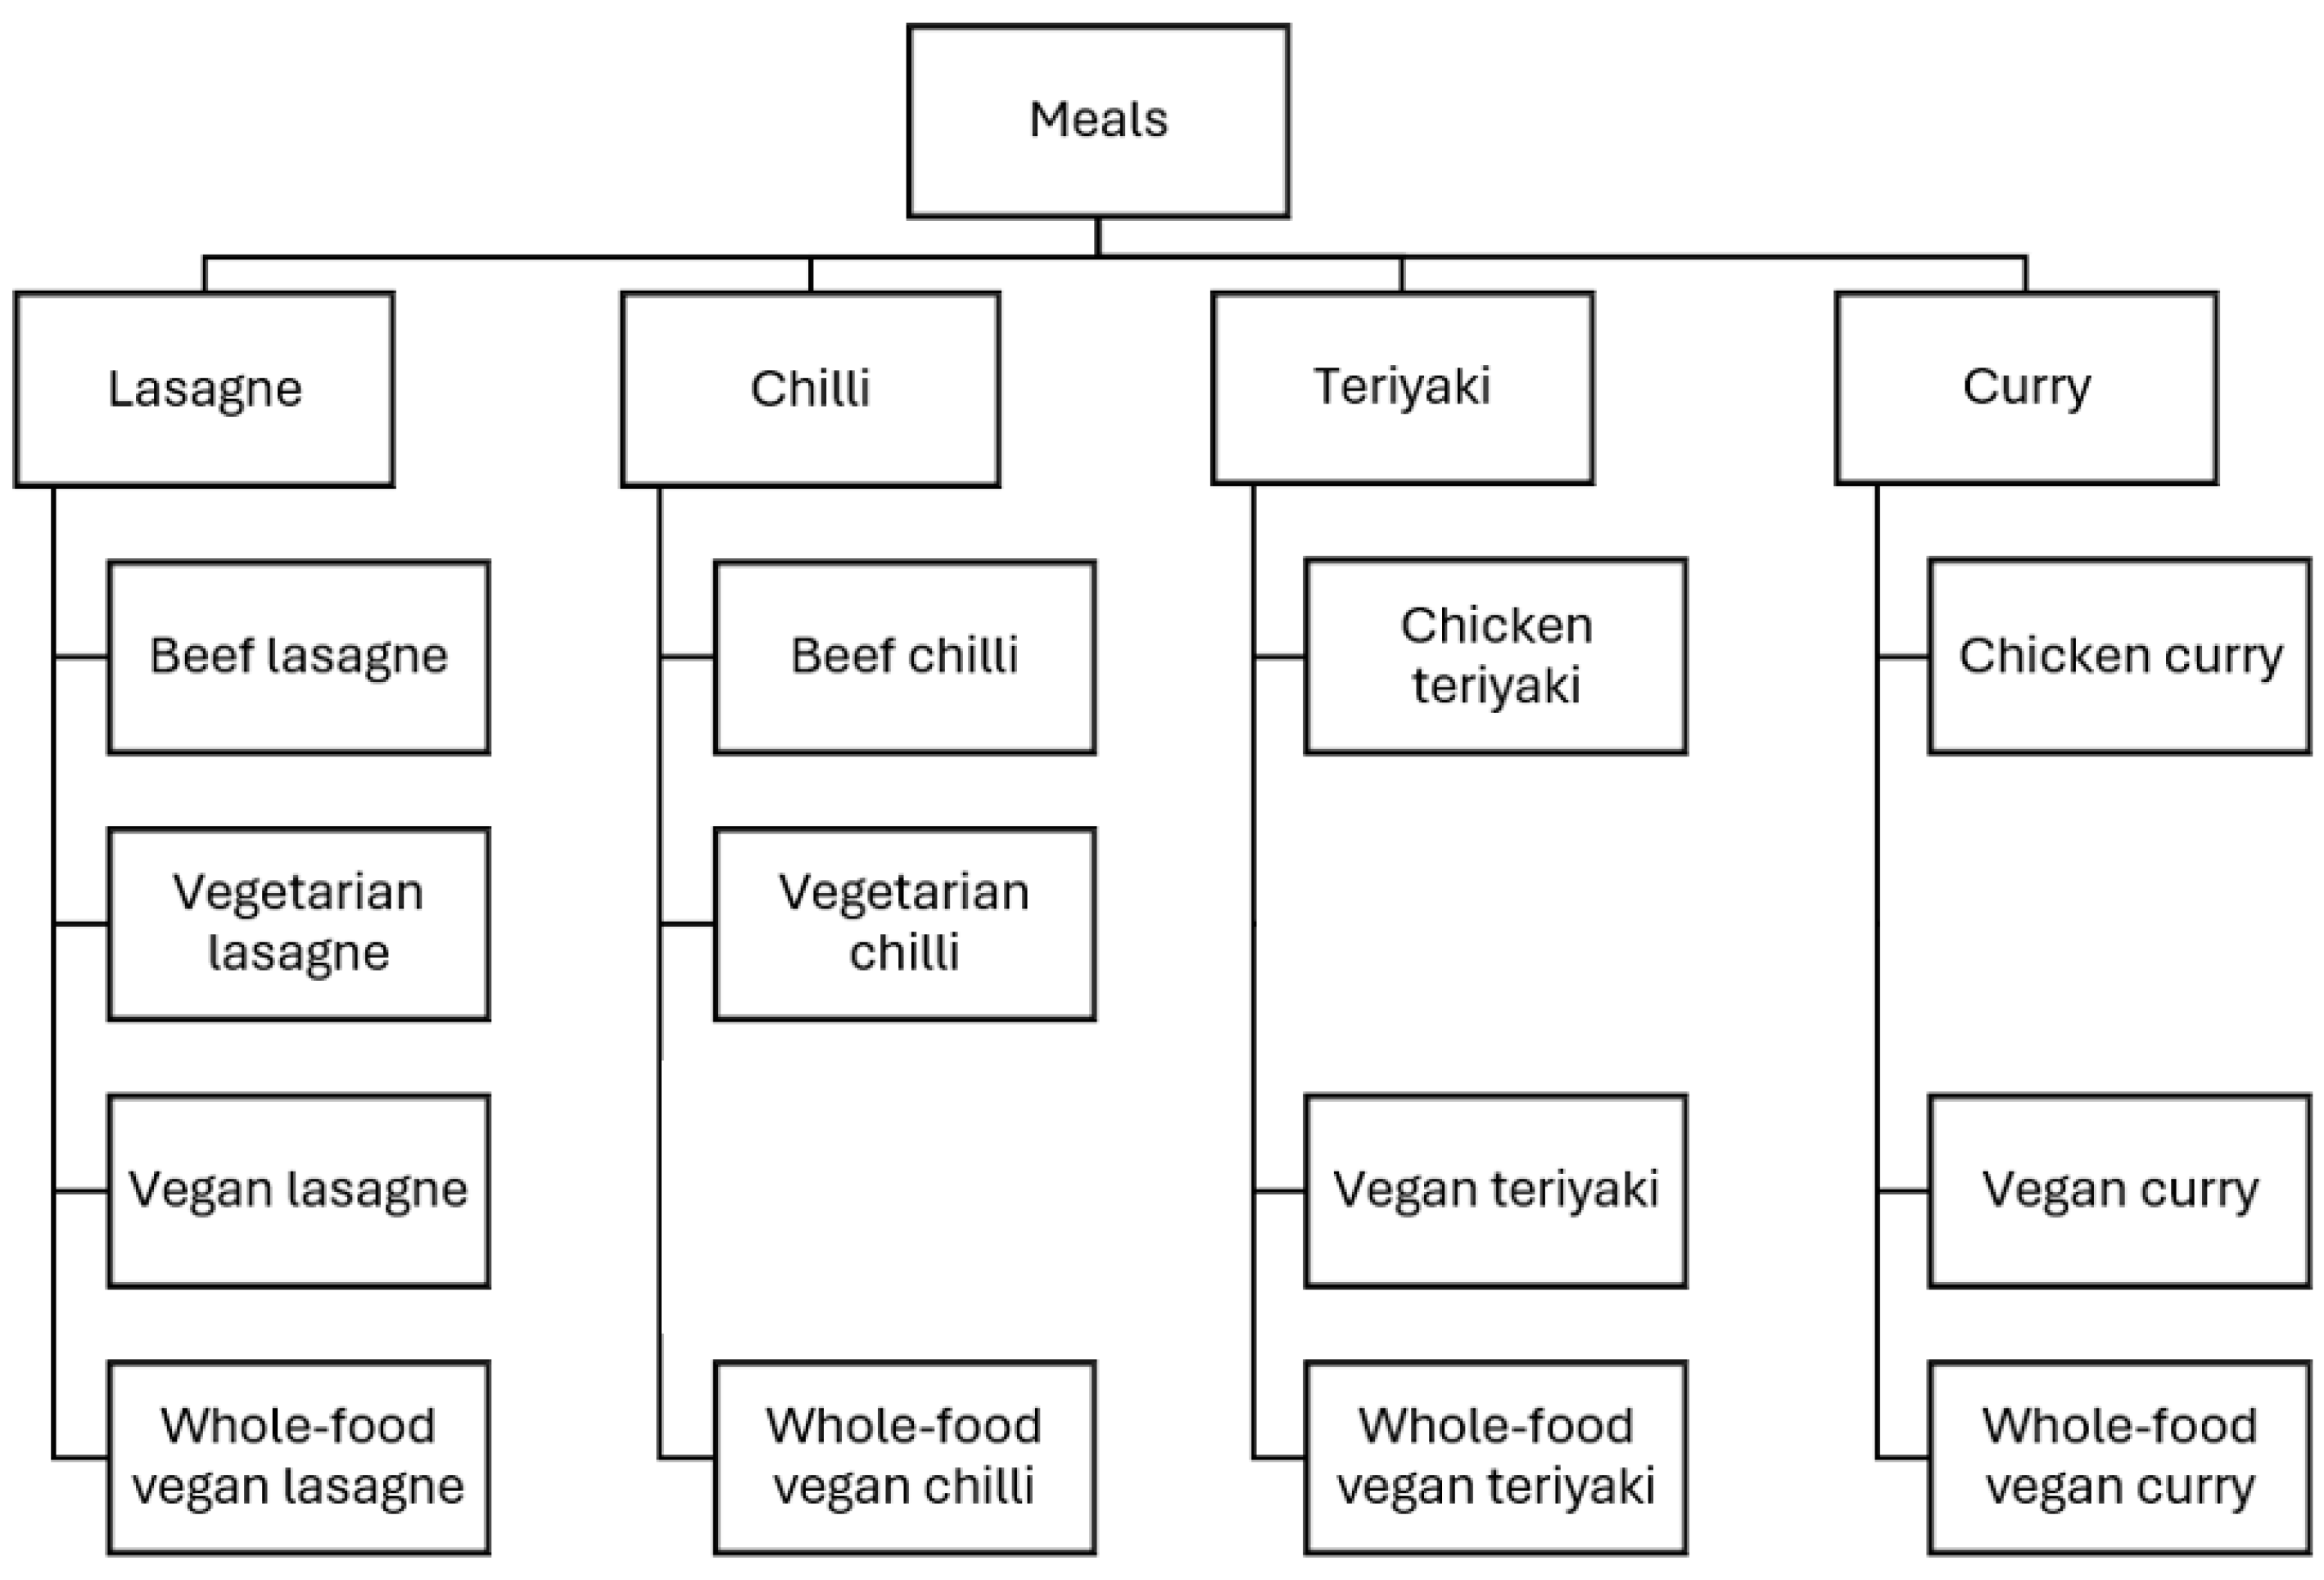
2.1. Study Overview
2.2. Nutritional Quality Assessment
2.3. Environmental Impact Assessment
2.4. Recipe Costing
2.5. Integrated Assessment
3. Results
3.1. Nutritional Quality
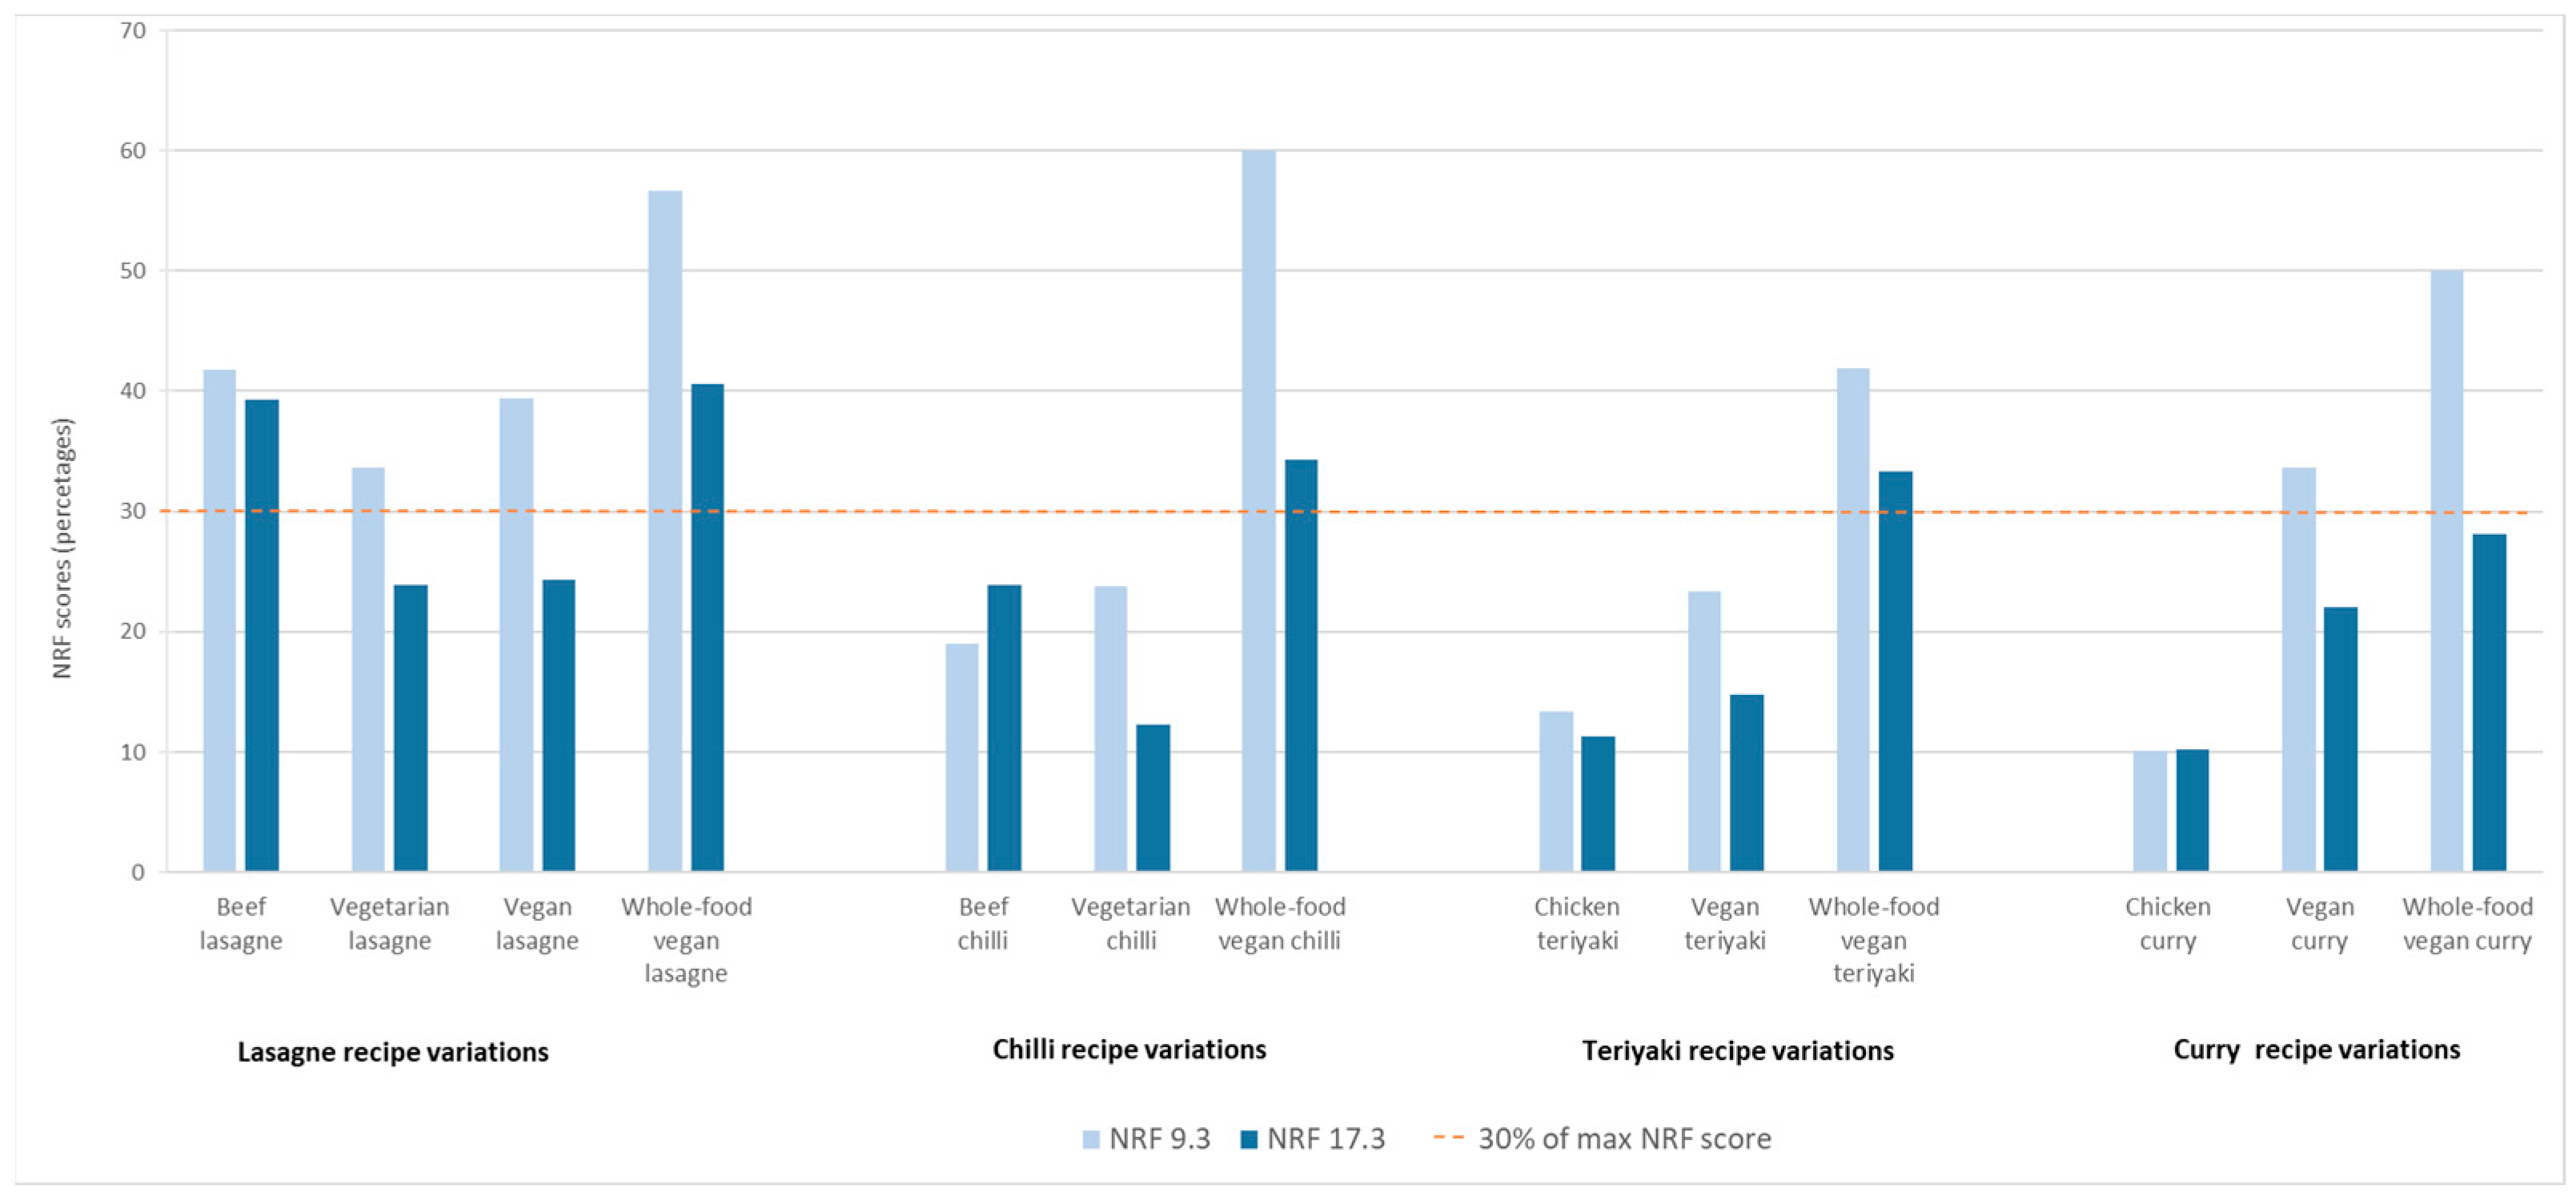
3.1.1. Nutrient Density of Recipes
3.1.2. Nutritional Composition of Recipes
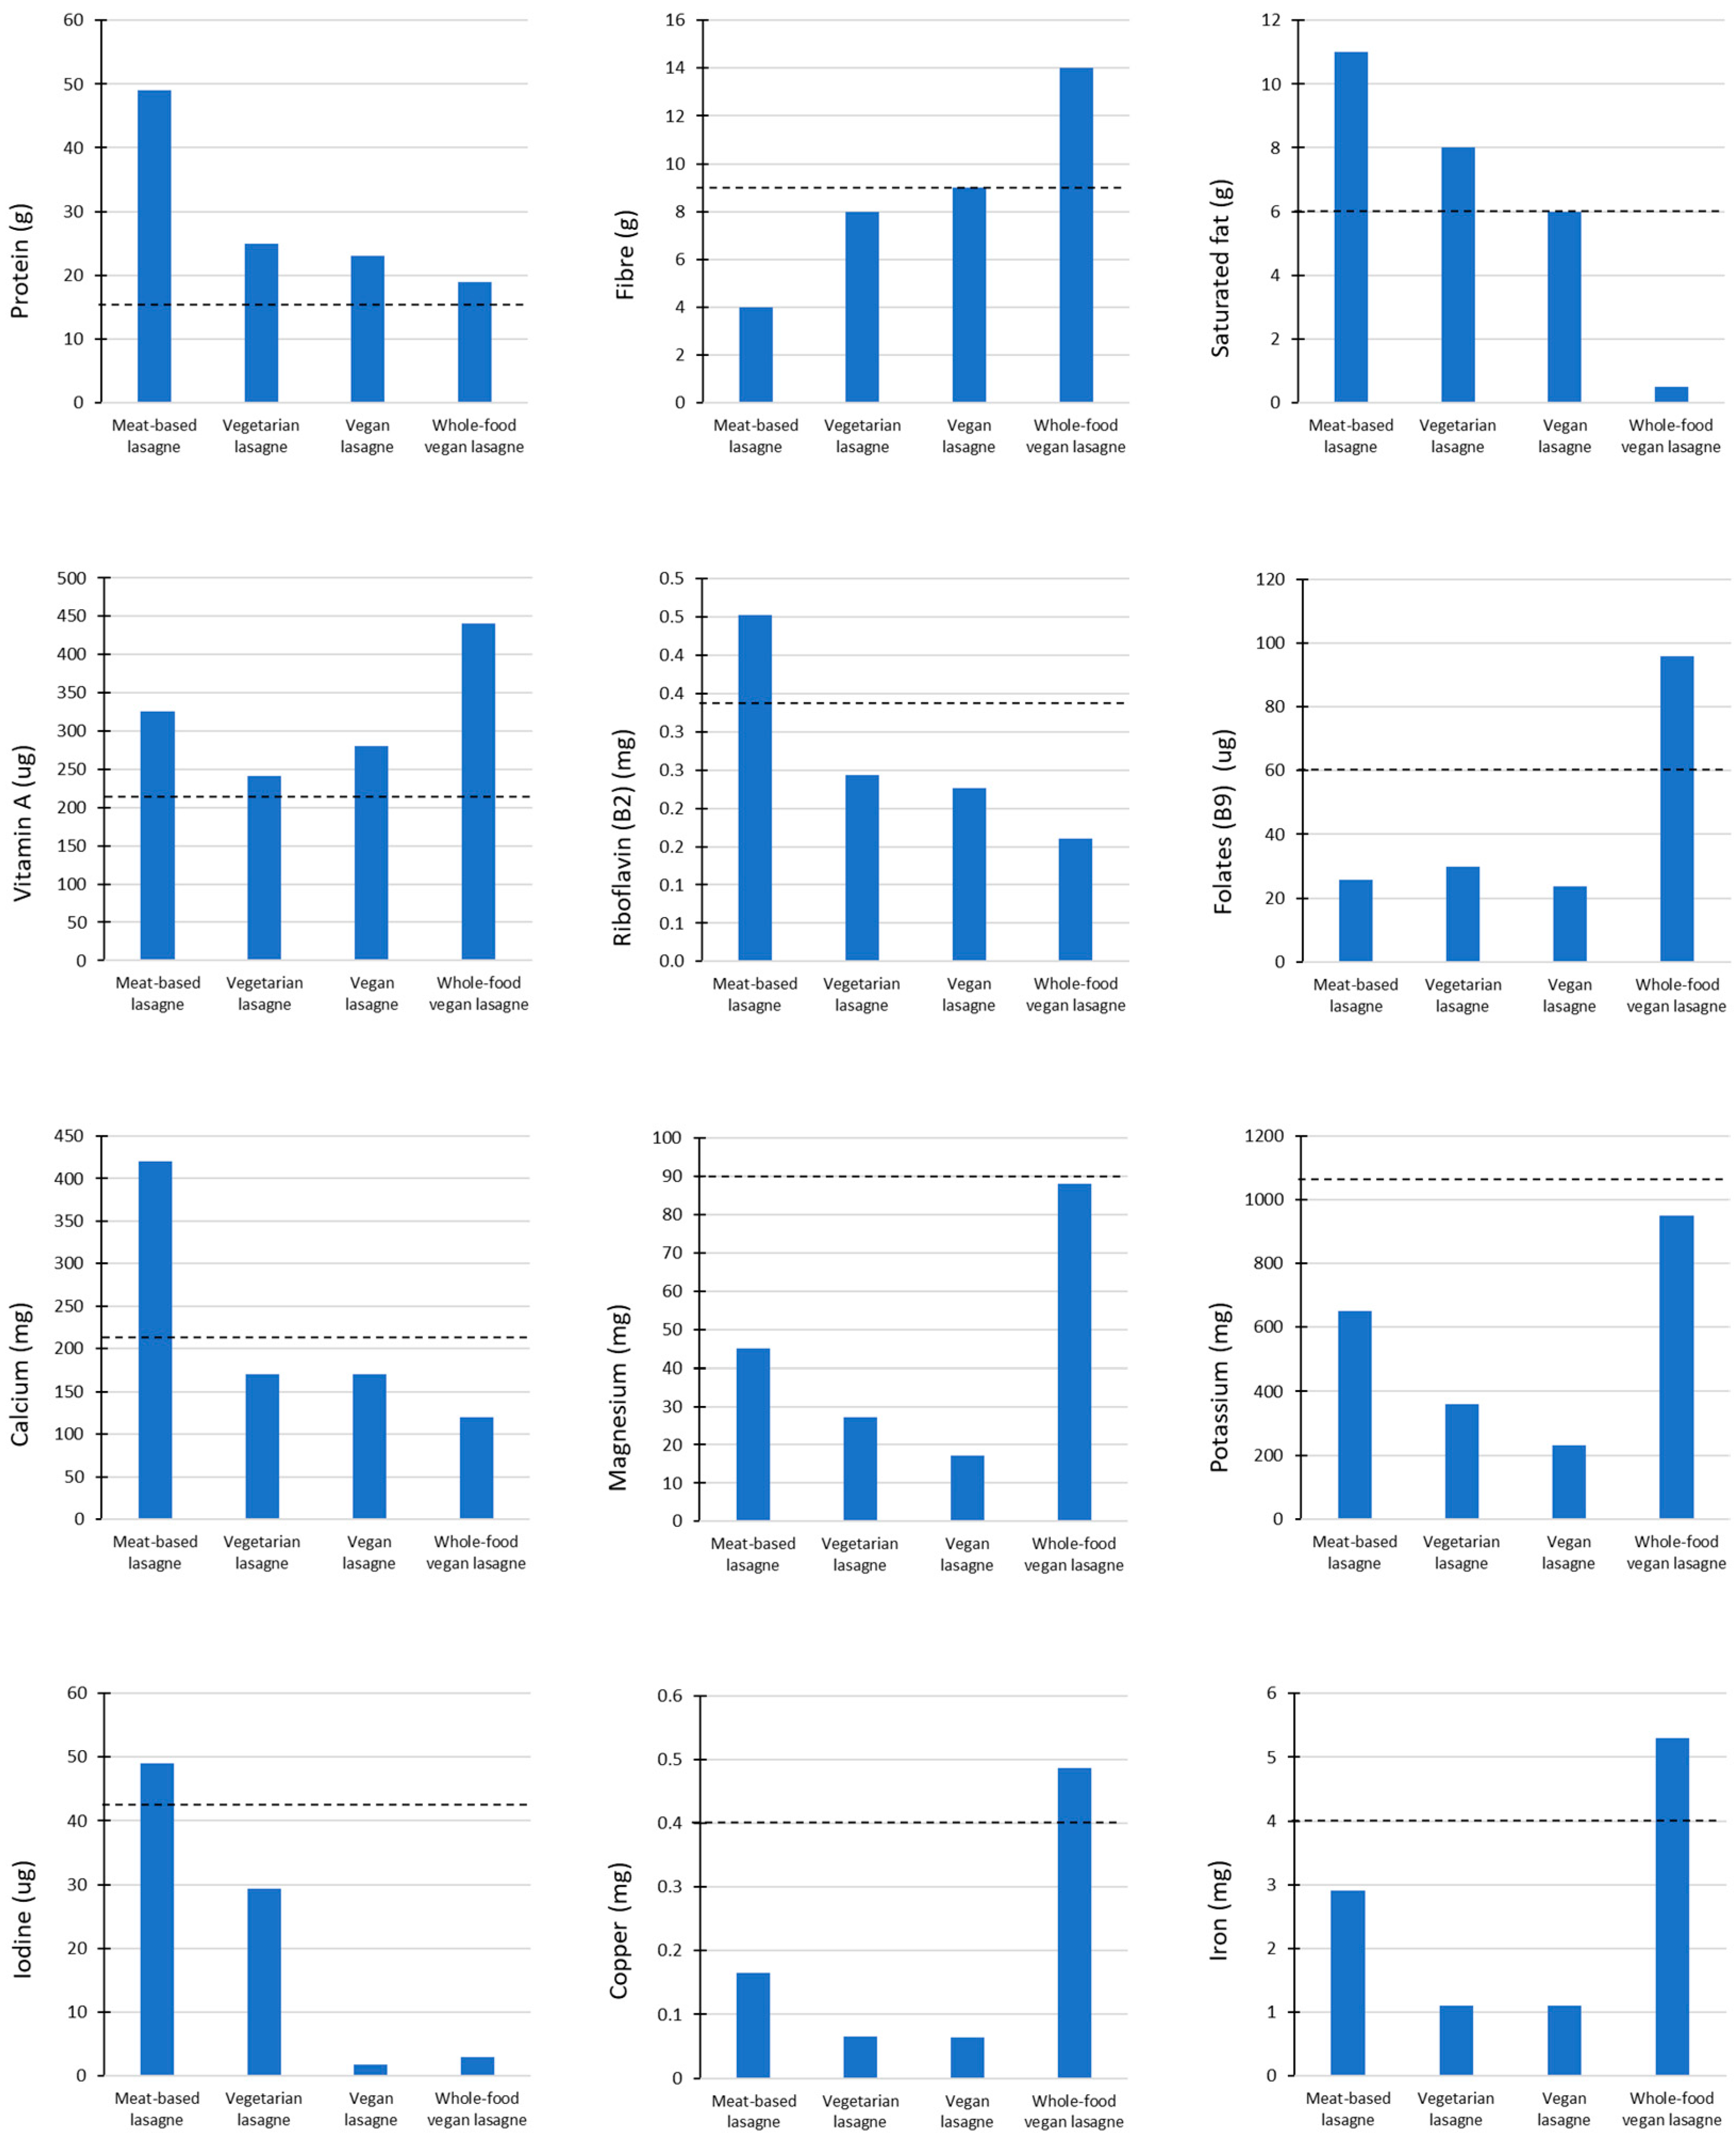
Lasagne Recipes
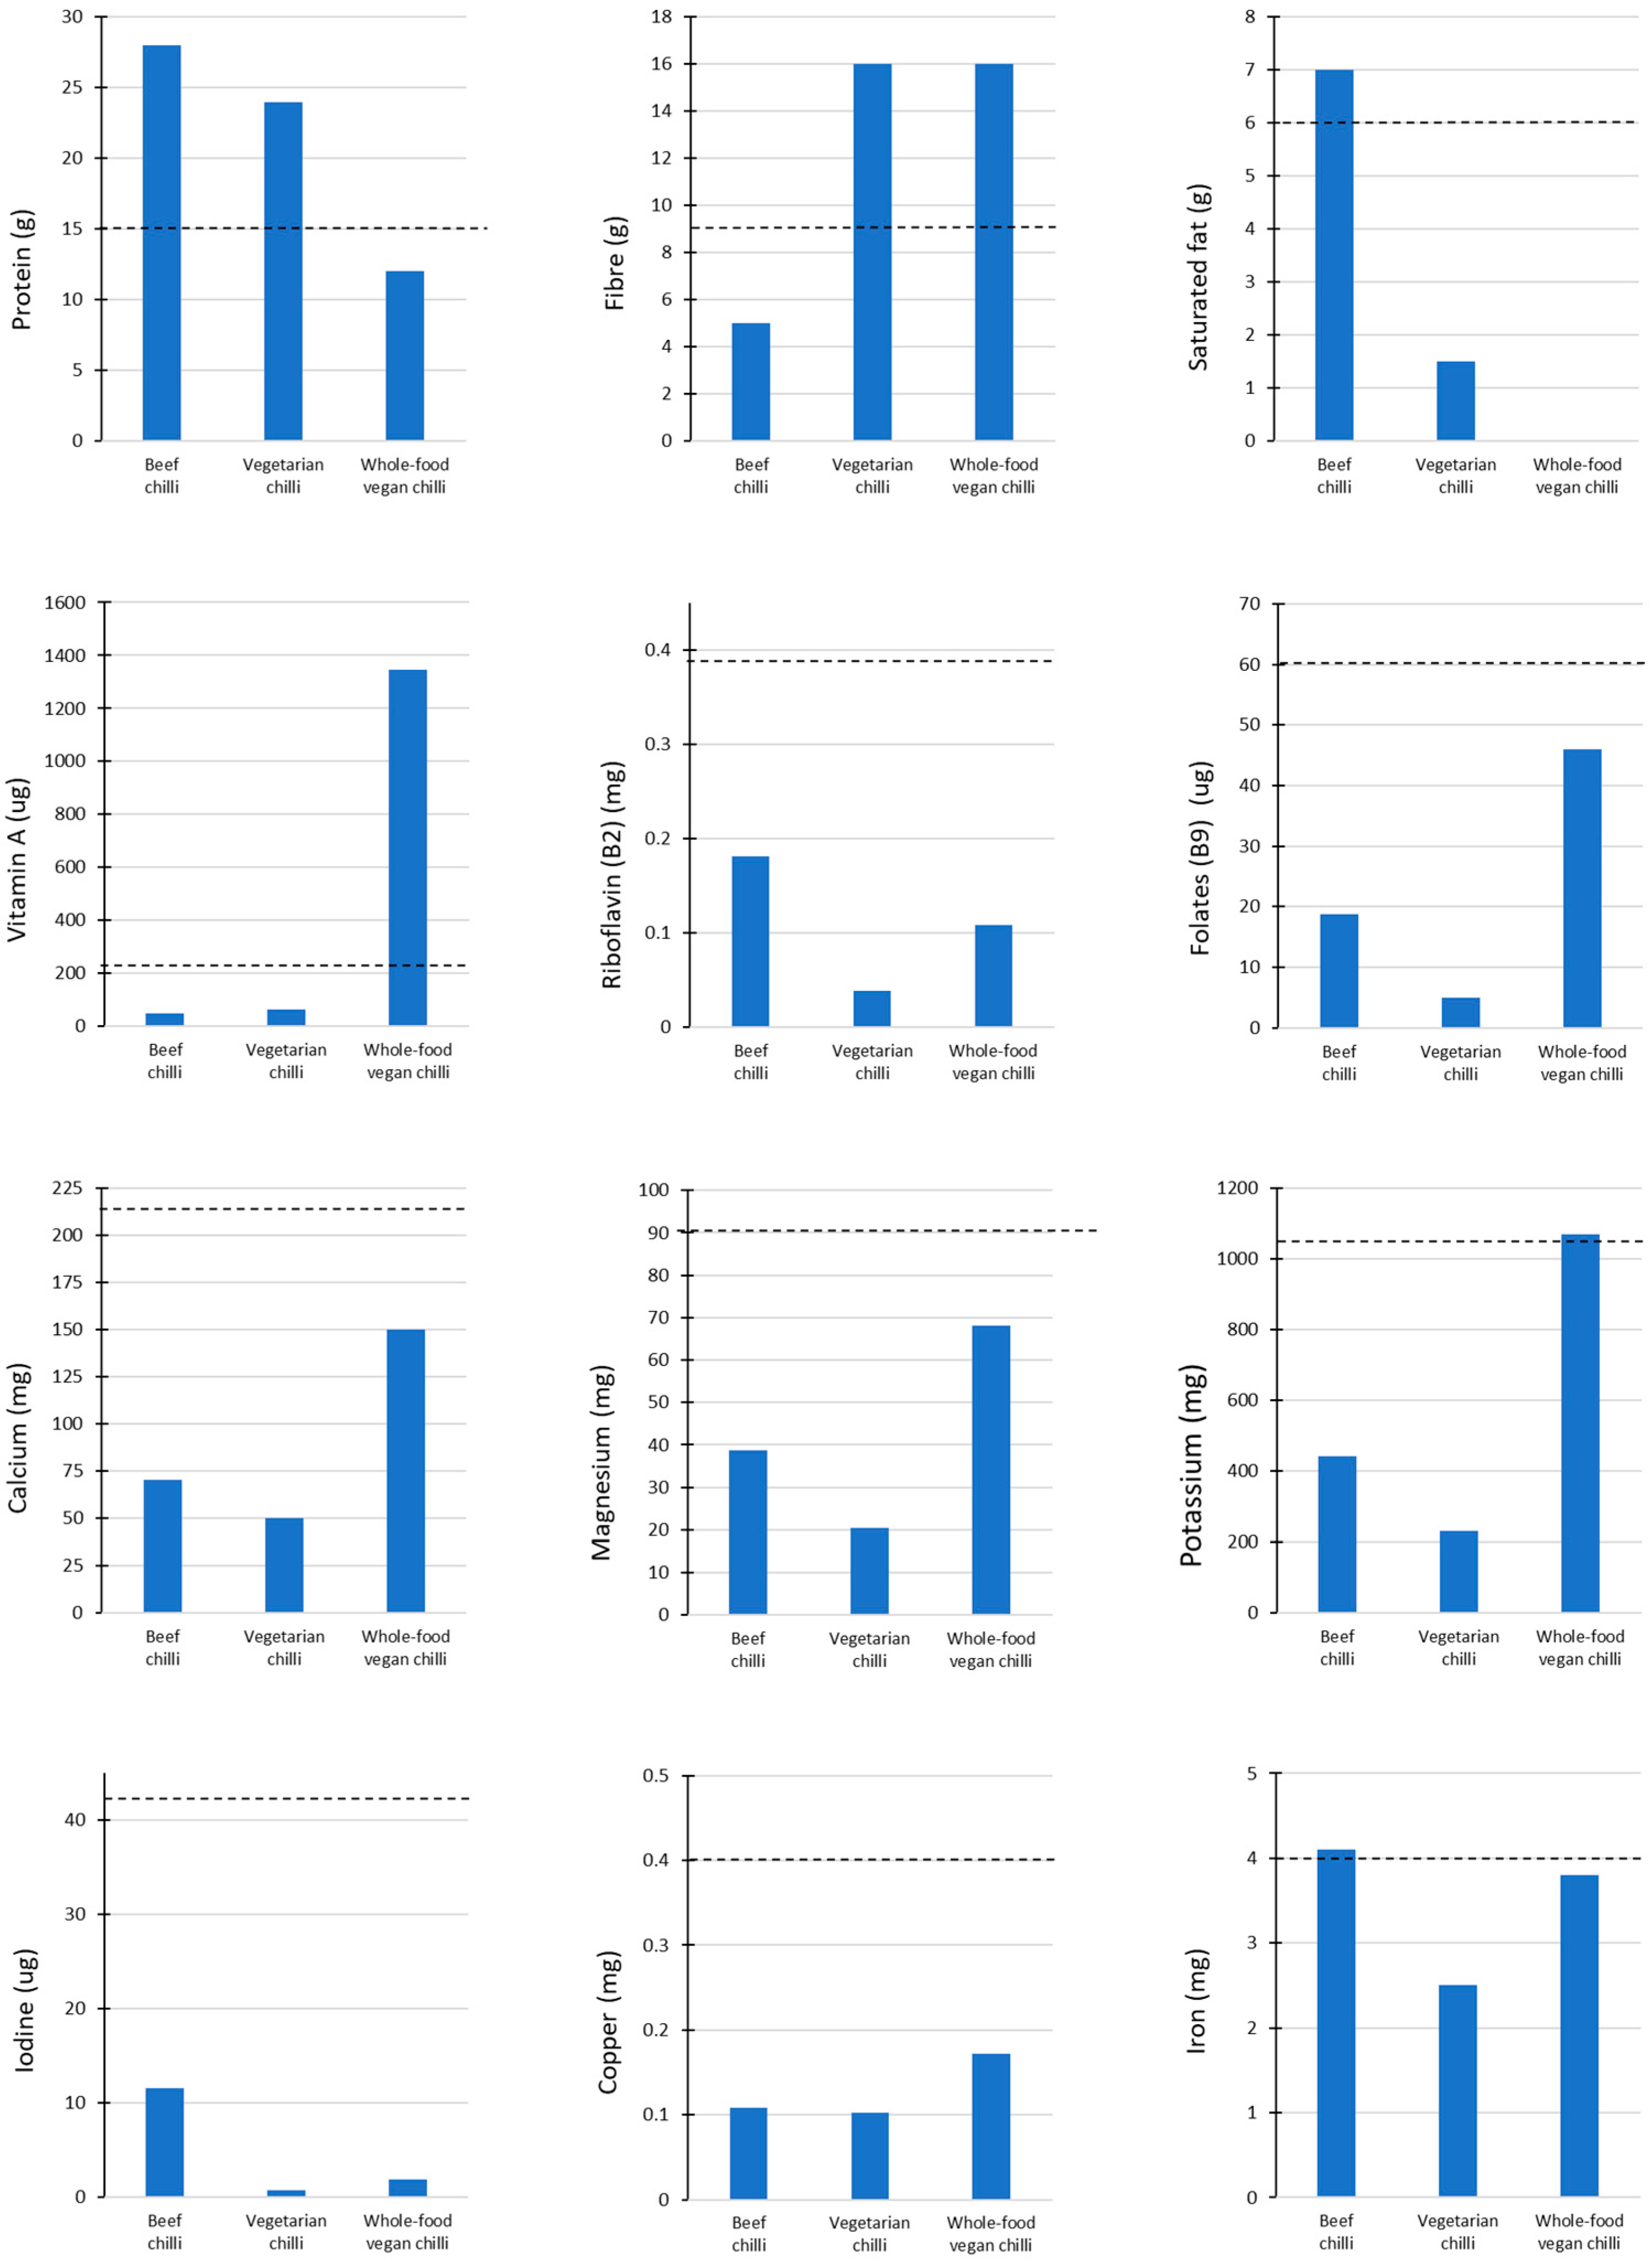
Chilli Recipes
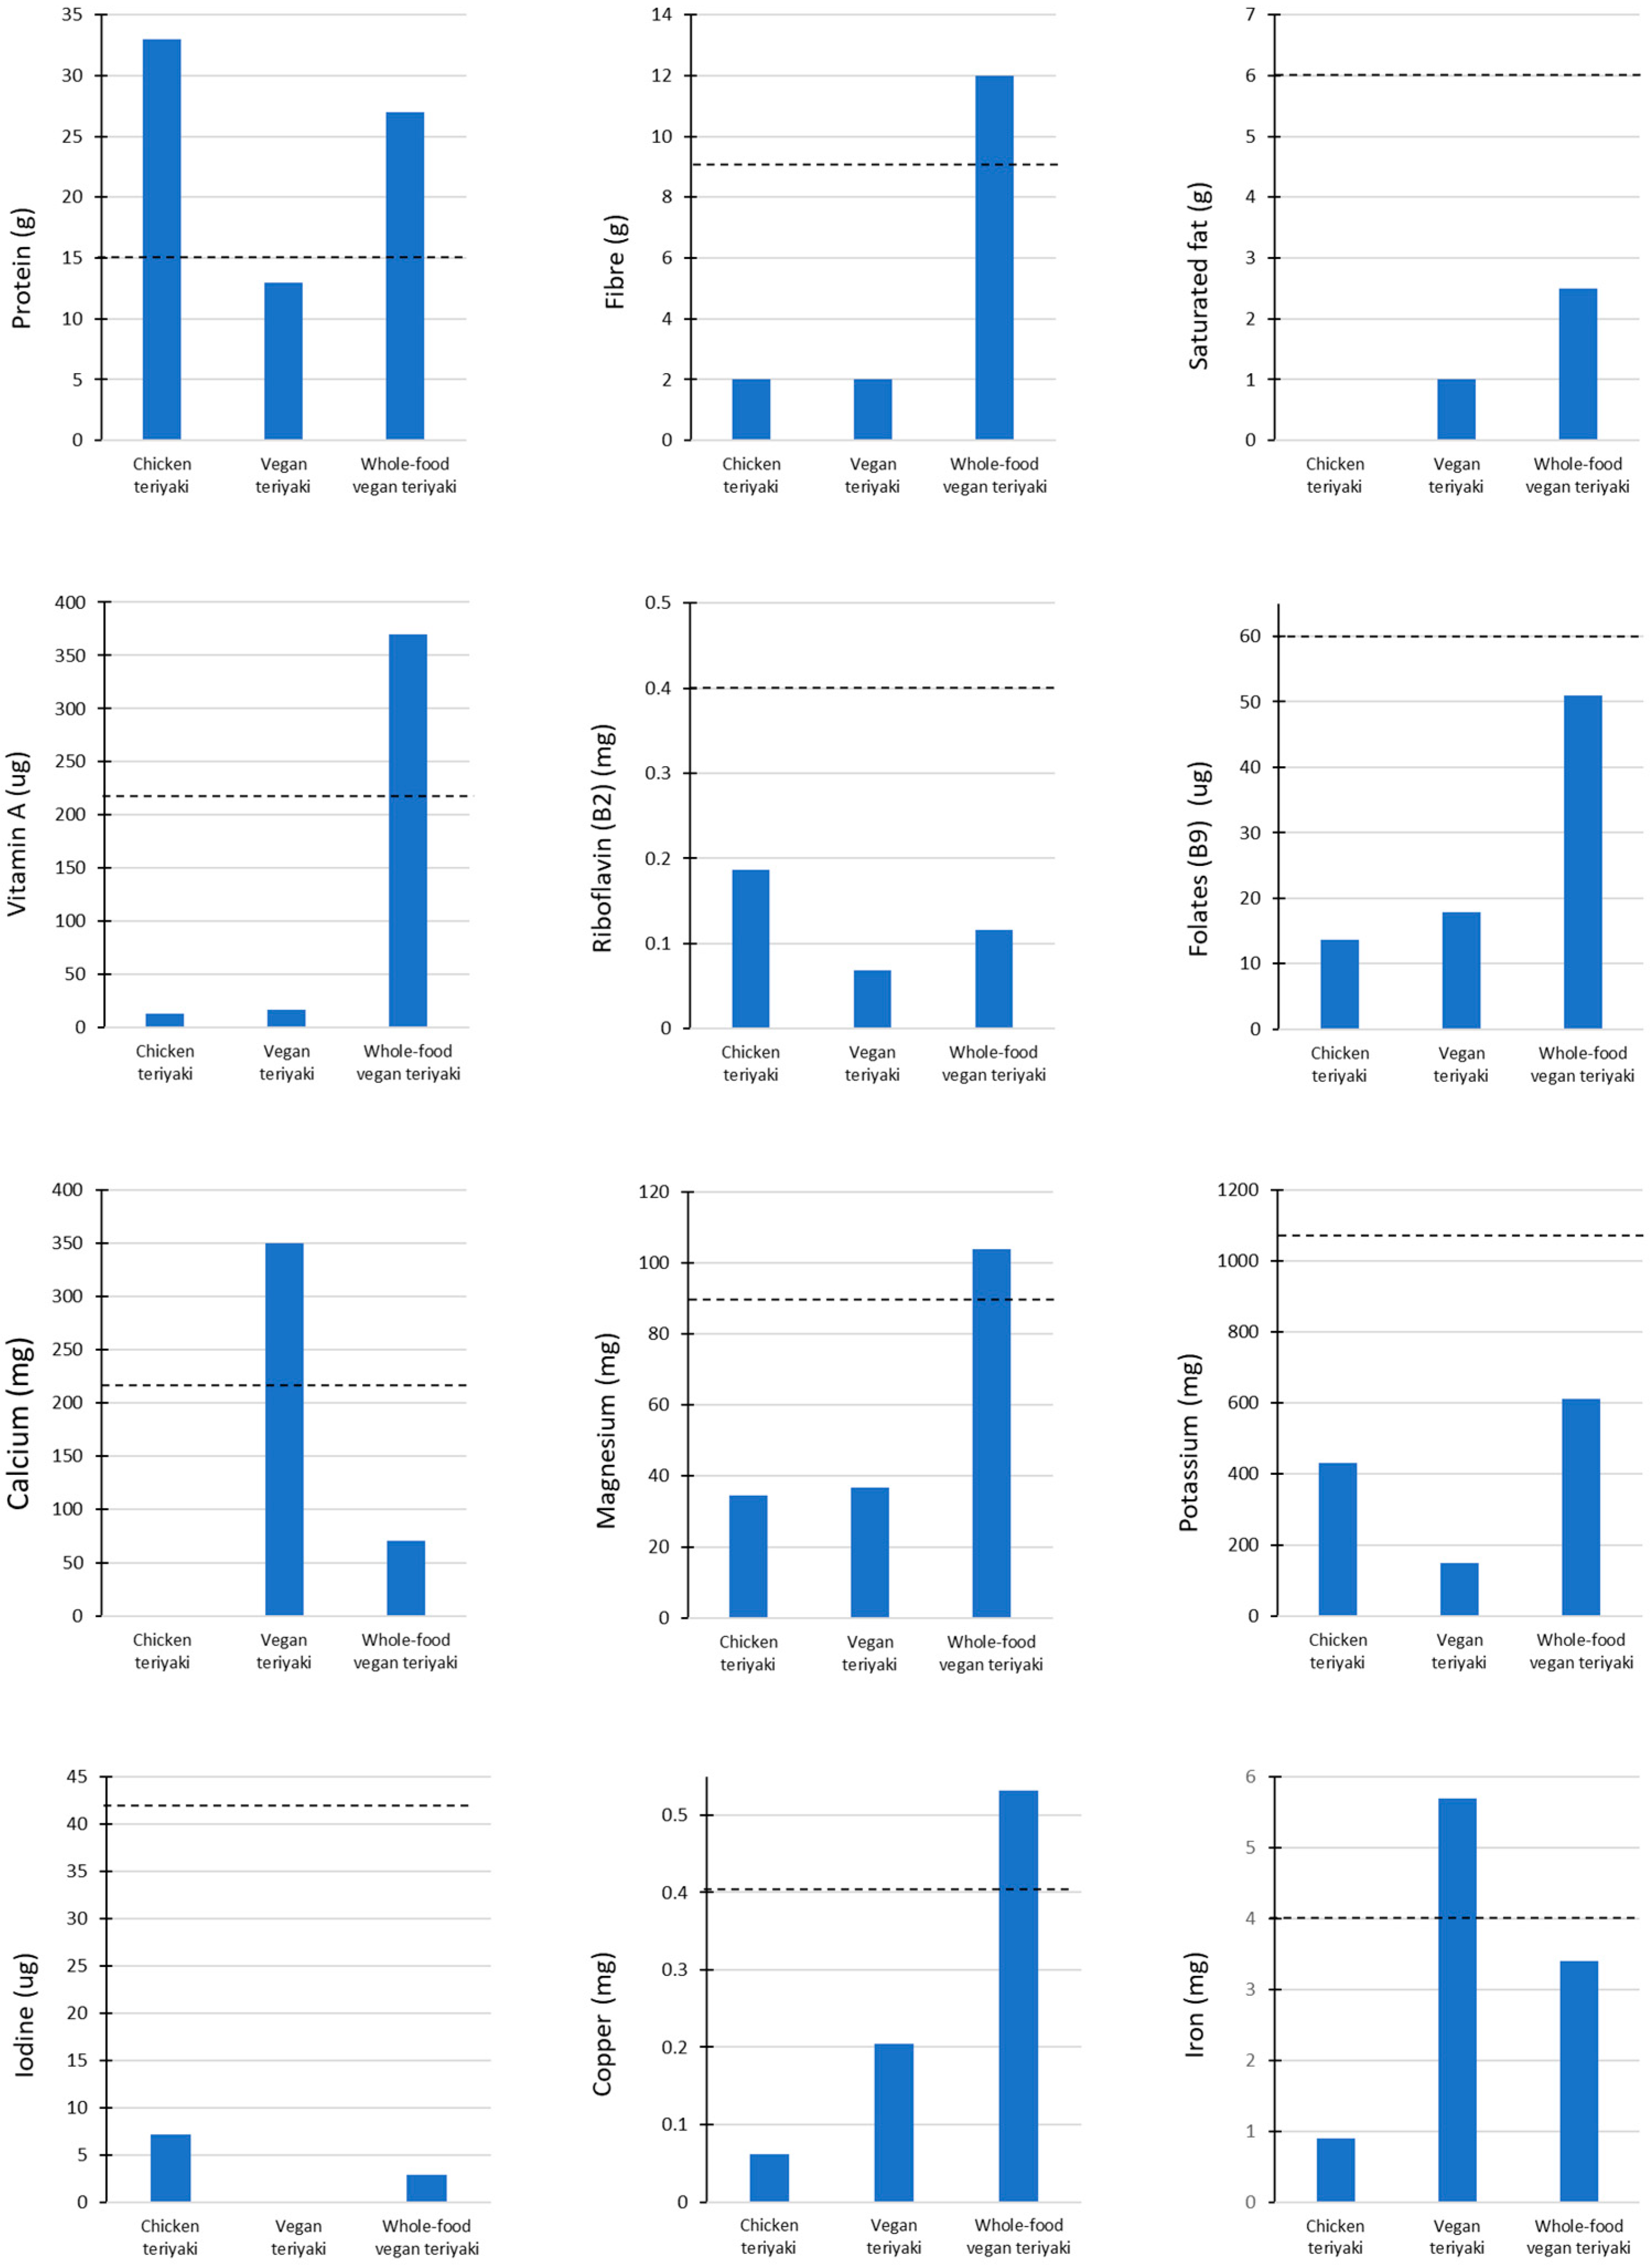
Teriyaki Recipes
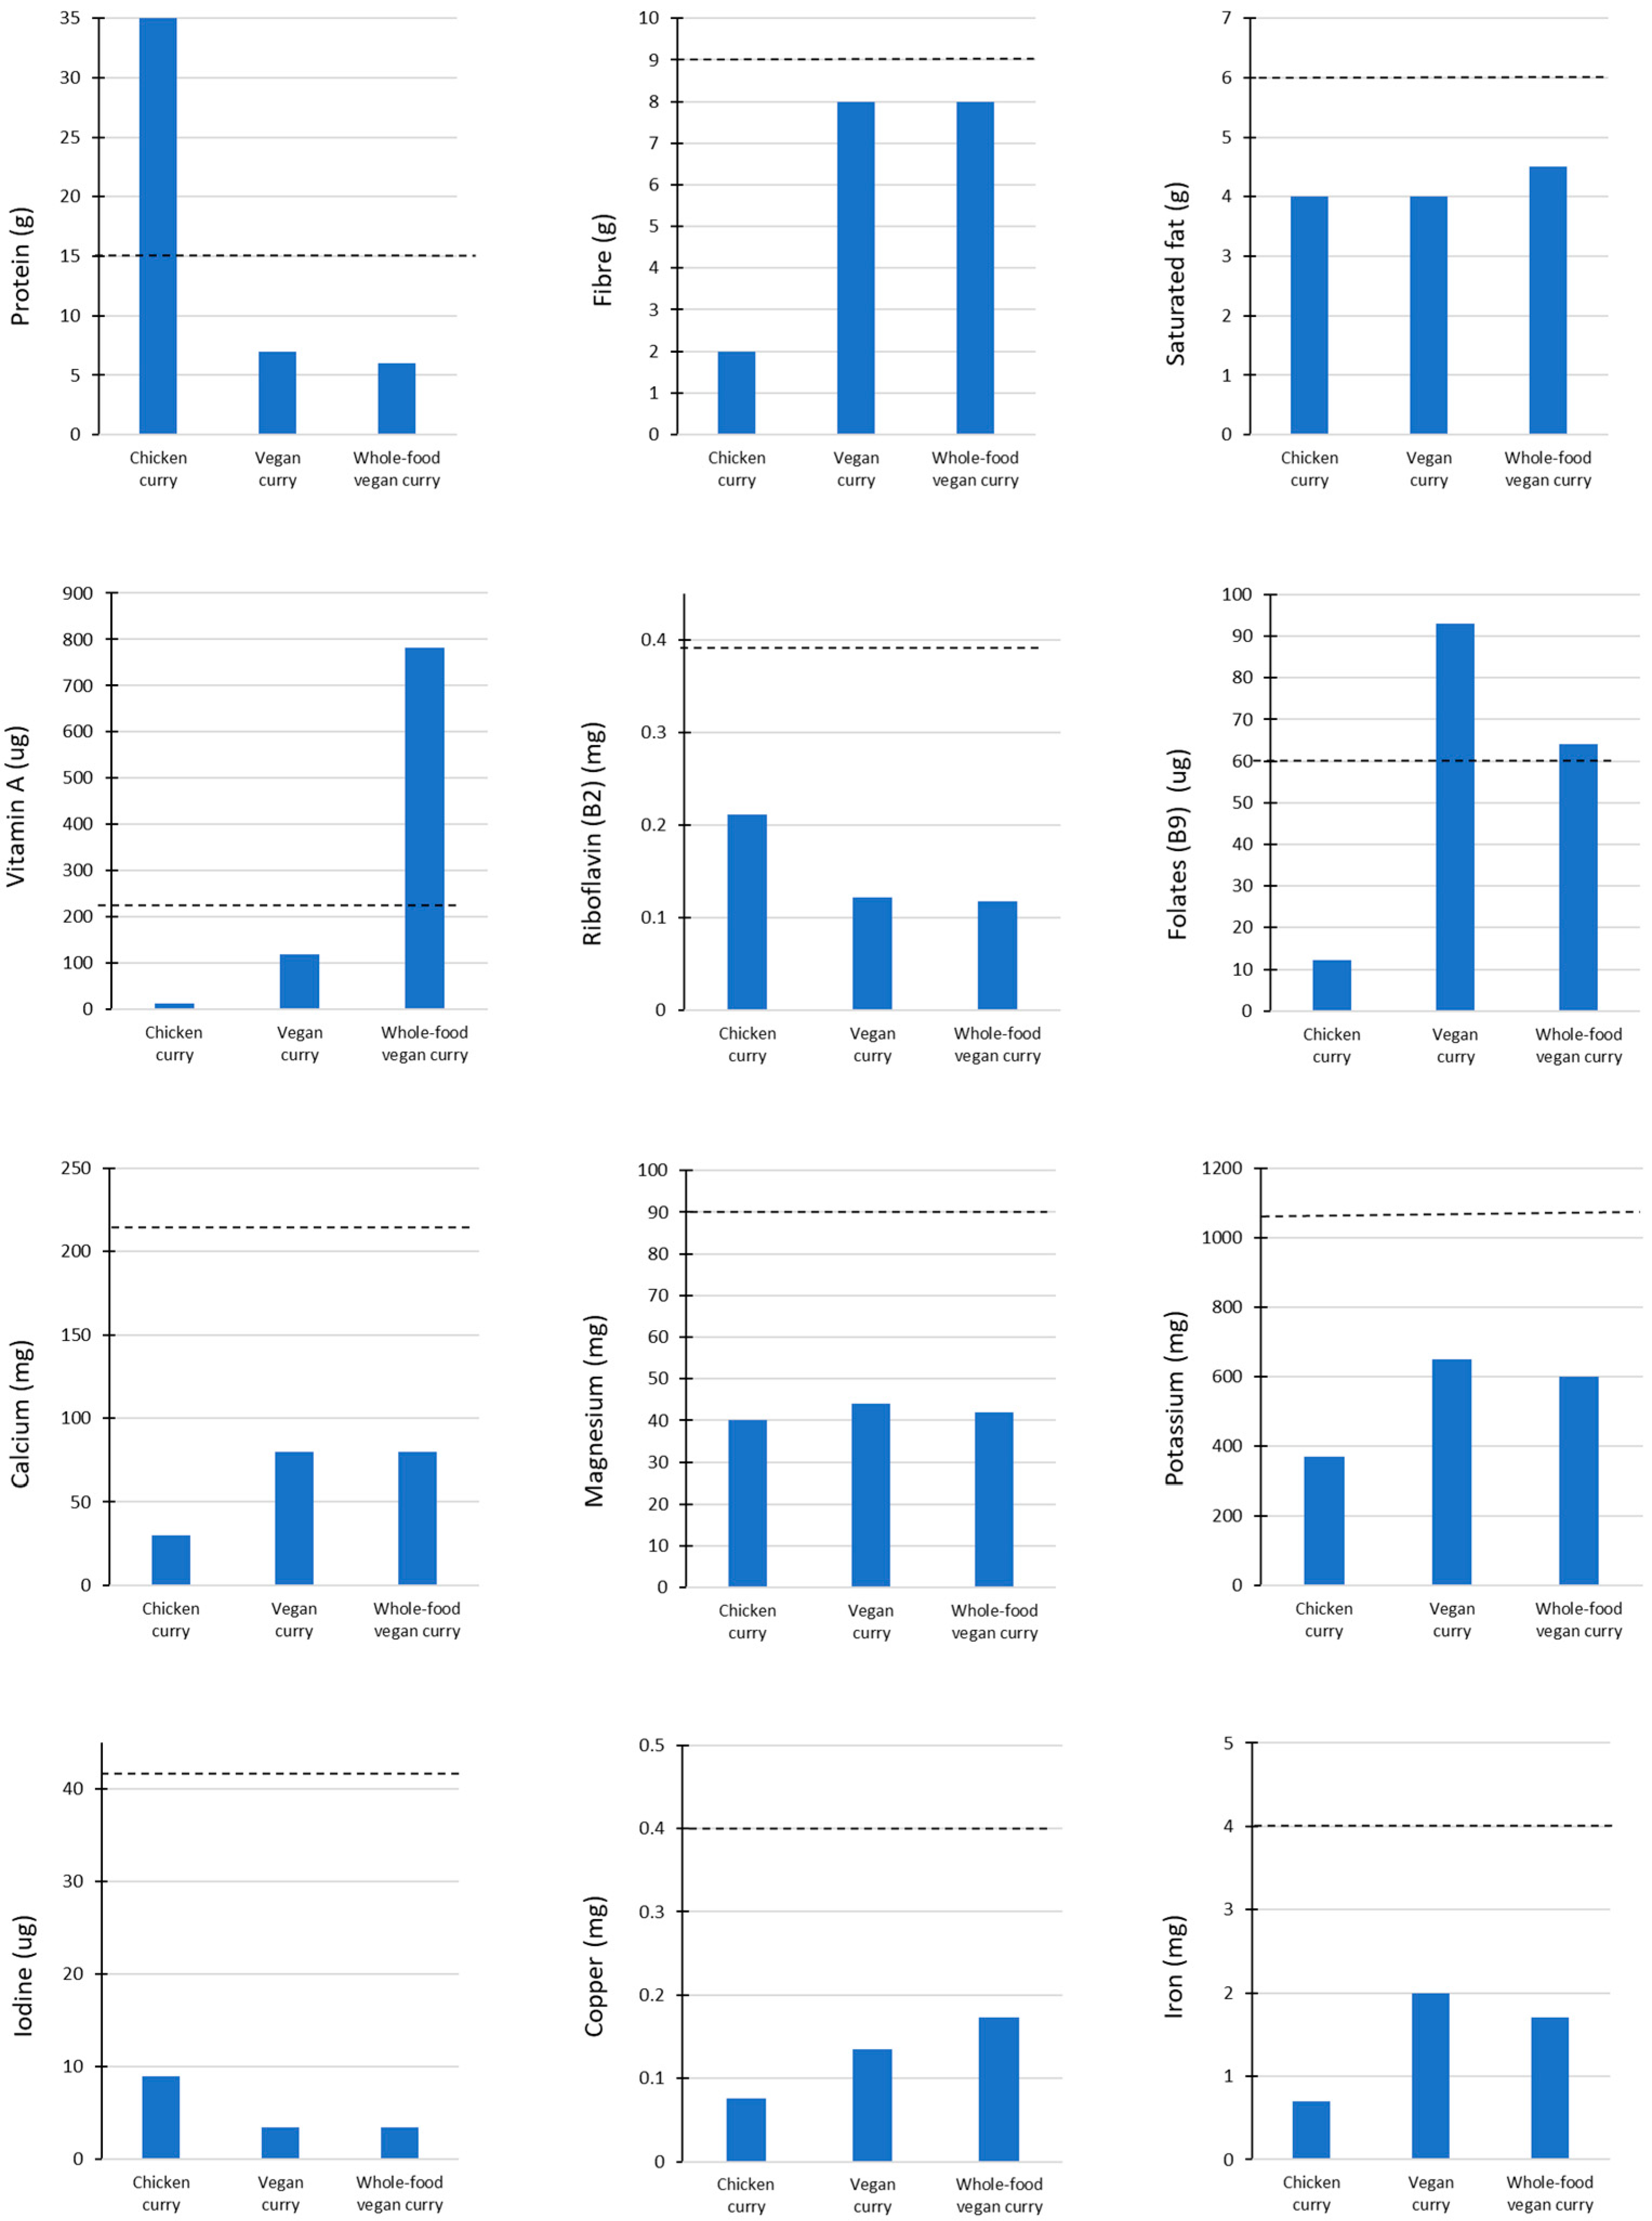
Curry Recipes
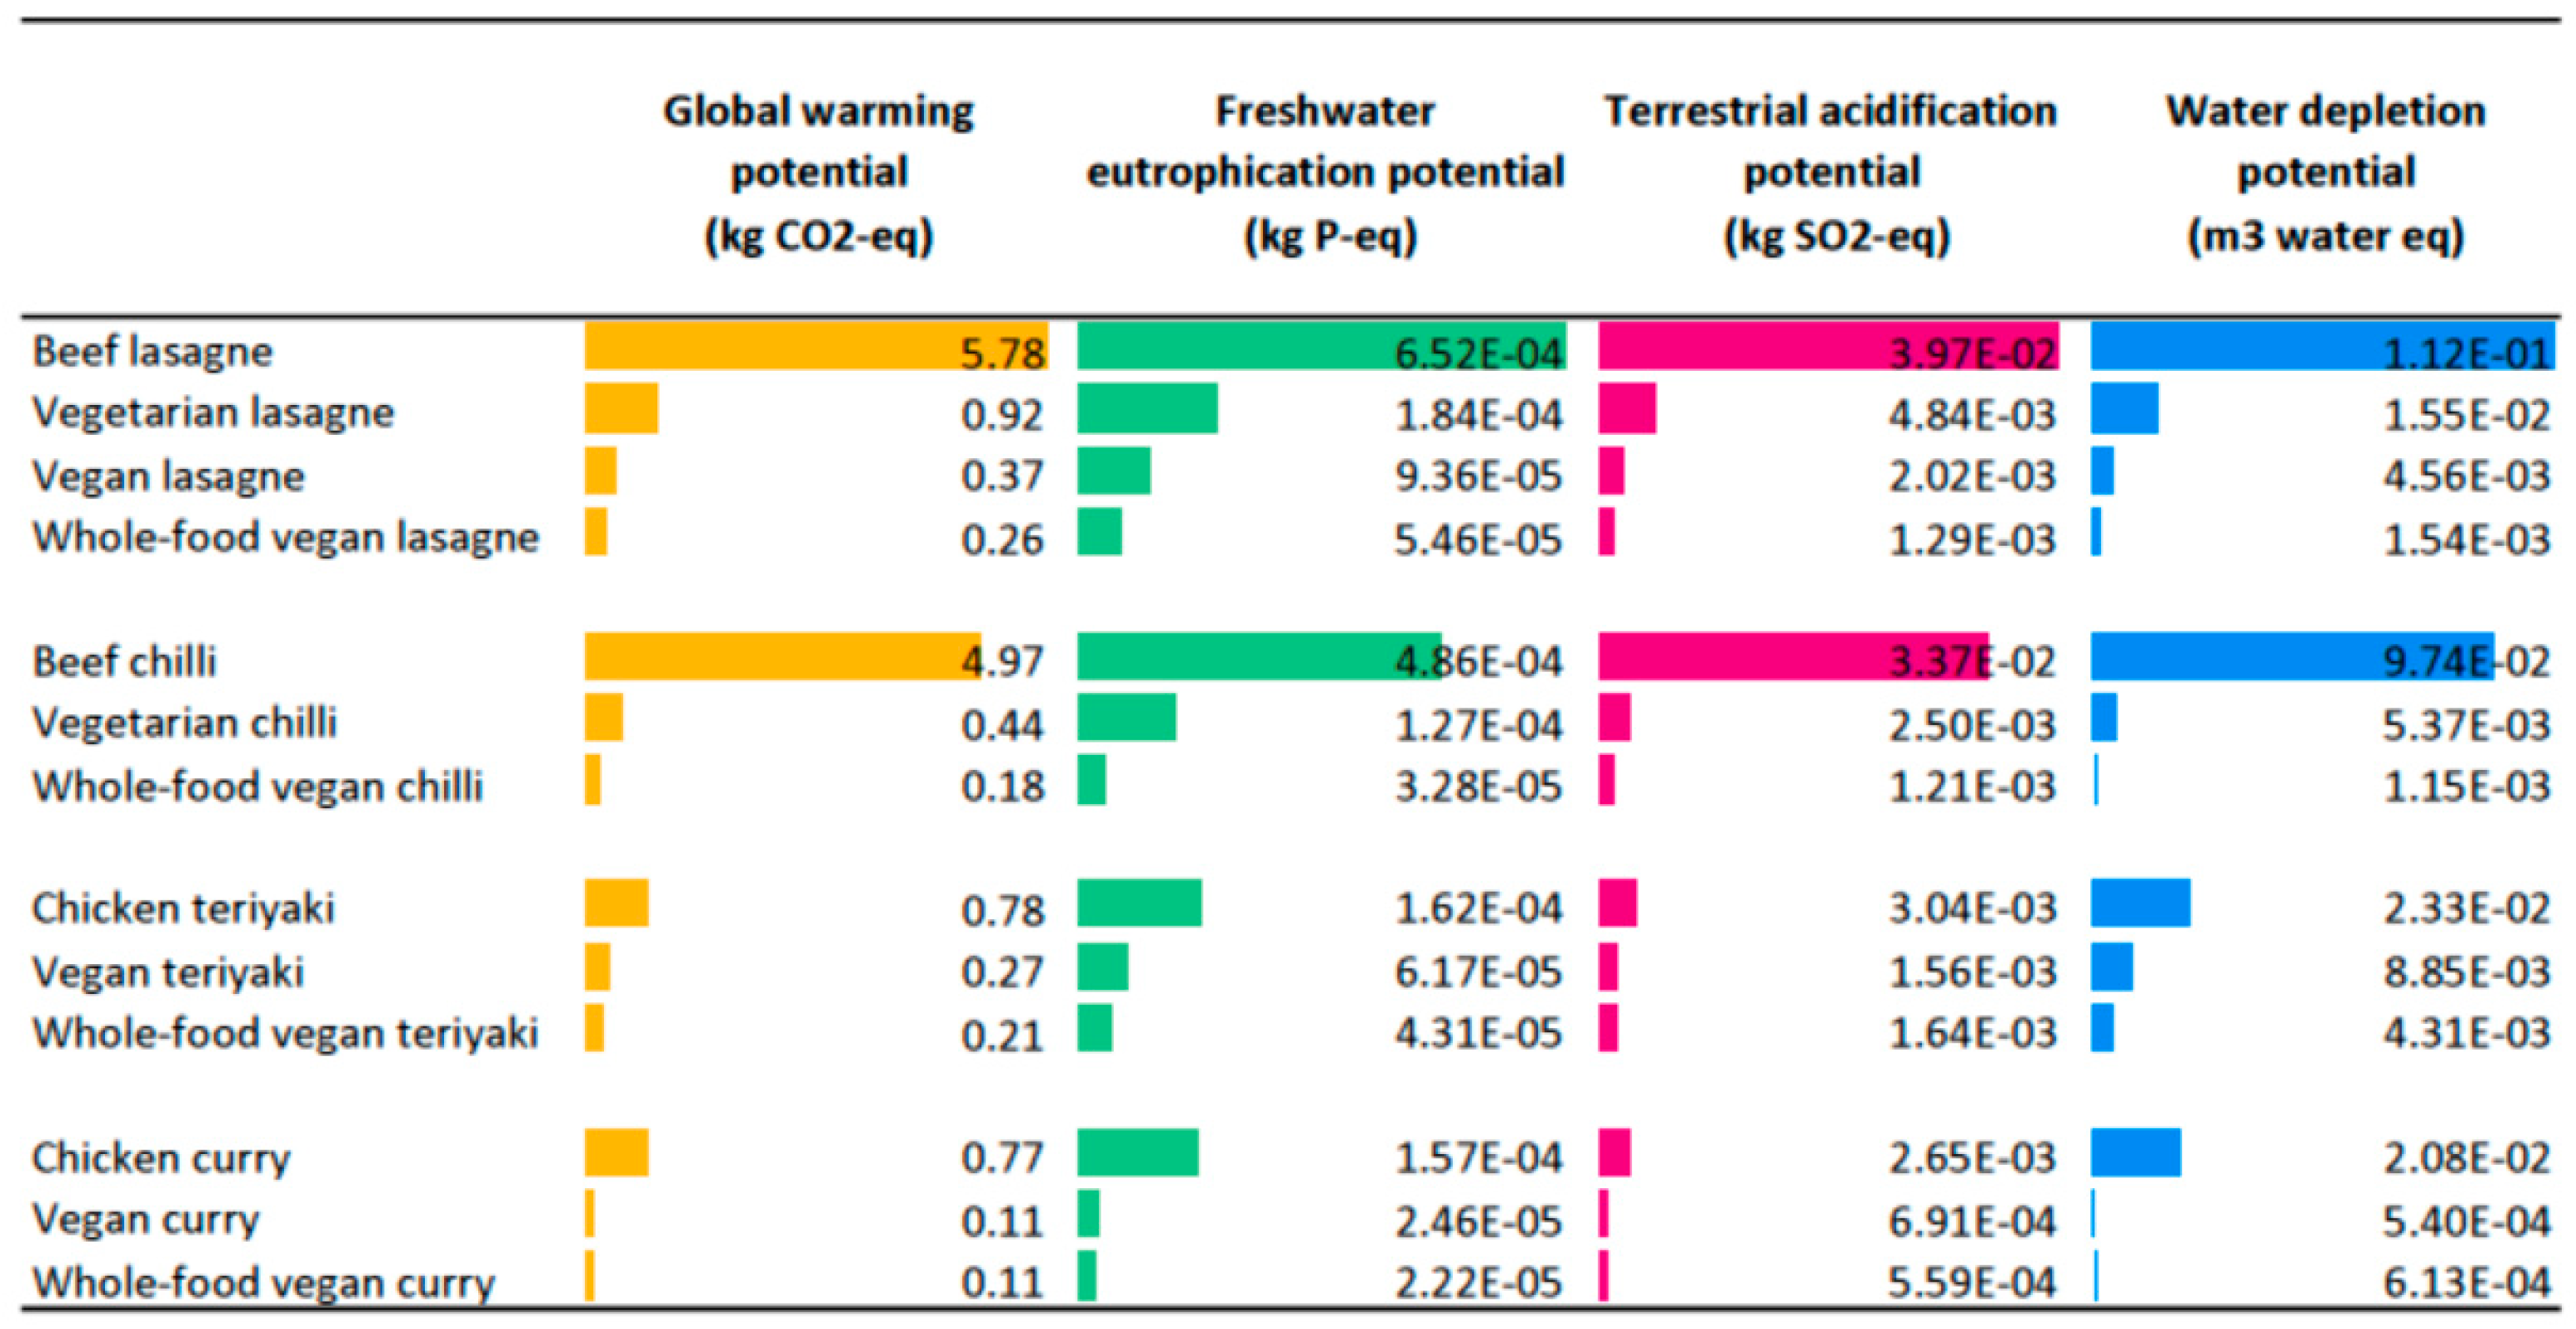
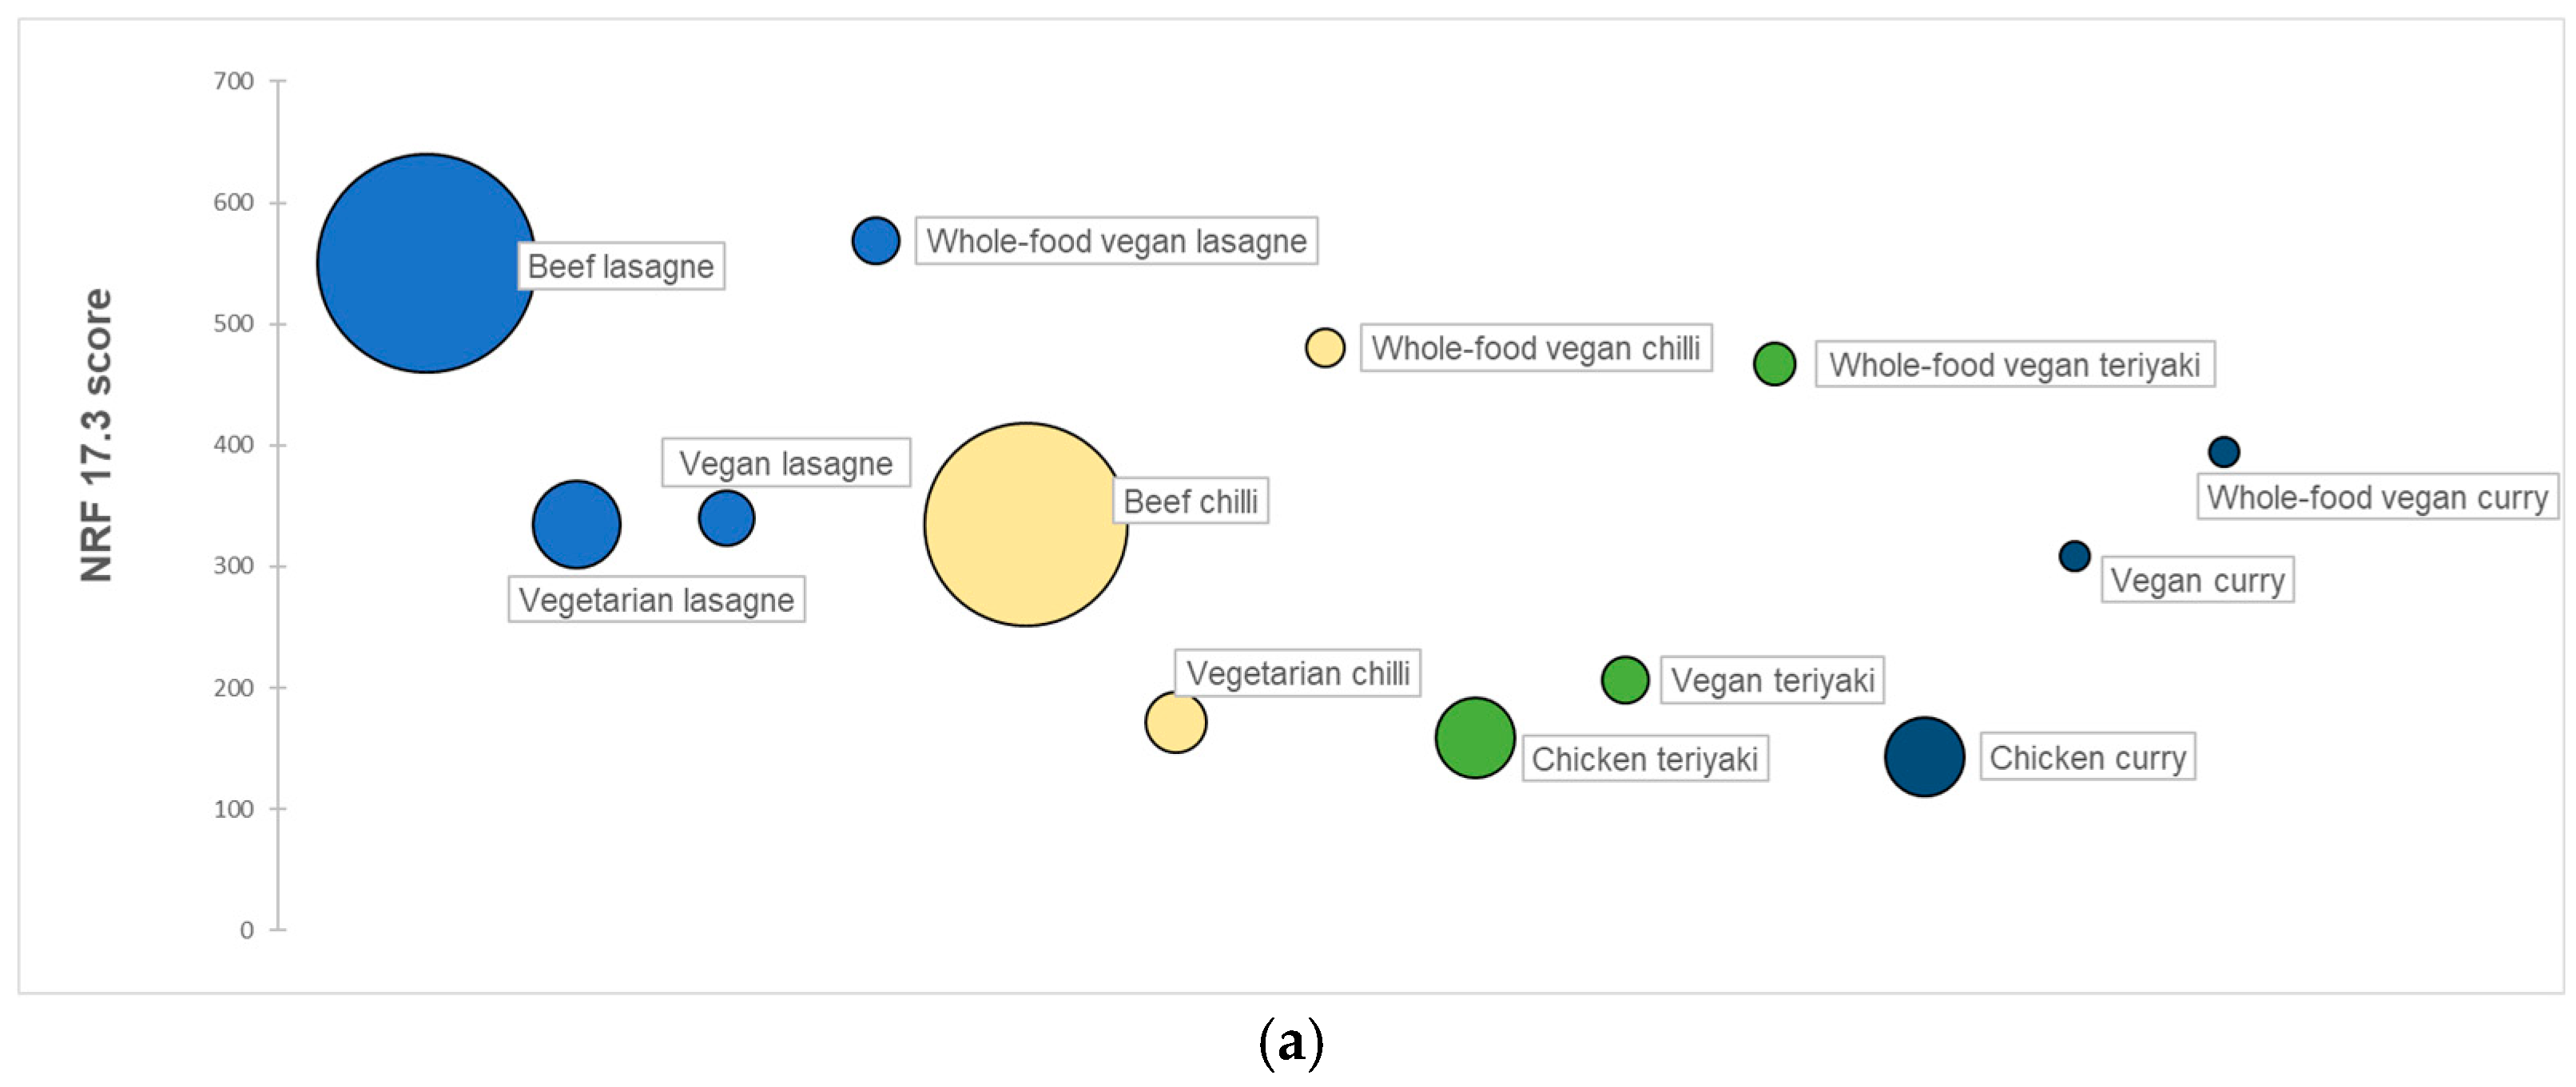
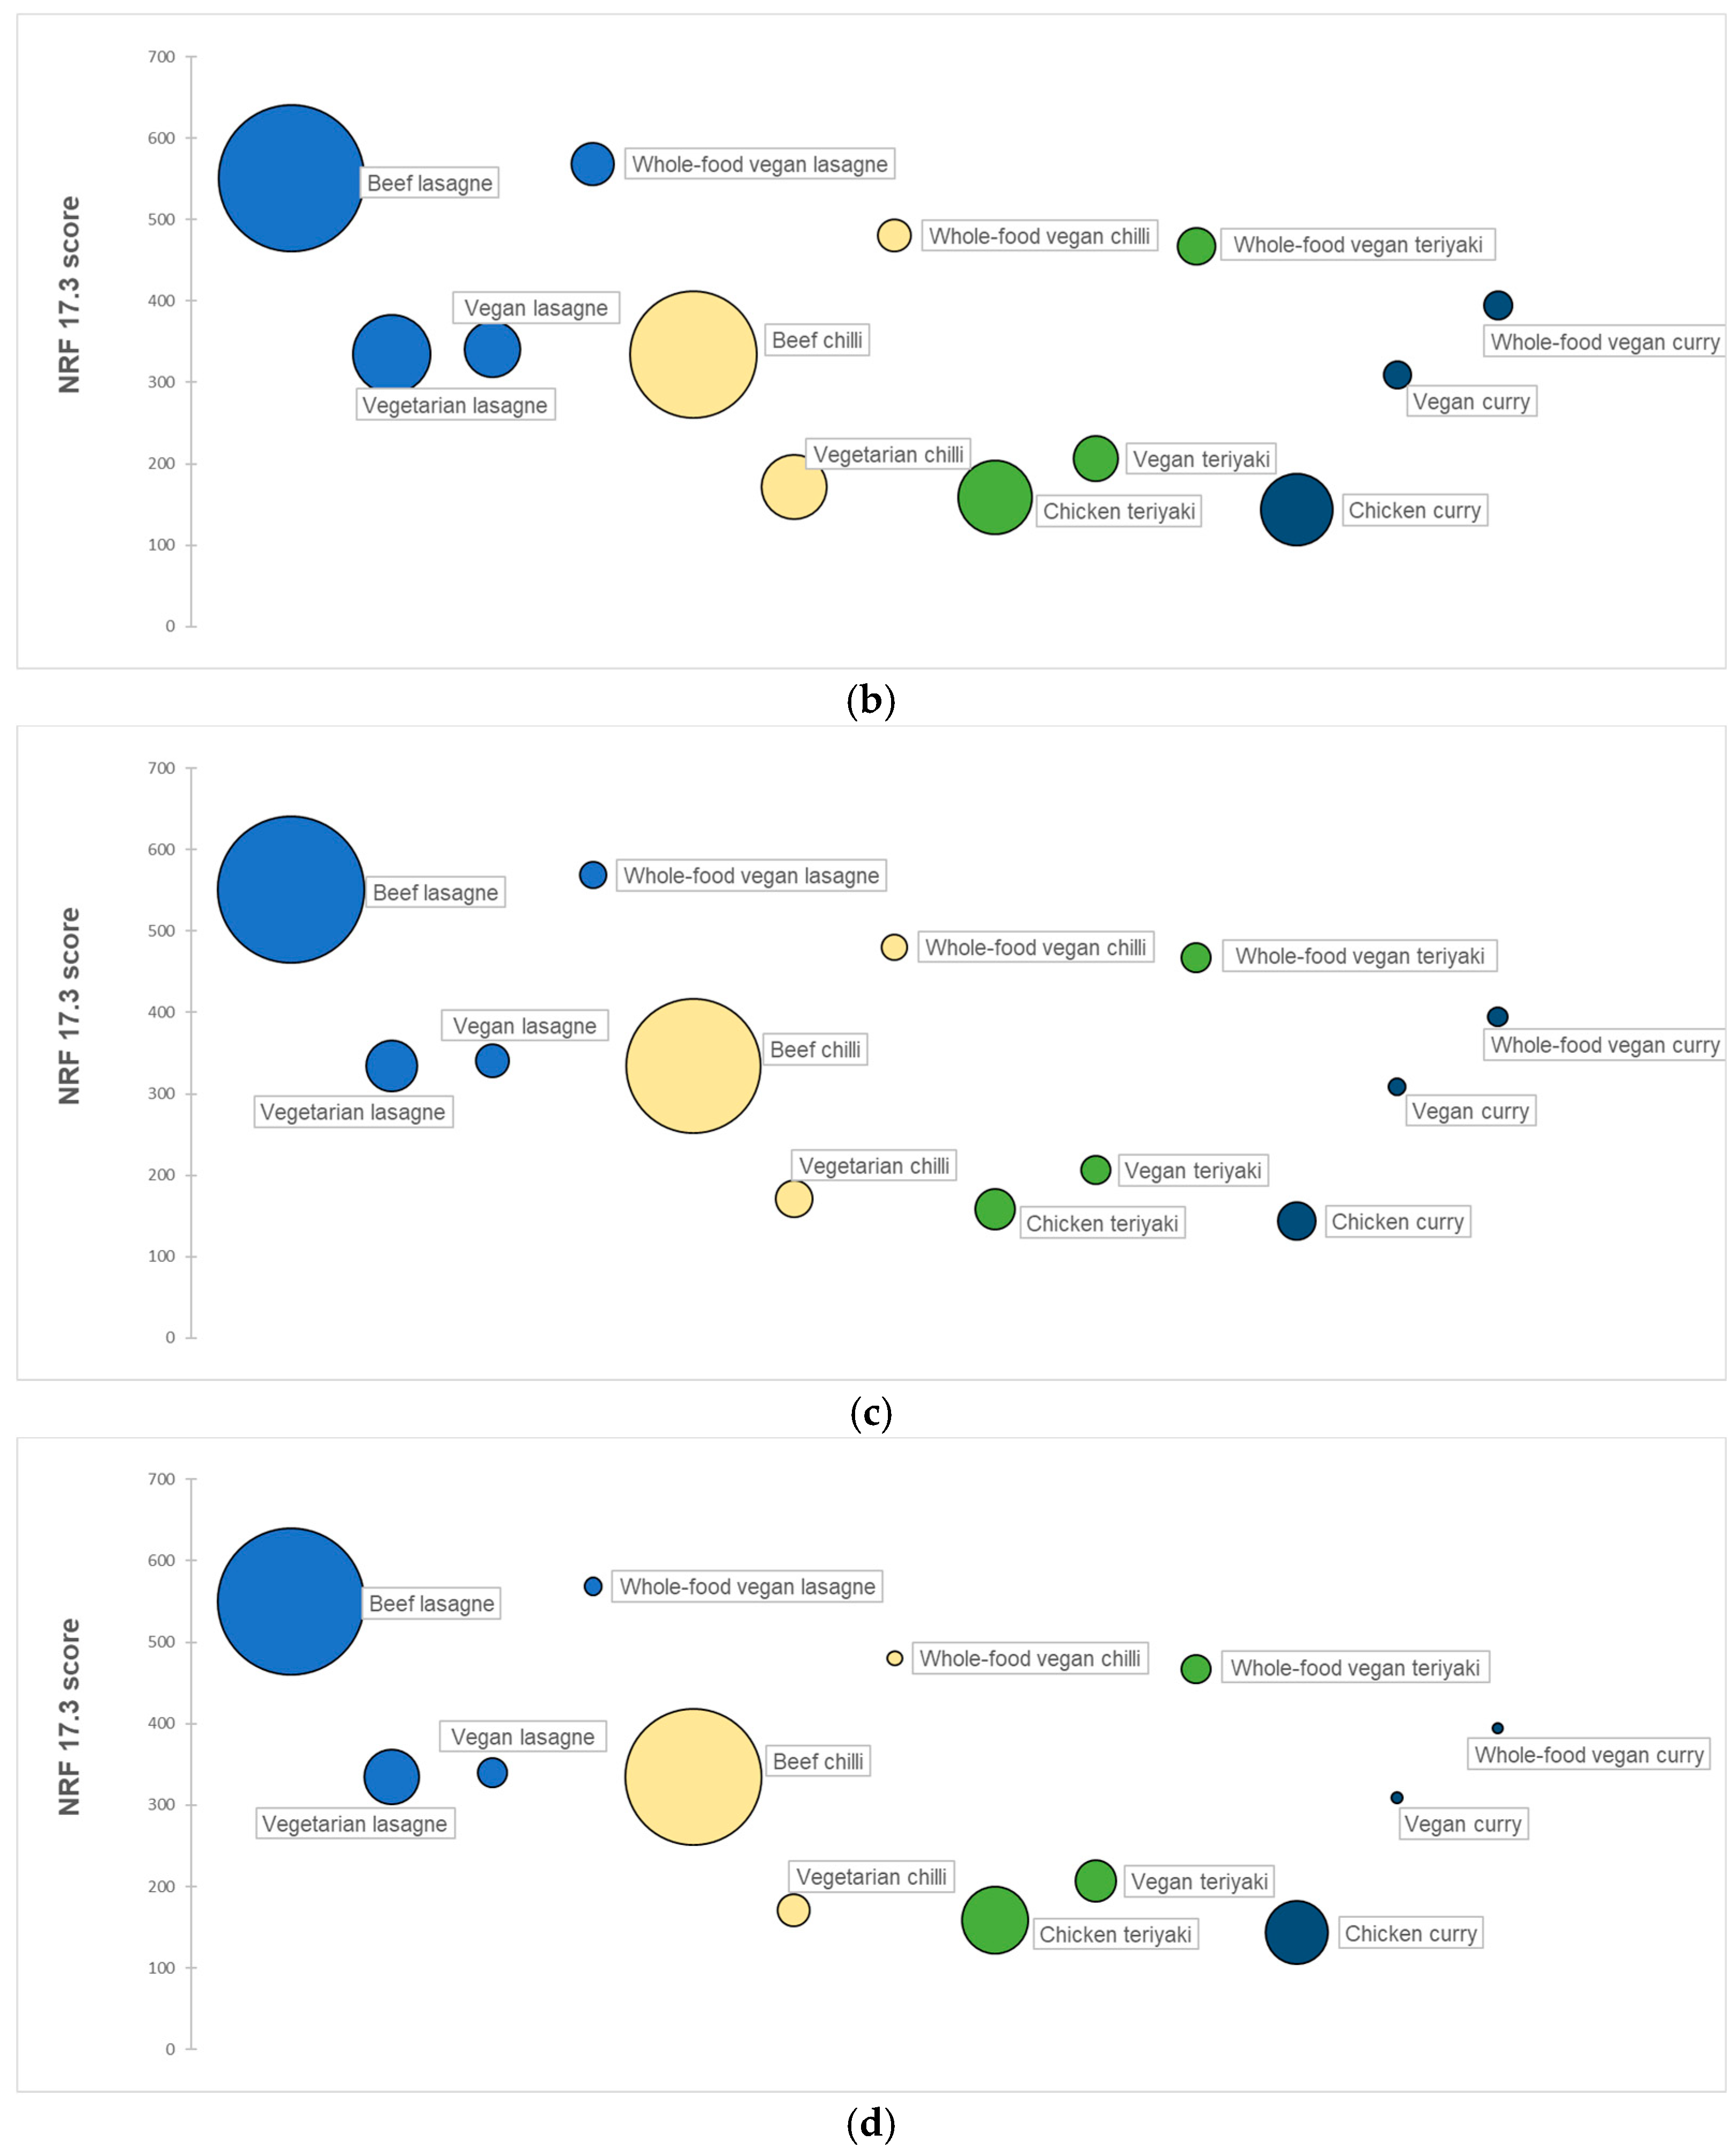
3.2. Environmental Impact
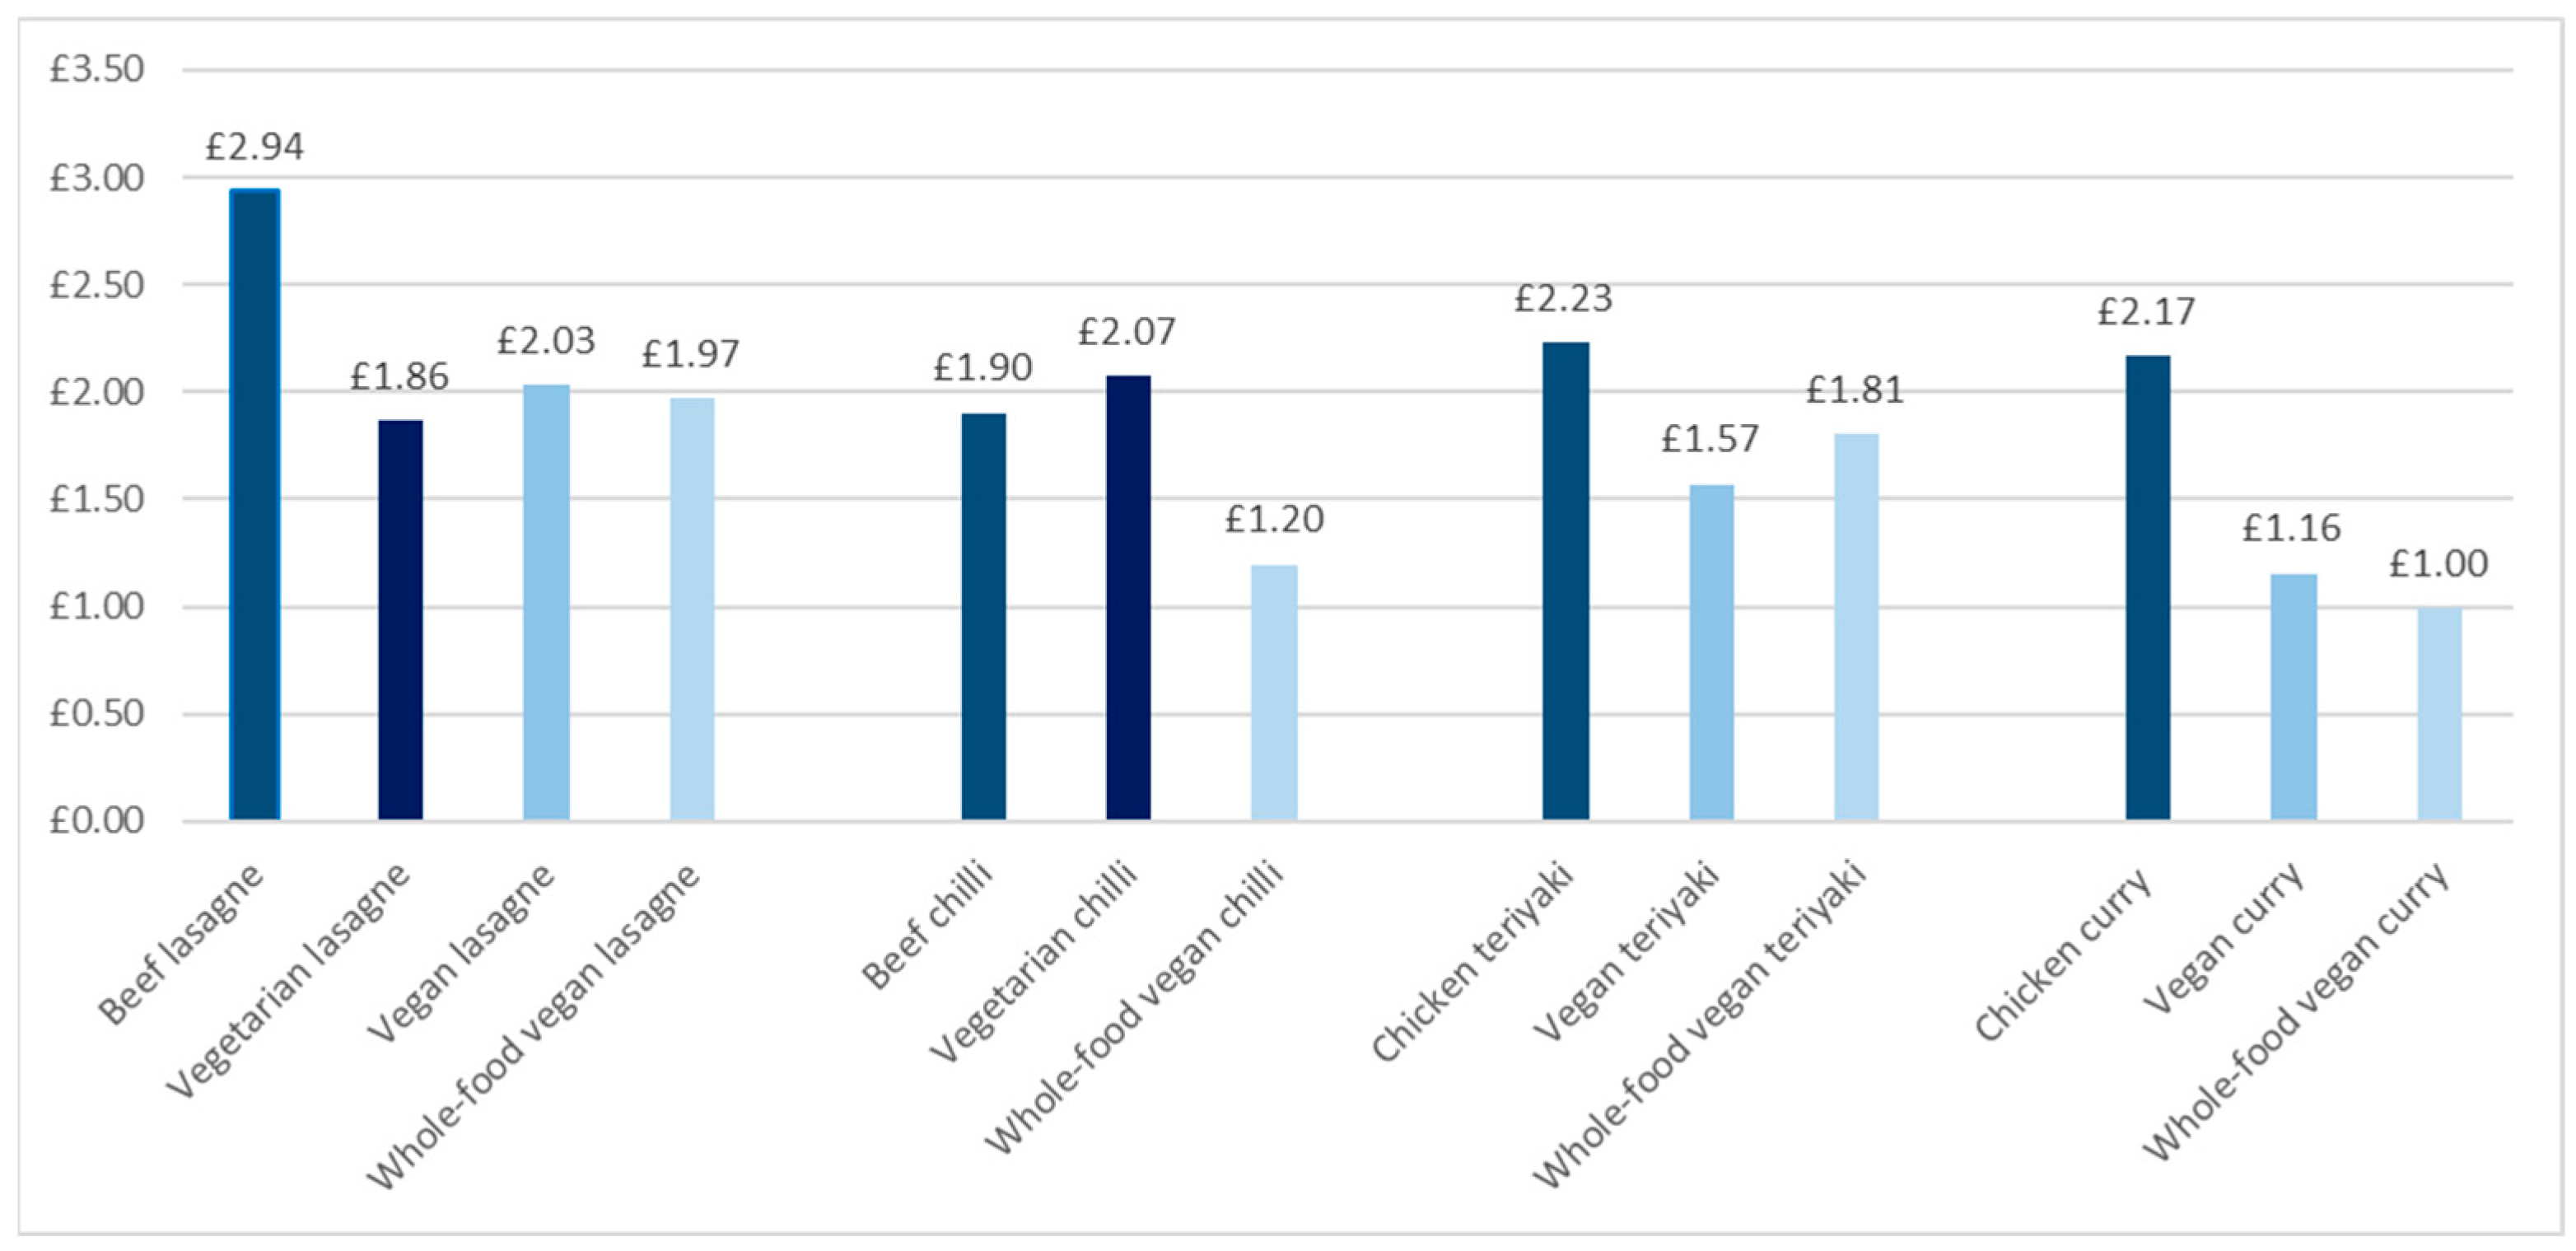
3.3. Recipe Costs
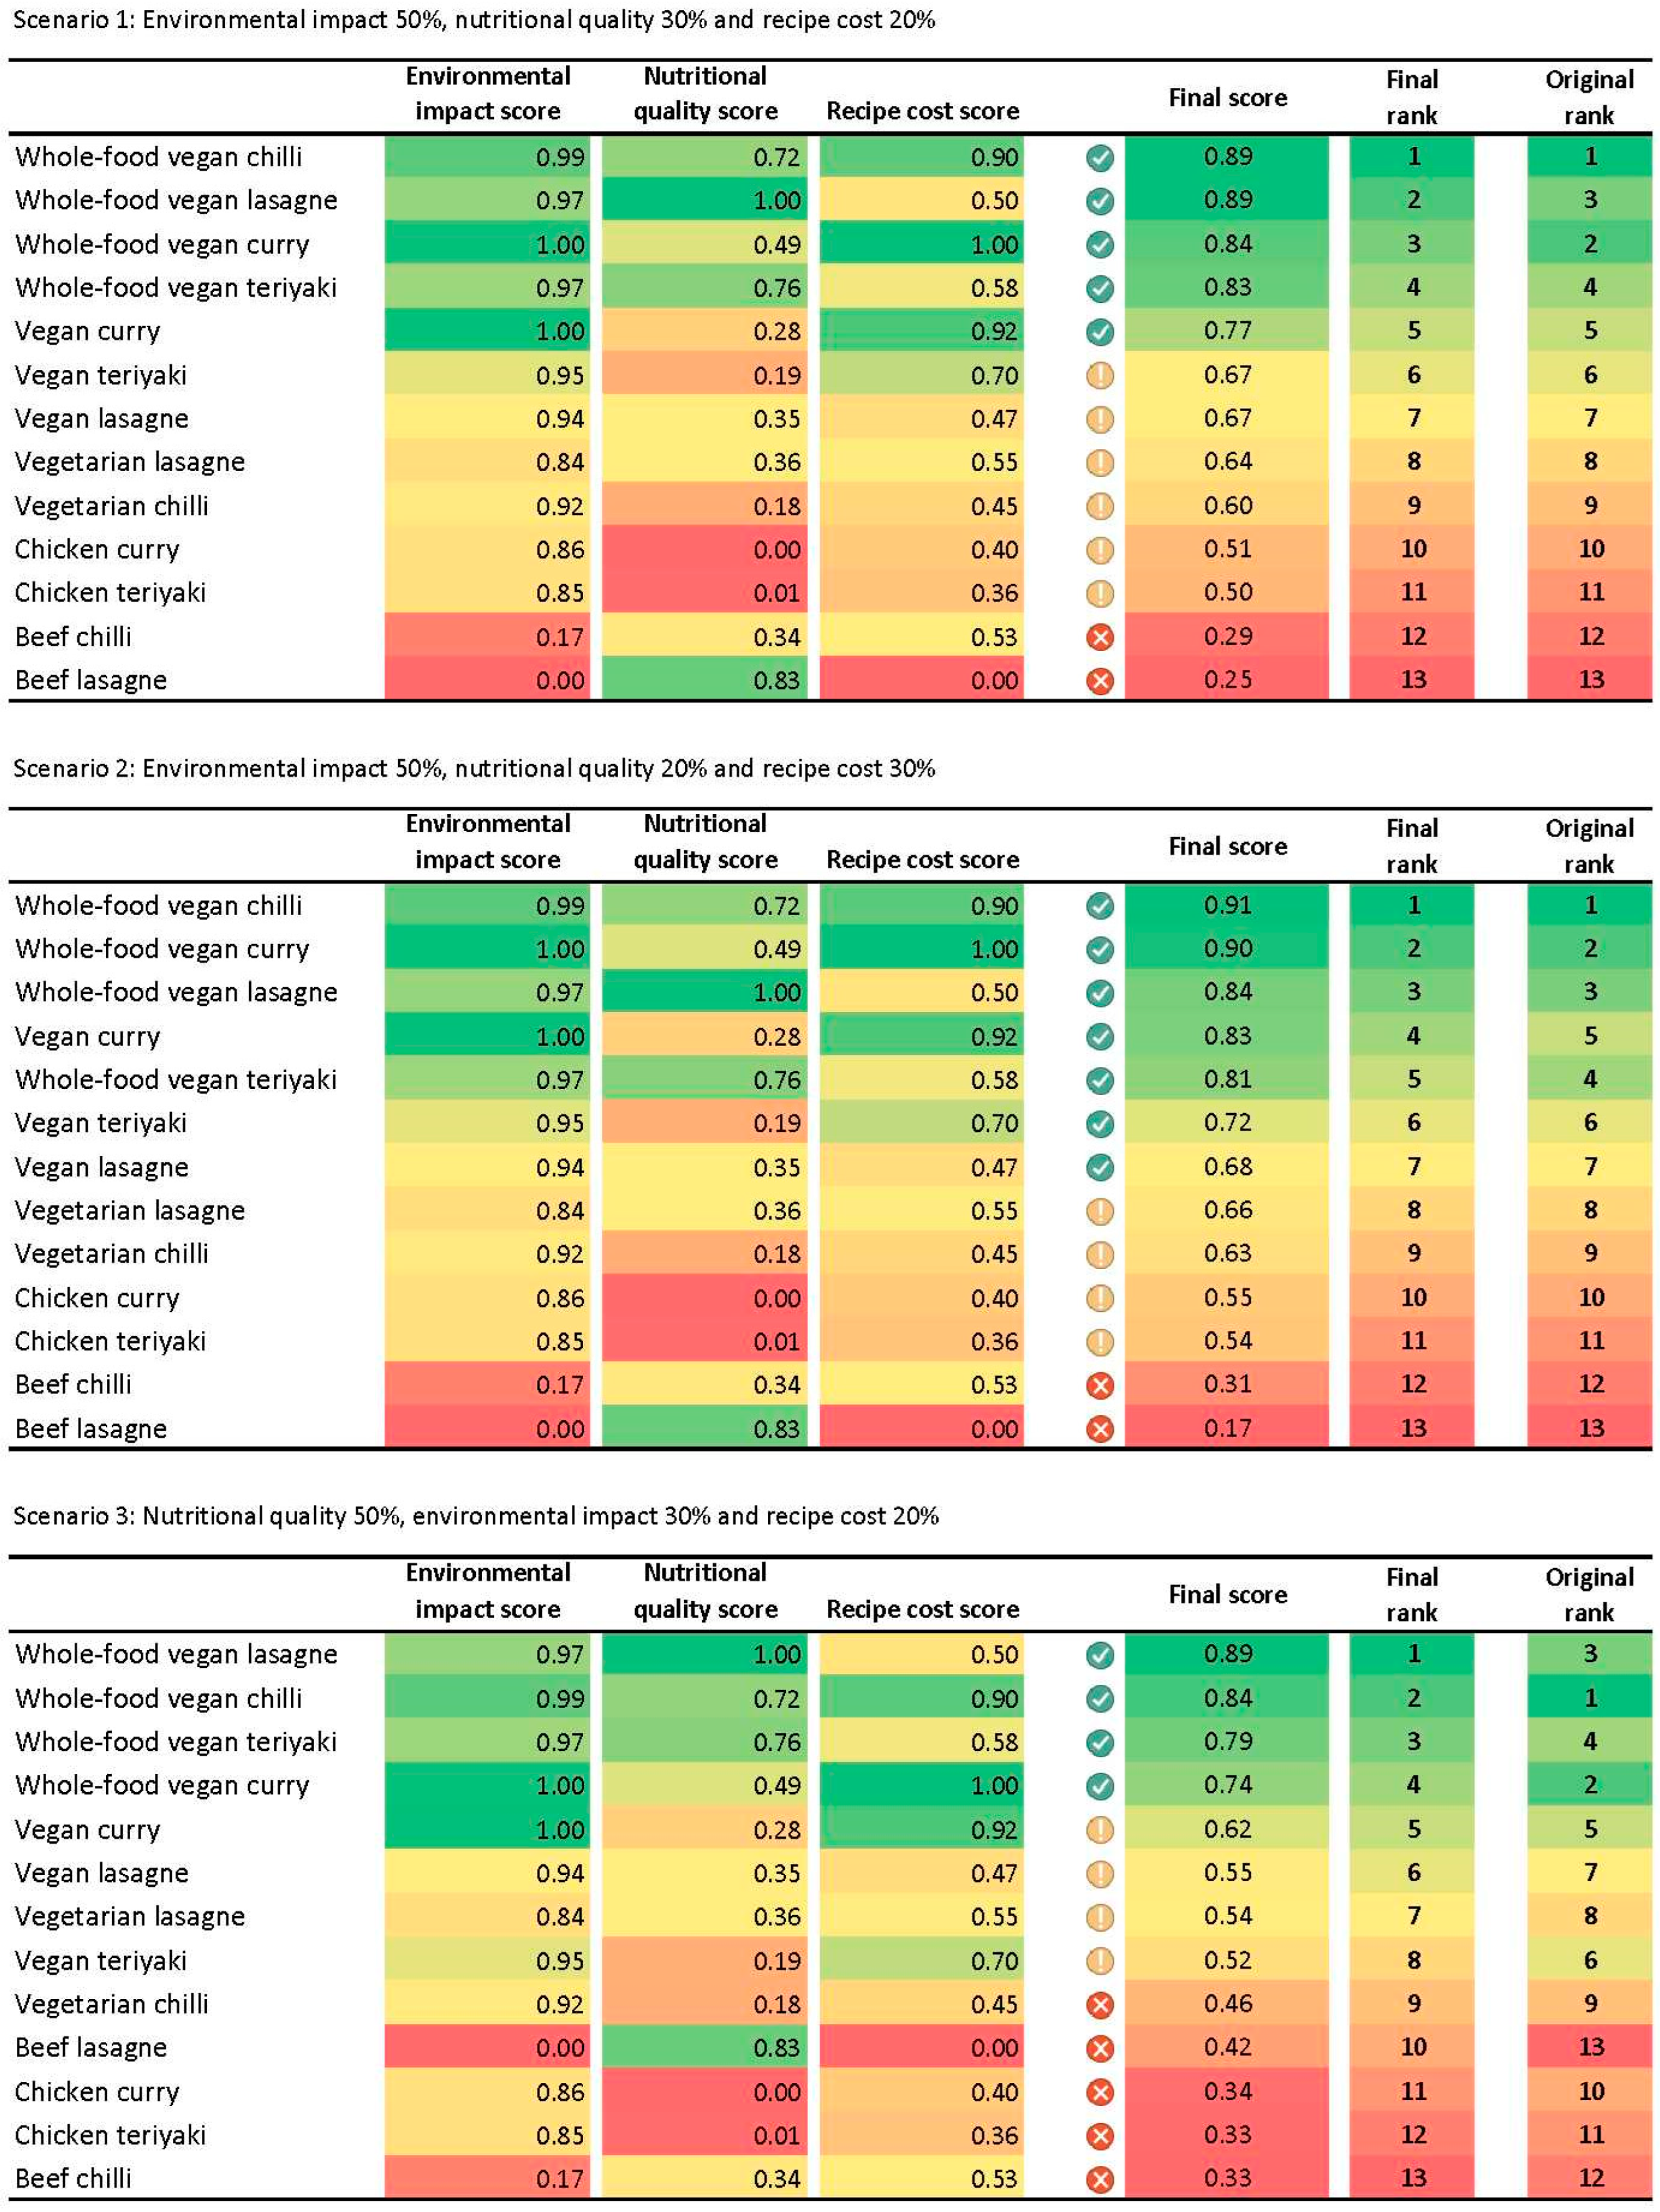
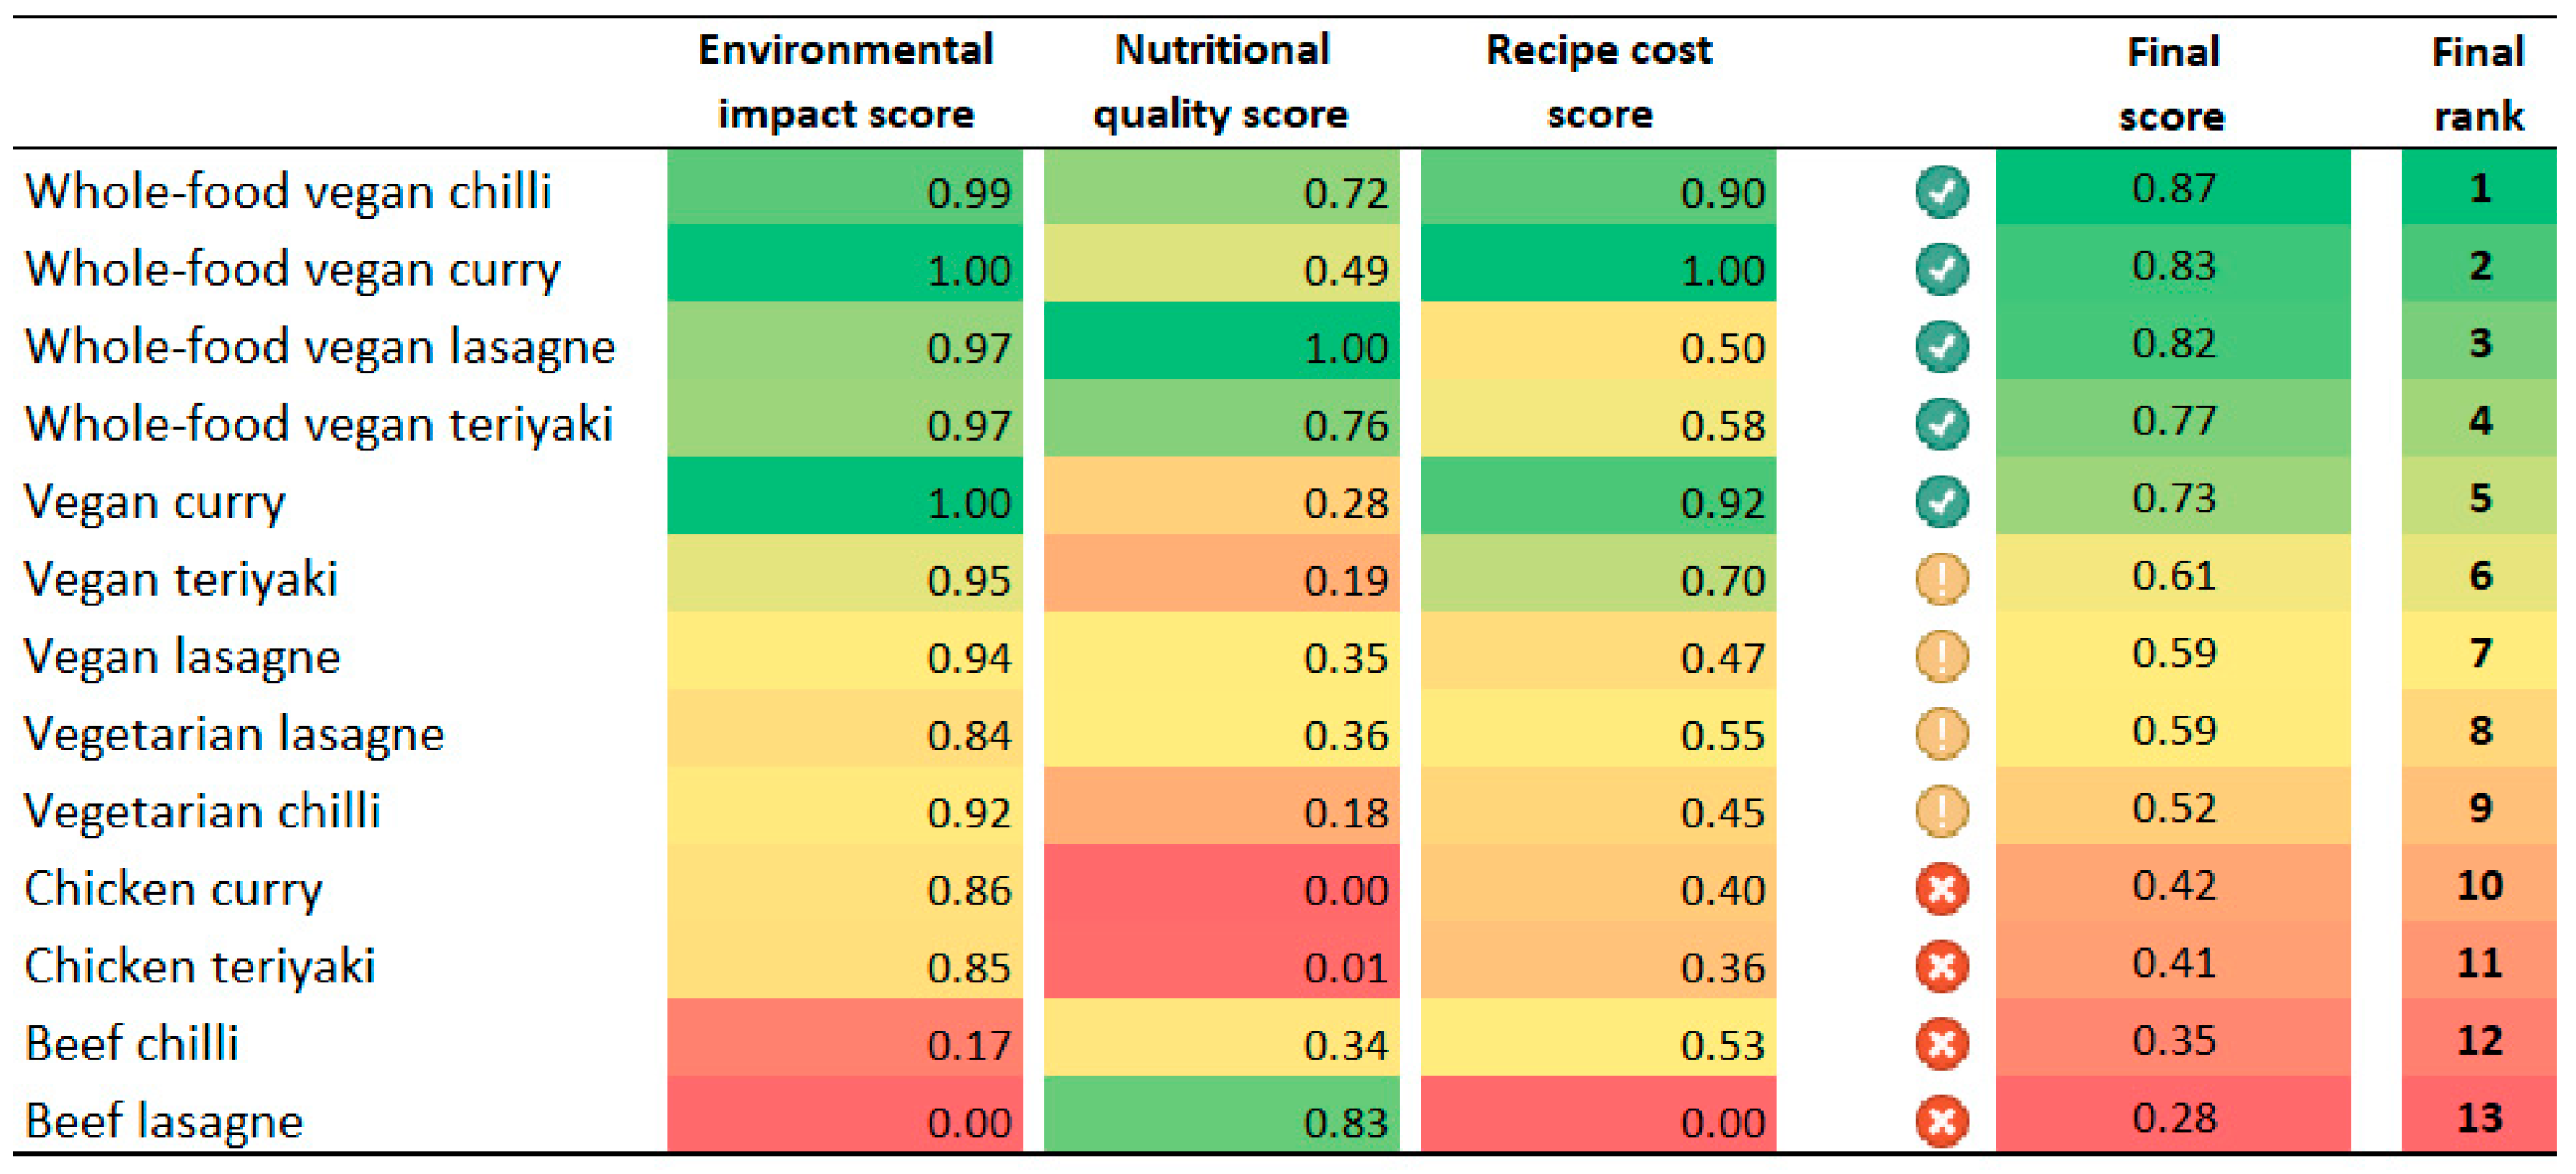
3.4. Integrated Assessment
4. Discussion
4.1. Towards Healthy and Sustainable Meals
4.2. Strengths and Limitations
5. Conclusions
Author Contributions
Funding
Institutional Review Board Statement
Informed Consent Statement
Data Availability Statement
Conflicts of Interest
Appendix A

| Meal | Ingredients | Weight of Recipe (g) Before Cooking | Weight of Recipe (g) After Cooking | Energy Content (kcal) |
|---|---|---|---|---|
| Beef lasagne | Beef mince, semi skimmed milk, chopped tomatoes, lasagne pasta sheets, mozzarella, cheddar cheese, onions, flour, margarine, celery, carrots, Italian style hard cheese, bacon, tomato paste, rapeseed oil, garlic, basil, cooking salt, black pepper, bay leaves. | 504 | 589 | 650 |
| Vegetarian lasagne | Chopped tomatoes, semi skimmed milk, lasagne pasta sheets, Quorn mince, cheddar cheese, onions, spinach, red peppers, green peppers, flour, margarine, garlic, rapeseed oil, tomato paste, cooking salt, bay leaf, black pepper. | 409 | 432 | 490 |
| Vegan lasagne | Chopped tomatoes, soya milk, vegan soya mince, lasagne pasta sheets, spinach, vegan cheese, red peppers, green peppers, margarine, flour, garlic, rapeseed oil, tomato paste, oregano, cooking salt, bay leaf, black pepper. | 411 | 436 | 480 |
| Whole-food vegan lasagne | Chopped tomatoes, cauliflower, lentils, aubergines, courgettes, lasagne pasta sheets, onions, spinach, red peppers, green peppers, carrots, unsweetened soya milk, garlic, sea salt, tomato paste, oregano, black pepper. | 538 | 570 | 330 |
| Beef chilli | Beef mince, chopped tomatoes, onions, kidney beans, tomato paste, garlic, cumin seeds, rapeseed oil, green chillies, chilli powder, beef stock cubes, red pepper hot sauce, black pepper, oregano, bay leaf. | 402 | 331 | 310 |
| Vegetarian chilli | Quorn mince, chopped tomatoes, kidney beans, onions, tomato paste, extra virgin olive oil, garlic, cumin seeds, chilli powder, green chillies, vegetable stock cube, red pepper hot sauce, black pepper. | 359 | 266 | 230 |
| Whole-food vegan chilli | Chopped tomatoes, kidney beans, sweet potatoes, carrots, courgettes, celery, onions, tomato paste, salt, garlic, chilli powder, green chilli peppers, cumin seeds, black pepper. | 462 | 342 | 220 |
| Chicken teriyaki | Diced chicken breast, noodles, teriyaki sauce, coriander, ginger puree. | 253 | 215 | 280 |
| Vegan teriyaki | Tofu, noodles, teriyaki sauce, rapeseed oil, corn flour, coriander, ginger puree. | 243 | 219 | 310 |
| Whole-food vegan teriyaki | Wholemeal noodles, tempeh, sweet potatoes, white cabbage, carrot, green cabbage, broccoli, red pepper, onion, tomatoes, teriyaki sauce, coriander, ginger. | 333 | 300 | 510 |
| Chicken curry | Chicken breast, Thai green concentrated sauce, rapeseed oil, onions, coriander, coconut milk powder. | 273 | 232 | 240 |
| Vegan curry | Broccoli, onions, aubergines, courgettes, Thai green concentrated sauce, beansprouts, rapeseed oil, garlic. | 366 | 329 | 190 |
| Whole-food vegan curry | Broccoli, onions, aubergines, courgettes, carrots, coconut milk, beansprouts, Thai green curry paste, garlic. | 296 | 266 | 140 |
Appendix B
| Baseline scenario: If all impacts are of equal priority (presented in the paper) |
| Environmental impact 33.3%, nutritional quality 33.3% and recipe cost 33.3% |
| Additional six different weighting scenarios |
| If the main priority is environmental impact: |
| Scenario 1: Environmental impact 50%, nutritional quality 30% and recipe cost 20% |
| Scenario 2: Environmental impact 50%, nutritional quality 20% and recipe cost 30% |
| If the main priority is nutritional quality: |
| Scenario 3: Nutritional quality 50%, environmental impact 30% and recipe cost 20% |
| Scenario 4: Nutritional quality 50%, environmental impact 20% and recipe cost 30% |
| If the main priority is recipe cost: |
| Scenario 5: Recipe cost 50%, nutritional quality 30% and environmental impact 20% |
| Scenario 6: Recipe cost 50%, nutritional quality 20% and environmental impact 30% |

Appendix C
| NRF 9.3 per Meal | NRF 17.3 per Meal | |
|---|---|---|
| Lasagne recipes | ||
| Meat-based | 251 | 550 |
| Vegetarian | 202 | 335 |
| Vegan | 236 | 340 |
| Whole-food vegan | 340 | 569 |
| Chilli recipes | ||
| Meat-based | 114 | 334 |
| Vegetarian | 143 | 171 |
| Whole-food vegan | 360 | 480 |
| Teriyaki recipes | ||
| Meat-based | 80 | 159 |
| Vegan | 140 | 207 |
| Whole-food vegan | 251 | 467 |
| Curry recipes | ||
| Meat-based | 60 | 143 |
| Vegan | 202 | 309 |
| Whole-food vegan | 300 | 394 |
| Lasagne | Chilli | Teriyaki | Curry | RNI | |||||||||||
|---|---|---|---|---|---|---|---|---|---|---|---|---|---|---|---|
| Beef | Vegetarian | Vegan | Whole-food vegan | Beef | Vegetarian | Whole-food vegan | Chicken | Vegan | Whole-food vegan | Chicken | Vegan | Whole-food vegan | |||
| Serving size | g | 589 | 432 | 436 | 570 | 331 | 266 | 342 | 215 | 219 | 300 | 232 | 329 | 266 | n/a |
| Energy | kcal | 650 | 490 | 480 | 330 | 310 | 230 | 220 | 280 | 310 | 510 | 240 | 190 | 140 | 2000 |
| Carbohydrate | g | 63 | 63 | 69 | 68 | 18 | 33 | 55 | 36 | 42 | 92 | 14 | 27 | 22 | n/a |
| Fat | g | 24 | 19 | 17 | 4 | 16 | 7 | 2 | 1 | 11 | 9 | 6 | 9 | 7 | n/a |
| Protein | g | 49 | 25 | 23 | 19 | 28 | 24 | 12 | 33 | 13 | 27 | 35 | 7 | 6 | 50 |
| Fibre | g | 4 | 8 | 9 | 14 | 5 | 16 | 16 | 2 | 2 | 12 | 2 | 8 | 8 | 30 |
| Monounsaturated Fat | g | 4.7 | 3.9 | 2.8 | 0.2196 | 6.9 | 2.7 | 0.2491 | 0.4108 | 4.6 | 1.1 | 0.6057 | 2.1 | 0.4842 | 36 |
| Free sugars | g | 1 | 0 | 0 | 0 | 1 | 1 | 0 | 0 | 0 | 0 | 0 | 0 | 0 | 30 |
| Saturated fat | g | 11 | 8 | 6 | 0.5 | 7 | 1.5 | 0 | 0 | 1 | 2.5 | 4 | 4 | 4.5 | 20 |
| Sodium | mg | 550 | 430 | 500 | 580 | 270 | 290 | 160 | 480 | 430 | 1020 | 620 | 590 | 200 | 1600 |
| Potassium | mg | 650 | 360 | 230 | 950 | 440 | 230 | 1070 | 430 | 150 | 610 | 370 | 650 | 600 | 3500 |
| Calcium | mg | 420 | 170 | 170 | 120 | 70 | 50 | 150 | 0 | 350 | 70 | 30 | 80 | 80 | 700 |
| Magnesium | mg | 45 | 27.2 | 17.1 | 88 | 38.6 | 20.5 | 68 | 34.5 | 36.7 | 104 | 40 | 44 | 42 | 300 |
| Iron | mg | 2.9 | 1.1 | 1.1 | 5.3 | 4.1 | 2.5 | 3.8 | 0.9 | 5.7 | 3.4 | 0.7 | 2 | 1.7 | 14.8 |
| Vitamin A (Total RE) | μg | 326 | 241 | 280 | 441 | 49 | 65 | 700 | 13.5 | 17 | 370 | 13.7 | 120 | 700 | 700 |
| Vitamin E | mg | 2.2 | 0.9244 | 2.3 | 0.8539 | 0.7163 | 0.5004 | 0.8941 | 0.167 | 1.1 | 0.8194 | 0.2138 | 1.7 | 1.7 | 4 |
| Vitamin C | mg | 6.9 | 33.4 | 32.1 | 40 | 3.4 | 4.4 | 28 | 0.54 | 1.8 | 30.1 | 0.9169 | 40 | 40 | 40 |
| Vitamin D | μg | 1.4 | 0 | 1.4 | 0 | 0.6 | 0 | 0 | 0 | 0 | 0 | 0 | 0 | 0 | 10 |
| Thiamin (B1) | mg | 0.242 | 0.1075 | 0.0852 | 0.4549 | 0.188 | 0.1057 | 0.486 | 0.1829 | 0.136 | 0.8666 | 0.1532 | 0.2513 | 0.2436 | 1 |
| Riboflavin (B2) | mg | 0.4524 | 0.2436 | 0.227 | 0.1599 | 0.1817 | 0.0383 | 0.108 | 0.186 | 0.0682 | 0.1162 | 0.2116 | 0.1221 | 0.1179 | 1.3 |
| Folates (B9) Total | μg | 25.9 | 29.9 | 23.7 | 96 | 18.8 | 4.9 | 46 | 13.6 | 17.9 | 51 | 12.2 | 93 | 64 | 200 |
| Vitamin B12 (Cobalamin) | μg | 1.5 | 0.7866 | 0.8246 | 0.0288 | 1.4 | 0 | 0 | 0.0008 | 0 | 0 | 0.0007 | 0 | 0 | 1.5 |
| Iodine (I) | μg | 49 | 29.3 | 1.7 | 2.9 | 11.6 | 0.6901 | 1.9 | 7.2 | 0.0001 | 2.9 | 9 | 3.4 | 3.4 | 140 |
| Copper (Cu) | mg | 0.1652 | 0.0651 | 0.0644 | 0.4861 | 0.1085 | 0.1022 | 0.1714 | 0.0614 | 0.204 | 0.5321 | 0.0762 | 0.1348 | 0.1727 | 1.2 |
| Zinc (Zn) | mg | 6.1 | 0.7021 | 0.3341 | 2.4 | 5.1 | 0.3195 | 1.3 | 0.946 | 0.9261 | 2.8 | 0.9558 | 0.937 | 0.902 | 9.5 |
| Selenium (Se) | μg | 11.1 | 1.6 | 0.6318 | 40 | 10.4 | 0.2813 | 8.4 | 14.4 | 8.9 | 14.1 | 16.8 | 2.1 | 1.8 | 75 |
References
- Crippa, M.; Solazzo, E.; Guizzardi, D.; Monforti-Ferrario, F.; Tubiello, F.N.; Leip, A. Food Systems Are Responsible for a Third of Global Anthropogenic GHG Emissions. Nat. Food 2021, 2, 198–209. [Google Scholar] [CrossRef]
- Benton, T.; Bieg, C.; Harwatt, H.; Pudassaini, R.; Wellesley, L. Food System Impacts on Biodiversity Loss Three Levers for Food System Transformation in Support of Nature; Chatham House: London, UK, 2021. [Google Scholar]
- Crenna, E.; Sinkko, T.; Sala, S. Biodiversity Impacts Due to Food Consumption in Europe. J. Clean. Prod. 2019, 227, 378–391. [Google Scholar] [CrossRef] [PubMed]
- Poore, J.; Nemecek, T. Reducing Food’s Environmental Impacts Through Producers and Consumers. Science 2018, 360, 987–992. [Google Scholar] [CrossRef] [PubMed]
- World Health Organisation (WHO). Noncommunicable Diseases. Available online: https://www.who.int/news-room/fact-sheets/detail/noncommunicable-diseases (accessed on 20 March 2025).
- Gombart, A.F.; Pierre, A.; Maggini, S. A Review of Micronutrients and the Immune System—Working in Harmony to Reduce the Risk of Infection. Nutrients 2020, 12, 236. [Google Scholar] [CrossRef]
- Maggini, S.; Pierre, A.; Calder, P.C. Immune Function and Micronutrient Requirements Change over the Life Course. Nutrients 2018, 10, 1531. [Google Scholar] [CrossRef]
- Willett, W.; Rockström, J.; Loken, B.; Springmann, M.; Lang, T.; Vermeulen, S.; Garnett, T.; Tilman, D.; Declerck, F.; Wood, A. Food in the Anthropocene: The EAT—Lancet Commission on Healthy Diets from Sustainable Food Systems. Lancet 2019, 393, 447–492. [Google Scholar] [CrossRef] [PubMed]
- Miller, B.D.D.; Welch, R.M. Food System Strategies for Preventing Micronutrient Malnutrition. Food Policy 2013, 42, 115–128. [Google Scholar] [CrossRef]
- Aleksandrowicz, L.; Green, R.; Joy, E.J.M.; Smith, P.; Haines, A. The Impacts of Dietary Change on Greenhouse Gas Emissions, Land Use, Water Use, and Health: A Systematic Review. PLoS ONE 2016, 11, e0165797. [Google Scholar] [CrossRef]
- Castañé, S.; Antón, A. Assessment of the Nutritional Quality and Environmental Impact of Two Food Diets: A Mediterranean and a Vegan Diet. J. Clean. Prod. 2017, 167, 929–937. [Google Scholar] [CrossRef]
- González-García, S.; Esteve-Llorens, X.; Moreira, M.T.; Feijoo, G. Carbon Footprint and Nutritional Quality of Different Human Dietary Choices. Sci. Total Environ. 2018, 644, 77–94. [Google Scholar] [CrossRef]
- Hallström, E.; Carlsson-Kanyama, A.; Börjesson, P. Environmental Impact of Dietary Change: A Systematic Review. J. Clean. Prod. 2015, 91, 1–11. [Google Scholar] [CrossRef]
- Scarborough, P.; Appleby, P.N.; Mizdrak, A.; Briggs, A.D.M.; Travis, R.C.; Bradbury, K.E.; Key, T.J. Dietary Greenhouse Gas Emissions of Meat-Eaters, Fish-Eaters, Vegetarians and Vegans in the UK. Clim. Change 2014, 125, 179–192. [Google Scholar] [CrossRef]
- Takacs, B.; Stegemann, J.A.; Kalea, A.Z.; Borrion, A. Comparison of Environmental Impacts of Individual Meals—Does It Really Make a Difference to Choose Plant-Based Meals Instead of Meat-Based Ones? J. Clean. Prod. 2022, 379, 134782. [Google Scholar] [CrossRef]
- Alexy, U.; Fischer, M.; Weder, S.; Längler, A.; Michalsen, A.; Sputtek, A.; Keller, M. Nutrient Intake and Status of German Children and Adolescents Consuming Vegetarian, Vegan or Omnivore Diets: Results of the VeChi Youth Study. Nutrients 2021, 13, 1707. [Google Scholar] [CrossRef] [PubMed]
- Schüpbach, R.; Wegmüller, R.; Berguerand, C.; Bui, M.; Herter-Aeberli, I. Micronutrient Status and Intake in Omnivores, Vegetarians and Vegans in Switzerland. Eur. J. Nutr. 2017, 56, 283–293. [Google Scholar] [CrossRef]
- Li, D.; Sinclair, A.J.; Mann, N.J.; Turner, A.; Ball, M.J. Selected Micronutrient Intake and Status in Men with Differing Meat Intakes, Vegetarians and Vegans. Asia Pac. J. Clin. Nutr. 2000, 9, 18–23. [Google Scholar] [CrossRef]
- Fresán, U.; Sabaté, J. Vegetarian Diets: Planetary Health and Its Alignment with Human Health. Adv. Nutr. 2019, 10, S380–S388. [Google Scholar] [CrossRef]
- Neufingerl, N.; Eilander, A. Nutrient Intake and Status in Adults Consuming Plant-Based Diets Compared to Meat-Eaters: A Systematic Review. Nutrients 2022, 14, 29. [Google Scholar] [CrossRef]
- Carey, C.N.; Paquette, M.; Sahye-Pudaruth, S.; Dadvar, A.; Dinh, D.; Khodabandehlou, K.; Liang, F.; Mishra, E.; Sidhu, M.; Brown, R.; et al. The Environmental Sustainability of Plant-Based Dietary Patterns: A Scoping Review. J. Nutr. 2023, 153, 857–869. [Google Scholar] [CrossRef]
- Menzel, J.; Jabakhanji, A.; Biemann, R.; Mai, K.; Abraham, K.; Weikert, C. Systematic Review and Meta-Analysis of the Associations of Vegan and Vegetarian Diets with Inflammatory Biomarkers. Sci. Rep. 2020, 10, 21736. [Google Scholar] [CrossRef]
- Aune, D.; Giovannucci, E.; Boffetta, P.; Fadnes, L.T.; Keum, N.N.; Norat, T.; Greenwood, D.C.; Riboli, E.; Vatten, L.J.; Tonstad, S. Fruit and Vegetable Intake and the Risk of Cardiovascular Disease, Total Cancer and All-Cause Mortality—A Systematic Review and Dose-Response Meta-Analysis of Prospective Studies. Int. J. Epidemiol. 2017, 46, 1029–1056. [Google Scholar] [CrossRef]
- Keaver, L.; Ruan, M.; Chen, F.; Du, M.; DIng, C.; Wang, J.; Shan, Z.; Liu, J.; Zhang, F.F. Plant- and Animal-Based Diet Quality and Mortality Among US Adults: A Cohort Study. Br. J. Nutr. 2021, 125, 1405–1415. [Google Scholar] [CrossRef] [PubMed]
- Liang, J.; Wen, Y.; Yin, J.; Zhu, G.; Wang, T. Utilization of Plant-Based Foods for Effective Prevention of Chronic Diseases: A Longitudinal Cohort Study. NPJ Sci. Food 2024, 8, 113. [Google Scholar] [CrossRef] [PubMed]
- Craig, W.J.; Mangels, A.R.; Fresán, U.; Marsh, K.; Miles, F.L.; Saunders, A.V.; Haddad, E.H.; Heskey, C.E.; Johnston, P.; Larson-meyer, E.; et al. The Safe and Effective Use of Plant-Based Diets with Guidelines for Health Professionals. Nutrients 2021, 13, 4144. [Google Scholar] [CrossRef] [PubMed]
- PHE NDNS: Results from Years 9 to 11 (Combined)—Statistical Summary Published 11 December 2020. Available online: https://www.gov.uk/government/statistics/ndns-results-from-years-9-to-11-2016-to-2017-and-2018-to-2019/ndns-results-from-years-9-to-11-combined-statistical-summary (accessed on 20 March 2025).
- Derbyshire, E. Micronutrient Intakes of British Adults Across Mid-Life: A Secondary Analysis of the UK National Diet and Nutrition Survey. Front. Nutr. 2018, 5, 55. [Google Scholar] [CrossRef]
- Aidoo, R.; Romana, C.K.; Kwofie, E.M.; Baum, J.I. An Integrated Environmental Nutrition Model for Dietary Sustainability Assessment. J. Clean. Prod. 2023, 399, 136473. [Google Scholar] [CrossRef]
- McLaren, S.; Berardy, A.; Henderson, A.; Holden, N.; Huppertz, T.; Jolliet, O.; De Camillis, C.; Renouf, M.; Rugani, B.; Saarinen, M.; et al. Integration of Environment and Nutrition in Life Cycle Assessment of Food Items: Opportunities and Challenges; FAO: Rome, Italy, 2021; ISBN 9789251355329. [Google Scholar]
- Sirdey, N.; David-Benz, H.; Deshons, A. Methodological Approaches to Assess Food Systems Sustainability: A Literature Review. Glob. Food Secur. 2023, 38, 100696. [Google Scholar] [CrossRef]
- Grigoriadis, V.; Nugent, A.; Brereton, P. Working Towards a Combined Measure for Describing Environmental Impact and Nutritive Value of Foods: A Review. Trends Food Sci. Technol. 2021, 112, 298–311. [Google Scholar] [CrossRef]
- Takacs, B.; Borrion, A. The Use of Life Cycle-Based Approaches in the Food Service Sector to Improve Sustainability: A Systematic Review. Sustainability 2020, 12, 3504. [Google Scholar] [CrossRef]
- Vos, M.; Deforche, B.; Van Kerckhove, A.; Michels, N.; Geuens, M.; Van Lippevelde, W. Intervention Strategies to Promote Healthy and Sustainable Food Choices Among Parents with Lower and Higher Socioeconomic Status. BMC Public Health 2022, 22, 2378. [Google Scholar] [CrossRef]
- YouGov. The Most Popular Dishes (Q1 2024). Available online: https://yougov.co.uk/ratings/consumer/popularity/dishes/all (accessed on 19 April 2024).
- Satija, A.; Hu, F.B. Plant-Based Diets and Cardiovascular Health. Trends Cardiovasc. Med. 2018, 28, 437–441. [Google Scholar] [CrossRef]
- Satija, A.; Bhupathiraju, S.N.; Spiegelman, D.; Chiuve, S.E.; Manson, J.E.; Willett, W.; Rexrode, K.M.; Rimm, E.B.; Hu, F.B. Healthful and Unhealthful Plant-Based Diets and the Risk of Coronary Heart Disease in US Adults. J. Am. Coll. Cardiol. 2017, 70, 411–422. [Google Scholar] [CrossRef]
- Thomas, M.S.; Calle, M.; Fernandez, M.L. Healthy Plant-Based Diets Improve Dyslipidemias, Insulin Resistance, and Inflammation in Metabolic Syndrome. A Narrative Review. Adv. Nutr. 2023, 14, 44–54. [Google Scholar] [CrossRef]
- Drewnowski, A. The Nutrient Rich Foods Index Helps to Identify Healthy, Affordable Foods. Am. J. Clin. Nutr. 2010, 91, 1095–1101. [Google Scholar] [CrossRef] [PubMed]
- Fulgoni, V.L.; Keast, D.R.; Drewnowski, A. Development and Validation of the Nutrient-Rich Foods Index: A Tool to Measure Nutritional Quality of Foods. J. Nutr. 2009, 139, 1549–1554. [Google Scholar] [CrossRef]
- Sluik, D.; Streppel, M.T.; Van Lee, L.; Geelen, A.; Feskens, E.J.M. Evaluation of a Nutrient-Rich Food Index Score in the Netherlands. J. Nutr. Sci. 2015, 4, e14. [Google Scholar] [CrossRef] [PubMed]
- McAuliffe, S.; Ray, S.; Fallon, E.; Bradfield, J.; Eden, T.; Kohlmeier, M. Dietary Micronutrients in the Wake of COVID-19: An Appraisal of Evidence with a Focus on High-Risk Groups and Preventative Healthcare. BMJ Nutr. Prev. Health 2020, 3, 93–99. [Google Scholar] [CrossRef] [PubMed]
- BNF. Nutrition Requirements; British Nutrition Foundation: London, UK, 2021. [Google Scholar]
- Department of Health. Dietary Reference Values for Food Energy and Nutrients for the United Kingdom; Department of Health: London, UK, 1991. [Google Scholar]
- ISO 14040:2006; Environmental Management—Life Cycle Assessment—Principles and Framework. International Organization for Standardization: Geneva, Switzerland, 2006.
- ISO 14044:2006; Environmental Management—Life Cycle Assessment—Requirements and Guidelines. International Organization for Standardization: Geneva, Switzerland, 2006.
- FSA. FSA Nutrient and Food Based Guidelines for UK Institutions; FSA: London, UK, 2007; pp. 1–8. [Google Scholar]
- Farsi, D.N.; Uthumange, D.; Munoz Munoz, J.; Commane, D.M. The Nutritional Impact of Replacing Dietary Meat with Meat Alternatives in the UK: A Modelling Analysis Using Nationally Representative Data. Br. J. Nutr. 2022, 127, 1731–1741. [Google Scholar] [CrossRef]
- Bryant, C.J. Plant-Based Animal Product Alternatives Are Healthier and More Environmentally Sustainable than Animal Products. Future Foods 2022, 6, 100174. [Google Scholar] [CrossRef]
- Alessandrini, R.; Brown, M.K.; Pombo-Rodrigues, S.; Bhageerutty, S.; He, F.J.; Macgregor, G.A. Nutritional Quality of Plant-Based Meat Products Available in the UK: A Cross-Sectional Survey. Nutrients 2021, 13, 4225. [Google Scholar] [CrossRef]
- Bhupathiraju, S.N.; Sawicki, C.M.; Goon, S.; Gujral, U.P.; Hu, F.B.; Kandula, N.R.; Kanaya, A.M. A Healthy Plant–Based Diet Is Favorably Associated with Cardiometabolic Risk Factors Among Participants of South Asian Ancestry. Am. J. Clin. Nutr. 2022, 116, 1078–1090. [Google Scholar] [CrossRef] [PubMed]
- Mo, Q.; Wu, J.; Lu, Y.; Zhang, X. Plant-Based Diets and Total and Cause-Specific Mortality: A Meta-Analysis of Prospective Studies. Front. Nutr. 2025, 12, 1518519. [Google Scholar] [CrossRef] [PubMed]
- Garnett, E.E.; Balmford, A.; Sandbrook, C.; Pilling, M.A.; Marteau, T.M. Impact of Increasing Vegetarian Availability on Meal Selection and Sales in Cafeterias. Proc. Natl. Acad. Sci. USA 2019, 116, 20923–20929. [Google Scholar] [CrossRef]
- Spaargaren, G.; van Koppen, C.S.A.; Janssen, A.M.; Hendriksen, A.; Kolfschoten, C.J. Consumer Responses to the Carbon Labelling of Food: A Real Life Experiment in a Canteen Practice. Sociol. Rural. 2013, 53, 432–453. [Google Scholar] [CrossRef]
- Verbeke, W. Impact of Communication on Consumers’ Food Choices. Proc. Nutr. Soc. 2008, 67, 281–288. [Google Scholar] [CrossRef]
- Filimonau, V.; Krivcova, M. Restaurant Menu Design and More Responsible Consumer Food Choice: An Exploratory Study of Managerial Perceptions. J. Clean. Prod. 2017, 143, 516–527. [Google Scholar] [CrossRef]
- Perez-Cueto, F.J.A. Nudging Plant-Based Meals Through the Menu. Int. J. Gastron. Food Sci. 2021, 24, 100346. [Google Scholar] [CrossRef]
- Parkin, B.L.; Attwood, S. Menu Design Approaches to Promote Sustainable Vegetarian Food Choices When Dining Out. J. Environ. Psychol. 2022, 79, 101721. [Google Scholar] [CrossRef]
- Papies, E.K.; Johannes, N.; Daneva, T.; Semyte, G.; Kauhanen, L.L. Using Consumption and Reward Simulations to Increase the Appeal of Plant-Based Foods. Appetite 2020, 155, 104812. [Google Scholar] [CrossRef]
- Turnwald, B.P.; Bertoldo, J.D.; Perry, M.A.; Policastro, P.; Timmons, M.; Bosso, C.; Connors, P.; Valgenti, R.T.; Pine, L.; Challamel, G.; et al. Increasing Vegetable Intake by Emphasizing Tasty and Enjoyable Attributes: A Randomized Controlled Multisite Intervention for Taste-Focused Labeling. Psychol. Sci. 2019, 30, 1603–1615. [Google Scholar] [CrossRef]
- HESA. Higher Education Student Statistics: UK 2021/22 Released. Available online: https://www.hesa.ac.uk/news/19-01-2023/higher-education-student-statistics-uk-202122-released?fbclid=IwAR3Qh4829YWFGnM37KyJyyC1EvCp5OLmDDwL9UqibFpQgsxPdf-W1p29wSo (accessed on 20 March 2025).
- Klapp, A.L.; Wyma, N.; Alessandrini, R.; Ndinda, C.; Perez-Cueto, A.; Risius, A. Recommendations to address the shortfalls of the EAT–Lancet planetary health diet from a plant-forward perspective. Lancet Planet. Health 2025, 9, e23–e33. [Google Scholar] [CrossRef] [PubMed]
- Dave, L.A.; Hodgkinson, S.M.; Roy, N.C.; Smith, N.W.; McNabb, W.C. The Role of Holistic Nutritional Properties of Diets in the Assessment of Food System and Dietary Sustainability. Crit. Rev. Food Sci. Nutr. 2023, 63, 5117–5137. [Google Scholar] [CrossRef] [PubMed]

Disclaimer/Publisher’s Note: The statements, opinions and data contained in all publications are solely those of the individual author(s) and contributor(s) and not of MDPI and/or the editor(s). MDPI and/or the editor(s) disclaim responsibility for any injury to people or property resulting from any ideas, methods, instructions or products referred to in the content. |
© 2025 by the authors. Licensee MDPI, Basel, Switzerland. This article is an open access article distributed under the terms and conditions of the Creative Commons Attribution (CC BY) license (https://creativecommons.org/licenses/by/4.0/).
Share and Cite
Takacs, B.; Kalea, A.Z.; Borrion, A. Menu Dilemmas: An Integrated Assessment of the Nutritional Quality, Environmental Impact, and Cost of Vegan, Vegetarian, and Meat-Based Versions of Meals. Nutrients 2025, 17, 1569. https://doi.org/10.3390/nu17091569
Takacs B, Kalea AZ, Borrion A. Menu Dilemmas: An Integrated Assessment of the Nutritional Quality, Environmental Impact, and Cost of Vegan, Vegetarian, and Meat-Based Versions of Meals. Nutrients. 2025; 17(9):1569. https://doi.org/10.3390/nu17091569
Chicago/Turabian StyleTakacs, Berill, Anastasia Z. Kalea, and Aiduan Borrion. 2025. "Menu Dilemmas: An Integrated Assessment of the Nutritional Quality, Environmental Impact, and Cost of Vegan, Vegetarian, and Meat-Based Versions of Meals" Nutrients 17, no. 9: 1569. https://doi.org/10.3390/nu17091569
APA StyleTakacs, B., Kalea, A. Z., & Borrion, A. (2025). Menu Dilemmas: An Integrated Assessment of the Nutritional Quality, Environmental Impact, and Cost of Vegan, Vegetarian, and Meat-Based Versions of Meals. Nutrients, 17(9), 1569. https://doi.org/10.3390/nu17091569