
Exercise, Nutrition, and Neuromuscular Electrical Stimulation for Sarcopenic Obesity: A Systematic Review and Meta-Analysis of Management in Middle-Aged and Older Adults


 , , ,
, , ,  and
and 
Abstract
1. Introduction
2. Materials and Methods
2.1. Literature Search
2.2. Inclusion and Exclusion Criteria
- Population(P): Adults aged ≥ 45 years meeting either (1) a SO diagnosis, (2) being sarcopenic overweight, or (3) obesity with a sarcopenia risk. The exclusion conditions included active neurological/cognitive impairments, severe cardiovascular diseases, acute infection, active autoimmune disease, or malignancy.
- Intervention(I): Exercise protocols (resistance/aerobic training), nutritional optimization (protein supplementation, vitamin D), or neuromuscular electrical stimulation (NMES).
- Comparison(C): Non-pharmacological comparators, usual care, a placebo, or a blank control.
- Outcomes(O): The primary endpoints included body composition (body fat percentage, BMI, waist circumference) and physical performance (gait speed, grip strength). The secondary endpoints included physiologic indicators (blood pressure, lipid profiles).
- Study design(S): Peer-reviewed randomized controlled trials (RCTs) or cluster RCTs.
2.3. Study Selection
2.4. Data Extraction
2.5. Risk of Bias Assessment
2.6. Statistical Analysis
2.7. Sensitivity Analysis
3. Results
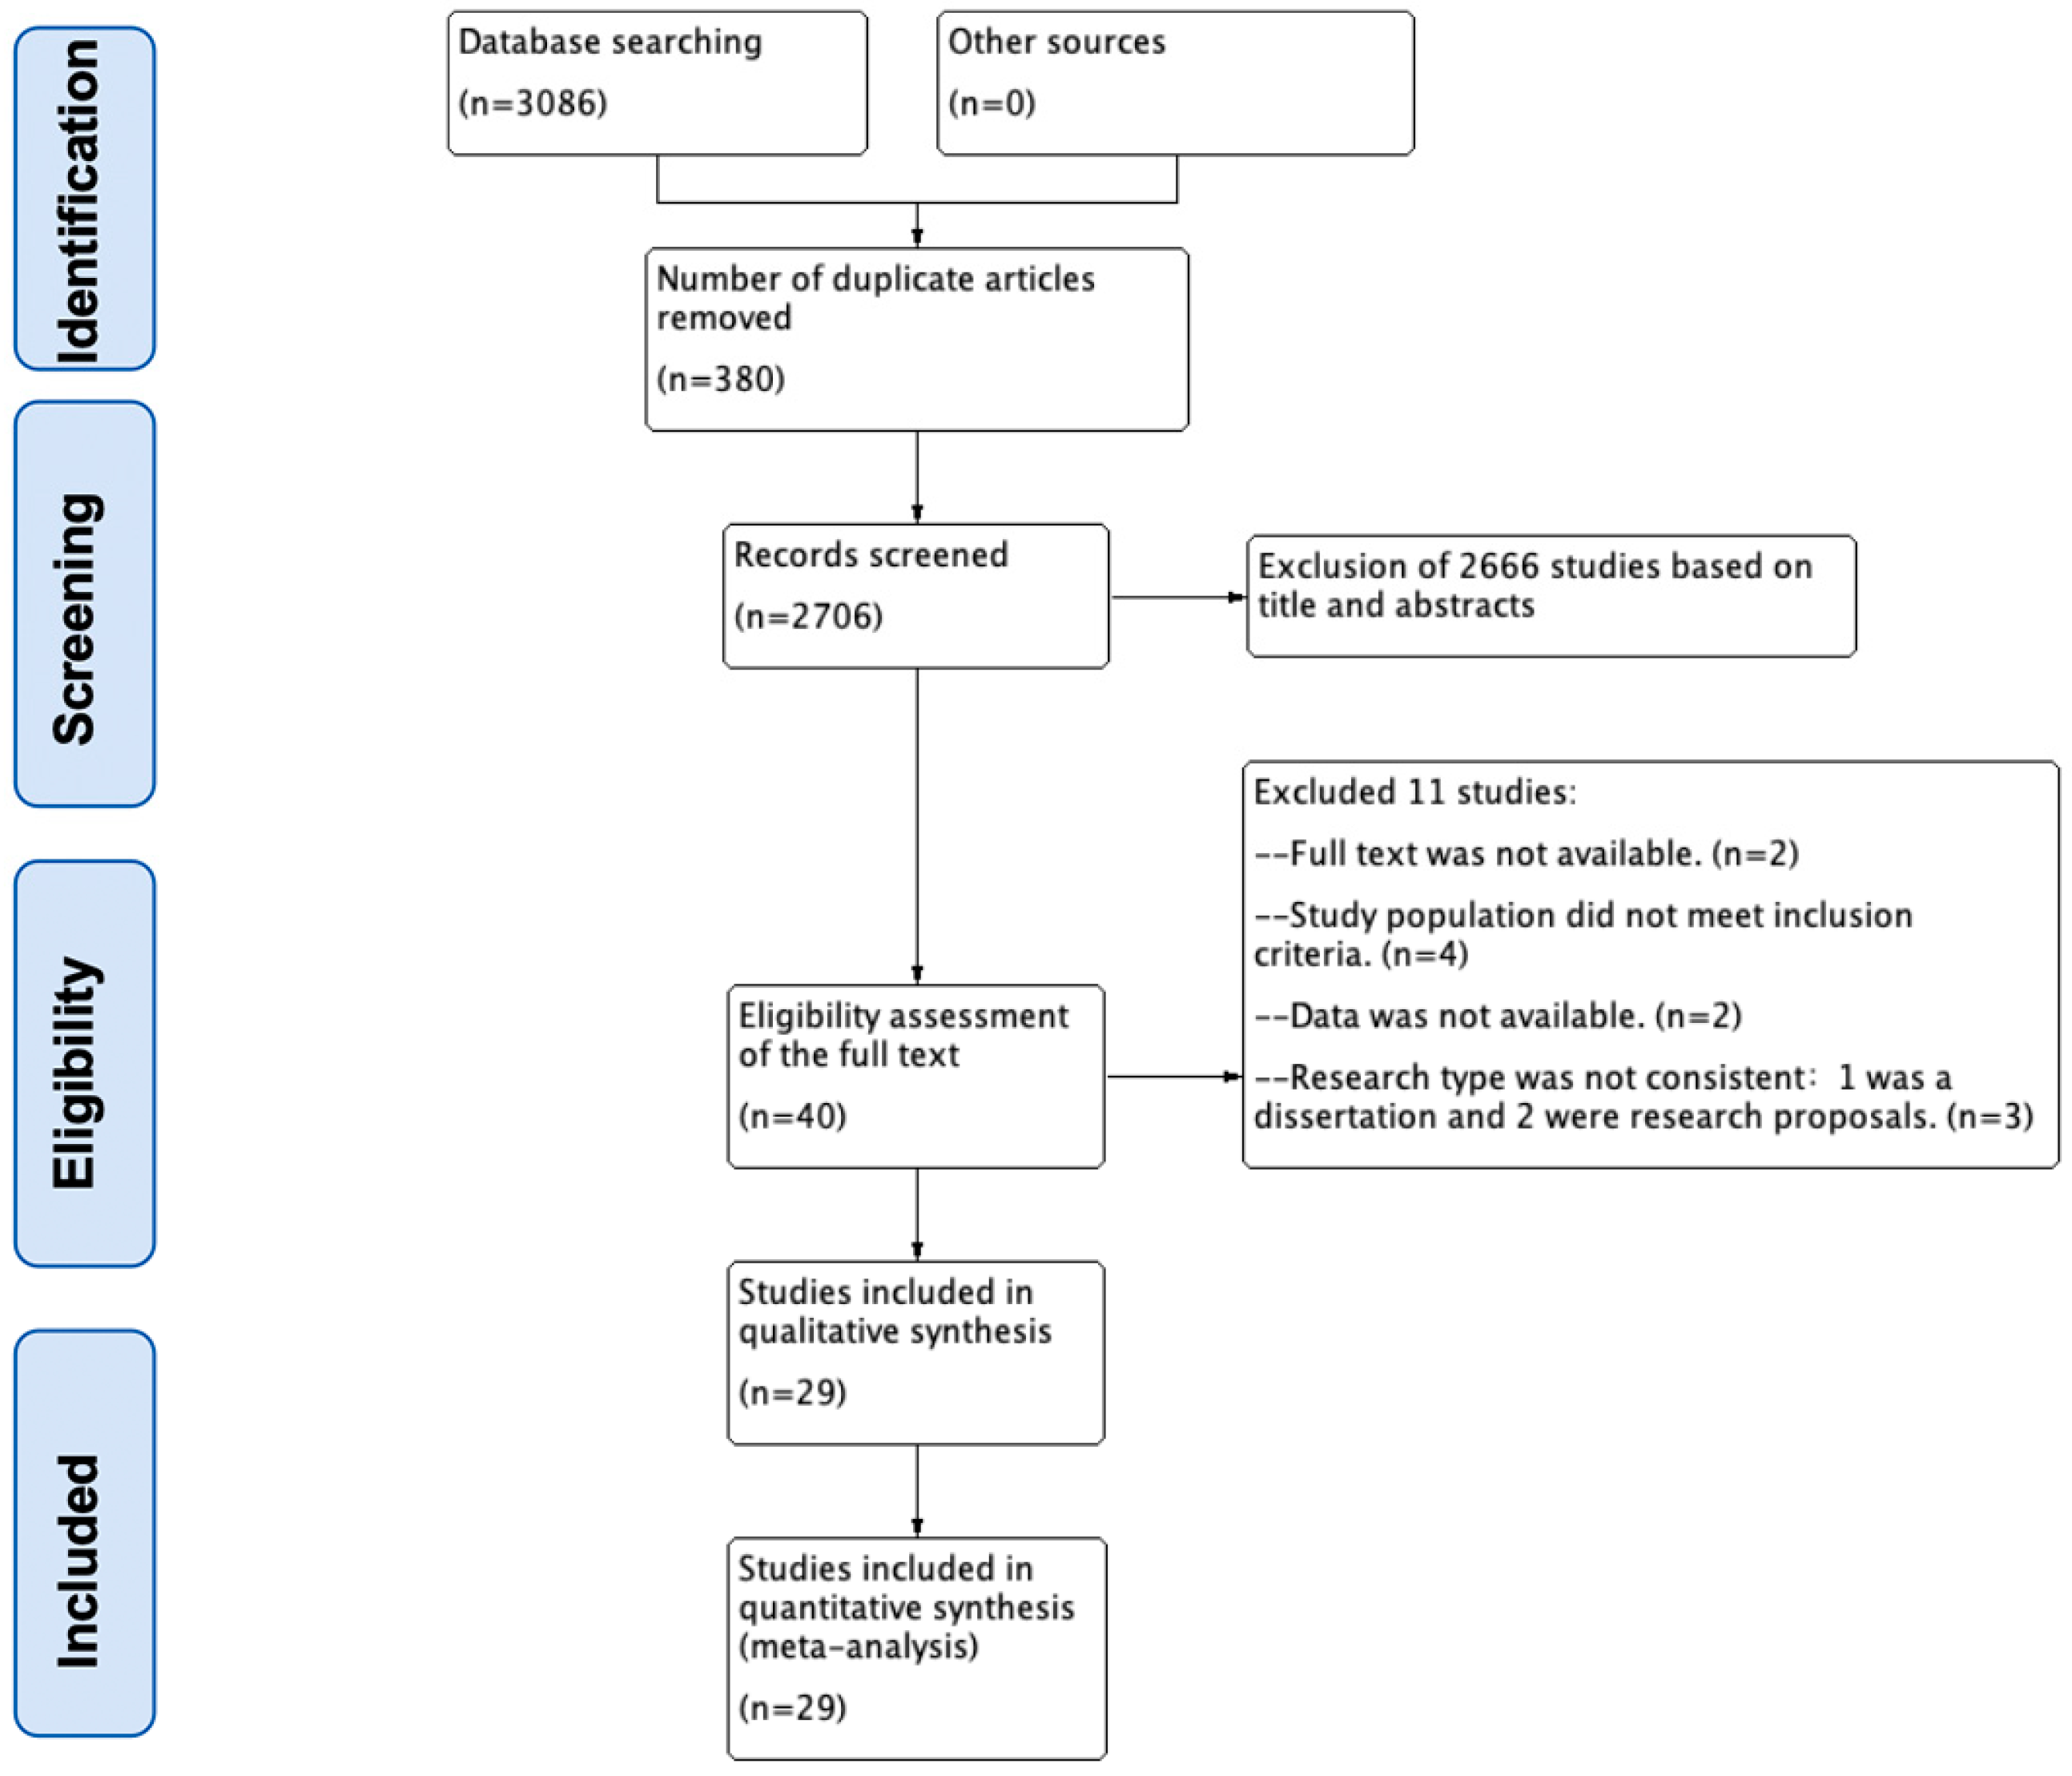
3.1. Literature Screening
3.2. Characteristics of the Included Studies
3.3. Description of Diagnostic Criteria for Sarcopenic Obesity
3.4. Effects of Exercise Interventions on SO
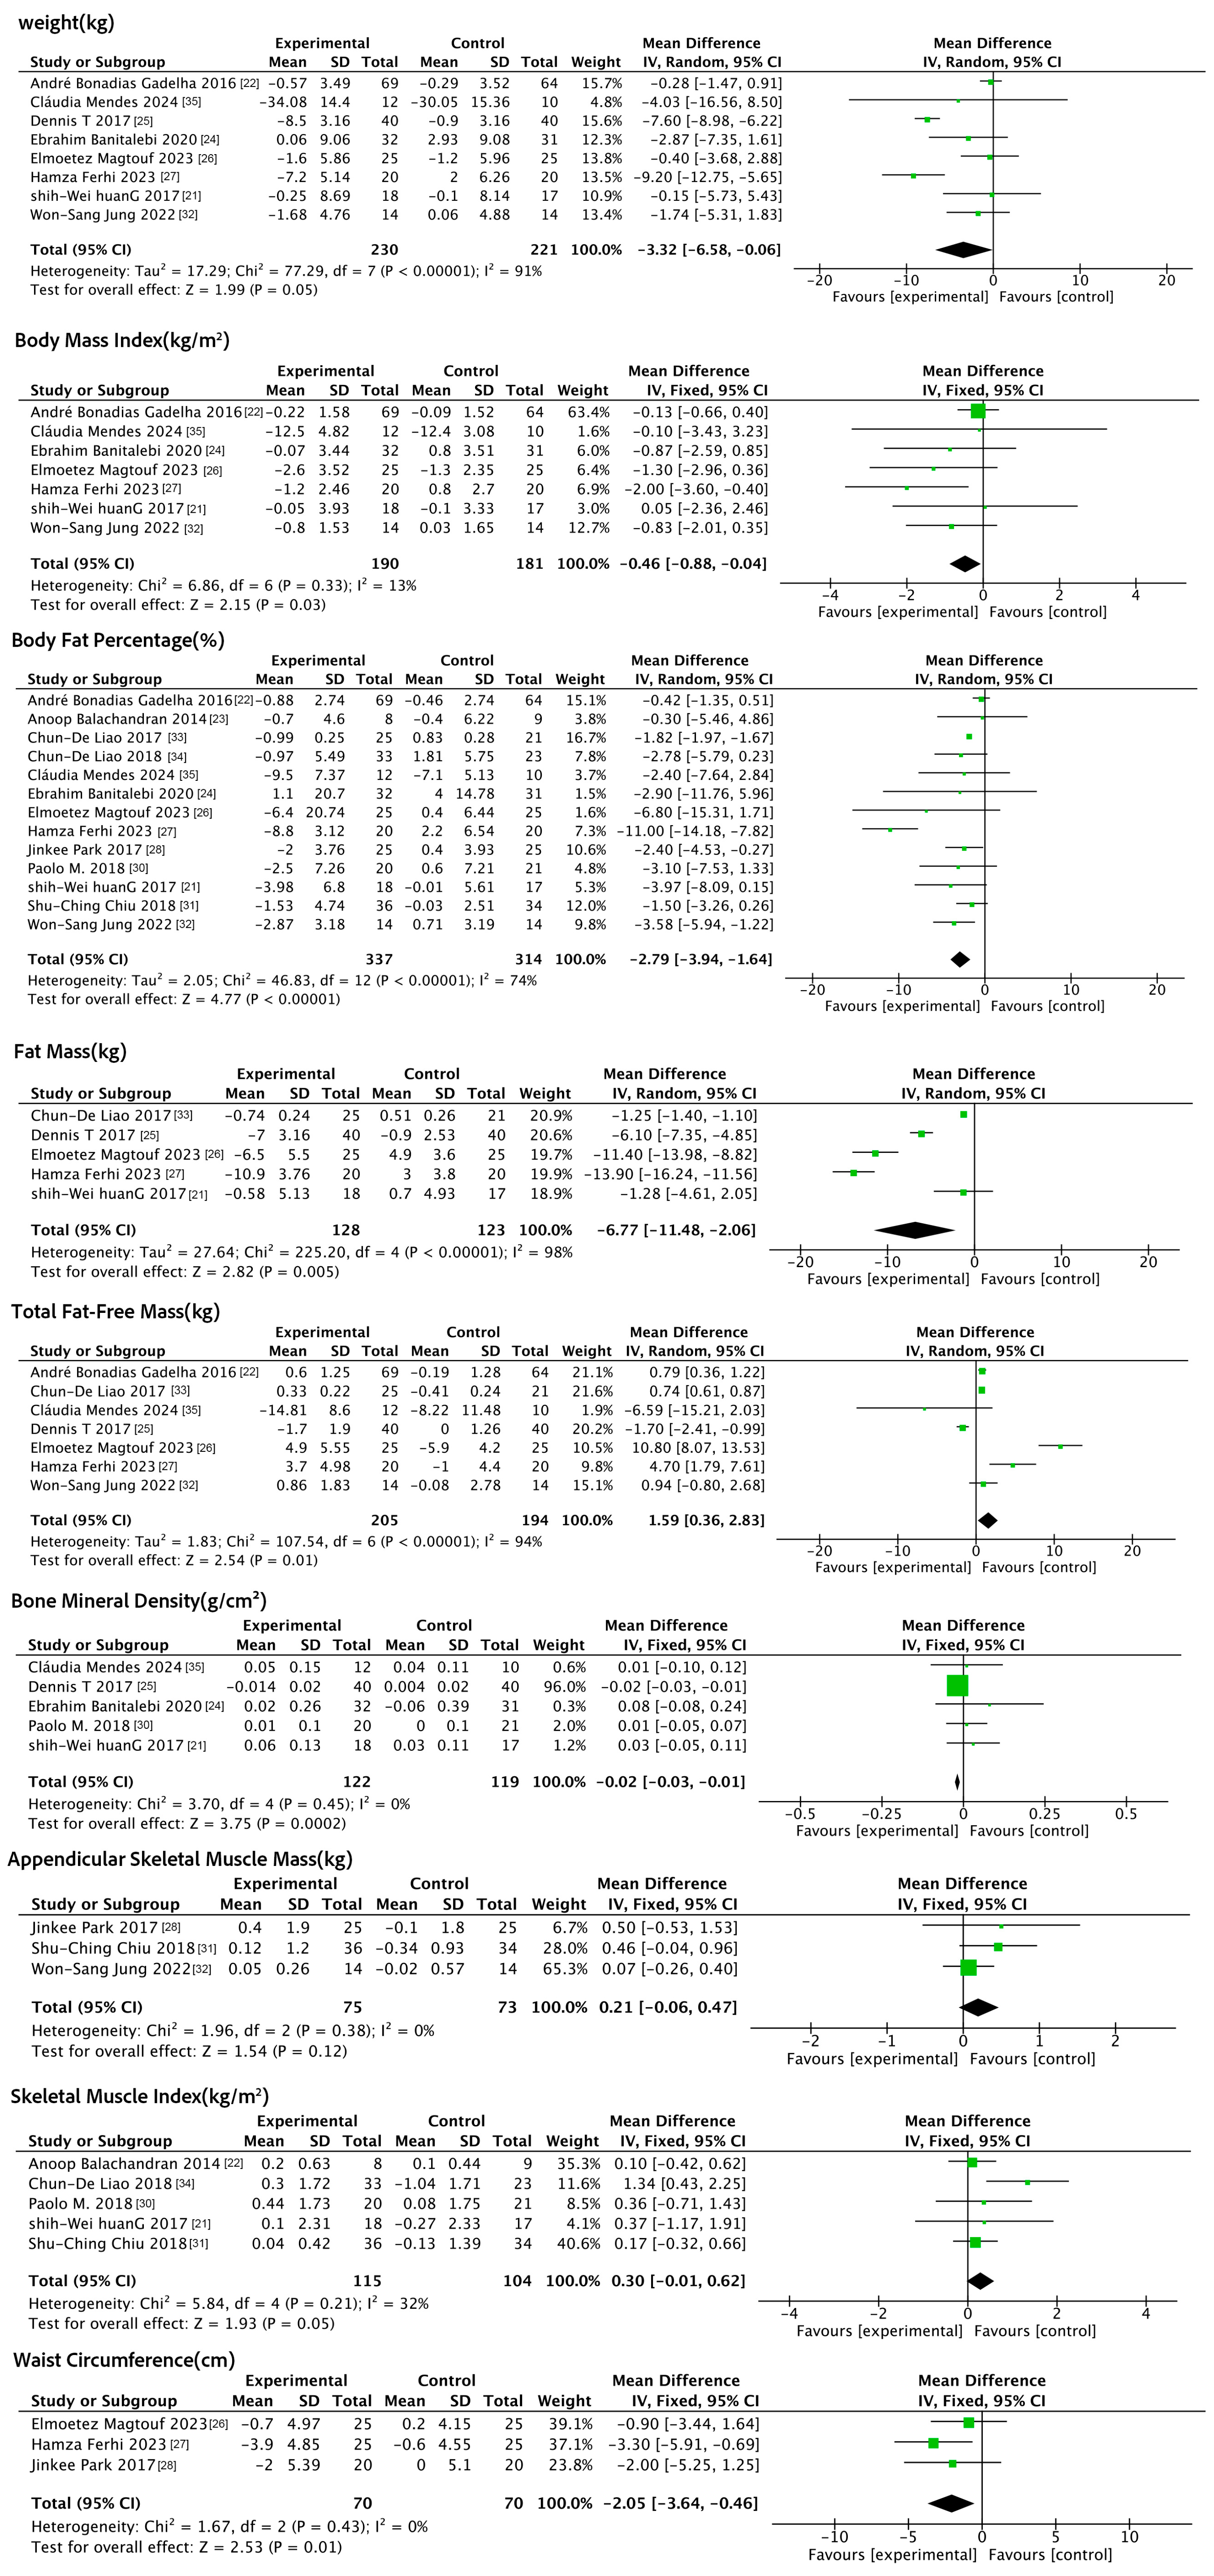
3.4.1. Effects of Exercise Interventions on Anthropometric Indicators
3.4.2. Effects of Exercise Interventions on Indicators of Physical Functioning
3.4.3. Effects of Exercise Interventions on Physiologic Indicators
3.5. Effects of Nutritional Interventions on SO
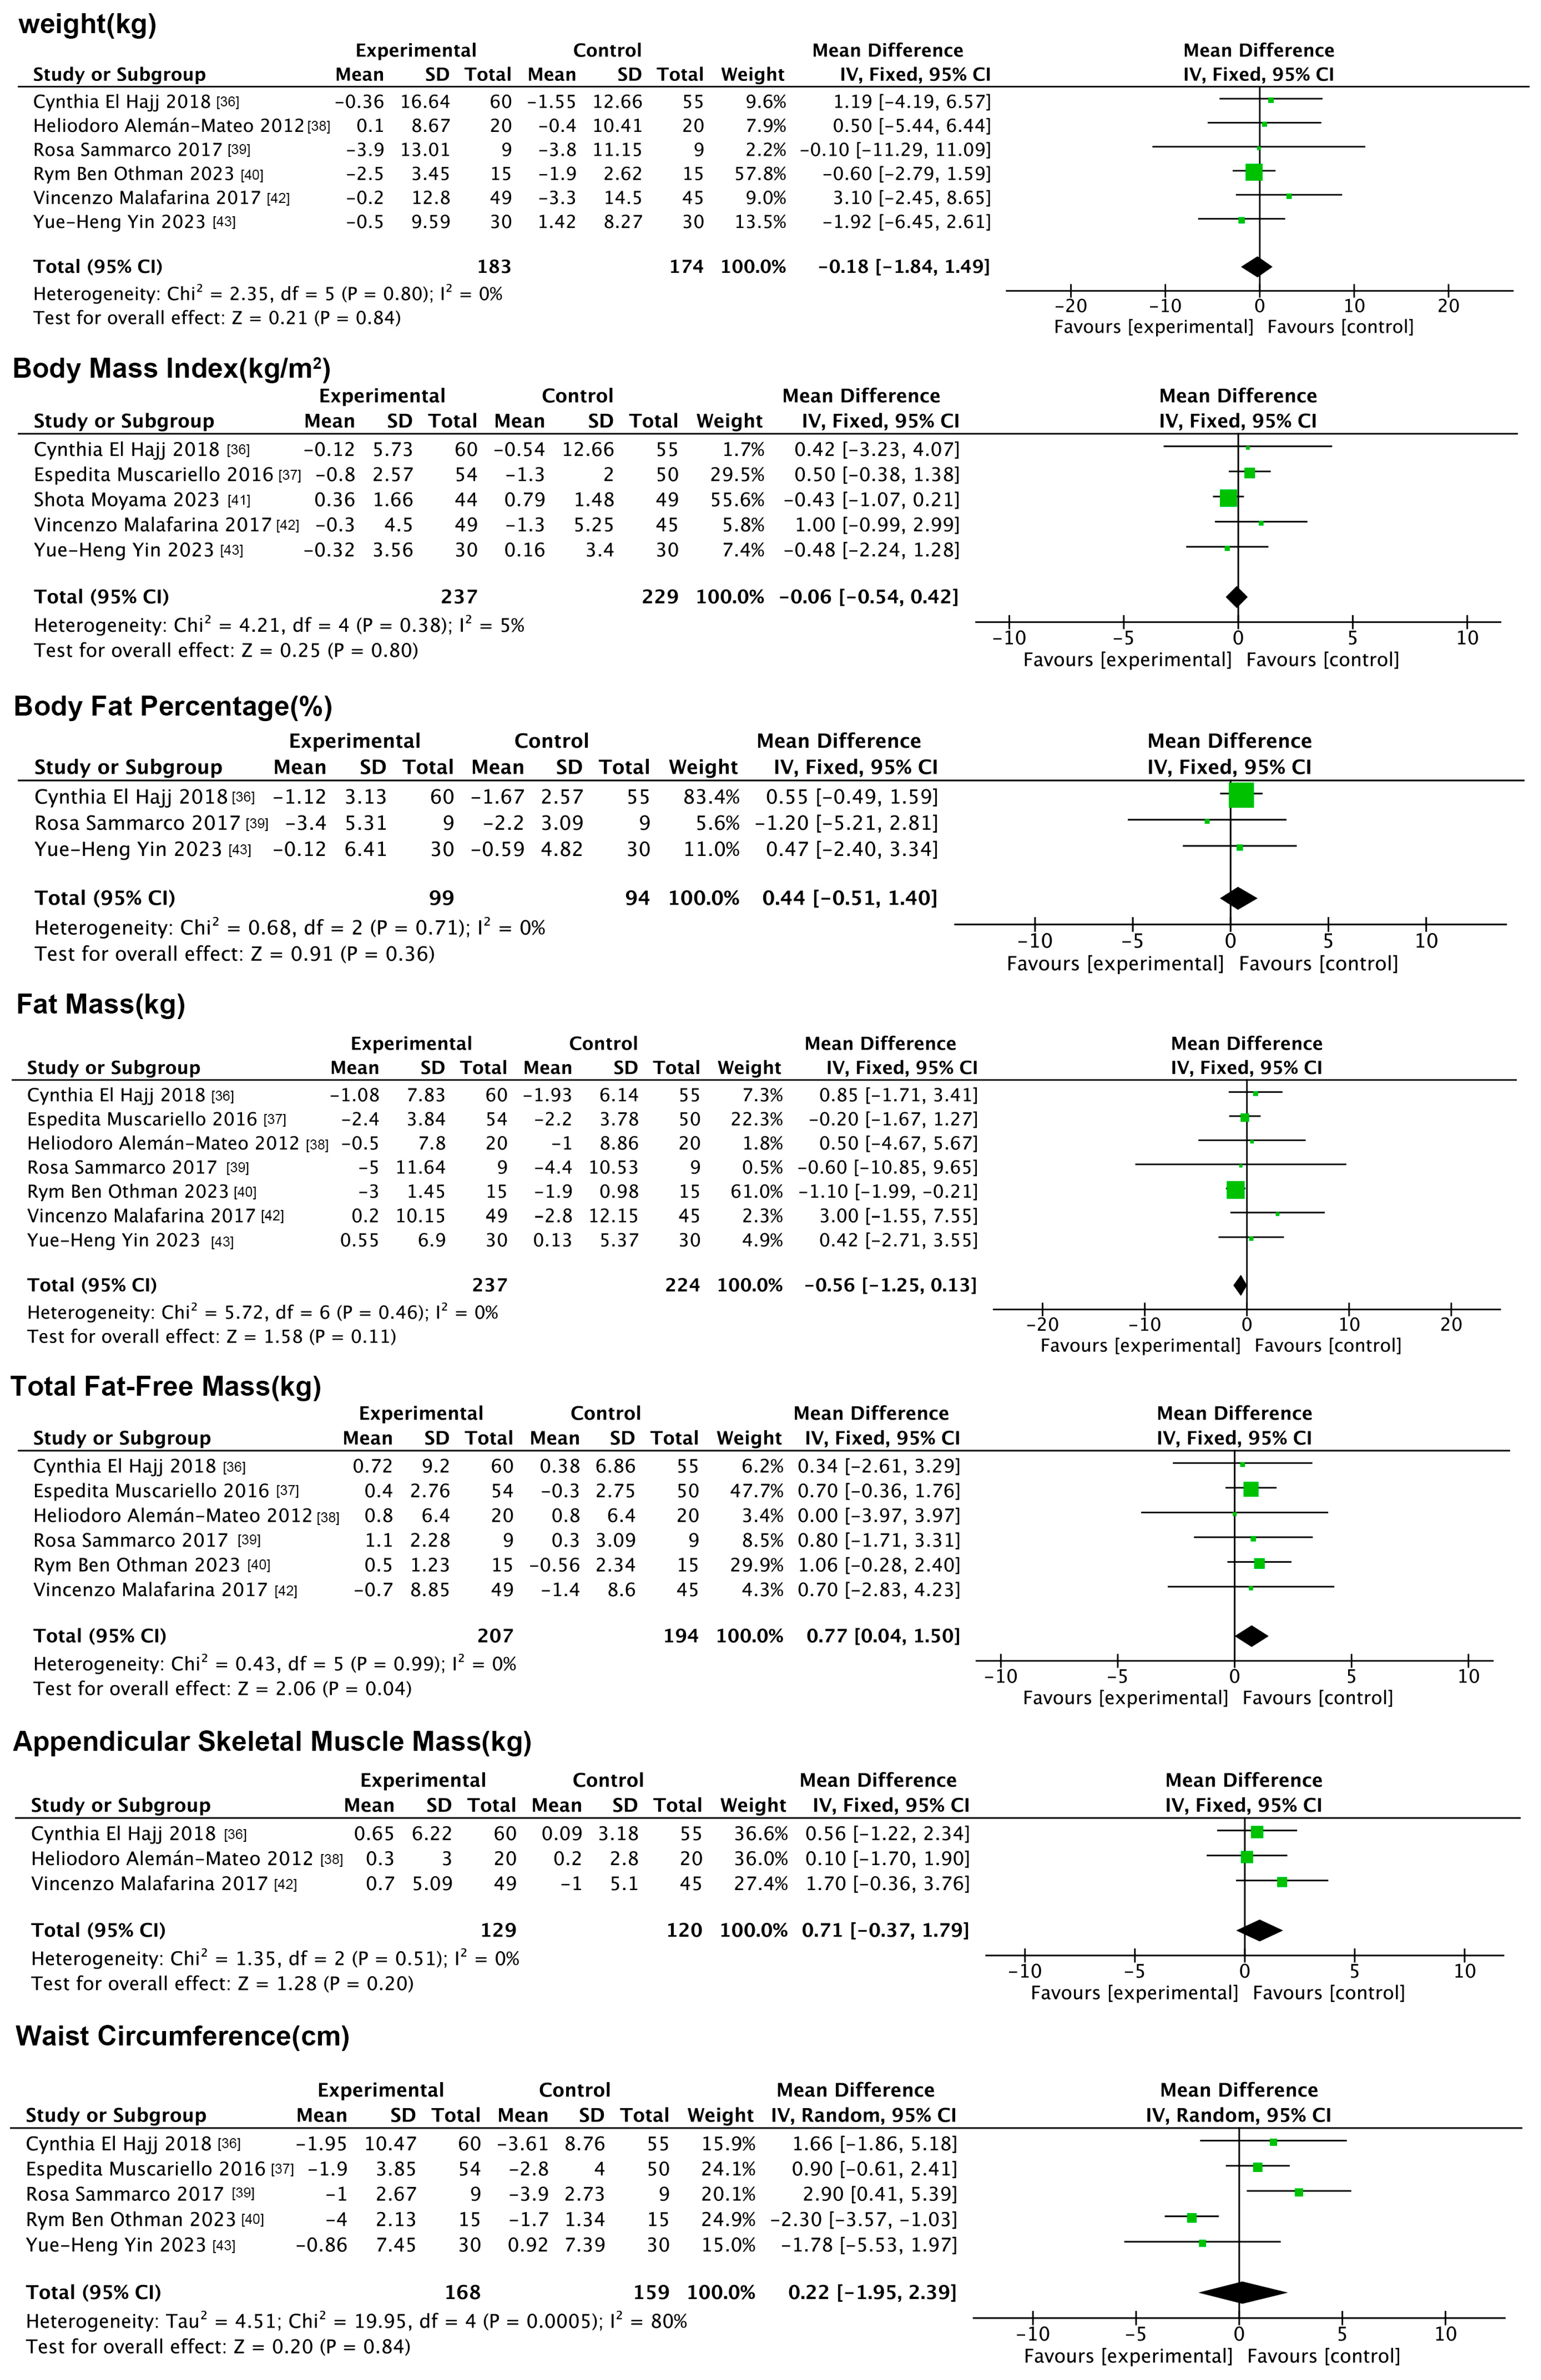
3.5.1. Effects of Nutritional Interventions on Anthropometric Indicators
3.5.2. Impact of Nutritional Interventions on Indicators of Physical Functioning
3.5.3. Impact of Nutritional Interventions on Physiologic Indicators
3.6. Effects of Neuromuscular Electrical Stimulation on SO
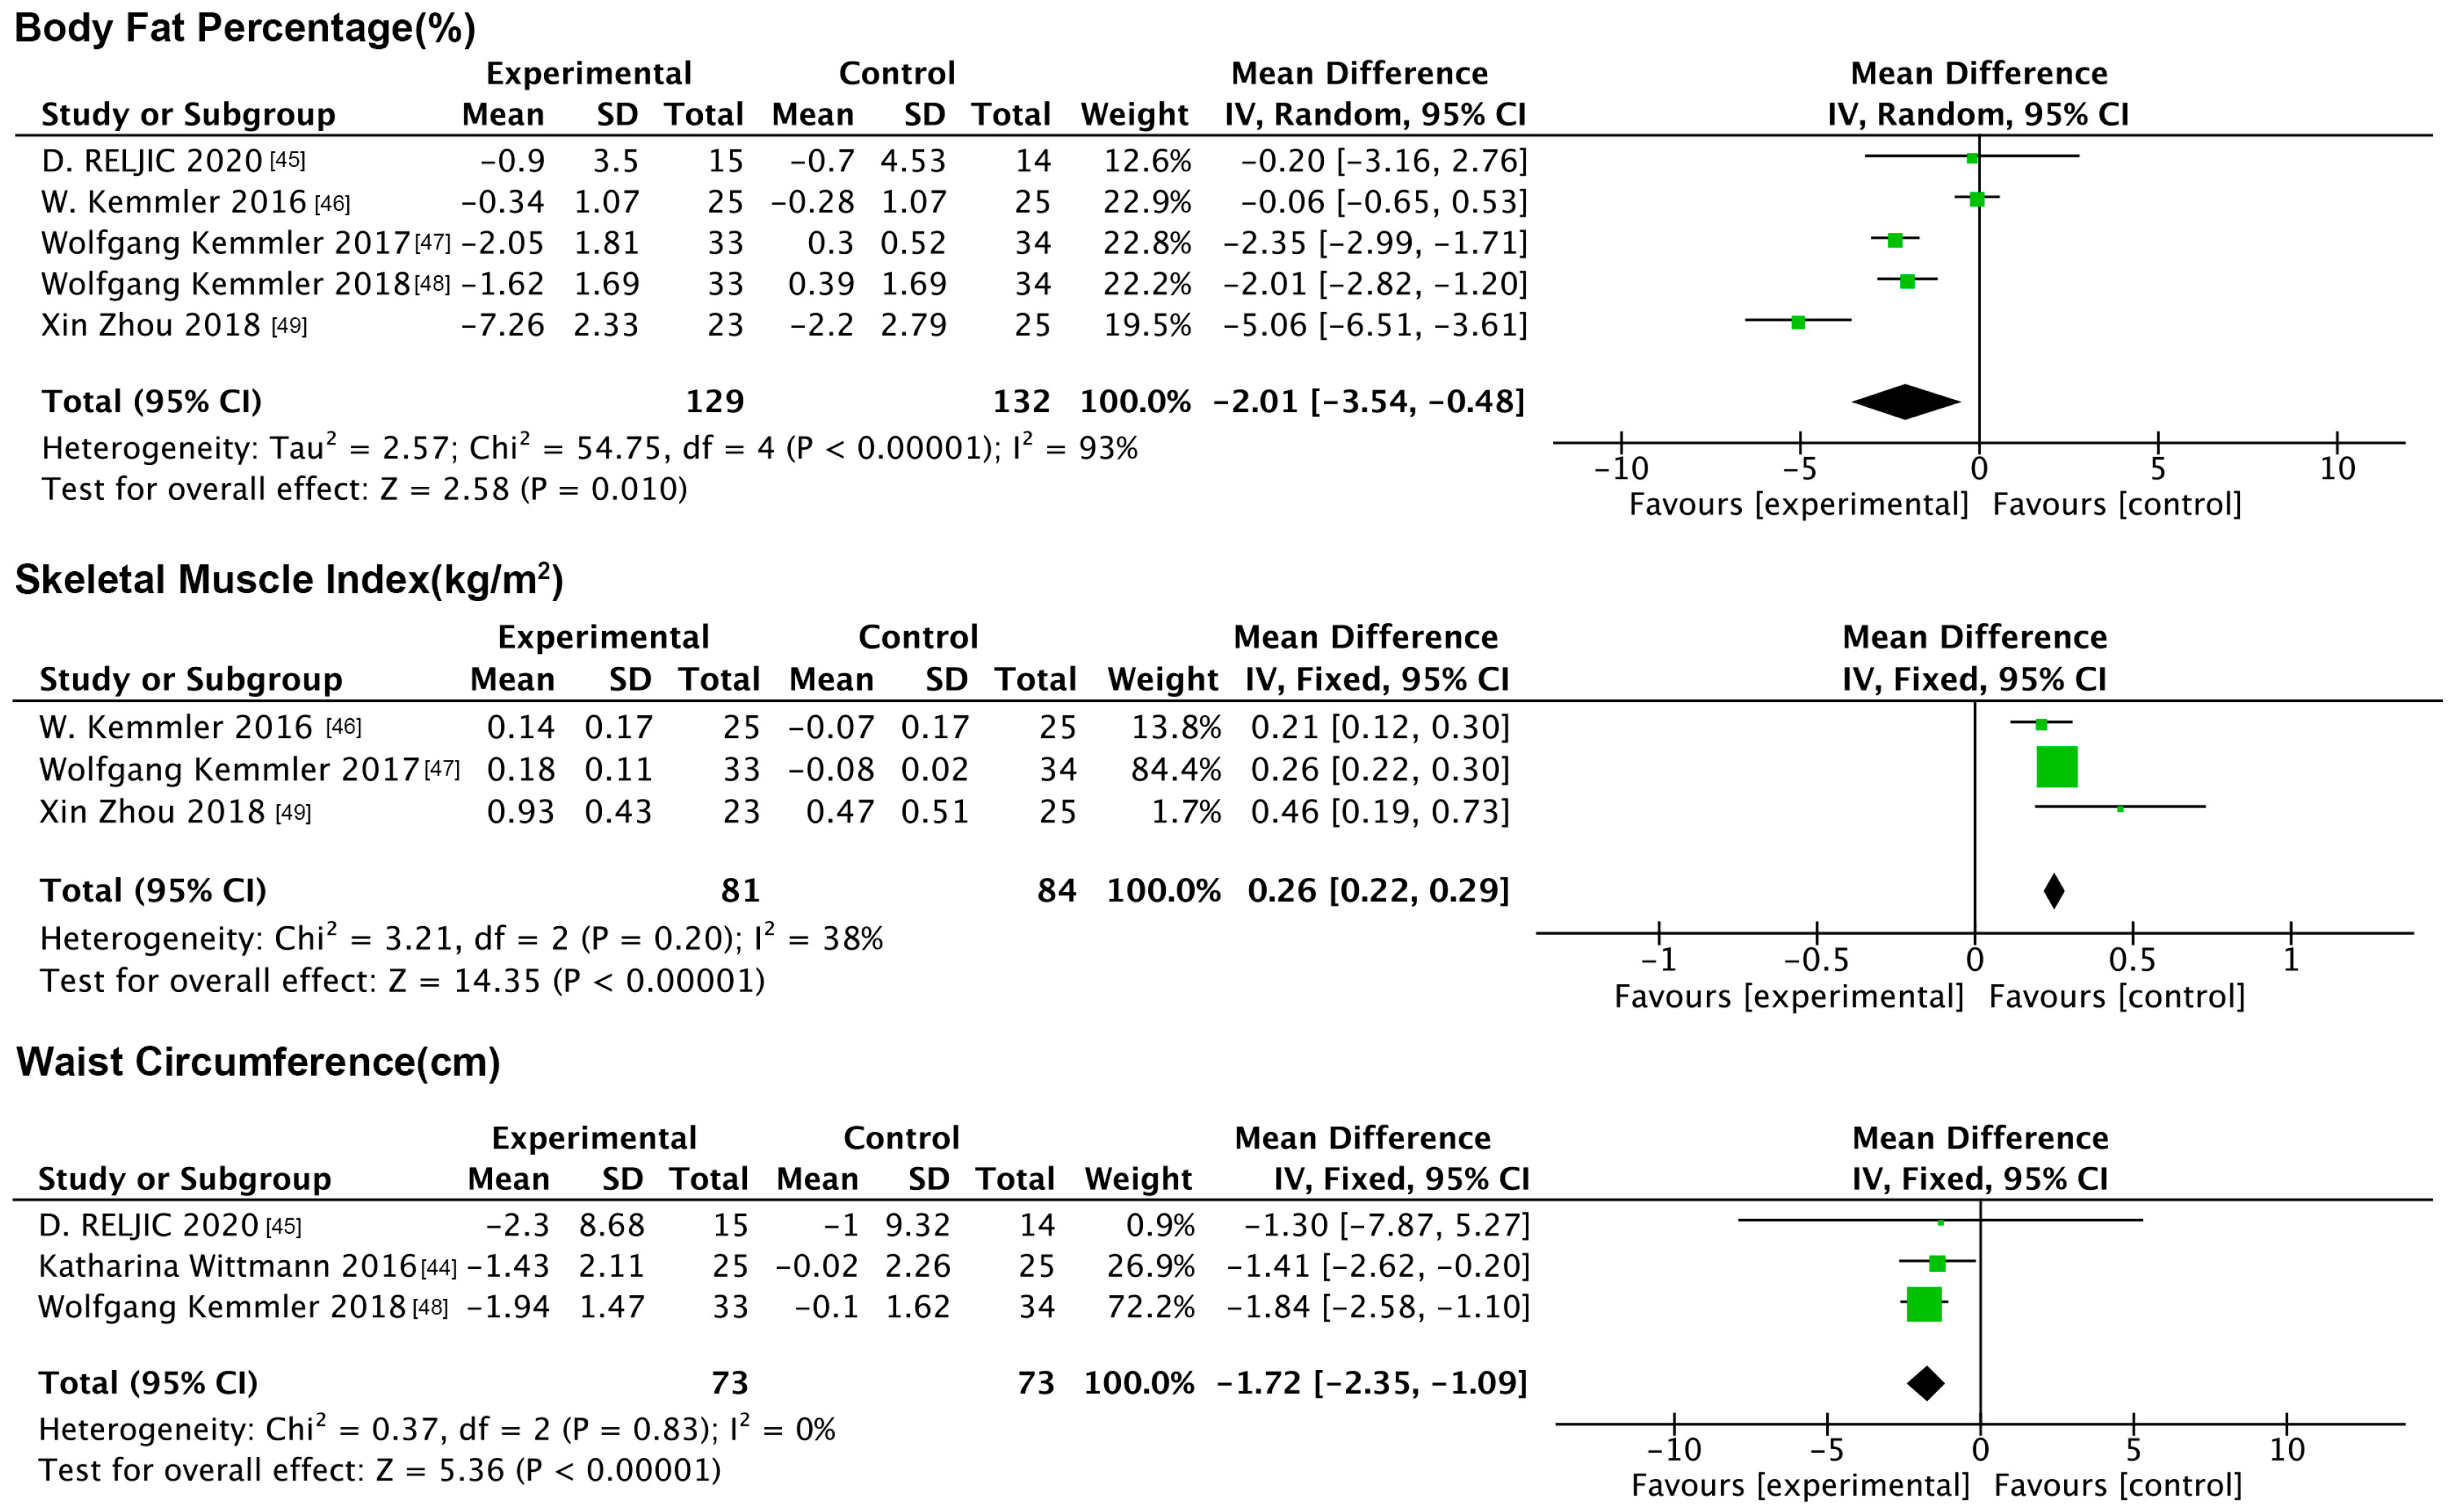
3.6.1. Impact of NMES on Anthropometric Indicators
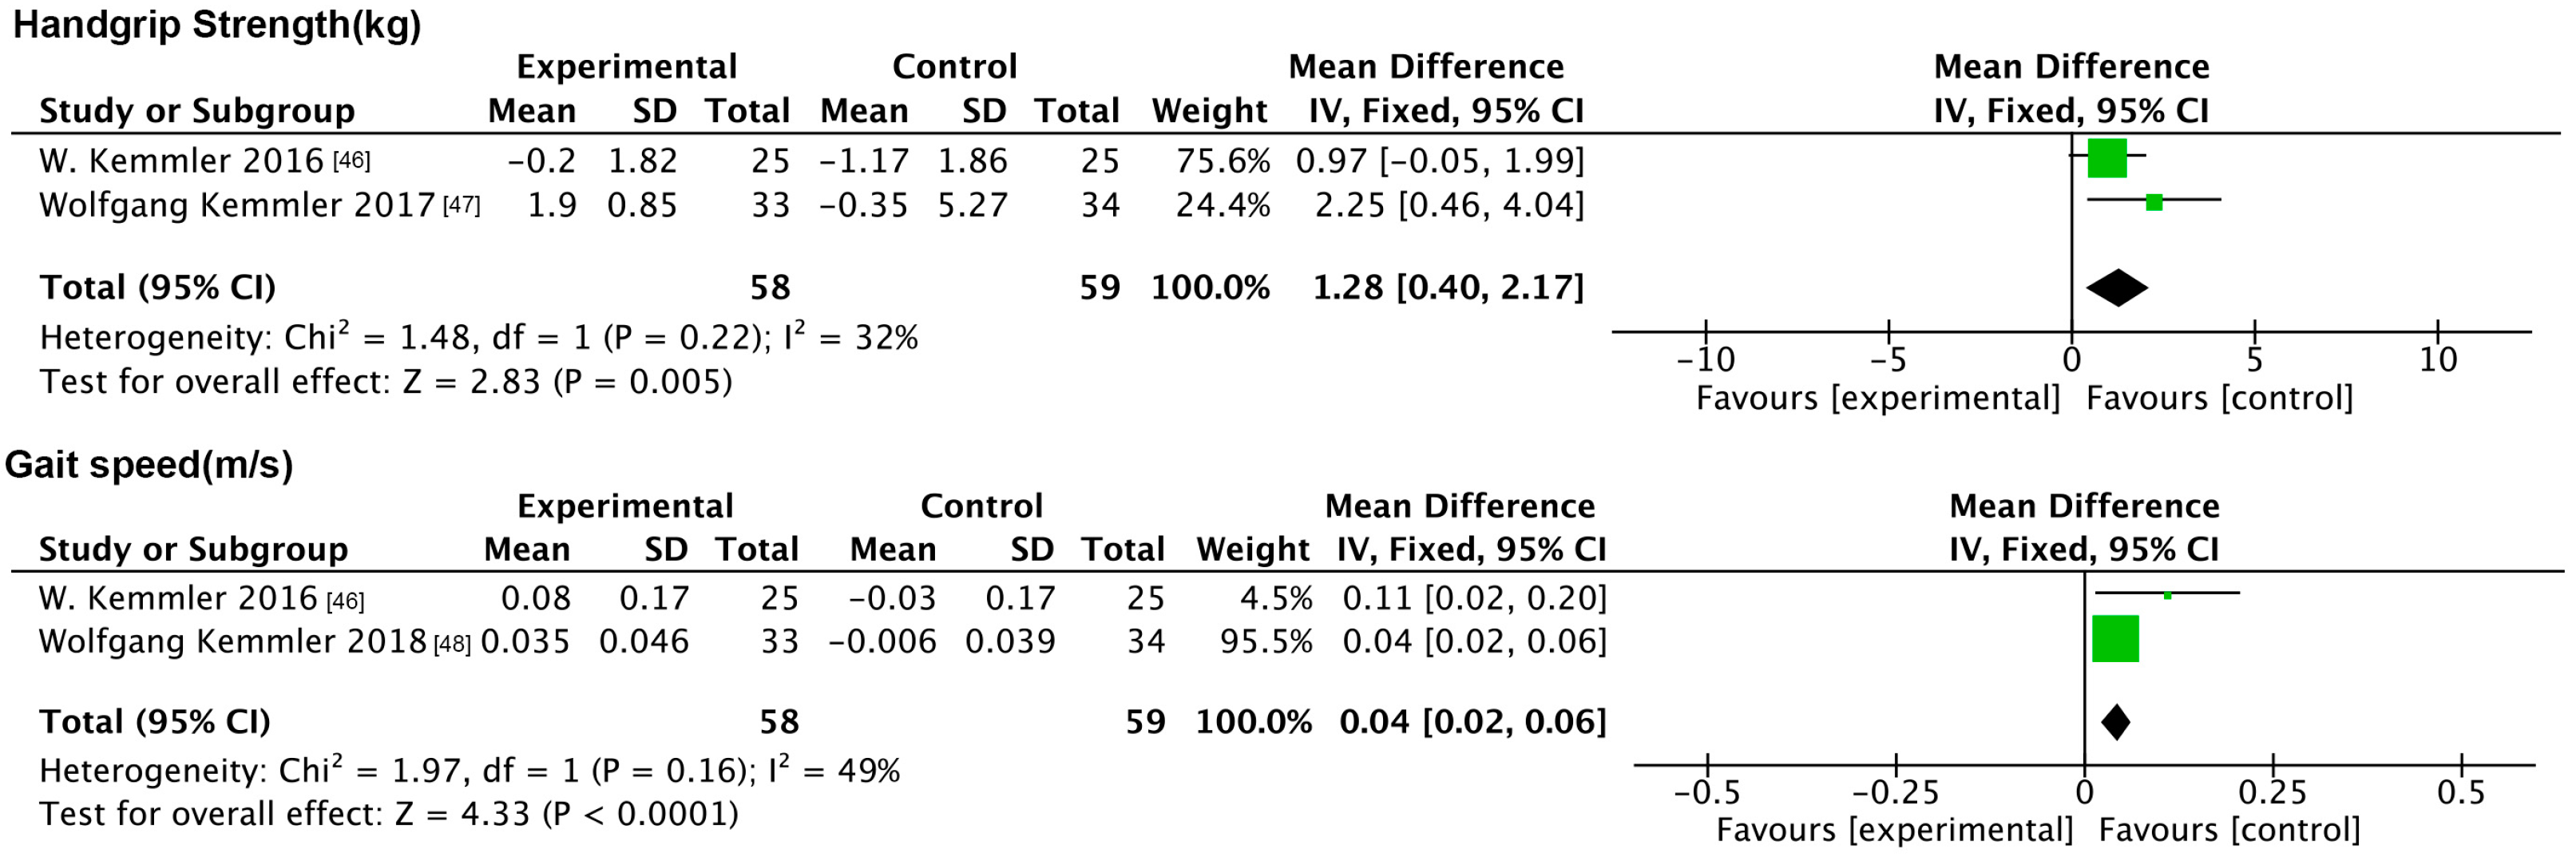
3.6.2. Impact of NMES on Indicators of Physical Functioning
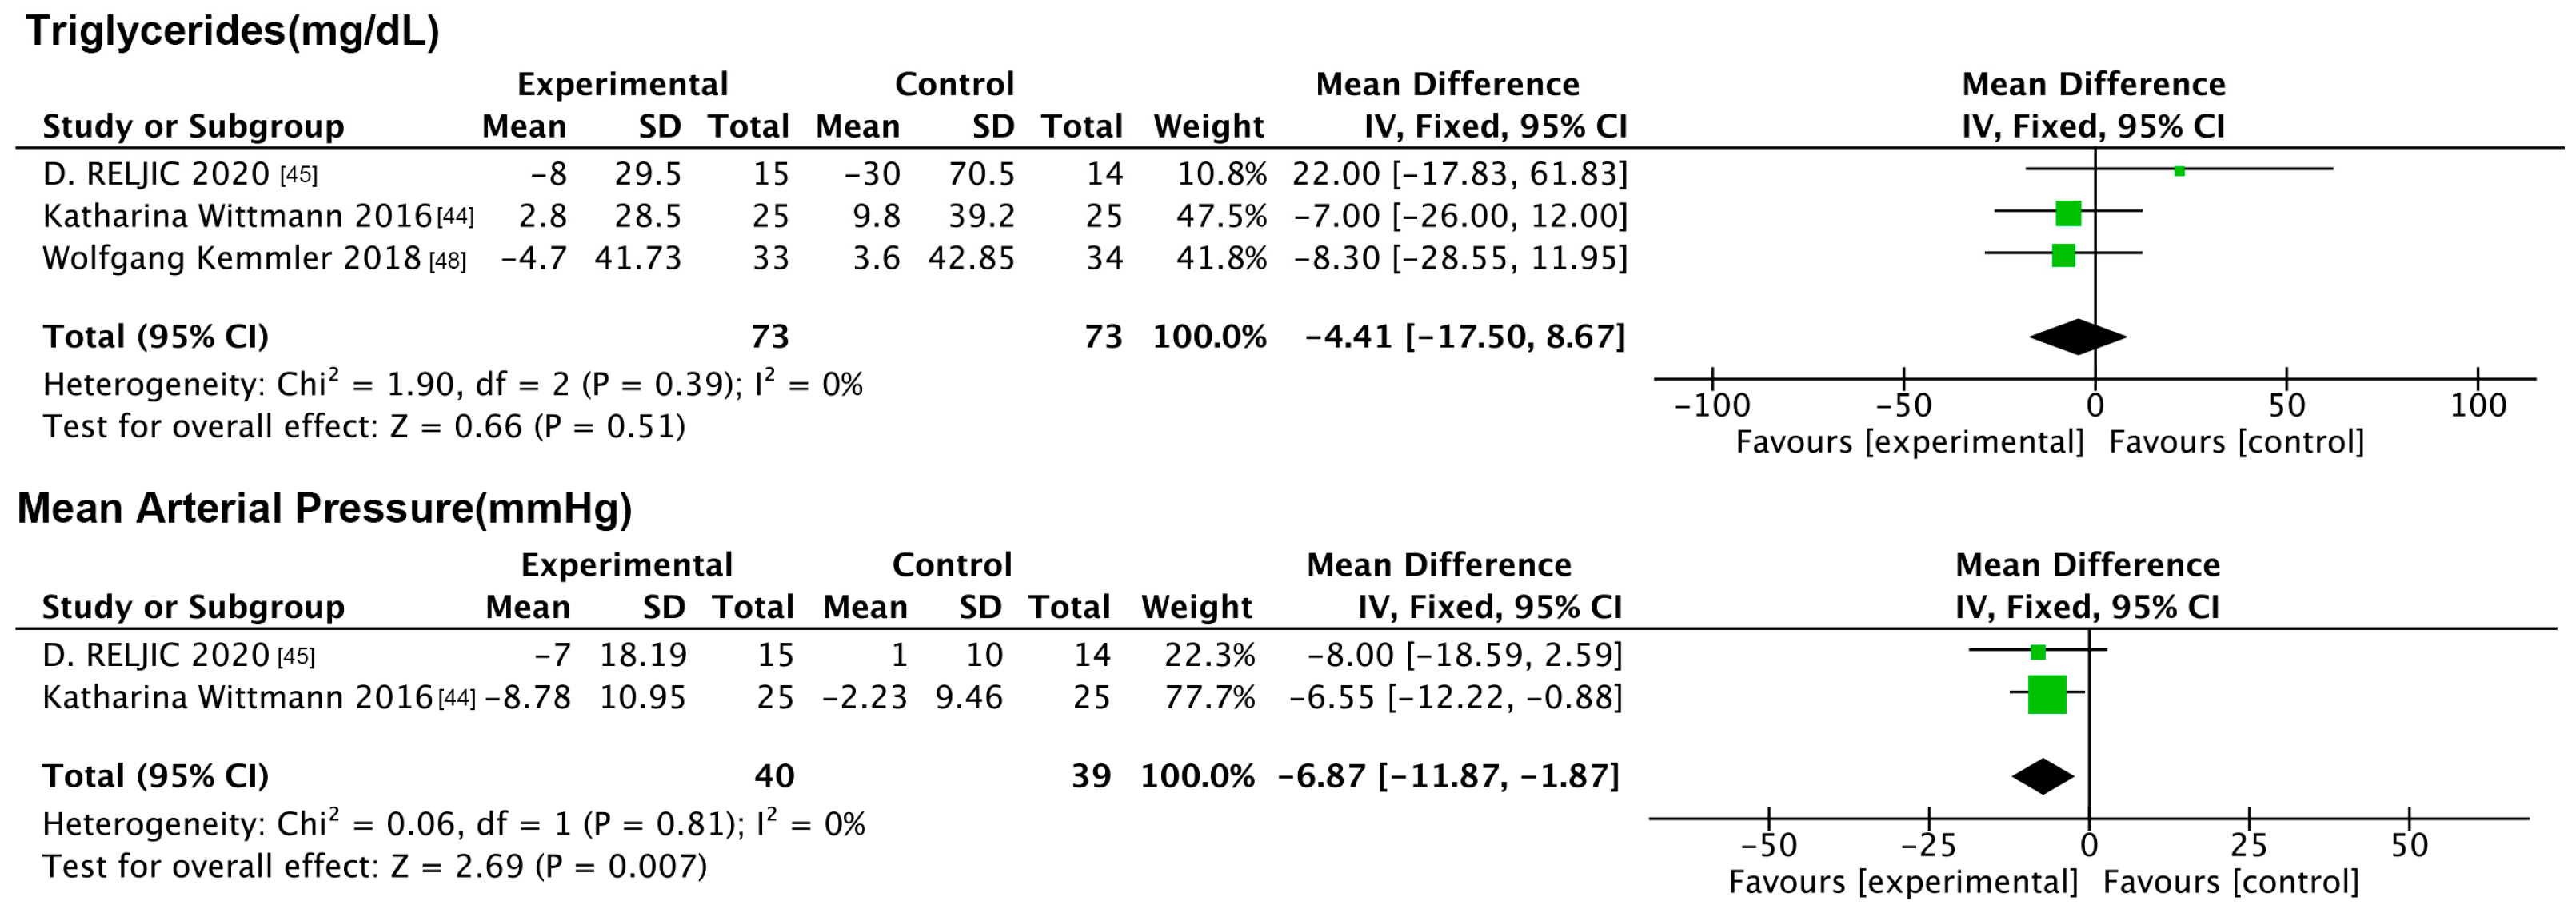
3.6.3. Impact of NMES on Physiologic Indicators
3.7. Subgroup Analysis
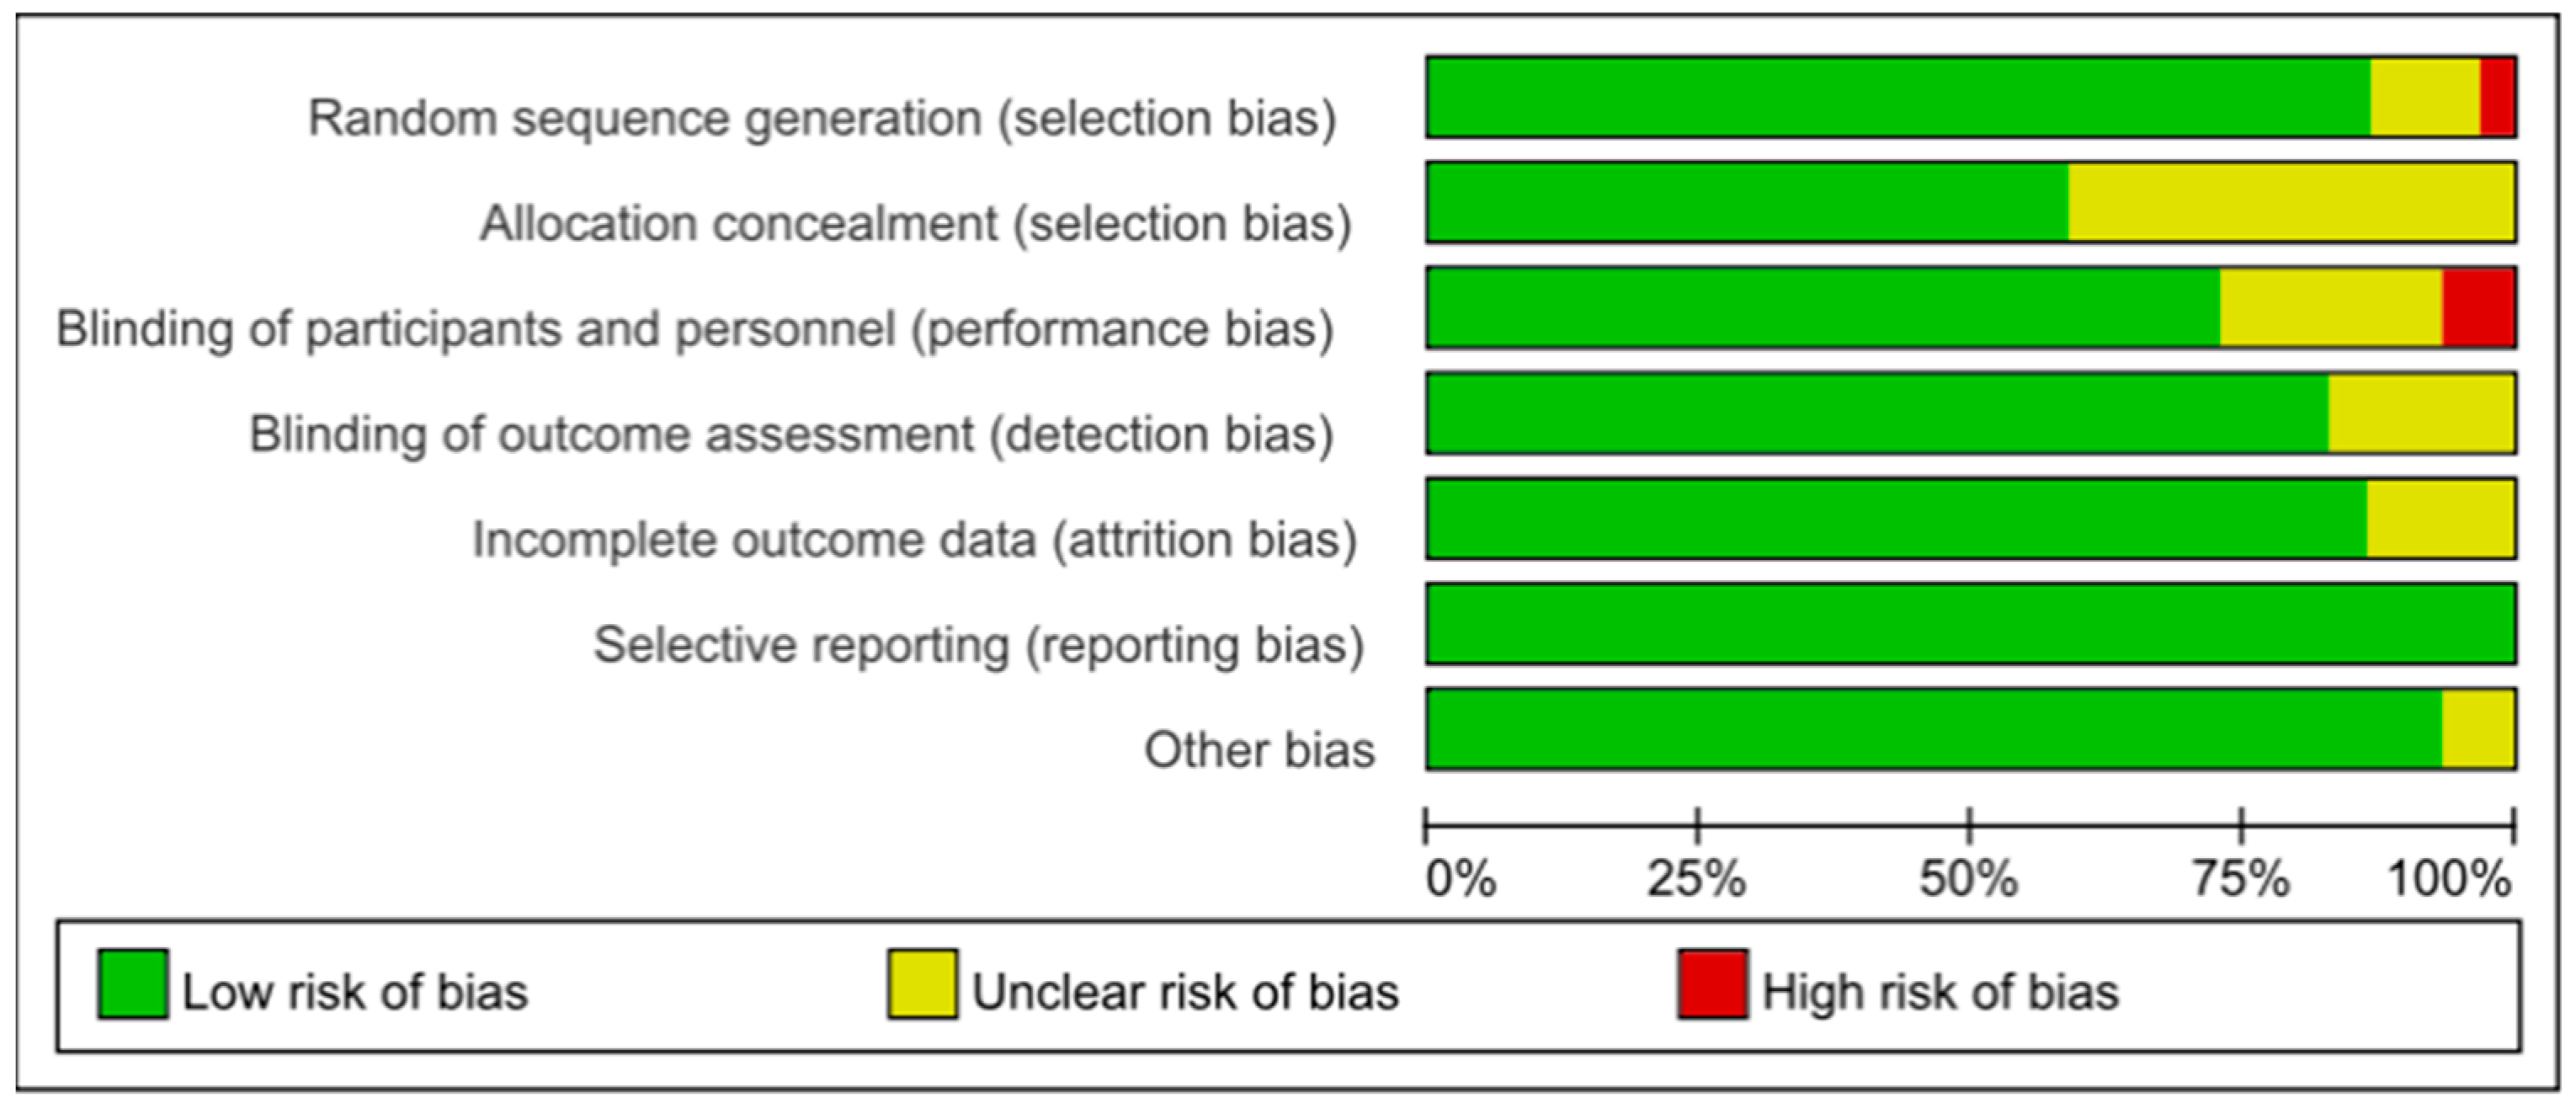
3.8. Biased Risk Assessment
3.9. Publication Bias
3.10. Sensitivity Analysis
4. Discussion
5. Conclusions
Author Contributions
Funding
Data Availability Statement
Conflicts of Interest
References
- Akishita, M.; Kozaki, K.; Iijima, K.; Tanaka, T.; Shibasaki, K.; Ogawa, S.; Arai, H. Chapter 1 Definitions and diagnosis of sarcopenia. Geriatr. Gerontol. Int. 2018, 18 (Suppl. S1), 7–12. [Google Scholar] [CrossRef] [PubMed]
- Alalwan, T.A. Phenotypes of Sarcopenic Obesity: Exploring the Effects on Peri-Muscular Fat, the Obesity Paradox, Hormone-Related Responses and the Clinical Implications. Geriatrics 2020, 5, 8. [Google Scholar] [CrossRef] [PubMed]
- Malandrino, N.; Bhat, S.Z.; Alfaraidhy, M.; Grewal, R.S.; Kalyani, R.R. Obesity and Aging. Endocrinol. Metab. Clin. N. Am. 2023, 52, 317–339. [Google Scholar] [CrossRef]
- Afrashteh, S.; Jalalian, Z.; Daneshi, N.; Jamshidi, A.; Batty, J.A.; Mahdavizade, H.; Farhadi, A.; Malekizadeh, H.; Nabipour, I.; Larijani, B. Cardiometabolic risk factor clusters in older adults using latent class analysis on the Bushehr elderly health program. Sci. Rep. 2024, 14, 25736. [Google Scholar] [CrossRef]
- Kalinkovich, A.; Livshits, G. Sarcopenic obesity or obese sarcopenia: A cross talk between age-associated adipose tissue and skeletal muscle inflammation as a main mechanism of the pathogenesis. Ageing Res. Rev. 2017, 35, 200–221. [Google Scholar] [CrossRef]
- Gao, Q.; Mei, F.; Shang, Y.; Hu, K.; Chen, F.; Zhao, L.; Ma, B. Global prevalence of sarcopenic obesity in older adults: A systematic review and meta-analysis. Clin. Nutr. 2021, 40, 4633–4641. [Google Scholar] [CrossRef] [PubMed]
- Batsis, J.A.; Villareal, D.T. Sarcopenic obesity in older adults: Aetiology, epidemiology and treatment strategies. Nat. Rev. Endocrinol. 2018, 14, 513–537. [Google Scholar] [CrossRef]
- Abete, I.; Konieczna, J.; Zulet, M.A.; Galmés-Panades, A.M.; Ibero-Baraibar, I.; Babio, N.; Estruch, R.; Vidal, J.; Toledo, E.; Razquin, C.; et al. Association of lifestyle factors and inflammation with sarcopenic obesity: Data from the PREDIMED-Plus trial. J. Cachexia Sarcopenia Muscle 2019, 10, 974–984. [Google Scholar] [CrossRef]
- Li, Q.; Huang, F.; Cheng, Y.; Dai, Y.; Lin, Z.; Lin, Z.; Zhu, P. Does high-frequency resistance exercise offer additional benefits to older adults? learnings from a randomized controlled trial. BMC Sports Sci. Med. Rehabil. 2024, 16, 186. [Google Scholar] [CrossRef]
- Mi, W.; Zhang, H.; Zhang, L.; Li, X.; Wang, Z.; Sun, Y.; Shen, T.; Fan, K.; Liu, C.; Xu, S. Age but not vitamin D is related to sarcopenia in vitamin D sufficient male elderly in rural China. Sci. Rep. 2025, 15, 765. [Google Scholar] [CrossRef]
- Franceschi, C.; Garagnani, P.; Parini, P.; Giuliani, C.; Santoro, A. Inflammaging: A new immune-metabolic viewpoint for age-related diseases. Nat. Rev. Endocrinol. 2018, 14, 576–590. [Google Scholar] [CrossRef] [PubMed]
- Dharia, A.; Desai, D.; Desai, K. Exploring the Link Between Thyroid Disorders and Obesity: Mechanisms, Impacts, and Clinical Implications. Endocr Pract. 2025; in press. [Google Scholar] [CrossRef]
- Mirzai, S.; Carbone, S.; Batsis, J.A.; Kritchevsky, S.B.; Kitzman, D.W.; Shapiro, M.D. Sarcopenic Obesity and Cardiovascular Disease: An Overlooked but High-Risk Syndrome. Curr. Obes. Rep. 2024, 13, 532–544. [Google Scholar] [CrossRef]
- Kaur, I.; Das, S.; Chandel, S.; Chandel, S. Possible sarcopenia, sarcopenic obesity phenotypes and their association with diabetes: Evidence from LASI wave-1 (2017–18). Diabetes Metab. Syndr. 2025, 19, 103185. [Google Scholar] [CrossRef] [PubMed]
- Hirani, V.; Naganathan, V.; Blyth, F.; Le Couteur, D.G.; Seibel, M.J.; Waite, L.M.; Handelsman, D.J.; Cumming, R.G. Longitudinal associations between body composition, sarcopenic obesity and outcomes of frailty, disability, institutionalisation and mortality in community-dwelling older men: The Concord Health and Ageing in Men Project. Age Ageing 2017, 46, 413–420. [Google Scholar] [CrossRef]
- Atkins, J.L.; Whincup, P.H.; Morris, R.W.; Lennon, L.T.; Papacosta, O.; Wannamethee, S.G. Sarcopenic obesity and risk of cardiovascular disease and mortality: A population-based cohort study of older men. J. Am. Geriatr. Soc. 2014, 62, 253–260. [Google Scholar] [CrossRef] [PubMed]
- Donini, L.M.; Busetto, L.; Bischoff, S.C.; Cederholm, T.; Ballesteros-Pomar, M.D.; Batsis, J.A.; Bauer, J.M.; Boirie, Y.; Cruz-Jentoft, A.J.; Dicker, D.; et al. Definition and diagnostic criteria for sarcopenic obesity: ESPEN and EASO consensus statement. Clin. Nutr. 2022, 41, 990–1000. [Google Scholar] [CrossRef]
- Xu, J.; Hu, Q.; Li, J.; Zhou, Y.; Chu, T. Effects of non-pharmacological interventions on patients with sarcopenic obesity: A meta-analysis. PLoS ONE 2023, 18, e0290085. [Google Scholar] [CrossRef]
- Methley, A.M.; Campbell, S.; Chew-Graham, C.; McNally, R.; Cheraghi-Sohi, S. PICO, PICOS and SPIDER: A comparison study of specificity and sensitivity in three search tools for qualitative systematic reviews. BMC Health Serv. Res. 2014, 14, 579. [Google Scholar] [CrossRef]
- Cumpston, M.; Li, T.; Page, M.J.; Chandler, J.; Welch, V.A.; Higgins, J.P.; Thomas, J. Updated guidance for trusted systematic reviews: A new edition of the Cochrane Handbook for Systematic Reviews of Interventions. Cochrane Database Syst Rev. 2019, 10, ED000142. [Google Scholar] [CrossRef]
- Huang, S.W.; Ku, J.W.; Lin, L.F.; Liao, C.D.; Chou, L.C.; Liou, T.H. Body composition influenced by progressive elastic band resistance exercise of sarcopenic obesity elderly women: A pilot randomized controlled trial. Eur. J. Phys. Rehabil. Med. 2017, 53, 556–563. [Google Scholar] [CrossRef] [PubMed]
- Gadelha, A.B.; Paiva, F.M.; Gauche, R.; de Oliveira, R.J.; Lima, R.M. Effects of resistance training on sarcopenic obesity index in older women: A randomized controlled trial. Arch. Gerontol. Geriatr. 2016, 65, 168–173. [Google Scholar] [CrossRef]
- Balachandran, A.; Krawczyk, S.N.; Potiaumpai, M.; Signorile, J.F. High-speed circuit training vs. hypertrophy training to improve physical function in sarcopenic obese adults: A randomized controlled trial. Exp. Gerontol. 2014, 60, 64–71. [Google Scholar] [CrossRef]
- Banitalebi, E.; Faramarzi, M.; Ghahfarokhi, M.M.; SavariNikoo, F.; Soltani, N.; Bahramzadeh, A. Osteosarcopenic obesity markers following elastic band resistance training: A randomized controlled trial. Exp. Gerontol. 2020, 135, 110884. [Google Scholar] [CrossRef] [PubMed]
- Villareal, D.T.; Aguirre, L.; Gurney, A.B.; SavariNikoo, F.; Soltani, N.; Bahramzadeh, A. Aerobic or Resistance Exercise, or Both, in Dieting Obese Older Adults. N. Engl. J. Med. 2017, 376, 1943–1955. [Google Scholar] [CrossRef]
- Magtouf, E.; Chortane, S.G.; Chortane, O.G.; Boyas, S.; Beaune, B.; Durand, S.; Maktouf, W. Influence of Concurrent Exercise Training on Ankle Muscle Activation during Static and Proactive Postural Control on Older Adults with Sarcopenic Obesity: A Multicenter, Randomized, and Controlled Trial. Eur. J. Investig. Health Psychol. Educ. 2023, 13, 2779–2794. [Google Scholar] [CrossRef] [PubMed]
- Ferhi, H.; Gaied Chortane, S.; Durand, S.; Beaune, B.; Boyas, S.; Maktouf, W. Effects of Physical Activity Program on Body Composition, Physical Performance, and Neuromuscular Strategies during Walking in Older Adults with Sarcopenic Obesity: Randomized Controlled Trial. Healthcare 2023, 11, 2294. [Google Scholar] [CrossRef]
- Park, J.; Kwon, Y.; Park, H. Effects of 24-Week Aerobic and Resistance Training on Carotid Artery Intima-Media Thickness and Flow Velocity in Elderly Women with Sarcopenic Obesity. J. Atheroscler. Thromb. 2017, 24, 1117–1124. [Google Scholar] [CrossRef]
- Vasconcelos, K.S.; Dias, J.M.; Araújo, M.C.; Pinheiro, A.C.; Moreira, B.S.; Dias, R.C. Effects of a progressive resistance exercise program with high-speed component on the physical function of older women with sarcopenic obesity: A randomized controlled trial. Braz. J. Phys. Ther. 2016, 20, 432–440. [Google Scholar] [CrossRef]
- Cunha, P.M.; Ribeiro, A.S.; Tomeleri, C.M.; Schoenfeld, B.J.; Silva, A.M.; Souza, M.F.; Nascimento, M.A.; Sardinha, L.B.; Cyrino, E.S. The effects of resistance training volume on osteosarcopenic obesity in older women. J. Sports Sci. 2018, 36, 1564–1571. [Google Scholar] [CrossRef]
- Chiu, S.C.; Yang, R.S.; Yang, R.J.; Chang, S.F. Effects of resistance training on body composition and functional capacity among sarcopenic obese residents in long-term care facilities: A preliminary study. BMC Geriatr. 2018, 18, 21. [Google Scholar] [CrossRef]
- Jung, W.S.; Kim, Y.Y.; Kim, J.W.; Park, H.Y. Effects of Circuit Training Program on Cardiovascular Risk Factors, Vascular Inflammatory Markers, and Insulin-like Growth Factor-1 in Elderly Obese Women with Sarcopenia. Rev. Cardiovasc. Med. 2022, 23, 134. [Google Scholar] [CrossRef] [PubMed]
- Liao, C.D.; Tsauo, J.Y.; Lin, L.F.; Huang, S.W.; Ku, J.W.; Chou, L.C.; Liou, T.H. Effects of elastic resistance exercise on body composition and physical capacity in older women with sarcopenic obesity: A CONSORT-compliant prospective randomized controlled trial. Medicine 2017, 96, e7115. [Google Scholar] [CrossRef]
- Liao, C.D.; Tsauo, J.Y.; Huang, S.W.; Ku, J.W.; Hsiao, D.J.; Liou, T.H. Effects of elastic band exercise on lean mass and physical capacity in older women with sarcopenic obesity: A randomized controlled trial. Sci. Rep. 2018, 8, 2317. [Google Scholar] [CrossRef]
- Mendes, C.; Carvalho, M.; Bravo, J.; Martins, S.; Raimundo, A. Possible Interaction Between Physical Exercise and Leptin and Ghrelin Changes Following Roux-en-Y Gastric Bypass in Sarcopenic Obesity Patients-A Pilot Study. Nutrients 2024, 16, 3913. [Google Scholar] [CrossRef]
- El Hajj, C.; Fares, S.; Chardigny, J.M.; Boirie, Y.; Walrand, S. Vitamin D supplementation and muscle strength in pre-sarcopenic elderly Lebanese people: A randomized controlled trial. Arch. Osteoporos. 2018, 14, 4. [Google Scholar] [CrossRef]
- Muscariello, E.; Nasti, G.; Siervo, M.; Di Maro, M.; Lapi, D.; D’Addio, G.; Colantuoni, A. Dietary protein intake in sarcopenic obese older women. Clin. Interv. Aging 2016, 11, 133–140. [Google Scholar] [CrossRef] [PubMed]
- Alemán-Mateo, H.; Macías, L.; Esparza-Romero, J.; Astiazaran-García, H.; Blancas, A.L. Physiological effects beyond the significant gain in muscle mass in sarcopenic elderly men: Evidence from a randomized clinical trial using a protein-rich food. Clin. Interv. Aging 2012, 7, 225–234. [Google Scholar] [CrossRef]
- Sammarco, R.; Marra, M.; Di Guglielmo, M.L.; Naccarato, M.; Contaldo, F.; Poggiogalle, E.; Donini, L.M.; Pasanisi, F. Evaluation of Hypocaloric Diet With Protein Supplementation in Middle-Aged Sarcopenic Obese Women: A Pilot Study. Obes. Facts 2017, 10, 160–167. [Google Scholar] [CrossRef]
- Ben Othman, R.; Ben Amor, N.; Mahjoub, F.; Berriche, O.; El Ghali, C.; Gamoudi, A.; Jamoussi, H. A clinical trial about effects of prebiotic and probiotic supplementation on weight loss, psychological profile and metabolic parameters in obese subjects. Endocrinol. Diabetes Metab. 2023, 6, e402. [Google Scholar] [CrossRef]
- Moyama, S.; Yamada, Y.; Makabe, N.; Fujita, H.; Araki, A.; Suzuki, A.; Seino, Y.; Shide, K.; Kimura, K.; Murotani, K.; et al. Efficacy and Safety of 6-Month High Dietary Protein Intake in Hospitalized Adults Aged 75 or Older at Nutritional Risk: An Exploratory, Randomized, Controlled Study. Nutrients 2023, 15, 2024. [Google Scholar] [CrossRef]
- Malafarina, V.; Uriz-Otano, F.; Malafarina, C.; Martinez, J.A.; Zulet, M.A. Effectiveness of nutritional supplementation on sarcopenia and recovery in hip fracture patients. A multi-centre randomized trial. Maturitas 2017, 101, 42–50. [Google Scholar] [CrossRef] [PubMed]
- Yin, Y.H.; Liu, J.Y.W.; Välimäki, M. Dietary behaviour change intervention for managing sarcopenic obesity among community-dwelling older people: A pilot randomised controlled trial. BMC Geriatr. 2023, 23, 597. [Google Scholar] [CrossRef]
- Wittmann, K.; Sieber, C.; von Stengel, S.; Kohl, M.; Freiberger, E.; Jakob, F.; Lell, M.; Engelke, K.; Kemmler, W. Impact of whole body electromyostimulation on cardiometabolic risk factors in older women with sarcopenic obesity: The randomized controlled FORMOsA-sarcopenic obesity study. Clin. Interv. Aging. 2016, 11, 1697–1706. [Google Scholar] [CrossRef] [PubMed]
- Reljic, D.; Konturek, P.C.; Herrmann, H.J.; Neurath, M.F.; Zopf, Y. Effects of whole-body electromyostimulation exercise and caloric restriction on cardiometabolic risk profile and muscle strength in obese women with the metabolic syndrome: A pilot study. J. Physiol. Pharmacol. 2020, 71, 89–98. [Google Scholar] [CrossRef]
- Kemmler, W.; Teschler, M.; Weissenfels, A.; Bebenek, M.; von Stengel, S.; Kohl, M.; Freiberger, E.; Goisser, S.; Jakob, F.; Sieber, C.; et al. Whole-body electromyostimulation to fight sarcopenic obesity in community-dwelling older women at risk. Resultsof the randomized controlled FORMOsA-sarcopenic obesity study. Osteoporos. Int. 2016, 27, 3261–3270. [Google Scholar] [CrossRef]
- Kemmler, W.; Weissenfels, A.; Teschler, M.; Willert, S.; Bebenek, M.; Shojaa, M.; Kohl, M.; Freiberger, E.; Sieber, C.; von Stengel, S. Whole-body electromyostimulation and protein supplementation favorably affect sarcopenic obesity in community-dwelling older men at risk: The randomized controlled FranSO study. Clin. Interv. Aging 2017, 12, 1503–1513. [Google Scholar] [CrossRef]
- Kemmler, W.; Kohl, M.; Freiberger, E.; Sieber, C.; von Stengel, S. Effect of whole-body electromyostimulation and/or protein supplementation on obesity and cardiometabolic risk in older men with sarcopenic obesity: The randomized controlled FranSO trial. BMC Geriatr. 2018, 18, 70. [Google Scholar] [CrossRef]
- Zhou, X.; Xing, B.; He, G.; Lyu, X.; Zeng, Y. The Effects of Electrical Acupuncture and Essential Amino Acid Supplementation on Sarcopenic Obesity in Male Older Adults: A Randomized Control Study. Obes. Facts 2018, 11, 327–334. [Google Scholar] [CrossRef]
- Abdollahi Diba, M.; Sari Sarraf, V.; Amirsasan, R.; Dabbagh Nikoukheslat, S. Effect of a 12-Week High-Calorie-Expenditure Multimodal Exercise Program on Health Indices in Women With Overweight: Protocol for a Randomized Controlled Trial. JMIR Res. Protoc. 2024, 13, e51599. [Google Scholar] [CrossRef]
- Chen, L.; Zhou, H.; Gong, Y.; Tang, Y.; Su, H.; Zhang, Z.; Tong, P.; Chen, G. Clinical outcome changes in sarcopenic obesity: A meta-analysis of exercise training methods. BMC Geriatr. 2025, 25, 33. [Google Scholar] [CrossRef]
- Wilson, J.M.; Loenneke, J.P.; Jo, E.; Wilson, G.J.; Zourdos, M.C.; Kim, J.S. The effects of endurance, strength, and power training on muscle fiber type shifting. J. Strength Cond. Res. 2012, 26, 1724–1729. [Google Scholar] [CrossRef] [PubMed]
- Wang, X.; Lv, C.; Qin, X.; Ji, S.; Dong, D. Effectiveness of plyometric training vs. complex training on the explosive power of lower limbs: A Systematic review. Front. Physiol. 2023, 13, 1061110. [Google Scholar] [CrossRef] [PubMed]
- Watson, S.L.; Weeks, B.K.; Weis, L.J.; Harding, A.T.; Horan, S.A.; Beck, B.R. High-Intensity Resistance and Impact Training Improves Bone Mineral Density and Physical Function in Postmenopausal Women With Osteopenia and Osteoporosis: The LIFTMOR Randomized Controlled Trial. J. Bone Miner. Res. 2018, 33, 211–220, Erratum in J. Bone Miner. Res. 2019, 34, 572. [Google Scholar] [CrossRef] [PubMed]
- Wen, P.; Sun, Z.; Gou, F.; Wang, J.; Fan, Q.; Zhao, D.; Yang, L. Oxidative stress and mitochondrial impairment: Key drivers in neurodegenerative disorders. Ageing Res. Rev. 2025, 104, 102667. [Google Scholar] [CrossRef]
- Green, A.P.; Klimm, F.; Marshall, A.S.; Leetmaa, R.; Aryaman, J.; Gómez-Durán, A.; Chinnery, P.F.; Jones, N.S. Cryptic mitochondrial DNA mutations coincide with mid-late life and are pathophysiologically informative in single cells across tissues and species. Nat. Commun. 2025, 16, 2250. [Google Scholar] [CrossRef]
- Jia, H.; Song, Y.; Hua, Y.; Li, K.; Li, S.; Wang, Y. Molecular Mechanism of Aerobic Exercise Ameliorating Myocardial Mitochondrial Injury in Mice with Heart Failure. Int. J. Mol. Sci. 2025, 26, 2136. [Google Scholar] [CrossRef]
- Liu, S.; Yu, C.; Xie, L.; Niu, Y.; Fu, L. Aerobic Exercise Improves Mitochondrial Function in Sarcopenia Mice Through Sestrin2 in an AMPKα2-Dependent Manner. J. Gerontol. A Biol. Sci. Med. Sci. 2021, 76, 1161–1168. [Google Scholar] [CrossRef]
- Zhao, Y.C.; Gao, B.H. Integrative effects of resistance training and endurance training on mitochondrial remodeling in skeletal muscle. Eur. J. Appl. Physiol. 2024, 124, 2851–2865. [Google Scholar] [CrossRef]
- Panwar, V.; Singh, A.; Bhatt, M.; Tonk, R.K.; Azizov, S.; Raza, A.S.; Sengupta, S.; Kumar, D.; Garg, M. Multifaceted role of mTOR (mammalian target of rapamycin) signaling pathway in human health and disease. Signal Transduct. Target. Ther. 2023, 8, 375. [Google Scholar] [CrossRef]
- Theodorakopoulos, C.; Jones, J.; Bannerman, E.; Greig, C.A. Effectiveness of nutritional and exercise interventions to improve body composition and muscle strength or function in sarcopenic obese older adults: A systematic review. Nutr. Res. 2017, 43, 3–15. [Google Scholar] [CrossRef] [PubMed]
- White, P.J.; Wewer Albrechtsen, N.J.; Campbell, J.E. Islet hormones at the intersection of glucose and amino acid metabolism. Nat. Rev. Endocrinol. 2025. [Google Scholar] [CrossRef]
- Shen, X.; Ma, C.; Yang, Y.; Liu, X.; Wang, B.; Wang, Y.; Zhang, G.; Bian, X.; Zhang, N. The Role and Mechanism of Probiotics Supplementation in Blood Glucose Regulation: A Review. Foods 2024, 13, 2719. [Google Scholar] [CrossRef] [PubMed]
- Heidland, A.; Fazeli, G.; Klassen, A.; Sebekova, K.; Hennemann, H.; Bahner, U.; Di Iorio, B. Neuromuscular electrostimulation techniques: Historical aspects and current possibilities in treatment of pain and muscle waisting. Clin. Nephrol. 2013, 79 (Suppl. S1), S12–S23. [Google Scholar] [CrossRef]
- Lin, X.; Hu, Y.; Sheng, Y. The Effect of Electrical Stimulation Strength Training on Lower Limb Muscle Activation Characteristics During the Jump Smash Performance in Badminton Based on the EMS and EMG Sensors. Sensors 2025, 25, 577. [Google Scholar] [CrossRef]
- Rodrigues-Santana, L.; Hugo, L.; Pérez-Gómez, J.; Hernández-Mocholí, M.A.; Carlos-Vivas, J.; Saldaña-Cortés, P.; Contreras-Barraza, N.; Adsuar, J.C. The effects of whole-body muscle stimulation on body composition and strength parameters: A PRISMA systematic review and meta-analysis. Medicine 2023, 102, e32668. [Google Scholar] [CrossRef]
- Kistner, T.M.; Pedersen, B.K.; Lieberman, D.E. Interleukin 6 as an energy allocator in muscle tissue. Nat. Metab. 2022, 4, 170–179. [Google Scholar] [CrossRef] [PubMed]
- Jameson, T.S.O.; Caldow, M.K.; Stephens, F.; Denehy, L.; Lynch, G.S.; Koopman, R.; Krajcova, A.; Urban, T.; Berney, S.; Duska, F.; et al. Inflammation and altered metabolism impede efficacy of functional electrical stimulation in critically ill patients. Crit. Care 2023, 27, 428. [Google Scholar] [CrossRef]
- Prat-Ortega, G.; Ensel, S.; Donadio, S.; Borda, L.; Boos, A.; Yadav, P.; Verma, N.; Ho, J.; Carranza, E.; Frazier-Kim, S.; et al. First-in-human study of epidural spinal cord stimulation in individuals with spinal muscular atrophy. Nat. Med. 2025, 31, 1246–1256. [Google Scholar] [CrossRef]
- Ikeda, T.; Katayama, S.; Kitagawa, T. The combined intervention of neuromuscular electrical stimulation and nutrition therapy: A scoping review. Clin. Nutr. ESPEN 2023, 54, 239–250. [Google Scholar] [CrossRef]
- Verceles, A.C.; Serra, M.; Davis, D.; Alon, G.; Wells, C.L.; Parker, E.; Sorkin, J.; Bhatti, W.; Terrin, M.L. Combining exercise, protein supplementation and electric stimulation to mitigate muscle wasting and improve outcomes for survivors of critical illness-The ExPrES study. Heart Lung 2023, 58, 229–235. [Google Scholar] [CrossRef] [PubMed]
- Narvaez, G.; Apaflo, J.; Wagler, A.; McAinch, A.; Bajpeyi, S. The additive effect of neuromuscular electrical stimulation and resistance training on muscle mass and strength. Eur. J. Appl. Physiol. 2025. [Google Scholar] [CrossRef] [PubMed]
- Sudo, M.; Kitajima, D.; Takagi, Y.; Mochizuki, K.; Fujibayashi, M.; Costello, J.T.; Ando, S. Effects of voluntary exercise and electrical muscle stimulation on reaction time in the Go/No-Go task. Eur. J. Appl. Physiol. 2024, 124, 3571–3581. [Google Scholar] [CrossRef] [PubMed]


| Author (Year) | Country/Area | Type of Experiment | Participants | Subgroups and Numbers | Intervention | Comparison | Duration | Outcomes |
|---|---|---|---|---|---|---|---|---|
| Exercise | ||||||||
| Shih-Wei Huang et al. (2017) [21] | Taiwan | Randomized single-blind (assessor-blind) controlled trial | 35 SO patients (aged ≥ 60; all females) | IG: 18; CG: 17 | Progressive elastic band training 3 times a week for 55 min (with warm-up, training, and cool-down). | Received only one health education with no follow-up exercise intervention | 12 weeks | Weight, BMI, SMI, BF%, TG, HDL, LDL, CRP |
| André Bonadias Gadelha et al. (2016) [22] | Brazil | Randomized controlled trial | 133 SO patients (aged 60–80; all females) | IG: 69; CG: 64 | Resistance training program, 3 times a week | Maintaining daily habits, focusing on diet and exercise | 24 weeks | Weight, BMI, BF%, TFFM, AFFM |
| Anoop Balachandran et al. (2014) [23] | America | Randomized controlled single-blind trial | 17 SO patients (aged 60–90; M/F: 16/1) | IG: 8; CG: 9 | High-speed circuit training, 2 times per week | 15 weeks of traditional strength training 2×/week | 15 weeks | SPPB, leg press power and 1 RM, chest press power and 1 RM, GS, BF%, SMI |
| Ebrahim Banitalebi et al. (2020) [24] | Iran | Randomized controlled trial | 63 SO patients (aged 65–80, all females) | IG: 32; CG: 31 | Resistance training with elastic bands | Maintaining daily eating and activity habits | 12 weeks | weight, BMI, BF%, BMC, BMD |
| Dennis T et al. (2017) [25] | America | Randomized controlled trial | 80 obese sedentary older adults (aged ≥ 65; M/F: 57/103) | IG: 40; CG: 40 | weight management program + combined training | No weight management or exercise | 26 weeks | Weight, LM, FM, TF, BMD at total hip, Total 1 RM, HS, SF-36 |
| Elmoetez Magtouf (2023) [26] | Tunis | Single-blind, prospective, controlled, randomized multicenter trials | 50 SO patients (aged > 65, not mentioned) | IG: 25; CG: 25 | Participate in the 4-month TMP program three times a week, including motor skill exercises, strengthening exercises, and posture exercises. | Maintaining daily eating and activity habits | 4 months | Weight, BMI, LBM |
| Hamza Ferhi et al. (2023) [27] | Tunis | Single-blind, multicenter, randomized controlled trials | 40 SO patients (aged > 65, not mentioned) | IG: 20; CG: 20 | Posture, strengthening, and motricity (PSM) training program, twice a week. | Maintenance of daily activities without intervention | 24 weeks | BMI, LBM, Maximal HS |
| Jinkee Park et al. (2017) [28] | South Korea | Randomized single-blind controlled community trials | 50 SO patients (aged ≥ 65; all females) | IG: 25; CG: 25 | Combined aerobic and resistance training | Maintain daily activities and receive health education | 24 weeks | BMI, BF%, ASM, WC, TC, TG, HDL-C, LDL-C, CRP, SBP, DBP |
| Karina S et al. (2016) [29] | Brazil | Prospective Registry, Two-Arm, Randomized Controlled Trial | 28 obese and at risk of sarcopenia older adults (aged 65–80; all females) | IG: 14; CG: 14 | Lower extremity resistance exercise program | Weekly telephone monitoring of health status | 10 weeks | Knee extension strength, power, HS, SF-36 |
| Paolo M et al. (2018) [30] | Brazil | Randomized controlled trial | 41 SO patients (aged ≥ 60, all females) | EG: 20; CG: 21 | Three sets of resistance training 3 times per week | No physical exercise activities | 12 weeks | Total strength, BF%, BMD |
| Shu-Ching Chiu et al. (2018) [31] | Taiwan | Randomized controlled trial | 70 obese and at risk of sarcopenia older adults (aged ≥ 60; M/F: 35/35) | IG: 36; CG: 36 | Resistance training in a sandbag chair 2 times a week | Receive routine care with no additional training | 12 weeks | ASM, ASMI, BF%, HS |
| Won-Sang Jung et al. (2022) [32] | South Korea | Randomized controlled trial | 28 SO patients (aged ≥ 65, all females) | IG: 14; CG: 14 | Circuit training, 3 times per week | Maintenance of daily activities without sports training | 12 weeks | BMI, FM, ASM, SBP, HDL-C, HOMA-IR, CRP, IL-6, IGF-1 |
| Chun-De Liao et al. (2017) [33] | Taiwan | Prospective randomized controlled trials | 46 SO patients (aged 60–80, all females) | IG: 25; CG: 21 | Elastic resistance training | No exercise intervention | 12 weeks | TFFM, TFM, BF%, HS |
| Chun-De Liao et al. (2018) [34] | Taiwan | Prospective randomized controlled trials | 56 SO patients (aged 60–80, all females) | IG: 33; CG: 23 | Elastic band resistance training | No exercise intervention | 12 weeks | BF%, AMM, SMI, AMI, SF-36, |
| Cláudia Mendes et al. (2024) [35] | Portugal | Randomized controlled trial | 22 SO patients (aged 48–60, M/F: 18/4) | IG: 12; CG: 10 | Cardio and strength training 3 times per week | Usual standard of care | 16 weeks | Weight, BMI, BF, HS, LM, BMC, BMD |
| Nutrition | ||||||||
| Cynthia El Hajj et al. (2018) [36] | Lebanon | Randomized, controlled, double-blind trials | 115 Pre-oligomyosis patients (mean age 73.31 ± 2.05 years; M/F: 62/66) | IG: 60; CG: 55 | 10,000 IU of vitamin D supplements 3 times a week | Placebo 3 times per week | 6 months | ASMM, BMI, FM, WC, LBM, HS |
| Espedita Muscariello et al. (2016) [37] | Italy | Randomized controlled trial | 104 SO patients (aged ≥ 65; all females) | IG: 54; CG: 50 | Dietary intake of 1.2 g of protein per kg of ideal body weight per day | Dietary intake of 0.8 g of protein per kg of ideal body weight per day | 3 months | BMI, WC, FM, HS |
| Heliodoro Alemán-Mateo et al. (2012) [38] | Mexico | Randomized controlled trial | 40 SO patients (aged ≥ 60; M/F: 17/23) | IG: 20; CG: 20 | Additional 210 g of ricotta cheese per day | Maintained a daily diet with no additional interventions | 3 months | Strength, IGF-1, insulin, HOMA-IR, BF%, LBM, weight, glucose, Hb, TG, TC, |
| Rosa Sammarco et al. (2017) [39] | Italy | Randomized controlled trial | 18 SO patients (aged 45–74; all females) | IG: 9; CG: 9 | Low-calorie, high-protein diet (1.2–1.4 g/kg /day) | Low-calorie diet + placebo | 4 months | Weight, FFM, FAT (% and kg), WC, HS, SPPB, SF-36 |
| Rym Ben Othmale et al. (2023) [40] | Tunis | Randomized controlled trial | 30 SO patients (aged ≥ 45; M/F: 3/42) | IG: 15; CG: 15 | Low-carb, low-energy diet + 30 g carob/day | Low-carb, low-energy diet only | 1 month | BMI, WC, FM, SBP, Hb, HOMA-I, HDL, LDL, TG |
| Shota Moyama et al. (2023) [41] | Japan | Multicenter, open-label, two-arm, randomized, controlled clinical trial | 93 oligomyosis patients (aged ≥ 75; M/F: 51/42) | IG: 44 CG: 49 | Dietary intake of 1.5 g of protein per kg of ideal body weight per day | Dietary intake of 1.0 g of protein per kg of ideal body weight per day | 6 months | BM, SMI, HS, HB, CRP |
| Vincenzo Malafarina et al. (2017) [42] | Spanish | Multicenter, randomized, open-label trial | 92 oligomyosis patients (aged ≥ 65; M/F: 22/70) | IG: 49; CG: 43 | Standard diet + HMB-enriched oral nutritional supplement | Standard diet only | 6 weeks | BMI, HS, ASMM, FM, CRP, IL-6, TNF-α, HOMA-IR, |
| Yue-Heng Yin et al. (2023) [43] | China | Prospective, two-arm, assessor-blinded, parallel-group, pilot randomized controlled trial | 60 SO patients (aged ≥ 60; M/F: 18/42) | IG: 30; CG: 30 | Eating Behavior Change Intervention Programe | Receive regular health-related lectures | 15 weeks | BMI, SMI, HS, WC, 6-m GS, SPPB, SF-36, |
| Electromyostimulation | ||||||||
| Katharina Wittmalen et al. (2016) [44] | Germany | Single-center, controlled, semi-blind trial, parallel-group design with stratification and randomization | 50 SO patients (aged ≥ 70; all females) | IG: 25; CG: 25 | WB-NMES,1 time per week for 20 min | Maintained a regular lifestyle. | 6 months | WC, HDL-C |
| D. RELJIC et al. (2020) [45] | Germany | Randomized controlled trial | 29 central obesity patients (aged ≥ 50; all females) | IG: 15; CG: 14 | 2×/week WB-NMES, 20 min/session | No intervention | 12 weeks | BM, BF%, TFFM, maximum muscle strength, SBP, DBP, TG |
| W. Kemmler et al. (2016) [46] | Germany | Single-center, controlled, semi-blind trial, parallel-group design with stratification and randomization | 50 SO patients (aged ≥ 70; all females) | IG: 25; CG: 25 | WB-NMES (1 time per week for 20 min) + 40 g nutritional supplement daily | Maintained a regular lifestyle. | 26 weeks | SMI, HS, BF% |
| Wolfgang Kemmler et al. (2017) [47] | Germany | Randomized controlled trial, parallel-group design | 67 SO patients (aged ≥ 70; all males) | IG: 33; CG: 34 | WB-NMES + daily whey protein powder supplements | No intervention | 16 weeks | SMI, HS, BF% |
| Wolfgang Kemmler et al. (2018) [48] | Germany | Randomized controlled trial, parallel-group design | 67 SO patients (aged ≥ 70; all males) | IG: 33; CG: 34 | WB-NMES + daily whey protein powder supplements | No intervention | 16 weeks | BFFM, WC, TC/HDL-C |
| Xin Zhou et al. (2018) [49] | China | Randomized controlled trial | 48 SO patients (aged 60–80; all males) | IG: 24; CG: 24 | NMES (20 min every 3 days) + oral essential amino acids (20 g/day) twice daily. | Essential amino acids administered orally twice daily (20 g/day) | 28 weeks | BF%, SMI |
| Author (Year) | Diagnostic Criteria for Sarcopenic Obesity | Body Composition Assessment Method | |
|---|---|---|---|
| Assessment of Muscle | Assessment of Body Fat | ||
| Shih-Wei Huang et al. (2017) [21] | ASM/weight < 27.6% | BMI > 30 kg/m2 | DX, BIA |
| André Bonadias Gadelha et al. (2016) [22] | Minimal physical activity, risk of sarcopenia | BMI ≥ 30 kg/m2 | DXA |
| Anoop Balachandran et al. (2014) [23] | SMI (male < 10.76 kg/m2, female < 6.76 kg/m2) | BMI ≥ 30 kg/m2 | BIA |
| Ebrahim Banitalebi et al. (2020) [24] | 10 m walking test: GS ≤ 1 (m/s) | BMI > 30 kg/m2 | DXA |
| Dennis T et al. (2017) [25] | Mild to moderate weakness; Physical Performance Test (PPT) scores between 18 and 31 | BMI ≥ 30 kg/m2 | DXA |
| Elmoetez Magtouf (2023) [26] | HS < 17 N and GS < 1.0 m/s | BMI > 30 kg/m2 | BIA |
| Hamza Ferhi et al. (2023) [27] | HS < 17 N and GS < 1.0 m/s | BMI > 30 kg/m2 | BI, DXA |
| Jinkee Park et al. (2017) [28] | ASM/weight < 25.1% | BMI ≥ 25 kg/m2 | BIA |
| Karina S et al. (2016) [29] | HS ≤ 21 kg | BMI > 30 kg/m2 | BIA |
| Paolo M et al. (2018) [30] | Minimal physical activity, risk of sarcopenia | BMI > 30 kg/m2 | DXA |
| Shu-Ching Chiu et al. (2018) [31] | ASM/weight (male < 37.15%, female < 32.26%) | BF% (male ≥ 29%, female ≥ 40%) or BMI (25.4–26.1) kg/m2 | BIA |
| Won-Sang Jung et al. (2022) [32] | SMI ≤ 5.4 kg/m2 | BMI ≥ 32 kg/m2 | DXA |
| Chun-De Liao et al. (2017) [33] | ASM/weight < 27.6% | BF% > 30% | DXA |
| Chun-De Liao et al. (2018) [34] | ASM/weight < 27.6% | BF% > 30% | DXA |
| Cláudia Mendes et al. (2024) [35] | Low muscle strength: HS (male < 27 kg, female < 16 kg; Low muscle mass: ASM/weight (male < 28.27%, female < 23.47%) | Male: BMI ≥ 26 kg/m2 Female: BMI ≥ 30 kg/m2 | DXA |
| Cynthia El Hajj et al. (2018) [36] | SMI (men < 7.26 kg/m2, female < 5.45 kg/m2) | BMI ≥ 30 kg/m2 | BIA |
| Espedita Muscariello et al. (2016) [37] | SMI < 7.3 kg/m2 | BMI ≥ 30 kg/m2 | BIA |
| Heliodoro Alemán-Mateo et al. (2012) [38] | SMI < 7.89 kg/m2 | BMI > 30 kg/m2 | DXA |
| Rosa Sammarco et al. (2017) [39] | FFM < 90% of ideal FFM | BF% > 34.8% | BIA |
| Rym Ben Othmale et al. (2023) [40] | Weak muscle strength and risk of sarcopenia | BMI ≥ 30 kg/m2 | BIA |
| Shota Moyama et al. (2023) [41] | SMI (male < 7.0 kg/m2, female < 5.7 kg/m2); HS (male < 28.0 kg, female < 18.0 kg) | BMI ≥ 30 kg/m2 | BIA |
| Vincenzo Malafarina et al. (2017) [42] | SMI (female ≤ 5.67 kg/m2, male ≤ 7.25 kg/m2); GS < 0.8 m/s; HS (female < 20 kg, male < 30 kg) | At risk of obesity | BIA |
| Yue-Heng Yin et al. (2023) [43] | HS (male ≤ 28 kg, female < 18 kg); 5 chair sit-up tests in ≥12 s | BMI ≥ 28 kg/m2; WC: male ≥ 85 cm, female ≥ 80 cm | BIA |
| Katharina Wittmalen et al. (2016) [44] | SMI < 5.75 kg/m2 | BF% > 35% | DX, BIA |
| D. RELJIC et al. (2020) [45] | Habitually sedentary, at risk for sarcopenia | WC > 80 cm | BIA |
| W. Kemmler et al. (2016) [46] | SMI < 5.75 kg/m2 | BF% > 35% | DXA, BIA |
| Wolfgang Kemmler et al. (2017) [47] | SMI < 7.89 kg/m2 | BF% > 27% | BIA |
| Wolfgang Kemmler et al. (2018) [48] | SMI < 7.89 kg/m2 | BF% > 27% | BIA |
| Xin Zhou et al. (2018) [49] | SMI < 7.0 kg/m2 | BF% ≥ 25% | BIA |
| Indicators | Intervention | Subgroup | RCTs (Participants) | MD [95% CI] | p | I2 (%) | Inter-Group p-Values | Inter-Group I2 (%) |
|---|---|---|---|---|---|---|---|---|
| Anthropometric indicators | ||||||||
| BF% | exercise | RT | 6 (374) | −1.61 [−2.59, −0.64] | <0.01 | 52 | 0.12 | 58.8 |
| MT | 7 (277) | −3.85 [−6.49, −1.21] | <0.01 | 80 | ||||
| nutrition | HP | 2 (78) | −0.09 [−2.43, 2.24] | 0.94 | 0 | 0.62 | 0 | |
| ONS | 1 (115) | 0.55 [−0.49, 1.59] | 0.3 | Not applicable | ||||
| NMES | WB-NMES | 2 (79) | −0.07 [−0.65, 0.52] | 0.83 | 0 | <0.01 | 93.3 | |
| WB-NMES&ns | 3 (182) | −2.98 [−4.34, −1.62] | <0.01 | 85 | ||||
| weight | exercise | RT | 3 (231) | −0.44 [−1.57,0.69] | 0.45 | 0 | 0.03 | 78.7 |
| MT | 5 (220) | −4.79 [−8.55, −1.02] | 0.01 | 84 | ||||
| nutrition | HP | 4 (212) | 0.17 [−2.74, 3.09] | 0.91 | 0 | 0.77 | 0 | |
| ONS | 2 (145) | −0.34 [−2.38, 1.69] | 0.74 | 0 | ||||
| BMI | exercise | RT | 3 (231) | −0.18 [−0.68, 0.31] | 0.47 | 0 | 0.04 | 77.3 |
| MT | 4 (140) | −1.1 [−1.99, −0.39] | <0.01 | 0 | ||||
| nutrition | HP | 4 (351) | −0.07 [−0.55, 0.41] | 0.78 | 27 | 0.79 | 0 | |
| ONS | 1 (115) | 0.42 [−3.23, 4.07] | 0.82 | Not applicable | ||||
| FM | exercise | RT | 2 (81) | −1.25 [−1.40, −1.10] | <0.01 | 0 | <0.01 | 91.7 |
| MT | 3 (170) | −10.39 [−15.56, −5.22] | <0.01 | 95 | ||||
| nutrition | HP | 5 (316) | 0.16 [−1.07, 1.39] | 0.8 | 0 | 0.16 | 48.3 | |
| ONS | 2 (145) | −0.89 [−1.73, −0.05] | 0.04 | 50 | ||||
| TFFM | exercise | RT | 2 (179) | 0.74 [0.62, 0.87] | <0.01 | 0 | 0.51 | 0 |
| MT | 5 (220) | 2.27 [−2.27, 6.82] | 0.33 | 96 | ||||
| nutrition | HP | 4 (256) | 0.68 [−0.24, 1.59] | 0.15 | 0 | 0.74 | 0 | |
| ONS | 2 (145) | 0.94 [−0.28, 2.16] | 0.13 | 0 | ||||
| SMI | exercise | RT | 3 (132) | 0.83 [0.20, 1.46] | 0.01 | 13 | 0.06 | 71.6 |
| MT | 2 (87) | 0.14 [−0.22, 0.49] | 0.45 | 0 | ||||
| NMES | WB-NMES | 1 (50) | 0.21 [0.12, 0.30] | <0.01 | Not applicable | 0.3 | 8.1 | |
| WB-NMES&ns | 2 (115) | 0.26 [0.23, 0.30] | <0.01 | 53 | ||||
| WC | nutrition | HP | 3 (182) | 1.01 [−1.07, 3.08] | 0.34 | 54 | 0.45 | 0 |
| ONS | 2 (145) | −0.67 [−4.49, 3.14] | 0.73 | 77 | ||||
| NMES | WB-NMES | 2 (79) | −1.41 [−2.60, −0.21] | 0.02 | 0 | 0.54 | 0 | |
| WB-NMES&ns | 1 (67) | −1.84 [−2.58, −1.10] | <0.01 | Not applicable | ||||
| ASM | nutrition | HP | 2 (134) | 0.79 [−0.56, 2.15] | 0.25 | 24 | 0.84 | 0 |
| ONS | 1 (115) | 0.56 [−1.22, 2.34] | 0.54 | Not applicable | ||||
| BMD | exercise | RT | 3 (139) | 0.02 [−0.02, 0.07] | 0.34 | 0 | 0.1 | 64 |
| MT | 2 (102) | −0.02 [−0.03, −0.01] | <0.01 | 0 | ||||
| Physical function indicators | ||||||||
| HS | exercise | RT | 1 (46) | 2.19 [1.81, 2.57] | <0.01 | Not applicable | 0.04 | 75.3 |
| MT | 6 (249) | 3.19 [2.29, 4.09] | <0.01 | 41 | ||||
| nutrition | HP | 6 (409) | 1.35 [0.43, 2.26] | <0.01 | 0 | 0.98 | 0 | |
| ONS | 2 (145) | 1.36 [0.45, 2.28] | <0.01 | 0 | ||||
| GS | exercise | RT | 4 (180) | 0.15 [−0.00, 0.31] | 0.05 | 92 | 0.26 | 20.2 |
| MT | 2 (120) | 0.29 [0.10, 0.48] | <0.01 | 85 | ||||
| 1 RM | exercise | RT | 1 (41) | 33.10 [22.02, 44.18] | <0.01 | Not applicable | 0.68 | 0 |
| MT | 2 (97) | 21.40 [−32.20, 75.00] | 0.43 | 86 | ||||
| Physiological indicators | ||||||||
| TG | exercise | RT | 1 (35) | −0.50 [−51.99, 50.99] | 0.98 | Not applicable | 0.96 | 0 |
| MT | 2 (78) | 0.86 [−5.13, 6.86] | 0.78 | 30 | ||||
| nutrition | HP | 2 (134) | 1.30 [−16.51, 19.10] | 0.89 | 0 | 0.93 | 0 | |
| ONS | 1 (30) | −0.40 [−33.43, 32.63] | 0.98 | Not applicable | ||||
| NMES | WB-NMES | 2 (79) | −1.63 [−18.77, 15.52] | 0.85 | 40 | 0.62 | 0 | |
| WB-NMES&ns | 1 (67) | −8.30 [−28.55, 11.95] | 0.42 | Not applicable | ||||
| TC | nutrition | HP | 2 (134) | 4.45 [−8.96, 17.86] | 0.52 | 0 | 0.79 | 0 |
| ONS | 1 (30) | 0.00 [−30.48, 30.48] | 1 | Not applicable | ||||
| GLU | nutrition | HP | 2 (134) | 4.66 [0.43, 8.88] | 0.03 | 0 | <0.01 | 90.9 |
| ONS | 1 (30) | −2.60 [−3.30, −1.90] | <0.01 | Not applicable | ||||
| Hb | nutrition | HP | 3 (227) | −0.39 [−0.78, −0.00] | 0.05 | 0 | 0.69 | 0 |
| ONS | 1 (30) | −0.20 [−1.06, 0.66] | 0.65 | Not applicable | ||||
| HOMA-IR | nutrition | HP | 2 (124) | −2.02 [−7.41, 3.37] | 0.46 | 98 | 0.47 | 0 |
| ONS | 1 (40) | 0.00 [−0.73, 0.73] | 1 | Not applicable | ||||
Disclaimer/Publisher’s Note: The statements, opinions and data contained in all publications are solely those of the individual author(s) and contributor(s) and not of MDPI and/or the editor(s). MDPI and/or the editor(s) disclaim responsibility for any injury to people or property resulting from any ideas, methods, instructions or products referred to in the content. |
© 2025 by the authors. Licensee MDPI, Basel, Switzerland. This article is an open access article distributed under the terms and conditions of the Creative Commons Attribution (CC BY) license (https://creativecommons.org/licenses/by/4.0/).
Share and Cite
Xu, S.; Tu, S.; Hao, X.; Chen, X.; Pan, D.; Liao, W.; Wu, R.; Yang, L.; Xia, H.; Wang, S.; et al. Exercise, Nutrition, and Neuromuscular Electrical Stimulation for Sarcopenic Obesity: A Systematic Review and Meta-Analysis of Management in Middle-Aged and Older Adults. Nutrients 2025, 17, 1504. https://doi.org/10.3390/nu17091504
Xu S, Tu S, Hao X, Chen X, Pan D, Liao W, Wu R, Yang L, Xia H, Wang S, et al. Exercise, Nutrition, and Neuromuscular Electrical Stimulation for Sarcopenic Obesity: A Systematic Review and Meta-Analysis of Management in Middle-Aged and Older Adults. Nutrients. 2025; 17(9):1504. https://doi.org/10.3390/nu17091504
Chicago/Turabian StyleXu, Shan, Siying Tu, Xiaoyu Hao, Xiangjun Chen, Da Pan, Wang Liao, Ruipeng Wu, Ligang Yang, Hui Xia, Shaokang Wang, and et al. 2025. "Exercise, Nutrition, and Neuromuscular Electrical Stimulation for Sarcopenic Obesity: A Systematic Review and Meta-Analysis of Management in Middle-Aged and Older Adults" Nutrients 17, no. 9: 1504. https://doi.org/10.3390/nu17091504
APA StyleXu, S., Tu, S., Hao, X., Chen, X., Pan, D., Liao, W., Wu, R., Yang, L., Xia, H., Wang, S., & Sun, G. (2025). Exercise, Nutrition, and Neuromuscular Electrical Stimulation for Sarcopenic Obesity: A Systematic Review and Meta-Analysis of Management in Middle-Aged and Older Adults. Nutrients, 17(9), 1504. https://doi.org/10.3390/nu17091504