
The Impact of Dietary Interventions on Metabolic Outcomes in Metabolic Dysfunction-Associated Steatotic Liver Disease (MASLD) and Comorbid Conditions, Including Obesity and Type 2 Diabetes
 , ,
, ,
Abstract
1. Introduction
2. Materials and Methods
2.1. Search Strategy
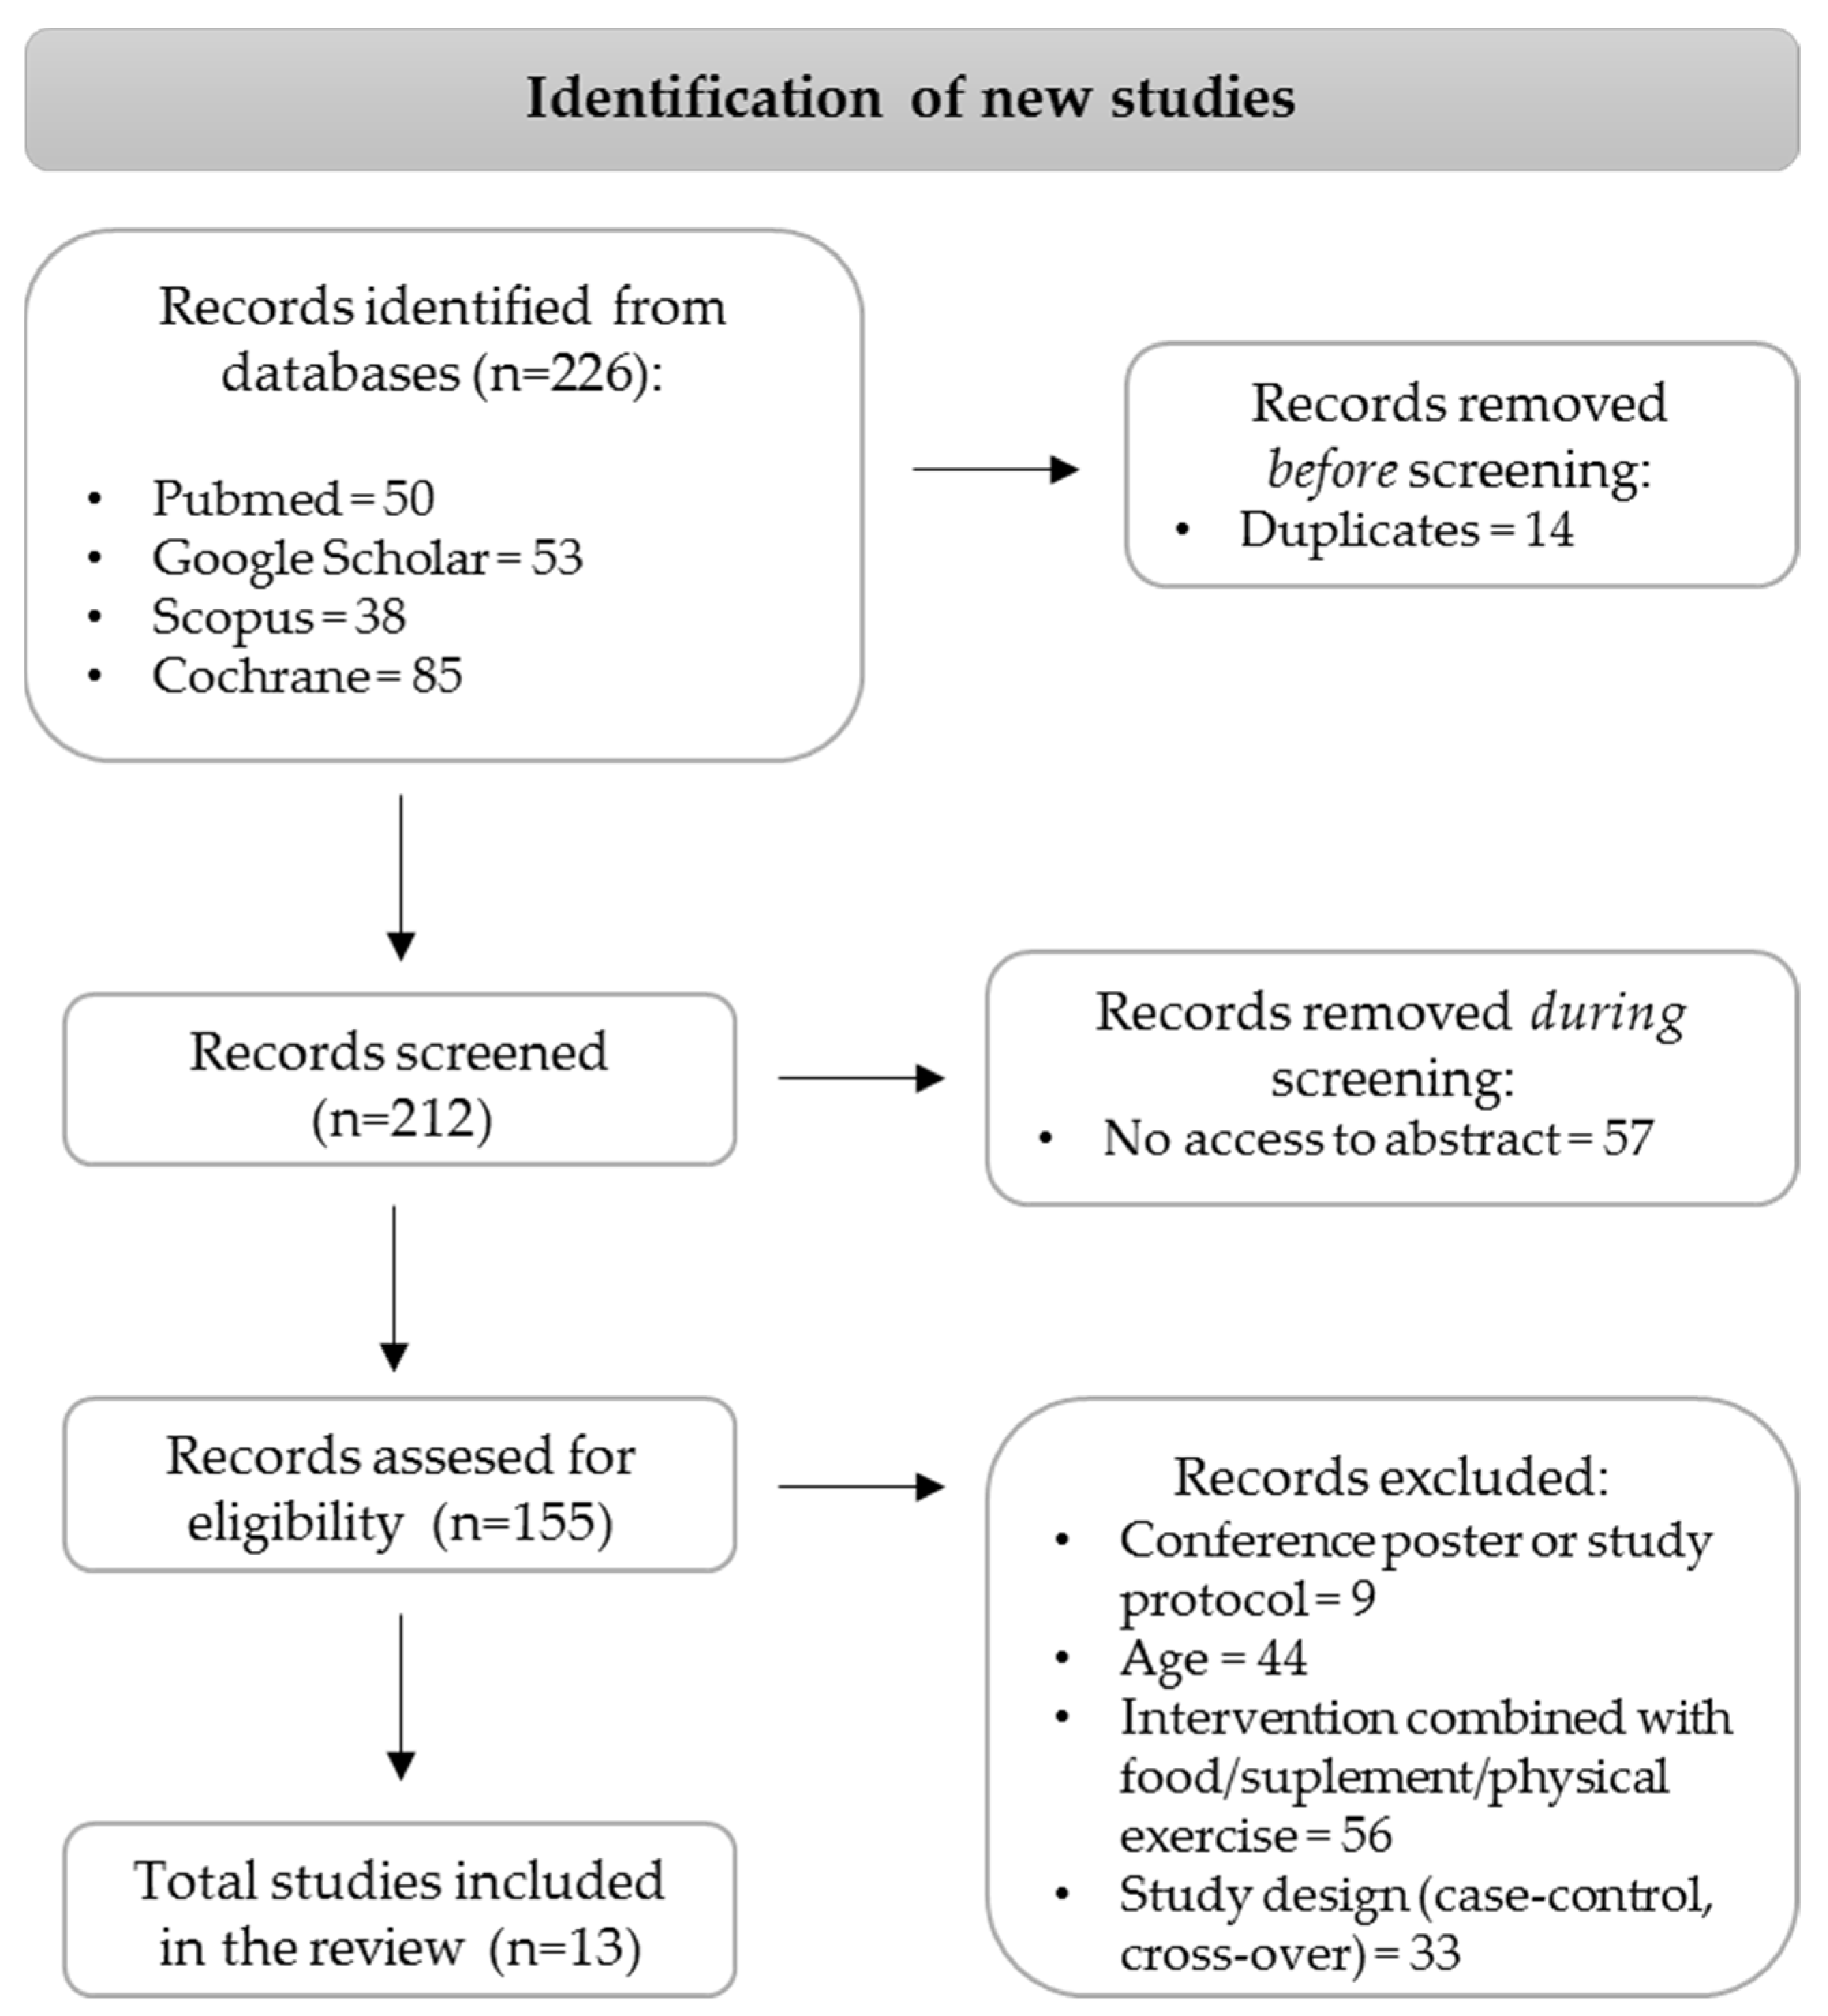
2.2. Study Selection
2.3. Selection Criteria
2.4. Data Extraction
2.5. Risk of Bias
2.6. Data Synthesis and Analysis
3. Results
3.1. Study Characteristics
3.2. Influence of Dietary Interventions with Model Diet Patterns on Metabolic Outcomes in MASLD Patients
3.2.1. Anthropometric Outcomes
3.2.2. Glucose and Lipid Metabolism and Inflammatory Outcomes
3.2.3. Liver Function Outcomes
4. Discussion
5. Conclusions
Author Contributions
Funding
Conflicts of Interest
References
- Rinella, M.E.; Sookoian, S. From NAFLD to MASLD: Updated naming and diagnosis criteria for fatty liver disease. J. Lipid Res. 2024, 65, 100485. [Google Scholar] [CrossRef]
- European Association for the Study of the Liver (EASL); European Association for the Study of Diabetes (EASD); European Association for the Study of Obesity (EASO). EASL-EASD-EASO Clinical Practice Guidelines on the Management of Metabolic Dysfunction-Associated Steatotic Liver Disease (MASLD). Obes. Facts 2024, 17, 374–443, Erratum in Obes. Facts 2024, 17, 658. [Google Scholar] [CrossRef]
- Chan, W.-K.; Chuah, K.-H.; Rajaram, R.B.; Lim, L.-L.; Ratnasingam, J.; Vethakkan, S.R. Metabolic Dysfunction-Associated Steatotic Liver Disease (MASLD): A State-of-the-Art Review. J. Obes. Metab. Syndr. 2023, 32, 197–213. [Google Scholar] [CrossRef] [PubMed]
- Keam, S.J. Resmetirom: First Approval. Drugs 2024, 84, 729–735. [Google Scholar] [CrossRef]
- Rajewski, P.; Cieściński, J.; Rajewski, P.; Suwała, S.; Rajewska, A.; Potasz, M. Dietary Interventions and Physical Activity as Crucial Factors in the Prevention and Treatment of Metabolic Dysfunction-Associated Steatotic Liver Disease. Biomedicines 2025, 13, 217. [Google Scholar] [CrossRef] [PubMed]
- Mambrini, S.P.; Grillo, A.; Colosimo, S.; Zarpellon, F.; Pozzi, G.; Furlan, D.; Amodeo, G.; Bertoli, S. Diet and physical exercise as key players to tackle MASLD through improvement of insulin resistance and metabolic flexibility. Front. Nutr. 2024, 11, 1426551. [Google Scholar] [CrossRef]
- Haigh, L.; Kirk, C.; El Gendy, K.; Gallacher, J.; Errington, L.; Mathers, J.C.; Anstee, Q.M. The effectiveness and acceptability of Mediterranean diet and calorie restriction in non-alcoholic fatty liver disease (NAFLD): A systematic review and meta-analysis. Clin. Nutr. 2022, 41, 1913–1931. [Google Scholar] [CrossRef] [PubMed]
- Beygi, M.; Ahi, S.; Zolghadri, S.; Stanek, A. Management of Metabolic-Associated Fatty Liver Disease/Metabolic Dysfunction-Associated Steatotic Liver Disease: From Medication Therapy to Nutritional Interventions. Nutrients 2024, 16, 2220. [Google Scholar] [CrossRef]
- Simancas-Racines, D.; Annunziata, G.; Verde, L.; Fascì-Spurio, F.; Reytor-González, C.; Muscogiuri, G.; Frias-Toral, E.; Barrea, L. Nutritional Strategies for Battling Obesity-Linked Liver Disease: The Role of Medical Nutritional Therapy in Metabolic Dysfunction-Associated Steatotic Liver Disease (MASLD) Management. Curr. Obes. Rep. 2025, 14, 7. [Google Scholar] [CrossRef]
- Hadefi, A.; Arvanitakis, M.; Trépo, E.; Zelber-Sagi, S. Dietary strategies in non-alcoholic fatty liver disease patients: From evidence to daily clinical practice, a systematic review. United Eur. Gastroenterol. J. 2023, 11, 663–689. [Google Scholar] [CrossRef]
- Chirapongsathorn, S.; Rintaravitoon, W.; Tangjaturonrasme, B.; Chotsriluecha, S.; Pumsutas, Y.; Kanchanapradith, A.; Treeprasertsuk, S. Effect of a Ketogenic Diet on Metabolic Dysfunction-Associated Steatotic Liver Disease (MASLD) Progression: A Randomized Controlled Trial. JGH Open 2025, 9, e70099. [Google Scholar] [CrossRef]
- Page, M.J.; McKenzie, J.E.; Bossuyt, P.M.; Boutron, I.; Hoffmann, T.C.; Mulrow, C.D.; Shamseer, L.; Tetzlaff, J.M.; Akl, E.A.; Brennan, S.E.; et al. The PRISMA 2020 statement: An updated guideline for reporting systematic reviews. BMJ 2021, 372, 71. [Google Scholar] [CrossRef]
- Mogna-Peláez, P.; Riezu-Boj, J.I.; Milagro, F.I.; Herrero, J.I.; Elorz, M.; Benito-Boillos, A.; Tobaruela-Resola, A.L.; Tur, J.A.; Martínez, J.A.; Abete, I.; et al. Inflammatory markers as diagnostic and precision nutrition tools for metabolic dysfunction-associated steatotic liver disease: Results from the Fatty Liver in Obesity trial. Clin. Nutr. 2024, 43, 1770–1781. [Google Scholar] [CrossRef] [PubMed]
- Asghari, S.; Rezaei, M.; Rafraf, M.; Taghizadeh, M.; Asghari-Jafarabadi, M.; Ebadi, M. Effects of Calorie Restricted Diet on Oxidative/Antioxidative Status Biomarkers and Serum Fibroblast Growth Factor 21 Levels in Nonalcoholic Fatty Liver Disease Patients: A Randomized, Controlled Clinical Trial. Nutrients 2022, 14, 2509. [Google Scholar] [CrossRef]
- Razavi Zade, M.; Telkabadi, M.H.; Bahmani, F.; Salehi, B.; Farshbaf, S.; Asemi, Z. The effects of DASH diet on weight loss and metabolic status in adults with non-alcoholic fatty liver disease: A randomized clinical trial. Liver Int. 2016, 36, 563–571. [Google Scholar] [CrossRef] [PubMed]
- Kord-Varkaneh, H.; Salehi-Sahlabadi, A.; Tinsley, G.M.; Santos, H.O.; Hekmatdoost, A. Effects of time-restricted feeding (16/8) combined with a low-sugar diet on the management of non-alcoholic fatty liver disease: A randomized controlled trial. Nutrition 2022, 105, 111847. [Google Scholar] [CrossRef]
- Garousi, N.; Tamizifar, B.; Pourmasoumi, M.; Feizi, A.; Askari, G.; Clark, C.C.T.; Entezari, M.H. Effects of lacto-ovo-vegetarian diet vs. standard-weight-loss diet on obese and overweight adults with non-alcoholic fatty liver disease: A randomised clinical trial. Arch. Physiol. Biochem. 2021, 129, 975–983. [Google Scholar] [CrossRef]
- Badali, T.; Arefhosseini, S.; Rooholahzadegan, F.; Tutunchi, H.; Ebrahimi-Mameghani, M. The effect of DASH diet on atherogenic indices, pro-oxidant-antioxidant balance, and liver steatosis in obese adults with non-alcoholic fatty liver disease: A double-blind controlled randomized clinical trial. Health Promot. Perspect. 2023, 13, 77–87. [Google Scholar] [CrossRef]
- Rooholahzadegan, F.; Arefhosseini, S.; Tutunchi, H.; Badali, T.; Khoshbaten, M.; Ebrahimi-Mameghani, M. The effect of DASH diet on glycemic response, meta-inflammation and serum LPS in obese patients with NAFLD: A double-blind controlled randomized clinical trial. Nutr. Metab. 2023, 20, 11. [Google Scholar] [CrossRef]
- Cai, H.; Qin, Y.-L.; Shi, Z.-Y.; Chen, J.-H.; Zeng, M.-J.; Zhou, W.; Chen, R.-Q.; Chen, Z.-Y. Effects of alternate-day fasting on body weight and dyslipidaemia in patients with non-alcoholic fatty liver disease: A randomised controlled trial. BMC Gastroenterol. 2019, 19, 219. [Google Scholar] [CrossRef]
- Ristic-Medic, D.; Kovacic, M.; Takic, M.; Arsic, A.; Petrovic, S.; Paunovic, M.; Jovicic, M.; Vucic, V. Calorie-Restricted Mediterranean and Low-Fat Diets Affect Fatty Acid Status in Individuals with Nonalcoholic Fatty Liver Disease. Nutrients 2020, 13, 15. [Google Scholar] [CrossRef] [PubMed]
- George, E.S.; Reddy, A.; Nicoll, A.J.; Ryan, M.C.; Itsiopoulos, C.; Abbott, G.; Johnson, N.A.; Sood, S.; Roberts, S.K.; Tierney, A.C. Impact of a Mediterranean diet on hepatic and metabolic outcomes in non-alcoholic fatty liver disease: The MEDINA randomised controlled trial. Liver Int. 2022, 42, 1308–1322. [Google Scholar] [CrossRef] [PubMed]
- Properzi, C.; O’Sullivan, T.A.; Sherriff, J.L.; Ching, H.L.; Jeffrey, G.P.; Buckley, R.F.; Tibballs, J.; MacQuillan, G.C.; Garas, G.; Adams, L.A. Ad Libitum Mediterranean and Low-Fat Diets Both Significantly Reduce Hepatic Steatosis: A Randomized Controlled Trial. Hepatology 2018, 68, 1741–1754. [Google Scholar] [CrossRef]
- Kestane, V.U.; Baş, M. Efficacy of the Mediterranean Diet Containing Different Macronutrients on Non-Alcoholic Fatty Liver Disease. Nutrients 2024, 16, 2699. [Google Scholar] [CrossRef]
- Zhang, Y.-F.; Qiao, W.; Zhuang, J.; Feng, H.; Zhang, Z.; Zhang, Y. Association of ultra-processed food intake with severe non-alcoholic fatty liver disease: A prospective study of 143073 UK Biobank participants. J. Nutr. Health Aging 2024, 28, 100352. [Google Scholar] [CrossRef]
- Grinshpan, L.S.; Eilat-Adar, S.; Ivancovsky-Wajcman, D.; Kariv, R.; Gillon-Keren, M.; Zelber-Sagi, S. Ultra-processed food consumption and non-alcoholic fatty liver disease, metabolic syndrome and insulin resistance: A systematic review. JHEP Rep. 2023, 6, 100964. [Google Scholar] [CrossRef] [PubMed]
- Menotti, A.; Puddu, P. How the Seven Countries Study contributed to the definition and development of the Mediterranean diet concept: A 50-year journey. Nutr. Metab. Cardiovasc. Dis. 2015, 25, 245–252. [Google Scholar] [CrossRef]
- Franquesa, M.; Pujol-Busquets, G.; García-Fernández, E.; Rico, L.; Shamirian-Pulido, L.; Aguilar-Martínez, A.; Medina, F.-X.; Serra-Majem, L.; Bach-Faig, A. Mediterranean Diet and Cardiodiabesity: A Systematic Review through Evidence-Based Answers to Key Clinical Questions. Nutrients 2019, 11, 655. [Google Scholar] [CrossRef]
- Yki-Järvinen, H.; Luukkonen, P.K.; Hodson, L.; Moore, J.B. Dietary carbohydrates and fats in nonalcoholic fatty liver disease. Nat. Rev. Gastroenterol. Hepatol. 2021, 18, 770–786. [Google Scholar] [CrossRef]
- Parra-Vargas, M.; Rodriguez-Echevarria, R.; Jimenez-Chillaron, J.C. Nutritional Approaches for the Management of Nonalcoholic Fatty Liver Disease: An Evidence-Based Review. Nutrients 2020, 12, 3860. [Google Scholar] [CrossRef]
- Kontogianni, M.D.; Tileli, N.; Margariti, A.; Georgoulis, M.; Deutsch, M.; Tiniakos, D.; Fragopoulou, E.; Zafiropoulou, R.; Manios, Y.; Papatheodoridis, G. Adherence to the Mediterranean diet is associated with the severity of non-alcoholic fatty liver disease. Clin. Nutr. 2014, 33, 678–683. [Google Scholar] [CrossRef] [PubMed]
- Khalatbari-Soltani, S.; Imamura, F.; Brage, S.; De Lucia Rolfe, E.; Griffin, S.J.; Wareham, N.J.; Marques-Vidal, P.; Forouhi, N.G. The association between adherence to the Mediterranean diet and hepatic steatosis: Cross-sectional analysis of two independent studies, the UK Fenland Study and the Swiss CoLaus Study. BMC Med. 2019, 17, 19. [Google Scholar] [CrossRef]
- Baratta, F.; Pastori, D.; Polimeni, L.; Bucci, T.; Ceci, F.; Calabrese, C.; Ernesti, I.; Pannitteri, G.; Violi, F.; Angelico, F.; et al. Adherence to Mediterranean Diet and Non-Alcoholic Fatty Liver Disease: Effect on Insulin Resistance. Am. J. Gastroenterol. 2017, 112, 1832–1839. [Google Scholar] [CrossRef]
- Chew, H.S.J.; Soong, R.Y.; Teo, Y.Q.J.; Flølo, T.N.; Chong, B.; Yong, C.L.; Ang, S.H.; Ho, Y.; Chew, N.W.S.; So, J.B.Y.; et al. Anthropometric and cardiometabolic effects of polyphenols in people with overweight and obesity: An umbrella review. Nutr. Rev. 2024, 82, 1556–1593. [Google Scholar] [CrossRef]
- Ribó-Coll, M.; Lassale, C.; Sacanella, E.; Ros, E.; Toledo, E.; Sorlí, J.V.; Babio, N.; Lapetra, J.; Gómez-Gracia, E.; Alonso-Gómez, Á.M.; et al. Mediterranean diet and antihypertensive drug use: A randomized controlled trial. J. Hypertens. 2021, 39, 1230–1237. [Google Scholar] [CrossRef]
- Meir, A.Y.; Rinott, E.; Tsaban, G.; Zelicha, H.; Kaplan, A.; Rosen, P.; Shelef, I.; Youngster, I.; Shalev, A.; Blüher, M.; et al. Effect of green-Mediterranean diet on intrahepatic fat: The DIRECT PLUS randomised controlled trial. Gut 2021, 70, 2085–2095. [Google Scholar] [CrossRef]
- Dinu, M.; Pagliai, G.; Casini, A.; Sofi, F. Mediterranean diet and multiple health outcomes: An umbrella review of meta-analyses of observational studies and randomised trials. Eur. J. Clin. Nutr. 2017, 72, 30–43. [Google Scholar] [CrossRef] [PubMed]
- Dinu, M.; Pagliai, G.; Angelino, D.; Rosi, A.; Dall’Asta, M.; Bresciani, L.; Ferraris, C.; Guglielmetti, M.; Godos, J.; Del Bo’, C.; et al. Effects of Popular Diets on Anthropometric and Cardiometabolic Parameters: An Umbrella Review of Meta-Analyses of Randomized Controlled Trials. Adv. Nutr. Int. Rev. J. 2020, 11, 815–833. [Google Scholar] [CrossRef]
- Irani, H.; Abiri, B.; Khodami, B.; Yari, Z.; Ghazi, M.L.; Hosseinzadeh, N.; Saidpour, A. Effect of time restricted feeding on anthropometric measures, eating behavior, stress, serum levels of BDNF and LBP in overweight/obese women with food addiction: A randomized clinical trial. Nutr. Neurosci. 2023, 27, 577–589. [Google Scholar] [CrossRef]
- Regmi, P.; Heilbronn, L.K. Time-Restricted Eating: Benefits, Mechanisms, and Challenges in Translation. iScience 2020, 23, 101161. [Google Scholar] [CrossRef]
- Chow, L.S.; Manoogian, E.N.C.; Alvear, A.; Fleischer, J.G.; Thor, H.; Dietsche, K.; Wang, Q.; Hodges, J.S.; Esch, N.; Malaeb, S.; et al. Time-Restricted Eating Effects on Body Composition and Metabolic Measures in Humans who are Overweight: A Feasibility Study. Obesity 2020, 28, 860–869. [Google Scholar] [CrossRef] [PubMed]
- Gabel, K.; Hoddy, K.K.; Haggerty, N.; Song, J.; Kroeger, C.M.; Trepanowski, J.F.; Panda, S.; Varady, K.A. Effects of 8-hour time restricted feeding on body weight and metabolic disease risk factors in obese adults: A pilot study. Nutr. Healthy Aging 2018, 4, 345–353. [Google Scholar] [CrossRef] [PubMed]
- Zelber-Sagi, S.; Grinshpan, L.S.; Ivancovsky-Wajcman, D.; Goldenshluger, A.; Gepner, Y. One size does not fit all; practical, personal tailoring of the diet to NAFLD patients. Liver Int. 2022, 42, 1731–1750. [Google Scholar] [CrossRef]
- Sutton, E.F.; Beyl, R.; Early, K.S.; Cefalu, W.T.; Ravussin, E.; Peterson, C.M. Early Time-Restricted Feeding Improves Insulin Sensitivity, Blood Pressure, and Oxidative Stress Even without Weight Loss in Men with Prediabetes. Cell Metab. 2018, 27, 1212–1221.e3. [Google Scholar] [CrossRef]
- Hutchison, A.T.; Regmi, P.; Manoogian, E.N.; Fleischer, J.G.; Wittert, G.A.; Panda, S.; Heilbronn, L.K. Time-Restricted Feeding Improves Glucose Tolerance in Men at Risk for Type 2 Diabetes: A Randomized Crossover Trial. Obesity 2019, 27, 724–732. [Google Scholar] [CrossRef] [PubMed]
- Wilkinson, M.J.; Manoogian, E.N.C.; Zadourian, A.; Lo, H.; Fakhouri, S.; Shoghi, A.; Wang, X.; Fleischer, J.G.; Navlakha, S.; Panda, S.; et al. Ten-Hour Time-Restricted Eating Reduces Weight, Blood Pressure, and Atherogenic Lipids in Patients with Metabolic Syndrome. Cell Metab. 2020, 31, 92–104.e5. [Google Scholar] [CrossRef] [PubMed]
- Lowe, D.A.; Wu, N.; Rohdin-Bibby, L.; Moore, A.H.; Kelly, N.; Liu, Y.E.; Philip, E.; Vittinghoff, E.; Heymsfield, S.B.; Olgin, J.E.; et al. Effects of Time-Restricted Eating on Weight Loss and Other Metabolic Parameters in Women and Men with Overweight and Obesity. JAMA Intern. Med. 2020, 180, 1491–1499. [Google Scholar] [CrossRef]
- Antoni, R.; Robertson, T.M.; Robertson, M.D.; Johnston, J.D. A pilot feasibility study exploring the effects of a moderate time-restricted feeding intervention on energy intake, adiposity and metabolic physiology in free-living human subjects. J. Nutr. Sci. 2018, 7, e22. [Google Scholar] [CrossRef]
- Hashemi, R.; Khalifani, A.M.; Rahimlou, M.; Manafi, M. Comparison of the effect of Dietary Approaches to Stop Hypertension diet and American Diabetes Association nutrition guidelines on lipid profiles in patients with type 2 diabetes: A comparative clinical trial. Nutr. Diet. 2019, 77, 204–211. [Google Scholar] [CrossRef]
- Hekmatdoost, A.; Shamsipour, A.; Meibodi, M.; Gheibizadeh, N.; Eslamparast, T.; Poustchi, H. Adherence to the Dietary Approaches to Stop Hypertension (DASH) and risk of Nonalcoholic Fatty Liver Disease. Int. J. Food Sci. Nutr. 2016, 67, 1024–1029. [Google Scholar] [CrossRef]
- Siervo, M.; Lara, J.; Chowdhury, S.; Ashor, A.; Oggioni, C.; Mathers, J.C. Effects of the Dietary Approach to Stop Hypertension (DASH) diet on cardiovascular risk factors: A systematic review and meta-analysis. Br. J. Nutr. 2014, 113, 1–15. [Google Scholar] [CrossRef] [PubMed]

| Name of Dietary Pattern Model | Macronutrient Distribution (% of Total Kcal Consumed a Day) | Additional Recommendations | ||
|---|---|---|---|---|
| Carbohydrates | Protein | Fat | ||
| American Heart Association (AHA) guidelines [13] | 55 | 15 | 30 | Prescribed 3–5 meals per day. |
| Healthy eating and weight control advice (normal diet, ND) [14] 11 March 2025 13:45:00 | 53 | 17 | 30 | The diet was based on the Food Guide Pyramid, along with the recommendations of the Obesity Education Initiative Expert Panel. |
| Control Normal (CN) diet [15,16] | 52–55 | 16–18 | 30 | The diet was based on the foods, including daily intake of (servings) grains (10), simple sugars (5), vegetables (4) and fruits (4), dairy (2), meats (including 2 servings of lean meat), poultry and fish (4), nuts, seeds and legumes (1) and fats/oils (3). |
| 55 | 15 | 30 | Normal usual diet required adherence to the caloric, macronutrient, and fruit and vegetable consumption, including 9 servings of fruits and vegetables. | |
| Standard weight-loss diet (SWL-D) [17] | 50–55 | 15–20 | 25–30 | Follow the standard food pyramid, which was free of all sources of food |
| Protein sources (18%) are provided by meat and meat products, poultry, fish and seafood, and the flesh of any other animals. | ||||
| Calorie-restricted (CR) diet [14] | 53 | 17 | 30 | The diet was planned individually based on the optimal servings of each food group from the Food Guide Pyramid, while accounting for food preferences and allergies, or intolerances. |
| Diet restricted calorics intake from 500 to 1000 kcal/day, deducted from the estimated energy requirements. | ||||
| Low-calorie diet (LCD) [18,19,20] | 55–60 | 10–15 | 30 | The diet was based on the food-based dietary guidelines for Iranians and included a variety of raw and cooked vegetables, fruits, and legumes consumed daily, along with regular intake of dairy products, such as milk, cheese, and yogurt, and emphasis on whole-grain breads and cereals. Animal protein sources include lean meats, chicken, fish, and eggs. Fats and oils are used in moderation, while the consumption of sugar, salt, and processed foods is limited. Water and unsweetened beverages are prioritized. |
| Diet-restricted calorics intake of 500 kcal/day deducted from the estimated energy requirements. | ||||
| N/A | N/A | N/A | A diet with reduced caloric intake to 80% of daily requirements, and free from any restrictions in food group intake. | |
| Low-Fat Diet (LFD) [21,22,23] | 60 | 15 | 25 | A diet with reduced calorie intake providing 600–800 kcal less than the daily energy requirement. |
| A balanced diet that focused on the intake of low-glycemic carbohydrate sources. | ||||
| The intake of all types of fats from both animal and vegetable sources is reduced. | ||||
| 50 | 20 | 30 | The diet was based on recommendations of the Australian Dietary Guidelines and The Heart Foundation. | |
| A balanced diet promoting the intake of a variety of vegetables, fruits, whole grains, lean proteins, and dairy or dairy alternatives, limiting saturated fat, added sugars, and salt. The main fat sources are nuts, seeds, and avocados. Regular consumption of fish, legumes, and lean meats is recommended. Water intake is prioritized, while other beverages and alcoholic drinks are consumed in small portions occasionally. | ||||
| 50 | 20 | 30 | The diet was based on National Health and Medical Research Council and American Heart Association Dietary recommendations. | |
| The diet included a monthly intake of 1 kg of natural muesli and 200 g of low-fat snack bars, limiting a saturated fat to <10% of total calorie intake. | ||||
| Ketogenic diet (KD) [11] | 5 | 25 | 70 | A low-carbohydrate, high-protein, high-fat diet providing 1500 kcal a day. |
| Dietary Approaches to Stop Hypertension (DASH) diet [11,15,18,19] | 55–60 | 10–15 | 30 | A DASH diet with reduced calorie intake providing l500 kcal less than the daily energy requirement. |
| The diet was based on intake of whole grains, fruits, vegetables, dairy, and plant-based proteins, while limiting saturated fat, added sugar, and alcohol. | ||||
| The diet included at least 4–5 servings of whole grains, 3–4 servings of vegetables and fruits, and 2 servings of dairy. Saturated fat was reduced to <5% of total energy intake, added sugars to ≤3%. Alcohol consumption was restricted to 2 drinks/day for men and 1 for women. | ||||
| 60 | 15 | 25 | General lifestyle advice counseling DASH as low-fat, rich in vegetables/fruits and whole grains providing 1500 kcal a day, being rich in foods that are high in potassium, calcium, and magnesium. | |
| 52–55 | 16–18 | 30 | A DASH diet with reduced calorie intake provides 350–700 kcal less than the daily energy requirement. | |
| The diet was rich in fruits, vegetables, whole grains, and low-fat dairy products, and low in saturated fats, cholesterol, refined grains, and sweets. | ||||
| The diet included a daily intake (servings) of grains (8) with at least 3 servings from whole grains, simple sugars (2), vegetables (5) and fruits (6), low-fat dairy (3), meats (including 4 servings of lean meat), poultry and fish (4), nuts, seeds and legumes (2) and fats/oils (3). Sodium consumption was limited to <2400 mg/day. | ||||
| Lacto-ovo-vegetarian diet (LOV-D) [17] | 50–55 | 15–20 | 25–30 | The diet eliminated intake of meat, poultry, and fish, while promoting consumption of dairy products and eggs as the main protein sources. |
| The key protein sources were eggs (24%), dairy (19%), soy (16%), nuts (8%), vegetables, and fruits (7%). | ||||
| Alternate-day fasting (ADF) [16,20] | 55 | 15 | 30 | The diet was scheduled to reduce calorie intake by 25% on the fast day (24 h), and allowed for ad libitum intake of all foods on the feed day (24 h). The feed and fast days began at midnight, and all fast day meals were consumed between 12.00 p.m. and 2.00 p.m. |
| Fast day meals were provided as a 3-day rotating menu and were based on the American Heart Association (AHA) guidelines. | ||||
| Time-Restricted Feeding (TRF) 16/8 [20] | 55 | 15 | 30 | The diet was scheduled to achieve 16 consecutive hours of fasting from all caloric intake and 8 h of eating time each day. |
| Free sugar intake was reduced to 3% of daily calorie intake. | ||||
| 55 | 15 | 30 | The diet provided meals within an 8-h window, which was followed by refraining from consumption of all food or beverages that included energy for 16 h. | |
| The amount or type of food consumed during the 8-h window, as well as the timing of the feeding window during the day, were freely chosen to accommodate lifestyle habits. | ||||
| Mediterranean (MED) diet [13,21,22,23] | 40–45 | 25 | 30–35 | The Fatty Liver in Obesity (FLiO) Diet is a Mediterranean-based diet adapted for Fatty Liver in Obesity study. |
| Diet based on high intake of extra virgin olive oil and omega 3 fatty acids, as well as low in glycemic index carbohydrates; while reducing saturated fats, trans fats, and cholesterol. | ||||
| 33 | 15–20 | 44 | The diet was based on the traditional Cretan diet and included a high intake of vegetables, including leafy greens, tomatoes, onions, and garlic; legumes (2 servings/week), along with a moderate intake of dairy, preferably fermented varieties like yogurt. The diet included fish or shellfish (3 servings/week), especially oily fish as a source of omega-3 fatty acids, whereas consumption of red meat was limited to small portions, with a preference for lean, grass-fed options. Sweets and sugary drinks are avoided, and red wine is consumed in moderation. | |
| The diet was considered as high-fat, with extra virgin olive oil as the main fat (50% from monounsaturated fatty acids), along with antioxidants. | ||||
| 50 | 15 | 25 | A MED diet with reduced calorie intake providing 600–800 kcal less than the energy requirement. | |
| The diet is based on vegetables, along with the intake of poultry and fish, while reducing red meat consumption. Animal fats from butter, cream, and lard were not allowed. | ||||
| 40 | 20 | 35–40 | The diet was based on traditional Cretan diet with added adjustments to the amount of protein intake (standardization of protein with LCD). | |
| The saturated fat was reduced to <10% of total kcal consumed daily. | ||||
| The diet included intake of 750 g of nuts (almonds or walnuts) and 750 mL of olive oil monthly. | ||||
| Low carbohydrate Mediterranean diet (LCMD) [24] | ≤35 | 15–20 | >45 | All MD diet types had a reduced intake of saturated fat to <10%, and included consumption of at least 3 portions of vegetables and 2–4 portions of fruits a day, and fish twice a week. The meal pattern was determined to provide 3 main meals and 2–3 snacks a day. |
| Low-fat Mediterranean diet (LFMD) [24] | ≥55 | 15–20 | 20–25 | |
| Typical Mediterranean diet (TMD) [24] | 40–45 | 15–20 | 35–40 | |
| Reference | Country | Population | Final Participants Numbers | Age (Mean ± SD) | Dietary Intervention | Type of Analysis | |
|---|---|---|---|---|---|---|---|
| Type | Duration (Months) | ITT; PP or AT | |||||
| Kestane and Bas (2024) [24] | Turkey | Patients with MASLD with obesity and insulin resistance | LFMD: 21 | LFMD: 39.48 ± 9.17 | Low-fat Mediterranean diet (LFMD) | 2 | PP |
| LCMD: 21 | LCMD: 39.71 ± 10.34 | Low-carbohydrate Mediterranean diet (LCMD) | |||||
| TMD: 21 | TMD: 39.48 ± 9.17 | Typical Mediterranean diet (TMD) | |||||
| Mogna-Pelaez et al. (2024) [13] | Spain | Patients with MASLD and obesity | AHA: 48 (follow up: 32) | AHA: 33.7 ± 4 | American Heart Association (AHA) diet | 24 | PP |
| FLiO: 50 (follow up: 26) | FLiO: 33.3 ± 4 | Mediterranean-based diet deisgned for the Fatty Liver in Obesity study (FLiO) diet | |||||
| C: 45 | C: 23.27 ± 2.46 | No Diet | |||||
| Kord-Varkaneh et al. (2023) [16] | Iran | Patients with MASLD | TRF: 22 | TRF: 41.36 ± 10.5 | Time-restricted feeding (16/8) (TRF) with a low-sugar diet | 3 | PP |
| CN: 23 | CN: 44.17 ± 4.9 | Control Normal (CN) diet | |||||
| Garousi et al. (2023) [17] | Iran | Patients with MASLD and obesity | LOV-D: 37 | LOV-D: 43.51 ± 9.85 | Lacto-ovo-vegetarian diet (LOV-D) | 3 | PP |
| SWL-D: 38 | SWL-D: 42.84 ± 9.85 | Standard weight-loss diet (SWL-D) | |||||
| Rooholahzadegan et al. (2023) [19] | Iran | Patients with MASLD and obesity | DASH: 20 | DASH: 38.80 ± 9.98 | Dietary Approaches to Stop Hypertension (DASH) diet | 2 | PP |
| Badali et al. (2023) [18] | LCD: 20 | LCD: 37.10 ± 9.74 | Low-calorie diet (LCD) | ||||
| Sakkarin Chirapongsathorn et al. (2023) [11] | Thailand | Patients with MASLD and obesity | DASH: 10 | DASH: 40.2 ± 7.57 | Dietary Approaches to Stop Hypertension (DASH) diet | 2 | PP |
| KD: 12 | KD: 37.42 ± 7.49 | Ketogenic diet (KD) | |||||
| Asghari et al. (2022) [14] | Iran | Patients with MASLD and obesity | CR: 30 | CR: 40.08 ± 7.08 | Calorie-restricted (CR) diet | 3 | PP |
| ND: 30 | ND: 39.27 ± 5.51 | Healthy eating and weight control advice (normal diet, ND) | |||||
| George et al. (2022) [22] | Australia | Patients with MASLD and T2DM/insulin resistance | MED: 18 | MED: 52.6 ± 11.7 | Mediterranean (MED) diet | 3 | ITT |
| LCD: 21 | LCD: 52.1 ± 13.6 | Low-calorie diet (LCD) | |||||
| Ristic-Medic et al. (2020) [21] | Serbia | Patients with MASLD and obesity | MED: 12 | MED: 34.42 ± 4.66 | Calorie-restriced Mediterranean diet (MedDiet) | 3 | PP |
| LFD: 12 | LFD: 32.92 ± 3.78 | Calorie-restriced low-fat diet (LFD) | |||||
| Cai et al. (2019) [20] | China | Patients with MASLD and obesity | ADF: 95 | ADF: 35.50 ± 4.417 | Alternate-day fasting (ADF) | 24 | PP |
| TRF: 90 | TRF: 33.56 ± 6.23 | Time-Restricted Feeding (TRF) 16/8 | |||||
| LCD: 79 | LCD: 34.54 ± 6.96 | Low-calorie diet (LCD) | |||||
| Properzi et al. (2018) [23] | Australia | Patients with MASLD | MED: 24 | MED: 51.00 ± 13.36 | Mediterranean (MED) diet | 3 | ITT |
| LCD: 24 | LCD: 53.00 ± 9.06 | Low-calorie diet (LCD) | |||||
| Razavi Zade et al. (2016) [15] | Iran | Patients with MASLD and obesity | DASH: 30 | DASH: 39.7 ± 7.3 | Dietary Approaches to Stop Hypertension (DASH) diet | 2 | ITT |
| CN: 30 | CN: 42.8 ± 10.6 | Control Normal (CN) diet | |||||
| Dietary Pattern Model | Anthropometric Outcomes | ||||||||||||||||||
|---|---|---|---|---|---|---|---|---|---|---|---|---|---|---|---|---|---|---|---|
| BW | BMI | WC | BF | DBP | SBP | ||||||||||||||
| B | PI | p | B | PI | p | B | PI | p | B | PI | p | B | PI | p | B | PI | p | ||
| AHA | Mogna-Pelaez et al. (2024) [13] | 65.61 ± 12.01 | −4.70 ± 6.85 ^ | p < 0.001 | 23.27 ± 2.46 | −1.53 ± 2.31 ^ | p < 0.001 | 78.78 ± 9.10 | −2.83 ± 8.28 ^ | NS | 19.30 ± 5.70 | −1.55 ± 3.24 ^ | NS | N/A | N/A | N/A | N/A | N/A | N/A |
| FLiO diet | Mogna-Pelaez et al. (2024) [13] | 65.61 ± 12.01 | −7.31 ± 5.82 ^ | p < 0.001 | 23.27 ± 2.46 | −2.49 ± 2.00 ^ | p < 0.001 | 78.78 ± 9.10 | −6.67 ± 6.35 ^ | p < 0.001 | 19.30 ± 5.70 | −1.85 ± 4.13 ^ | NS | N/A | N/A | N/A | N/A | N/A | N/A |
| MED | George et al. (2022) [22] | 87.7 ± 21.1 | 88.1 ± 21.9 | p = 0.45 | 31.6 ± 5.4 | 31.5 ± 5.5 | p = 0.63 | 105.1 ± 14.7 | 106.2 ± 15.2 | p = 0.42 | 39.1 ± 7.9 | 38.9 ± 7.7 | p = 0.96 | 82.8 ± 7.1 | 83.7 ± 8.1 | p = 0.74 | 125.4 ± 12.1 | 123.3 ± 13.4 | p = 0.52 |
| Properzi et al. (2018) [23] | 89.3 ± 12.7 | 87.3 ± 12.5 | p < 0.001 | 31.8 ± 4.0 | 31.1 ± 4.0 | p < 0.001 | 105.6 ± 10.3 | 102.9 ± 10.4 | p = 0.001 | N/A | N/A | N/A | 81 ± 7 | 78 ± 8 | p = 0.07 | 126 ± 14 | 122 ± 13 | p = 0.09 | |
| Ristic-Medic et al. (2020) [21] | 101.11 ± 9.09 | 91.88 ± 9.48 | p = 0.000 | 30.43 ± 1.81 | 27.65 ± 1.80 | p = 0.000 | 105.67 ± 5.94 | 95.83 ± 5.73 | p = 0.000 | 26.17 ± 1.71 | 21.27 ± 3.05 | p = 0.000 | N/A | N/A | N/A | N/A | N/A | N/A | |
| TMD | Kestane and Bas (2024) [24] | 91.90 ± 10.94 | 84.43 ± 10.34 | p = 0.00 | 32.30 ± 1.08 | 29.74 ± 1.22 | p = 0.00 | 109.93 ± 7.40 | 100.52 ± 7.35 | p = 0.00 | 40.14 ± 6.14 | 35.52 ± 6.58 | p = 0.00 | N/A | N/A | N/A | N/A | N/A | N/A |
| LCMD | 93.71 ± 12.36 | 86.87 ± 12.15 | p = 0.00 | 32.46 ± 1.68 | 30.08 ± 1.67 | p = 0.00 | 114.71 ± 14.78 | 106.10 ± 13.81 | p = 0.00 | 38.97 ± 6.22 | 35.24 ± 5.94 | p = 0.00 | N/A | N/A | N/A | N/A | N/A | N/A | |
| LFMD | 94.12 ± 11.44 | 86.71 ± 10.87 | p = 0.00 | 32.34 ± 1.19 | 29.80 ± 1.23 | p = 0.00 | 111.19 ± 6.55 | 102.21 ± 6.81 | p = 0.00 | 37.99 ± 7.96 | 33.92 ± 8.61 | p = 0.00 | N/A | N/A | N/A | N/A | N/A | N/A | |
| LFD | George et al. (2022) [22] | 89.8 ± 24.4 | 86.6 ± 19.6 | p = 0.11 | 32.7 ± 6.9 | 31.3 ± 4.9 | p = 0.16 | 108.9 ± 20.6 | 105.1 ± 14.7 | p = 0.70 | 40.8 ± 7.9 | 38.9 ± 7.9 | p = 0.35 | 83.3 ± 9.8 | 80.3 ± 8.6 | p = 0.21 | 127.4 ± 19.2 | 118.6 ± 10.8 | p = 0.033 |
| Properzi et al. (2018) [23] | 81.3 ± 13.3 | 79.6 ± 13.5 | p = 0.001 | 30.1 ± 5.69 | 29.5 ± 5.8 | p = 0.001 | 98.0 ± 12.0 | 93.9 ± 10.6 | p < 0.001 | N/A | N/A | N/A | 79 ± 9 | 76 ± 9 | p = 0.07 | 130 ± 16 | 126 ± 14 | p = 0.08 | |
| Ristic-Medic et al. (2020) [21] | 102.12 ± 8.19 | 92.41 ± 8.14 | p = 0.000 | 30.17 ± 2.28 | 27.68 ± 2.44 | p = 0.000 | 107.58 ± 6.96 | 98.83 ± 8.04 | p = 0.000 | 26.93 ± 3.50 | 21.86 ± 3.95 | p = 0.000 | N/A | N/A | N/A | N/A | N/A | N/A | |
| LCD | Badali et al. (2023) [18] | 93.49 ± 13.98 | 87.88 ± 13.88 | p < 0.001 | 34.02 ± 3.61 | 31.96 ± 3.57 | p < 0.001 | 109.92 ± 9.80 | 105.0 ± 9.60 | p < 0.001 | N/A | N/A | N/A | 82.78 ± 11.27 | 77.35 ± 9.54 | p = 0.044 | 125.50 ± 11.91 | 120.25 ± 13.52 | p = 0.022 |
| Rooholahzadegan et al. (2023) [19] | |||||||||||||||||||
| Cai et al. (2019) [20] | 72.94 ± 8.00 | 71.77 ± 6.90 | N/A | 26.34 ± 2.73 | 26.64 ± 1.66 | N/A | 92.59 ± 4.98 | 88.54 ± 5.10 | N/A | 29.06 ± 3.64 *** | 28.01 ± 3.49 *** | N/A | N/A | N/A | N/A | N/A | N/A | N/A | |
| TRF 16/8 | Cai et al. (2019) [20] | 74.98 ± 8.02 | 71.67 ± 7.37 | p < 0.05 | 26.76 ± 1.59 | 26.60 ± 1.46 | N/A | 91.54 ± 4.43 | 87.58 ± 4.39 | N/A | 30.27 ± 3.23 *** | 27.65 ± 3.34 *** | N/A | N/A | N/A | N/A | N/A | N/A | N/A |
| Kord-Varkaneh et al. (2023) [16] | 83.75 ± 12.71 | 80.54 ± 12.12 | p < 0.001 | 29.13 ± 2.64 | 28.02 ± 2.65 | p ˂ 0.0001 | 104.59 ± 10.47 | 101.91 ± 7.42 | p = 0.042 | 26.69 ± 5.35 *** | 24.22 ± 4.88 *** | p = 0.001 | N/A | N/A | N/A | N/A | N/A | N/A | |
| ADF | Cai et al. (2019) [20] | 75.32 ± 8.53 | 71.28 ± 7.02 | N/A | 26.12 ± 2.21 | 26.15 ± 1.58 | N/A | 92.07 ± 5.29 | 87.19 ± 4.88 | N/A | 30.58 ± 3.95 *** | 27.10 ± 2.52 *** | N/A | N/A | N/A | N/A | N/A | N/A | N/A |
| LOV-D | Garousi et al. (2023) [17] | 87.16 ± 18.15 | 81.30 ± 17.20 | p < 0.001 | 32.02 ± 4.57 | 29.88 ± 4.54 | p < 0.001 | 109.97 ± 12.29 | 102.43 ± 11.68 | p < 0.001 | N/A | N/A | N/A | 9.82 ± 0.71 | 9.52 ± 0.75 | p = 0.090 | 12.52 ± 1.34 | 11.86 ± 1.14 | p = 0.001 |
| SWL-D | Garousi et al. (2023) [17] | 85.97 ± 15.46 | 83.77 ± 15.40 | p < 0.001 | 30.06 ± 3.8 | 29.33 ± 3.98 | p < 0.001 | 108.39 ± 10.91 | 106.01 ± 10.81 | p < 0.001 | N/A | N/A | N/A | 10.03 ± 0.97 | 9.73 ± 0.87 | p = 0.045 | 13.03 ± 1.37 | 12.72 ± 1.28 | p = 0.58 |
| DASH | Badali et al. (2023) [18] | 93.32 ± 19.51 | 85.57 ± 18.62 | p > 0.001 | 33.43 ± 4.09 | 30.64 ± 4.06 | p < 0.001 | 111.25 ± 12.29 | 103.32 ± 12.67 | p < 0.001 | N/A | N/A | N/A | 83.50 ± 10.89 | 75.25 ± 5.73 | p = 0.002 | 131.25 ± 10.11 | 119.00 ± 9.54 | p = 0.002 |
| Rooholahzadegan et al. (2023) [19] | |||||||||||||||||||
| Sakkarin Chirapongsathorn et al. (2023) [11] | 78.33 ± 12.66 | 76.1 ± 12.1 | N/A | 31.16 ± 3.93 | 29.6 ± 3.2 | N/A | 96.83 ± 12.95 | 92.6 ± 10.9 | N/A | 31.4 ± 8.1 *** | 30.07 ± 7.2 *** | N/A | 85.8 ± 10.6 | 83.9 ± 13.3 | N/A | 130.8 ± 15.8 | 135.2 ± 14.07 | N/A | |
| Razavi Zade et al. (2016) [15] | 81.0 ± 8.9 | 77.2 ± 7.9 | NS | 28.5 ± 3.2 | 27.2 ± 2.9 | NS | 99.3 ± 8.4 | 95.1 ± 7.7 | NS | N/A | N/A | N/A | N/A | N/A | N/A | N/A | N/A | N/A | |
| KD | Sakkarin Chirapongsathorn et al. (2023) [11] | 82.99 ± 11.12 | 76.8 ± 11.4 | N/A | 31.93 ± 2.7 | 29.4 ± 2.9 | N/A | 102.44 ± 9.67 | 93.5 ± 5.5 | N/A | 34.2 ± 5.8 *** | 29.3 ± 6.6 *** | N/A | 84.1 ± 11.9 | 79.3 ± 11.06 | N/A | 132.3 ± 12.2 | 122.9 ± 11.2 | N/A |
| CR | Asghari et al. (2022) [14] | 89.62 ± 14.20 | N/A | N/A | 31.32 ± 3.31 | N/A | N/A | N/A | N/A | N/A | N/A | N/A | N/A | N/A | N/A | N/A | N/A | N/A | N/A |
| ND | Asghari et al. (2022) [14] 3 November 2024 13:45:00 | 86.61 ± 10.70 | N/A | N/A | 30.41 ± 3.39 | N/A | N/A | 101.88 ± 8.18 | N/A | N/A | N/A | N/A | N/A | N/A | N/A | N/A | N/A | N/A | N/A |
| CN | Razavi Zade et al. (2016) [15] | 77.8 ± 10.1 | 75.5 ± 9.3 | NS | 28.3 ± 3.3 | 27.5 ± 3.0 | NS | 94.9 ± 12.7 | 92.3 ± 12.2 | NS | N/A | N/A | N/A | N/A | N/A | N/A | N/A | N/A | N/A |
| Kord-Varkaneh et al. (2023) [16] | 89.33 ± 18.47 | 88.31 ± 11.01 | p = 0.064 | 30.60 ± 30.09 | 30.26 ± 3.08 | p = 0.063 | 107.09 ± 9.47 | 107.19 ± 8.93 | p = 0.928 | 27.21 ± 7.33 *** | 28.93 ± 7.91 *** | p = 0.041 | N/A | N/A | N/A | N/A | N/A | N/A | |
| Change in the Anthropometric Outcomes Between Interventions with Dietary Model Patterns in MASLD | |||||||
|---|---|---|---|---|---|---|---|
| Compared Dietary Models | Reference | BW | BMI | WC | BF | DBP | SBP |
| AHA vs. FLiO | Mogna-Pelaez et al. (2024) [13] | NS | NS | p = 0.021 | NS | N/A | N/A |
| MED vs. LFD | George et al. (2022) [22] | p = 0.77 | p = 0.57 | p = 0.64 | p = 0.49 | p = 0.85 | p = 0.70 |
| Properzi et al. (2018) [23] | p = 0.658 | p = 0.608 | p = 0.041 | N/A | p = 0.396 | p = 0.714 | |
| Ristic-Medic et al. (2020) [21] | p = 0.342 | p = 0.342 | p = 0.233 | p = 0.989 | N/A | N/A | |
| TMD vs. LCMD vs. LFMD | Kestane and Bas (2024) [24] | p = 0.84 | p = 0.76 | p = 0.74 | p = 0.50 | N/A | N/A |
| TRF 16/8 vs. CN | Kord-Varkaneh et al. (2023) [16] | p = 0.029 | p = 0.013 | p = 0.041 | p = 0.410 | N/A | N/A |
| TRF vs. CN | Cai et al. (2019) [20] | p < 0.001 | N/A | N/A | p < 0.001 | N/A | N/A |
| ADF vs. CN | p < 0.001 | N/A | N/A | p < 0.001 | N/A | N/A | |
| DASH vs. LCD | Rooholahzadegan et al. (2023) [19] | p = 0.021 | p = 0.025 | p = 0.002 | N/A | p = 0.087 | p = 0.162 |
| Badali et al. (2023) [18] | |||||||
| DASH vs. KD | Sakkarin Chirapongsathorn et al. (2023) [11] | p = 0.001 | p = 0.17 | p = 0.019 | p = 0.007 | p = 0.39 | p < 0.001 |
| DASH vs. CN | Razavi Zade et al. (2016) [15] | p = 0.006 | p = 0.01 | p = 0.001 | N/A | N/A | N/A |
| LOV-D vs. SWL-D | Garousi et al. (2023) [17] | p < 0.001 | p < 0.001 | p < 0.001 | N/A | p = 0.310 | p = 0.023 |
| CR vs. ND | Asghari et al. (2022) [14] | N/A | N/A | N/A | N/A | N/A | N/A |
| Dietary Pattern Model | Glucose and Lipid Metabolism Outcomes Along with Inflammatory Status | |||||||||||||||||||||||||
|---|---|---|---|---|---|---|---|---|---|---|---|---|---|---|---|---|---|---|---|---|---|---|---|---|---|---|
| Glucose Metabolism | Lipid Metabolism | Inflammatory Status | ||||||||||||||||||||||||
| Glucose | Insulin | HOMA-IR | HbA1c | Triglycerides | Cholesterol | LDL-C | HDL-C | |||||||||||||||||||
| B | PI | p | B | PI | p | B | PI | p | B | PI | p | B | PI | p | B | PI | p | B | PI | p | B | PI | p | |||
| AHA | Mogna-Pelaez et al. (2024) [13] | 90.73 ± 6.49 | −9.19 ± 18.29 ^ | p < 0.005 | 4.16 ± 1.79 | −4.81 ± 7.17 ^ | p < 0.005 | 0.94 ± 0.43 | −1.55 ± 2.18 ^ | p < 0.001 | 5.14 ± 0.38 | −0.10 ± 0.43 ^ | NS | 83.57 ± 38.16 | −0.81 ± 71.80 ^ | NS | 218 ± 40.20 | 2.53 ± 43.75 ^ | NS | 133.51 ± 4.81 | 3.12 ± 35.60 ^ | NS | 67.76 ± 17.65 | −0.37 ± 14.98 ^ | NS | N/A |
| FLiO diet | Mogna-Pelaez et al. (2024) [13] | 90.73 ± 6.49 | −8.08 ± 11.09 ^ | p < 0.005 | 4.16 ± 1.79 | −5.64 ± 5.46 ^ | p < 0.001 | 0.94 ± 0.43 | −1.55 ± 1.54 ^ | p < 0.001 | 5.14 ± 0.38 | −0.08 ± 0.43 ^ | NS | 83.57 ± 38.16 | −20.08 ± 59.01 | NS | 218 ± 40.20 | −5.15 ± 25.66 ^ | NS | 133.51 ± 4.81 | −3.48 ± 22.57 ^ | NS | 67.76 ± 17.65 | 3.88 ± 8.73 ^ | NS | N/A |
| MED | George et al. (2022) [22] | 5.8 ± 1.6 * | 5.7 ± 1.1 * | p = 0.410 | 16.4 ± 8.9 | 15.5 ± 8.5 | p < 0.740 | 4.4 ± 3.2 | 3.9 ± 2.3 | p < 0.650 | N/A | N/A | N/A | 1.8 ± 0.9 * | 1.7 ± 0.8 * | p = 0.490 | 5.1 ± 1.6 * | 5.1 ± 1.6 * | p = 0.072 | 3.2 ± 1.3 * | 3.1 ± 1.3 * | p = 0.487 | 1.2 ± 0.2 * | 1.2 ± 0.3 * | p = 0.450 | hs-CRP-B: 2.6 ± 2.3 * PI: 2.2 ± 1.9 * p = 0.890 |
| Properzi et al. (2018) [23] | 100.3 ± 29.7 | 105.8 ± 31.7 | p = 0.920 | 12.2 ± 6.69 | 15.33 ± 8.8 | p = 0.330 | 3.91 ± 1.92 | 3.63 ± 1.93 | p = 0.263 | 6.1 ± 1.1 | 5.9 ± 1.0 | p = 0.045 | 165.6 ± 76.2 | 144.2 ± 76.2 | p = 0.008 | 184.8 ± 49.9 | 175.2 ± 49.5 | p = 0.010 | 109.4 ± 44.9 | 105.6 ± 43.3 | p = 0.024 | 41.8 ± 8.5 | 41.4 ± 8.5 | p = 0.052 | N/A | |
| Ristic-Medic et al. (2020) [21] | 5.11 ± 0.51 * | 4.49 ± 0.68 * | p = 0.000 | 17.70 ± 3.24 * | 13.67 ± 2.94 * | p = 0.000 | 3.96 (3.40–4.76) ^ | 2.63 (2.28–3.04) ^ | p = 0.000 | N/A | N/A | N/A | 1.92 (1.35–2.55) *^ | 1.06 (0.80–1.20) *^ | p = 0.000 | 6.00 ± 0.78 * | 4.83 0.95 * | p = 0.000 | 3.67 ± 0.72 * | 2.88 ± 0.82 * | p = 0.000 | 1.29 ± 0.13 * | 1.41 ± 0.15 * | p = 0.000 | hs-CRP-B: 1.02 (0.75–2.23) ^ PI: 0.81 (0.34–1.40) ^ p = 0.000 | |
| TMD | Kestane and Bas (2024) [24] | 123.29 ± 17.08 | 106.05 ± 13.67 | p = 0.010 | N/A | N/A | N/A | 4.24 ± 0.70 | 2.38 ± 0.46 | p = 0.010 | N/A | N/A | N/A | N/A | N/A | N/A | N/A | N/A | N/A | N/A | N/A | N/A | N/A | N/A | N/A | N/A |
| LCMD | 117.14 ± 13.33 | 103.05 ± 10.93 | p = 0.010 | N/A | N/A | N/A | 3.85 ± 0.70 | 2.50 ± 0.55 | p = 0.010 | N/A | N/A | N/A | N/A | N/A | N/A | N/A | N/A | N/A | N/A | N/A | N/A | N/A | N/A | N/A | N/A | |
| LFMD | 114.14 ± 13.47 | 102.71 ± 10.79 | p = 0.010 | N/A | N/A | N/A | 4.24 ± 1.00 | 2.67 ± 0.80 | p = 0.010 | N/A | N/A | N/A | N/A | N/A | N/A | N/A | N/A | N/A | N/A | N/A | N/A | N/A | N/A | N/A | N/A | |
| LFD | George et al. (2022) [22] | 6.7 ± 2.0 * | 6.8 ± 2.4 * | p = 0.82 | 20.0 ± 12.4 | 16.4 ± 11.3 | p < 0.0005 | 6.5 ± 5.6 | 5.5 ± 5.5 | p < 0.0005 | N/A | N/A | N/A | 1.8 ± 0.9 * | 1.6 ± 0.7 * | p = 0.410 | 4.9 ± 1.5 * | 4.7 ± 1.4 * | p = 0.084 | 2.9 ± 1.3 * | 2.8 ± 1.3 * | p = 0.270 | 1.2 ± 0.3 * | 1.2 ± 0.3 * | p = 0.570 | hs-CRP-B: 3.8 ± 2.7 * PI: 3.5 ± 2.6 * p = 0.310 |
| Properzi et al. (2018) [23] | 99.2 ± 17.3 | 97.0 ± 27.4 | p = 0.070 | 14.5 ± 12.2 | 11.64 ± 9.16 | p = 0.05 | 2.76 ± 1.52 | 2.95 ± 4.32 | p = 0.040 | 6.0 ± 0.8 | 5.8 ± 0.8 | p = 0.390 | 144.4 ± 59.3 | 139.9 ± 0.64 | p = 0.380 | 202.2 ± 34.8 | 199.2 ± 41.2 | p = 0.270 | 123.7 ± 30.2 | 122.6 ± 33.3 | p = 0.034 | 49.5 ± 10.4 | 48.3 ± 9.7 | p = 0.031 | N/A | |
| Ristic-Medic et al. (2020) [21] | 5.20 ± 0.45 * | 4.84 ± 0.48 * | p = 0.032 | 17.33 ± 3.76 * | 14.38 ± 3.17 * | p = 0.006 | 4.07 (3.45–4.43) ^ | 2.86 (2.53–3.37) ^ | p = 0.000 | N/A | N/A | N/A | 2.40 (1.55–2.69) *^ | 1.29 (1.20–1.57) *^ | p = 0.000 | 6.08 ± 0.69 * | 4.81 ± 0.82 * | p = 0.000 | 3.96 ± 0.89 * | 3.14 ± 0.85 * | p = 0.009 | 1.22 ± 0.12 * | 1.28 ± 0.11 * | p = 0.041 | hs-CRP-B: 2.10 (0.98–3.20) ^ PI: 0.77 (0.54–1.27) ^ p = 0.008 | |
| LCD | Badali et al. (2023) [18] | N/A | N/A | N/A | N/A | N/A | N/A | N/A | N/A | N/A | N/A | N/A | N/A | 136.23 ± 50.50 | 118.50 ± 49.50 | p = 0.013 | 173.35 ± 26.00 | 162.35 ± 24.63 | p = 0.006 | 103.33 ± 27.16 | 92.22 ± 24.56 | p = 0.029 | 42.30 ± 8.61 | 41.90 ± 7.64 | p = 0.636 | N/A |
| Cai et al. (2019) [20] | 5.09 ± 0.91 | 4.94 ± 1.22 | N/A | N/A | N/A | N/A | N/A | N/A | N/A | N/A | N/A | N/A | 2.65 ± 1.69 | 2.40 ± 1.70 | N/A | 4.88 ± 1.38 | 4.65 ± 1.36 | N/A | 2.55 ± 0.79 | 2.51 ± 0.76 | N/A | 1.16 ± 0.50 | 1.18 ± 0.51 | N/A | N/A | |
| Rooholahzadegan et al. (2023) [19] | 93.12 ± 9.63 | 90.64 ± 4.69 | p = 0.013 | N/A | N/A | N/A | N/A | N/A | N/A | 5.49 ± 0.49 | 5.56 ± 0.32 | p = 0.340 | N/A | N/A | N/A | N/A | N/A | N/A | N/A | N/A | N/A | 10.56 ± 8.65 | 9.44 ± 6.70 | p = 0.152 | MCP-1 (pg/mL)-B: 11.64 ± 16.48 PI: 110.01 ± 11.79 p = 0.603; LPS (pg/mL)-B: 20.72 ± 2.43 PI: 20.90 ± 2.36 p = 0.785 | |
| TRF 16/8 | Cai et al. (2019) [20] | 5.12 ± 0.82 | 5.05 ± 1.35 | N/A | N/A | N/A | N/A | N/A | N/A | N/A | N/A | N/A | N/A | 2.90 ± 1.75 | 2.31 ± 1.75 | N/A | 4.53 ± 1.53 | 4.37 ± 1.53 | N/A | 2.73 ± 0.88 | 2.71 ± 0.87 | N/A | 1.16 ± 0.45 | 1.15 ± 0.45 | N/A | N/A |
| Kord-Varkaneh et al. (2023) [16] | 105.36 ± 16.30 | 92.90 ± 21.20 | N/A | 9.16 ± 3.22 | 11.44 ± 4.65 | N/A | 2.39 ± 0.93 | 2.59 ± 1.1 | N/A | N/A | N/A | N/A | 201.50 ± 35.34 | 133.27 ± 48.67 | N/A | 190.04 ± 36.58 | 157.81 ± 33.59 | N/A | 104.63 ± 27.26 | 84.04 ± 26.27 | N/A | 38.18 ± 5.65 | 39.81 ± 5.72 | N/A | hs-CRP-B: 3.14 ± 1.11 PI: 2.02 ± 0.87 p: N/A | |
| ADF | Cai et al. (2019) [20] | 5.21 ± 0.86 | 5.19 ± 0.67 | N/A | N/A | N/A | N/A | N/A | N/A | N/A | N/A | N/A | N/A | 2.80 ± 1.90 | 2.12 ± 1.90 | N/A | 4.87 ± 1.02 | 4.15 ± 1.06 | N/A | 2.82 ± 0.85 | 2.79 ± 0.83 | N/A | 1.23 ± 0.43 | 1.17 ± 0.38 | N/A | N/A |
| LOV-D | Garousi et al. (2023) [17] | 99.05 ± 8.43 | 90.62 ± 8.77 | p < 0.001 | 22.75 ± 17.70 | 17.80 ± 17.47 | p < 0.001 | 5.59 ± 4.42 | 3.97 ± 3.75 | p < 0.001 | N/A | N/A | N/A | 169.43 ± 82.95 | 121.43 ± 49.42 | p = 0.001 | 189.24 ± 26.93 | 165.94 ± 26.81 | p < 0.001 | 114.16 ± 25.75 | 92.91 ± 24.33 | p < 0.001 | 44.75 ± 8.61 | 46.32 ± 10.37 | p = 0.354 | N/A |
| SWL-D | Garousi et al. (2023) [17] | 97.00 ± 10.16 | 95.13 ± 8.01 | p = 0.184 | 26.77 ± 24.63 | 27.59 ± 22.59 | p = 0.550 | 6.53 ± 6.46 | 6.56 ± 5.56 | p = 0.932 | N/A | N/A | N/A | 171.84 ± 74.45 | 181.92 ± 81.82 | p = 0.434 | 205.97 ± 44.76 | 208.15 ± 39.38 | p = 0.765 | 123.42 ± 38.48 | 126.78 ± 30.96 | p = 0.614 | 47.91 ± 12.17 | 46.68 ± 11.96 | p = 0.635 | N/A |
| DASH | Rooholahzadegan et al. (2023) [19] | 93.41 ± 9.63 | 90.76 ± 5.69 | p = 0.098 | N/A | N/A | N/A | N/A | N/A | N/A | 5.30 ± 0.35 ` | 5.09 ± 0.34 ` | p = 0.314 | N/A | N/A | N/A | N/A | N/A | N/A | N/A | N/A | N/A | 7.59 ± 3.67 | 13.47 ± 29.77 | p = 0.362 | MCP-1 (pg/mL)-B: 110.75 ± 7.56 PI: 100.44 ± 10.69 p = 0.002; LPS (pg/mL)-B: 21.66 ± 1.83 PI: 18.91 ± 2.98 p < 0.001 |
| Badali et al. (2023) [18] | N/A | N/A | N/A | N/A | N/A | N/A | N/A | N/A | N/A | N/A | N/A | N/A | 178.38 ± 73.04 | 117.05 ± 42.16 | p < 0.001 | 203.85 ± 49.84 | 164.20 ± 30.21 | p < 0.001 | 124.77 ± 32.77 | 87.68 ± 20.54 | p < 0.001 | 48.55 ± 9.70 | 45.85 ± 9.54 | p = 0.128 | N/A | |
| Sakkarin Chirapongsathorn et al. (2023) [11] | 92.5 ± 10.3 | 92.6 ± 11.3 | N/A | N/A | N/A | N/A | N/A | N/A | N/A | N/A | N/A | N/A | 132 ± 61.1 | 117.5 ± 70.8 | N/A | 197.8 ± 30.4 | 198.3 ± 41.01 | N/A | 128.3 ± 33.1 | 124.8 ± 43.5 | N/A | 54.9 ± 13.5 | 56.1 ± 13.09 | N/A | N/A | |
| Razavi Zade et al. (2016) [15] | 93.7 ± 12.5 | 92.6 ± 11.2 | p = 0.51 | 12.2 ± 5.2 | 8.9 ± 5.0 | p < 0.001 | 2.9 ± 1.5 | 2.1 ± 1.4 | p < 0.001 | N/A | N/A | N/A | 164.3 ± 64.5 | 133.0 ± 53.7 | p = 0.006 | 187.4 ± 33.9 | 173.4 ± 33.0 | p = 0.04 | 111.8 ± 28.5 | 100.8 ± 28.2 | p = 0.110 | 42.7 ± 5.8 | 46.1 ± 6.0 | p = 0.002 | hs-CRP-B:4823.1 ± 3358.9 PI: 3598.4 ± 2752.6 p = 0.004 | |
| KD | Sakkarin Chirapongsathorn et al. (2023) [11] | 82.99 ± 11.12 | 76.8 ± 11.4 | N/A | 31.93 ± 2.7 | 29.4 ± 2.9 | N/A | 102.44 ± 9.67 | 93.5 ± 5.5 | N/A | 34.2 ± 5.8 ** | 29.3 ± 6.6 ** | N/A | 84.1 ± 11.9 | 79.3 ± 11.06 | N/A | 132.3 ± 12.2 | 122.9 ± 11.2 | N/A | N/A | N/A | N/A | N/A | N/A | N/A | N/A |
| CR | Asghari et al. (2022) [14] | 89.62 ± 14.20 | N/A | N/A | 31.32 ± 3.31 | 103.93 ± 10.30 | N/A | N/A | N/A | N/A | N/A | N/A | N/A | N/A | N/A | N/A | N/A | N/A | N/A | N/A | N/A | N/A | N/A | N/A | N/A | N/A |
| ND | Asghari et al. (2022) [14] | 86.61 ± 10.70 | N/A | N/A | 30.41 ± 3.39 | 101.88 ± 8.18 | N/A | N/A | N/A | N/A | N/A | N/A | N/A | N/A | N/A | N/A | N/A | N/A | N/A | N/A | N/A | N/A | N/A | N/A | N/A | N/A |
| CN | Razavi Zade et al. (2016) [15] | 93.8 ± 11.2 | 91.4 ± 10.5 | p = 0.180 | 11.7 ± 7.0 | 10.6 ± 6.2 | p = 0.150 | 2.7 ± 1.7 | 2.5 ± 1.5 | p = 0.100 | N/A | N/A | N/A | 158.1 ± 58.2 | 158.4 ± 96.7 | p = 0.970 | 190.3 ± 29.5 | 188.4 ± 27.6 | p = 0.680 | 114.7 ± 32.3 | 111.9 ± 32.9 | p = 0.570 | 44.0 ± 5.9 | 44.8 ± 6.3 | p = 0.450 | hs-CRP-B: 4957.0 ± 3421.8 PI: 4637.5 ± 2872.0 p = 0.080 |
| Kord-Varkaneh et al. (2023) [16] | 102.82 ± 11.71 | 105.78 ± 14.16 | N/A | 10.78 ± 3.78 | 12.15 ± 5.25 | N/A | 2.77 ± 1.11 | 3.15 ± 1.41 | N/A | N/A | N/A | N/A | 187.6 ± 73.61 | 199.56 ± 87.43 | N/A | 172.21 ± 37.99 | 180.72 ± 49.49 | N/A | 93.73 ± 31.77 | 97.45 ± 35.46 | N/A | 34.82 ± 7.65 | 33.73 ± 6.70 | N/A | hs-CRP-B: 2.72 ± 1.04 PI: 2.75 ± 1.13 p: N/A | |
| Change in the Glucose and Lipid Metabolism Outcomes Along with Inflammatory Status Between Interventions with Dietary Model Patterns in MASLD | ||||||||||||
|---|---|---|---|---|---|---|---|---|---|---|---|---|
| Compared Dietary Models | Reference | Glucose | Insulin | HOMA-IR | HbA1c | Triglycerides | Cholest-erol | LDL-C | HDL-C | hs-CRP | MCP-1 | LPS |
| AHA vs. FLiO | Mogna-Pelaez et al. (2024) [13] | NS | NS | NS | NS | NS | NS | NS | NS | N/A | N/A | N/A |
| MED vs. LFD | George et al. (2022) [22] | p = 0.430 | p = 0.067 | p = 0.170 | N/A | p = 0.670 | p = 0.170 | p = 0.480 | p = 0.570 | p = 0.770 | N/A | N/A |
| Properzi et al. (2018) [23] | p = 0.485 | p = 0.281 | p = 0.268 | p = 0.278 | p = 0.284 | p = 0.457 | p = 0.755 | p = 0.605 | N/A | N/A | N/A | |
| Ristic-Medic et al. (2020) [21] | p = 0.145 | p = 0.475 | p = 0.142 | N/A | p = 0.048 | p = 0.760 | p = 0.857 | p = 0.041 | p = 0.239 | N/A | N/A | |
| TMD vs. LCMD vs. LFMD | Kestane and Bas (2024) [24] | p = 0.610 | N/A | p = 0.320 | N/A | N/A | N/A | N/A | N/A | N/A | N/A | N/A |
| TRF 16/8 vs. CN | Kord-Varkaneh et al. (2023) [16] | p = 0.015 | p = 0.880 | p = 0.246 | N/A | p ˂ 0.001 | p ˂ 0.001 | p = 0.014 | p = 0.159 | p ˂ 0.001 | N/A | N/A |
| ADF vs. CN | Cai et al. (2019) [20] | NS | NS | N/A | N/A | p ˂ 0.001 | p ˂ 0.001 | NS | NS | N/A | N/A | N/A |
| TRF vs. CN | NS | NS | N/A | N/A | p ˂ 0.001 | NS | NS | NS | N/A | N/A | N/A | |
| DASH vs. LCD | Rooholahzadegan et al. (2023) [19] | p = 0.923 | N/A | N/A | p ˂ 0.001 | N/A | N/A | N/A | p = 0.080 | N/A | p = 0.027 | p = 0.011 |
| Badali et al. (2023) [18] | N/A | N/A | N/A | N/A | p = 0.037 | p = 0.011 | p = 0.002 | p = 0.649 | N/A | N/A | N/A | |
| DASH vs. KD | Sakkarin Chirapongsathorn et al. (2023) [11] | p = 0.720 | N/A | N/A | N/A | p = 0.170 | p = 0.730 | p = 0.509 | p = 0.220 | N/A | N/A | N/A |
| DASH vs. CN | Razavi Zade et al. (2016) [15] | p = 0.610 | p = 0.010 | p = 0.010 | N/A | p = 0.040 | p = 0.150 | p = 0.330 | p = 0.080 | p = 0.030 | N/A | N/A |
| LOV-D vs. SWL-D | Garousi et al. (2023) [17] | p = 0.001 | p = 0.006 | p ˂ 0.001 | N/A | p = 0.006 | p ˂ 0.001 | p ˂ 0.001 | p = 0.770 | N/A | N/A | N/A |
| CR vs. ND | Asghari et al. (2022) [14] | p = 0.140 | N/A | N/A | N/A | p = 0.110 | p = 0.030 | p = 0.115 | p = 0.890 | N/A | N/A | N/A |
| Dietary Pattern Model | Liver Function Outcomes | |||||||||||||||
|---|---|---|---|---|---|---|---|---|---|---|---|---|---|---|---|---|
| Hepatic Enzymes | Hepatic Steatosis | Liver Fibrosis | Hepatic Inflammation | Grade of Fatty Liver | ||||||||||||
| AST | ALT | ALP | CAP | |||||||||||||
| B | PI | p | B | PI | p | B | PI | p | B | PI | p | |||||
| AHA | Mogna-Pelaez et al. (2024) [13] | 23.63 ± 10.92 | 0.31 ± 6.53 ^ | NS | 21.49 ± 14.34 | −2.72 ± 15.76 ^ | NS | N/A | N/A | N/A | 3.62 ± 1.93 | −0.12 ± 4.09 ^ | NS | LSM-B: 4.26 ± 0.8 PI: 0.57 ± 0.49 ^ p: NS; ARFI-B: 1.25 ± 0.32 PI: 0.05 ± 0.14 ^ p: NS; IHL-B: 27.26 ± 38.48 PI: −4.72 ± 34.14 ^ p: NS | FLI-B: 17.00 ± 18.10 PI: −11.03 ± 21.18 ^ p < 0.005 | |
| FLiO diet | Mogna-Pelaez et al. (2024) [13] | 23.63 ± 10.92 | −1.08 ± 6.84 ^ | NS | 21.49 ± 14.34 | −9.35 ± 15.60 ^ | p < 0.001 | N/A | N/A | N/A | 3.62 ± 1.93 | −1.09 ± 2.84 ^ | NS | LSM-B: 4.26 ± 0.8 PI:-0.90 ± 0.54 ^ p: NS; ARFI-B: 1.25 ± 0.32 PI: 0.14 ± 0.14 ^ p: NS; IHL-B: 27.26 ± 38.48 PI:- 10.46 ± 18.57 ^ p: NS | FLI-B: 17.00 ± 18.10 PI:-21.76 ± 18.92 ^ p < 0.001 | |
| MED | George et al. (2022) [22] | 31.8 ± 12.6 | 39.7 ± 27.4 | p = 0.290 | 54.1 ± 25.2 | 64.7 ± 39.5 | p = 0.032 | 91.5 ± 27.7 | 96.8 ± 31.3 | p = 0.520 | 13.7 ± 7.8 | 12.1 ± 7.8 | p = 0.069 | IHL-B: 90.1 ± 74.6 PI: 105.1 ± 91.2 p = 0.260 | N/A | |
| Properzi et al. (2018) [23] | N/A | N/A | N/A | 77 ± 51 | 69 ± 47 | p = 0.049 | N/A | N/A | N/A | 34.2 ± 16.3 | 24.0 ± 14.7 | p < 0.001 | HepaScore-B: 0.39 ± 0.33 PI: 0.41 ± 0.32 p = 0.780; IHL-B: 102 ± 120 PI: 83 ± 99 p < 0.001 | N/A | ||
| Ristic-Medic et al. (2020) [21] | 32.50 (23.00–32.75) | 20.00 (16.00–21.75) | p = 0.000 | 65.33 ± 23.90 | 27.33 ± 6.46 | p = 0.000 | N/A | N/A | N/A | N/A | N/A | N/A | IHL-B: 47.42 ± 36.25 PI: 24.33 ± 11.57 p = 0.000 | FLI-B: 81.92 ± 9.95 PI: 43.17 ± 7.99 p = 0.000; HSI-B: 47.6 ± 4.92 PI: 39.34 ± 3.24 p = 0.000 | ||
| TMD | Kestane and Bas (2024) [24] | 42.19 ± 13.36 | 26.76 ± 7.08 | p = 0.010 | 69.19 ± 14.48 | 48.52 ± 9.00 | p = 0.010 | N/A | N/A | N/A | N/A | N/A | N/A | FIB-4-B: 0.61 ± 0.22 PI: 0.48 ± 0.16 p = 0.010; IHL-B: 35.38 ± 7.05 PI: 20.81 ± 5.73 p = 0.010 | FLI-B: 85.62 ± 7.34 PI: 60.38 ± 13.15 p = 0.010 | |
| LCMD | 45.71 ± 14.62 | 34.90 ± 8.17 | p = 0.010 | 66.38 ± 11.36 | 51.43 ± 6.34 | p = 0.010 | N/A | N/A | N/A | N/A | N/A | N/A | FIB-4-B: 0.73 ± 0.28 PI: 0.61 ± 0.20 p = 0.010; IHL-B: 39.33 ± 11.13 PI: 31.24 ± 8.17 p = 0.010 | FLI-B: 87.90 ± 8.79 PI: 71.95 ± 17.18 p = 0.010 | ||
| LFMD | 50.43 ± 16.50 | 37.24 ± 10.60 | p = 0.010 | 68.67 ± 15.30 | 51.95 ± 10.79 | p = 0.010 | N/A | N/A | N/A | N/A | N/A | N/A | FIB-4-B: 0.73 ± 0.22 PI: 0.62 ± 0.17 p = 0.010; IHL-B: 43.29 ± 12.10 PI: 30.76 ± 8.26 p = 0.010 | FLI-B: 88.71 ± 4.77 PI: 68.71 ± 10.97 p = 0.010 | ||
| LFD | George et al. (2022) [22] | 35.65 (25.00–41.50) | 25.50 (18.75–30.75) | p = 0.006 | 63.17 ± 15.76 | 31.92 ± 11.89 | p = 0.000 | N/A | N/A | N/A | N/A | N/A | N/A | IHL-B: 42.53 ± 10.48 PI: 27.08 ± 9.90 p = 0.000 | FLI-B: 83.52 ± 10.76 PI: 55.08 ± 18.22 p = 0.000; HSI-B: 45.85 ± 4.63 PI: 37.67 ± 4.07 p = 0.000 | |
| Properzi et al. (2018) [23] | 41.8 ± 21.6 | 34.1 ± 15.4 | p = 0.040 | 61.5 ± 37.0 | 46.9 ± 20.8 | p = 0.009 | 93.3 ± 33.3 | 94.2 ± 24.9 | p = 0.710 | 9.2 ± 10.7 | 8.9 ± 12.4 | p = 0.020 | IHL-B: 126.7 ± 128.8 PI: 95.2 ± 72.9 p = 0.029 | N/A | ||
| Ristic-Medic et al. (2020) [21] | N/A | N/A | N/A | 68 ± 66 | 56 ± 45 | p = 0.004 | N/A | N/A | N/A | 21.5 ± 10.0 | 15.3 ± 7.7 | p < 0.001 | HepaScore-B: 0.26 ± 0.28 PI: 0.30 ± 0.29 p = 0.090; IHL-B: 121 ± 125 PI: 102 ± 110 p = 0.055 | N/A | ||
| LCD | Badali et al. (2023) [18] | 26.75 ± 9.28 | 25.05 ± 8.70 | p = 0.067 | 37.35 ± 18.37 | 31.60 ± 16.24 | p = 0.019 | N/A | N/A | N/A | N/A | N/A | N/A | N/A | N/A | |
| Cai et al. (2019) [20] | 26.75 ± 9.28 | 25.05 ± 8.70 | p = 0.067 | 37.35 ± 18.37 | 31.60 ± 16.24 | p = 0.019 | N/A | N/A | N/A | N/A | N/A | N/A | N/A | N/A | ||
| Rooholahzadegan et al. (2023) [19] | N/A | N/A | N/A | N/A | N/A | N/A | N/A | N/A | N/A | N/A | N/A | N/A | N/A | N/A | ||
| TRF 16/8 | Cai et al. (2019) [20] | N/A | N/A | N/A | N/A | N/A | N/A | N/A | N/A | N/A | N/A | N/A | N/A | N/A | ||
| Kord-Varkaneh et al. (2023) [16] | 26.31 ± 6.16 | 20.50 ± 4 | N/A | 34.04 ± 13.88 | 21.22 ± 5.38 | N/A | N/A | N/A | N/A | N/A | N/A | N/A | LSM-B: 6.33 ± 1.01 PI: 5.15 ± 1.15 p: N/A; IHL-B: 33.00 ± 14.99 PI: 23.18 ± 11.05 p: N/A | N/A | ||
| ADF | Cai et al. (2019) [20] | N/A | N/A | N/A | N/A | N/A | N/A | N/A | N/A | N/A | N/A | N/A | N/A | N/A | N/A | |
| LOV-D | Garousi et al. (2023) [17] | 30.94 ± 13.20 | 22.43 ± 6.93 | p < 0.001 | 46.02 ± 28.58 | 24.70 ± 15.82 | p < 0.001 | N/A | N/A | N/A | N/A | N/A | N/A | N/A | N/A | |
| SWL-D | Garousi et al. (2023) [17] | 29.94 ± 11.14 | 25.78 ± 9.36 | p = 0.013 | 42.26 ± 23.37 | 32.10 ± 18.55 | p = 0.004 | N/A | N/A | N/A | N/A | N/A | N/A | N/A | N/A | |
| DASH | Rooholahzadegan et al. (2023) [19] | 24.10 ± 10.91 | 18.40 ± 6.57 | p = 0.005 | 27.20 ± 14.0 | 18.40 ± 6.57 | p = 0.001 | N/A | N/A | N/A | N/A | N/A | N/A | N/A | N/A | |
| Badali et al. (2023) [18] | 24.10 ± 10.91 | 18.40 ± 6.57 | p = 0.005 | 24.3 ± 10.3 | 18.75 ± 8.91 | p = 0.001 | N/A | N/A | N/A | N/A | N/A | N/A | N/A | |||
| Sakkarin Chirapongsathorn et al. (2023) [11] | 19.8 ± 6.1 | 20 ± 4.5 | N/A | 28.6 ± 12.1 | 23.1 ± 8.7 | N/A | N/A | N/A | N/A | N/A | N/A | N/A | LSM-B: 5.01 ± 1.2 PI: 4.3 ± 0.7 p: N/A | N/A | ||
| Razavi Zade et al. (2016) [15] | 42.7 ± 34.1 | 32.0 ± 16.6 | p = 0.020 | 36.4 ± 19.1 | 28.0 ± 20.8 | p = 0.010 | 206.2 ± 54.8 | 179.9 ± 55.9 | p < 0.001 | N/A | N/A | N/A | N/A | % B: Grade I 6 ± 20.0; Grade II 14 ± 46.7; Grade III 10 ± 33.3; % PI: Grade I 20 ± 66.7; Grade II 10 ± 33.3; Grade III 0 ± 0.0 | ||
| KD | Sakkarin Chirapongsathorn et al. (2023) [11] | 29.2 ± 11.6 | 22.6 ± 4.8 | N/A | 44.08 ± 21.3 | 28.6 ± 12.1 | N/A | N/A | N/A | N/A | N/A | N/A | N/A | LSM-B: 5.9 ± 3.1 PI: 5.2 ± 1.7 p: N/A | N/A | |
| CR | Asghari et al. (2022) [14] | 33.66 ± 12.62 | 29.58 ± 12.57 | p = 0.160 | 43.58 ± 26.38 | 39.25 ± 24.21 | p = 0.040 | N/A | N/A | N/A | N/A | N/A | N/A | N/A | N/A | (n) B: Grade 0-0, Grade I-10, Grade II -17, Grade III-3; (n) PI: Grade 0-0, Grade I-11, Grade II -17, Grade III-2. |
| ND | Asghari et al. (2022) [14] | 29.85 ± 9.80 | 34.27 ± 21.06 | p = 0.040 | 33.71 ± 20.36 | 40.94 ± 28.81 | p = 0.070 | N/A | N/A | N/A | N/A | N/A | N/A | N/A | N/A | |
| CN | Razavi Zade et al. (2016) [15] | N/A | N/A | N/A | N/A | N/A | N/A | N/A | N/A | N/A | N/A | N/A | N/A | N/A | % B: Grade I 8 ± 26.7; Grade II 14 ± 46.7; Grade III 8 ± 26.7; % PI: Grade I 19 ± 63.3; Grade II 5 ± 16.7; Grade III 6 ± 20.0 | |
| Kord-Varkaneh et al. (2023) [16] | 23.68 ± 8.20 | 23.77 ± 9.66 | N/A | 30.34 ± 5.13 | 28.04 ± 8.12 | N/A | N/A | N/A | N/A | N/A | N/A | N/A | LSM-B: 5.82 ± 1.44 PI: 5.46 ± 1.32 p: N/A; IHL-B: 34.77 ± 12.93 PI: 39.22 ± 36.95 p: N/A | N/A | ||
| Change in the Liver Function Outcomes Between Interventions with Dietary Model Patterns in MASLD | |||||||||||||
|---|---|---|---|---|---|---|---|---|---|---|---|---|---|
| Compared Dietary Models | Reference | AST | ALT | GGT | IHL | CAP | LSM | ARFI | FLI Index | HSI Index | Hepascore | FIB-4 Score | Liver Pathology Staging |
| AHA vs. FLiO | Mogna-Pelaez et al. (2024) [13] | NS | NS | NS | NS | NS | NS | NS | p = 0.054 | N/A | N/A | N/A | N/A |
| MED vs. LFD | George et al. (2022) [22] | p = 0.073 | p = 0.017 | p = 0.042 | p = 0.870 | N/A | p = 0.580 | N/A | N/A | N/A | N/A | N/A | N/A |
| Properzi et al. (2018) [23] | N/A | p = 0.363 | p = 0.716 | p= 0.722 | N/A | p = 0.697 | N/A | N/A | N/A | p = 0.885 | N/A | N/A | |
| Ristic-Medic et al. (2020) [21] | p = 0.017 | p = 0.128 | p = 0.224 | N/A | N/A | N/A | N/A | p = 0.021 | p = 0.435 | N/A | N/A | N/A | |
| TMD vs. LCMD vs. LFMD | Kestane and Bas (2024) [24] | p = 0.010 | p = 0.410 | p = 0.010 | N/A | N/A | N/A | N/A | p = 0.003 | N/A | N/A | p = 0.020 | N/A |
| TRF 16/8 vs. CN | Kord-Varkaneh et al. (2023) [16] | p = 0.010 | p = 0.013 | p = 0.026 | N/A | p = 0.009 | p ˂ 0.001 | N/A | N/A | N/A | N/A | N/A | N/A |
| ADF vs. CN | Cai et al. (2019) [20] | N/A | N/A | N/A | N/A | N/A | NS | N/A | N/A | N/A | N/A | N/A | N/A |
| TRF vs. CN | N/A | N/A | N/A | N/A | N/A | NS | N/A | N/A | N/A | N/A | N/A | N/A | |
| DASH vs. LCD | Rooholahzadegan et al. (2023) [19] | p = 0.008 | p = 0.149 | N/A | N/A | N/A | N/A | N/A | N/A | N/A | N/A | N/A | N/A |
| Badali et al. (2023) [18] | p = 0.202 | p = 0.240 | N/A | N/A | p = 0.590 | p = 0.120 | N/A | N/A | N/A | N/A | N/A | N/A | |
| DASH vs. KD | Sakkarin Chirapongsathorn et al. (2023) [11] | p = 0.040 | p = 0.053 | N/A | N/A | p = 0.053 | p = 0.970 | N/A | N/A | N/A | N/A | N/A | N/A |
| DASH vs. CN | Razavi Zade et al. (2016) [15] | p = 0.060 | p = 0.020 | N/A | N/A | N/A | N/A | N/A | N/A | N/A | N/A | N/A | p = 0.003 |
| LOV-D vs. SWL-D | Garousi et al. (2023) [17] | p = 0.08 | p = 0.04 | N/A | N/A | N/A | N/A | N/A | N/A | N/A | N/A | N/A | N/A |
| CR vs. ND | Asghari et al. (2022) [14] | p = 0.020 | p = 0.010 | N/A | N/A | N/A | N/A | N/A | N/A | N/A | N/A | N/A | p = 0.350 |
Disclaimer/Publisher’s Note: The statements, opinions and data contained in all publications are solely those of the individual author(s) and contributor(s) and not of MDPI and/or the editor(s). MDPI and/or the editor(s) disclaim responsibility for any injury to people or property resulting from any ideas, methods, instructions or products referred to in the content. |
© 2025 by the authors. Licensee MDPI, Basel, Switzerland. This article is an open access article distributed under the terms and conditions of the Creative Commons Attribution (CC BY) license (https://creativecommons.org/licenses/by/4.0/).
Share and Cite
Jurek, J.M.; Zablocka-Sowinska, K.; Clavero Mestres, H.; Reyes Gutiérrez, L.; Camaron, J.; Auguet, T. The Impact of Dietary Interventions on Metabolic Outcomes in Metabolic Dysfunction-Associated Steatotic Liver Disease (MASLD) and Comorbid Conditions, Including Obesity and Type 2 Diabetes. Nutrients 2025, 17, 1257. https://doi.org/10.3390/nu17071257
Jurek JM, Zablocka-Sowinska K, Clavero Mestres H, Reyes Gutiérrez L, Camaron J, Auguet T. The Impact of Dietary Interventions on Metabolic Outcomes in Metabolic Dysfunction-Associated Steatotic Liver Disease (MASLD) and Comorbid Conditions, Including Obesity and Type 2 Diabetes. Nutrients. 2025; 17(7):1257. https://doi.org/10.3390/nu17071257
Chicago/Turabian StyleJurek, Joanna Michalina, Katarzyna Zablocka-Sowinska, Helena Clavero Mestres, Leyre Reyes Gutiérrez, Javier Camaron, and Teresa Auguet. 2025. "The Impact of Dietary Interventions on Metabolic Outcomes in Metabolic Dysfunction-Associated Steatotic Liver Disease (MASLD) and Comorbid Conditions, Including Obesity and Type 2 Diabetes" Nutrients 17, no. 7: 1257. https://doi.org/10.3390/nu17071257
APA StyleJurek, J. M., Zablocka-Sowinska, K., Clavero Mestres, H., Reyes Gutiérrez, L., Camaron, J., & Auguet, T. (2025). The Impact of Dietary Interventions on Metabolic Outcomes in Metabolic Dysfunction-Associated Steatotic Liver Disease (MASLD) and Comorbid Conditions, Including Obesity and Type 2 Diabetes. Nutrients, 17(7), 1257. https://doi.org/10.3390/nu17071257