Abstract
Background/Objectives: Low vitamin D levels are associated with an elevated risk of Alzheimer’s disease (AD). Given the rising prevalence of diabetes and its association with AD, this study investigated whether vitamin D modulates amyloidogenesis and inflammation in the brains of diabetic mice. Methods: Five-week-old male C57BLKS/J-m+/m+(con) and C57BLKS/J-db/db (db) mice received diets with low or high vitamin D (LVD or HVD) for 8 weeks. Hippocampal neuronal morphology was assessed using H&E and Nissl staining, and Aβ levels, along with the mRNA expression of genes related to amyloidogenesis, amyloid degradation, inflammation, antioxidation, and neurotrophic factors, were measured in the hippocampus and prefrontal cortex (PFC). Results: High dietary vitamin D levels attenuated neuronal necrosis in db/db mice. Hippocampal App and Bace1 expression levels were higher in db/db mice; however, amyloidogenic gene (App, Bace1, Ps1) expression levels in both the hippocampus and PFC were significantly lower in db_HVD group compared with those in db_LVD group (all p < 0.05). Among control mice, PFC App and Ps1 expression levels were lower in con_HVD group than in con_LVD group. Nonetheless, Aβ42 protein levels were not affected by either diabetes or dietary vitamin D levels. Furthermore, lower hippocampal Iκbα and PFC Mcp-1 expression levels in db_HVD group than those in db_LVD group were observed, both upregulated in diabetic mice. Amyloid degradation-related gene or Vdr expression was not altered by dietary vitamin D levels. Conclusions: These findings suggest that vitamin D may exert neuroprotective effects on the hippocampus and PFC in diabetic mice by mitigating neuronal damage and suppressing amyloidogenic and inflammatory gene expression.
1. Introduction
Alzheimer’s disease (AD) is the most prevalent neurodegenerative disorder, characterized by progressive cognitive decline. According to the 2022 World Alzheimer Report, more than 55 million people worldwide were living with dementia, including AD, in 2019, and this number is expected to rise to 139 million by 2050 [1]. This trend underscores the urgent need for developing both preventive and therapeutic strategies for AD. A key pathological feature of AD is the accumulation of amyloid-beta (Aβ) and the presence of neuroinflammation [2]. Aβ accumulation involves the release of Aβ peptides into the extracellular space, where they aggregate into insoluble amyloid plaques. These plaques form around neurons, exert neurotoxic effects, activate inflammatory cascades, and ultimately lead to neuronal death [3]. Beyond Aβ aggregation, neuroinflammation and regional brain atrophy in the hippocampus are reported as early pathological features of AD [4,5]. Furthermore, chronic diseases such as type 2 diabetes mellitus (T2DM), which become more prevalent with aging, have been associated with the early pathology of AD, emphasizing its multifactorial etiology.
T2DM, a metabolic disorder characterized by insulin resistance and hyperglycemia, has emerged as a significant risk factor for cognitive decline and AD [6]. A 12-year prospective population-based study demonstrated that older adults with T2DM face at least a two-fold increased risk of developing AD compared with those without [7]. Additionally, a meta-analysis found diabetes to be associated with a 1.25–1.91-fold increase in the risk of cognitive impairment and dementia [8]. These epidemiological findings imply that altered insulin signaling or neuroinflammation induced by T2DM may contribute to AD pathogenesis. Insulin can enter the brain through receptor-mediated transport or transcytosis across the blood–brain barrier (BBB). This process has been reported to be attenuated under metabolic and inflammatory conditions, such as obesity and diabetes, through receptor downregulation and endothelial dysfunction [9,10,11]. In T2DM, systemic insulin resistance has been shown to impair central nervous system (CNS) insulin signaling, activating multiple downstream pathways, including the mitogen-activated protein kinase (MAPK) and PI3K/Akt cascade [12,13,14]. These alterations enhance neuroinflammation by increasing the production of proinflammatory cytokines and chemokines. Moreover, T2DM compromises BBB integrity, facilitating the entry of toxic substances and inflammatory mediators into the brain. Such changes may exacerbate neuronal damage, ultimately accelerating AD progression [15].
Vitamin D, a fat-soluble secosteroid hormone, is primarily recognized for its essential role in bone health and mineral homeostasis [16]. Beyond these classical functions, vitamin D exhibits immunomodulatory properties, including anti-inflammatory and antimicrobial effects [17,18], which are particularly relevant in the CNS [19,20]. These effects are supported by the presence of vitamin D receptors (VDRs) and hydroxylases that activate vitamin D in various brain regions, including the hippocampus, prefrontal cortex (PFC), and hypothalamus [21]. Furthermore, since vitamin D can traverse the BBB, it has been reported to exert neuroprotective effects in the brain by alleviating neuroinflammation and oxidative stress, as well we by enhancing the production of neurotrophic factors [22]. Specifically, patients with serum 25(OH)D levels below 25 ng/mL had an increased risk of developing AD compared with those with levels above 25 ng/mL [23]. Furthermore, a 7-year follow-up study indicated that higher dietary vitamin D intake was associated with a lower risk of developing AD among older women [24].
In addition to its functions in the brain, vitamin D regulates glucose metabolism and systemic inflammation, suggesting its potential role in metabolic disorders [25,26]. Vitamin D status was inversely associated with diabetes incidence in NHANES data for non-Hispanic White and Mexican American populations [27], and positively correlated with insulin sensitivity and pancreatic β-cell function in a healthy cohort [28]. Impaired innate immunity observed in diabetes can lead to hyperinflammation, which may further exacerbate diabetic complications, whereas vitamin D has been reported to enhance natural killer cell activity and mitigate inflammation in diabetes [29]. Furthermore, maintaining sufficient vitamin D levels has been associated with an approximately 55% lower risk of T2DM [30].
Diabetic conditions exacerbate early AD hallmarks, including Aβ accumulation, tau hyperphosphorylation, and neuroinflammation [31]. Vitamin D reportedly counteracts these processes by regulating inflammatory cytokines [32], improving glucose metabolism [33], and reducing oxidative stress [34] both in the brain and peripheral tissues. These findings suggest that dietary vitamin D levels may mitigate AD-related pathology, particularly under diabetic conditions. Based on this evidence, the present study investigated whether high dietary vitamin D levels could attenuate early AD pathology in db/db mice, focusing on amyloidogenesis, Aβ degradation, inflammatory markers, and neurotrophic factors in the hippocampus and PFC.
2. Materials and Methods
2.1. Animals and Diets
Five-week-old male C57BLKS/J-m+/m+ and C57BLKS/J-db/db mice were purchased from SLC Japan, Inc. (Shizuoka, Japan). All mice were housed in a semi-specific pathogen-free animal facility at Seoul National University. After a 3-day acclimation period, the mice were randomly assigned to four diet-based experimental groups and fed for 8 weeks: (1) con_LVD: C57BLKS/J-m+/m+ mice fed a 10% fat normal diet with 948 IU vitamin D/kg diet (n = 13), (2) con_HVD: C57BLKS/J-m+/m+ mice fed a 10% normal diet with 9477 IU vitamin D/kg diet (n = 14), (3) db_LVD: C57BLKS/J-db/db mice fed a 10% fat normal diet with 948 IU vitamin D/kg diet (n = 10), and (4) db_HVD: C57BLKS/J-db/db mice fed a 10% normal diet with 9477 IU vitamin D/kg diet (n = 10). The composition of the experimental diets is presented in Table S1. All animal procedures were approved by the Institutional Animal Care and Use Committee of Seoul National University (approval number: SNU-220907-2-1, approval date: 7 September 2022).
2.2. Blood and Tissue Collection
At the end of the 8-week experimental period, animals were subjected to a 12 h fasting period then euthanized via CO2 asphyxiation. Blood samples and brain tissues were collected. Thereafter, the brains were dissected into two hemispheres and further subdivided into the hippocampus, PFC, and thalamus, all of which were also stored at −80 °C for subsequent experiments (Figure S1). For histological analysis, whole brains from selected mice in each group were dissected and immediately fixed in 20% neutral buffered formalin.
2.3. Hematoxylin and Eosin (H&E) Staining and Nissl Staining
After fixation, the brain samples (n = 2–3 animals/group) were embedded in paraffin wax for the histological analysis of hippocampal neurons. The paraffin-embedded tissues were sectioned to a thickness of 4 μm and subjected to histological examination using H&E and Nissl staining to assess histopathological changes in the CA1 region of the hippocampus across the experimental groups. The sections were stained with Harris hematoxylin solution (BBC Biochemical, Washington, DC, USA), eosin Y solution (Sigma-Aldrich, St. Louis, MO, USA), and 0.1% Cresyl Echt Violet Solution (ScyTek Lab, Logan, UT, USA). Stained sections were subsequently examined under a microscope and photographed.
2.4. Total RNA Extraction, cDNA Synthesis, and qRT-PCR
Total RNA was extracted from the hippocampus and PFC of left hemisphere brain tissues of mice (n = 10 for con_LVD and con_HVD; n = 7 for db_LVD and db_HVD), using RNAiso Plus (Takara, Singa, Japan) according to the manufacturer’s instructions. The purity and concentration of the RNA were assessed using a Microvolume Spectrophotometer (DeNovix, Wilmington, DE, USA). The extracted RNA was subsequently reverse-transcribed into cDNA using the PrimeScript™ II First Strand cDNA Synthesis Kit (Takara, Singa, Japan) and amplified using the Light Cycler 96 (Roche, Mannheim, Germany) with TB Green Premix Ex Taq (Takara, Shiga, Japan) to evaluate the relative expression levels of target genes. Glyceraldehyde-3-phosphate dehydrogenase (Gapdh) served as the internal standard to normalize the expression levels of all target genes. The analyzed genes included those involved in Aβ production (App, Bace1, and Ps1) and degradation (Adam10, Ide, and Nep), inflammatory responses (IκBα, Tnf-α, Il-6, Mcp-1, Ccl5, and Cx3cl1), antioxidant responses (Nrf2 and Ho-1), vitamin D signaling (Vdr and Pdia3), calcium homeostasis (CaMKIIα and Serca2b), and neurotrophic factors (Ngf, Bdnf, and Nt-3). The primer sequences for these genes are listed in Table S2.
2.5. Amyloid-Beta 42 (Aβ42) Protein Quantification via Enzyme-Linked Immunosorbent Assay (ELISA)
The right hippocampal regions (n = 5–6 animals/group) were homogenized in 16 volumes of 5 M guanidine–HCl/50 mM Tris-HCl (pH 8.0) and incubated for 3–4 h with gentle mixing. The homogenates were subsequently supplemented with 9 volumes of a protease inhibitor cocktail containing 4-(2-aminoethyl)-benzenesulfonyl fluoride hydrochloride (AEBSF, P-2714; Sigma-Aldrich, St. Louis, MO, USA) and centrifuged at 16,000× g for 20 min at 4 °C. The supernatants were subjected to ELISA for total Aβ42 according to the manufacturer’s instructions (KMB3441; Thermo Fisher Scientific, Waltham, MA, USA). Aβ42 concentrations were normalized to total protein content, measured using the bicinchoninic acid assay, and expressed as pg Aβ42 per μg total protein.
2.6. Western Blot
Total proteins were extracted from the right PFC using RIPA buffer (Biomax, Seoul, Korea) supplemented with a protease inhibitor cocktail containing AEBSF (P-2714, Sigma-Aldrich, St. Louis, MO, USA). The tissue extracts were separated using 15% sodium dodecyl sulfate–polyacrylamide gel electrophoresis and transferred to a polyvinylidene difluoride membrane. The membrane was blocked with 5% skim milk and incubated overnight at 4 °C with primary antibodies against Aβ42 (1:1000, #44-344; Thermo Fisher Scientific, Waltham, MA, USA) and β-actin (1:2000, D6A8; Cell Signaling Technology, Danvers, MA, USA). After washing, the membrane was incubated with horseradish peroxidase-conjugated anti-rabbit IgG secondary antibodies (Cell Signaling Technology, Danvers, MA, USA). Protein bands were visualized using West Glow FEMTO chemiluminescent substrate (Biomax, Seoul, Korea) and quantified using ImageJ software Version 1.54 (National Institutes of Health, MD, USA).
2.7. Statistical Analysis
All data are presented as the mean ± standard error of the mean (SEM). A two-way analysis of variance (ANOVA) was conducted to examine the effects of diabetes, amounts of dietary vitamin D levels, and their interaction across experimental groups. Additionally, one-way ANOVA followed by Fisher’s Least Significant Difference (LSD) post hoc test was used to identify statistical differences among the four groups. Statistical significance was established at p < 0.05. All statistical analyses were performed using SPSS (version 26; IBM SPSS Inc., Chicago, IL, USA).
3. Results
Table 1 presents the body weight, food intake, vitamin D intake, and blood glucose levels of the experimental animals. After 8 weeks of intervention, the body weights of the db/db mice (db_LVD and db_HVD) were approximately 1.3-fold higher, while blood glucose levels were 3.8-fold higher than those of the control mice (con_LVD and con_HVD). The average daily food intake of the db/db mice (5.2 ± 0.13 g) was approximately twice that of the control mice (2.6 ± 0.02 g). In the HVD groups, daily vitamin D intake reached 25.4 ± 0.27 IU (con_HVD) and 53.1 ± 2.69 IU (db_HVD), representing a ten-fold greater intake compared with that in the LVD groups (con_LVD, 2.6 ± 0.01 IU; db_LVD, 5.0 ± 0.12 IU). Despite significant differences in vitamin D intake among groups, dietary vitamin D levels did not significantly affect body weight, food intake, or blood glucose levels in db/db mice.

Table 1.
Body Weight, Food Intake, Vitamin D Intake, and Blood Glucose Levels in Experimental Mice 1,2,3.
To ascertain whether db/db pathology and dietary vitamin D levels induced morphological alterations in hippocampal neurons within the CA1 region, brain sections were examined using H&E (Figure 1A,C) and Nissl (Figure 1B,D) staining. Both staining methods revealed a higher number of apoptotic neurons in the db/db mice compared with those in the control mice (p < 0.05). In particular, histological analysis demonstrated pronounced neuronal cell death in the CA1 region of the db_LVD group, evidenced by numerous red arrows marking apoptotic neurons (Figure 1A). In contrast, the db_HVD group exhibited a lower density of apoptotic neurons (Figure 1B). Quantitative analysis of Nissl-stained sections indicated that the number of apoptotic neurons in the db_LVD group (23.5 ± 11.5) was 3.4-fold higher than in the db_HVD group (7.0 ± 3.0; p < 0.05; Figure 1D). Similarly, H&E staining indicated a 2.1-fold greater tendency of apoptotic neurons in the db_LVD group (21 ± 8.0) than in the db_HVD group (10 ± 4.5) (p = 0.088; Figure 1C). These results indicate that hippocampal neurons in db/db mice may be susceptible to diabetes-induced damage, and that high dietary vitamin D level could potentially mitigate this neurodegeneration.
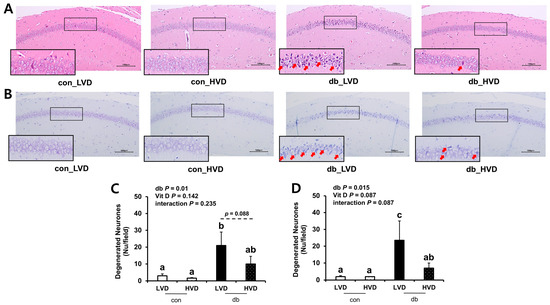
Figure 1.
Morphology of Neuronal Necrosis in the Hippocampal CA1 Region and Quantitative Analysis of Degenerated Neurons. Representative images of (A) H&E staining and (B) Nissl staining. Red arrow indicates dead cells. Quantitative analysis of degenerated neurons is denoted by (C) H&E staining and (D) Nissl staining. Data are presented as mean values ± SEMs (n = 2–3 animals/group). p-values from two-way ANOVA are shown in the upper left corner of the graph to indicate the effects of diabetes, vitamin D levels, and their interaction. Different superscript letters (a, b, c) represent significant group differences (p < 0.05), and p-value on the dashed line indicate difference between two groups, as determined by Fisher’s LSD multiple-comparison test.
To determine whether neuronal damage in db/db mice and its attenuation by vitamin D were linked to Aβ pathology, we analyzed the mRNA expression of amyloidogenic and Aβ degradation-related genes in the hippocampus and PFC. In diabetic mice, the hippocampal expression of App and Bace1, which encode the amyloid precursor protein and β-secretase, respectively, was significantly upregulated, indicating enhanced amyloidogenic activity (two-way ANOVA, p < 0.05). However, the expression of App and Ps1 in the PFC was not significantly affected by diabetes, while Bace1 expression was significantly lower in db/db mice (two-way ANOVA, p < 0.05).
High dietary vitamin D level suppressed the mRNA expression of amyloidogenic genes in both regions of the brain, with significant reductions in App, Bace1, and Ps1 (a component of γ-secretase involved in Aβ generation) in the db_HVD group compared with in the db_LVD group (Figure 2A–F, p < 0.05). Likewise, among control mice, App and Ps1 expression levels in the PFC were significantly lower in the con_HVD group than in the con_LVD group, indicating that vitamin D also modulates amyloidogenic gene expression under non-diabetic conditions.
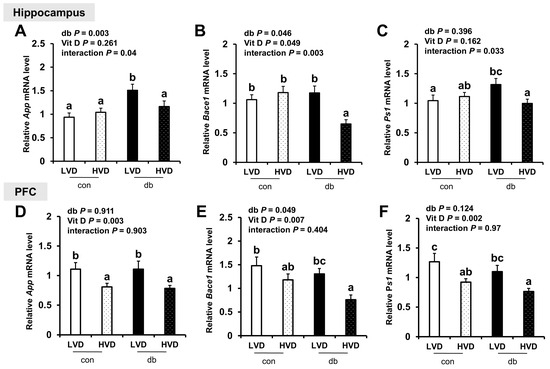
Figure 2.
mRNA Expression Levels of Amyloidogenic Genes in the Hippocampus and PFC. The relative mRNA expression levels of App, Bace1, and Ps1 in the hippocampus (A–C), along with those in the PFC (D–F), were measured using RT-PCR. Data are presented as mean values ± SEMs (n = 10 for con_LVD and con_HVD; n = 7 for db_LVD and db_HVD). p-values from two-way ANOVA are shown in the upper left corner of the graph to indicate the effects of diabetes, vitamin D levels, and their interaction. Different superscript letters (a, b, c) represent significant group differences (p < 0.05), as determined by Fisher’s LSD multiple-comparison test.
Regarding the expression of Aβ degradation-related genes (Adam10, Ide, and Nep), their levels were generally lower in the hippocampus and PFC of db/db mice (two-way ANOVA, p < 0.05); however, dietary vitamin D levels did not markedly affect their expression in either control or diabetic mice (Figure 3A–F).
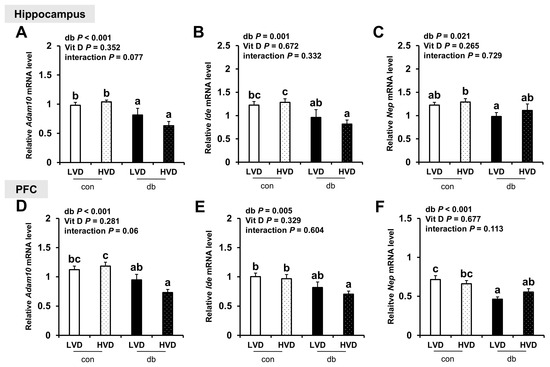
Figure 3.
mRNA Expression Levels of Aβ Degradation-Related Genes in the Hippocampus and PFC. The relative mRNA expression levels of Adam10, Ide, and Nep in the hippocampus (A–C), along with those in the PFC (D–F), were measured using RT-PCR. Data are presented as mean values ± SEMs (n = 10 for con_LVD and con_HVD; n = 7 for db_LVD and db_HVD). p-values from two-way ANOVA are shown in the upper left corner of the graph to indicate the effects of diabetes, vitamin D levels, and their interaction. Different superscript letters (a, b, c) represent significant group differences (p < 0.05, as determined by Fisher’s LSD multiple-comparison test.
To examine whether Aβ protein was accumulated in the hippocampus and PFC, and whether its levels were affected by diabetes and dietary vitamin D levels, Aβ42 protein levels were measured. Despite the upregulation of amyloidogenic genes in db/db mice and their suppression by high dietary vitamin D level, Aβ42 protein levels were not significantly affected by either diabetes or dietary vitamin D levels in the hippocampus or PFC (Figure 4A–C and Figure S2).
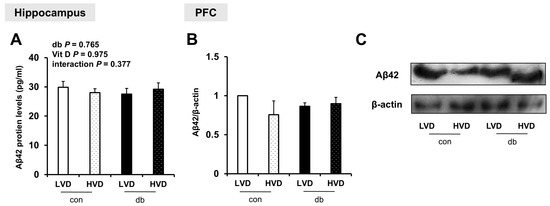
Figure 4.
Aβ42 Protein Levels in the Hippocampus and PFC. (A) Aβ42 protein levels measured using ELISA in the hippocampus. Data are presented as mean values ± SEMs (n = 5–6 animals/group). p-values from two-way ANOVA are shown in the upper left corner of the graph to indicate the effects of diabetes, vitamin D levels, and their interaction. (B,C) Aβ42 protein levels in the PFC assessed using Western blotting. Densitometry results for Aβ42 expression normalized to β-actin. Data are presented as mean values ± SEMs (n = 2 animals/group).
Given the observed reduction in neuronal cell death in the db_HVD group, we subsequently investigated whether different dietary vitamin D levels modulate diabetes-induced inflammation. We analyzed the mRNA expression levels of inflammatory cytokine-related genes (IκBα, Tnf-α, Il-6, Mcp-1, Ccl5, and Cx3cl1) in the hippocampus (Figure 5) and PFC (Figure 6). Overall, diabetic mice exhibited higher expression levels of hippocampal IκBα and Mcp-1, as well as PFC IκBα, Tnf-α, and Mcp-1 (two-way ANOVA, p < 0.05). In db/db mice receiving a high levels of dietary vitamin D, a reduction in inflammation-related gene expression was observed; specifically, hippocampal IκBα and PFC Mcp-1 expression levels were significantly lower (p < 0.05), while hippocampal Mcp-1 (p = 0.061) and PFC IκBα (p = 0.058) tended to be lower compared to the db_LVD group. In contrast, Ccl5 expression was lower across both brain regions in diabetic mice (p < 0.001), with no effect of dietary vitamin D levels. Tnf-α expression in the PFC was significantly higher in db_LVD mice than in their con_LVD counterparts (p < 0.05), while no significant changes were observed for Tnf-α in the hippocampus or Il-6 and Cx3cl1 in either region.
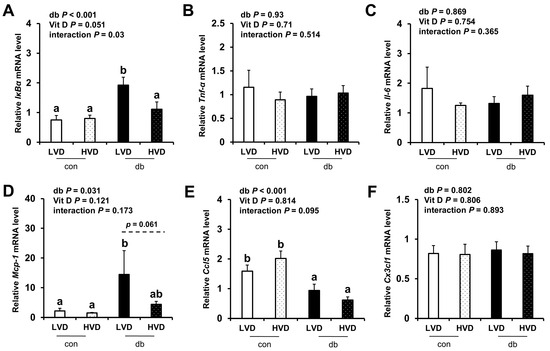
Figure 5.
mRNA Expression Levels of Inflammatory Markers in the Hippocampus. The relative mRNA expression levels of IκBα, Tnf-α, Il-6, Mcp-1, Ccl5, and Cx3cl1 in the hippocampus (A–F) were measured using RT-PCR. Data are presented as mean values ± SEMs (n = 10 for con_LVD and con_HVD; n = 7 for db_LVD and db_HVD). p-values from two-way ANOVA are shown in the upper left corner of the graph to indicate the effects of diabetes, vitamin D levels, and their interaction. Different superscript letters (a, b) represent significant group differences (p < 0.05), and p-value on the dashed line indicate difference between two groups, as determined by Fisher’s LSD multiple-comparison test.
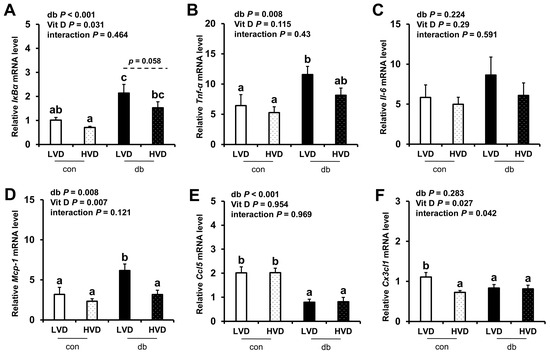
Figure 6.
mRNA Expression Levels of Inflammatory Markers in the PFC. The relative mRNA expression levels of IκBα, Tnf-α, Il-6, Mcp-1, Ccl5, and Cx3cl1 in the PFC (A–F) were measured using RT-PCR. Data are presented as mean values ± SEMs (n = 10 for con_LVD and con_HVD; n = 7 for db_LVD and db_HVD). p-values from two-way ANOVA are shown in the upper left corner of the graph to indicate the effects of diabetes, vitamin D levels, and their interaction. Different superscript letters (a, b, c) represent significant group differences (p < 0.05), and p-value on the dashed line indicate difference between two groups, as determined by Fisher’s LSD multiple-comparison test.
To further assess oxidative stress, we evaluated the mRNA expression levels of antioxidant response-related genes (Nrf2 and Ho-1). In diabetic mice, Nrf2 expression was significantly reduced in the PFC (two-way ANOVA, p < 0.05), whereas hippocampal Nrf2 and Ho-1 in both the hippocampus and PFC were not affected by diabetes. Overall, dietary vitamin D did not exert a significant effect on Nrf expression; however, among db/db mice, Ho-1 expression in the PFC was significantly lower in db_HVD mice compared with in db_LVD mice (Figure 7, p < 0.05).
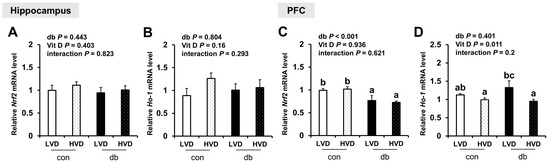
Figure 7.
mRNA Expression Levels of Oxidative Stress-Related Genes in the Hippocampus and PFC. The relative mRNA expression levels of Nrf2 and Ho-1 in the hippocampus (A,B), along with those in the PFC (C,D), were measured using RT-PCR. Data are presented as mean values ± SEMs (n = 10 for con_LVD and con_HVD; n = 7 for db_LVD and db_HVD). p-values from two-way ANOVA are shown in the upper left corner of the graph to indicate the effects of diabetes, vitamin D levels, and their interaction. Different superscript letters (a, b, c) represent significant group differences (p < 0.05), as determined by Fisher’s LSD multiple-comparison test.
To explore the mechanisms by which vitamin D operates through genomic (VDR) and non-genomic (PDIA3) pathways, as well as calcium homeostasis regulation, we measured the mRNA levels of Vdr, Pdia3, CaMKIIα, and Serca2b in the hippocampus and PFC (Figure 8). Pdia3 expression was significantly downregulated in both brain regions of db/db mice compared with control mice (two-way ANOVA, p < 0.001), whereas Vdr expression remained unchanged. Dietary vitamin D levels did not significantly alter Vdr or Pdia3 expression in either brain region. The expression levels of CaMKIIα and Serca2b, key regulators of calcium homeostasis, were significantly lower in db/db mice compared with those in control mice (two-way ANOVA, p < 0.05); however, no significant differences were observed between con_LVD and db_LVD mice. Hippocampal CaMKIIα and Serca2b expression, as well as that of Serca2b in the PFC, were lower in the db_HVD group compared with the db_LVD group, but the differences were not statistically significant.
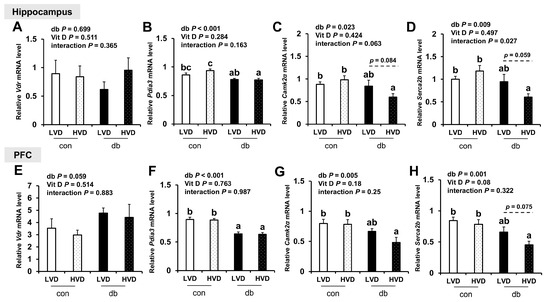
Figure 8.
mRNA Expression Levels of Genes Related to Vitamin D Signaling and Calcium Homeostasis in the Hippocampus and PFC. The relative mRNA expression levels of Vdr, Pdia3, CaMKIIα, and Serca2b in the hippocampus (A–D), along with those in the PFC (E–H), were measured using RT-PCR. Data are presented as mean values ± SEMs (n = 10 for con_LVD and con_HVD; n = 7 for db_LVD and db_HVD). p-values from two-way ANOVA are shown in the upper left corner of the graph to indicate the effects of diabetes, vitamin D levels, and their interaction. Different superscript letters (a, b, c) represent significant group differences (p < 0.05), and p-values on the dashed line indicate difference between two groups, as determined by Fisher’s LSD multiple-comparison test.
Considering the reduction in neuronal cell death in db_HVD group (Figure 1), we investigated its potential effects on neurotrophic factor expression (Ngf, Bdnf, and Nt-3; Figure 9. Among these, only PFC Bdnf, which was significantly lower in db/db mice (db_LVD), showed a tendency toward higher levels with a high dietary vitamin D level, but the change was not statistically significant (db_HVD, p = 0.068; Figure 9E). Ngf and Nt-3 expression remained unchanged in both the hippocampus and PFC.
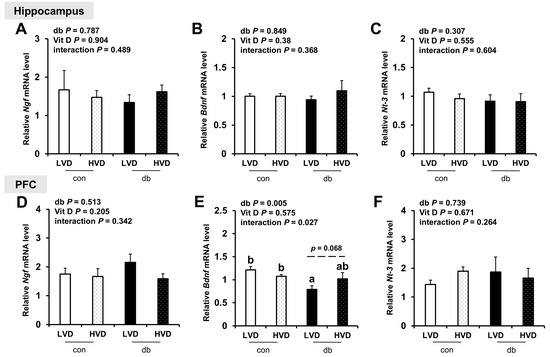
Figure 9.
mRNA Expression Levels of Neurotrophic Factor-Related Genes in the Hippocampus and PFC. The relative mRNA expression levels of (A) Ngf, (B) Bdnf, and (C) Nt-3 in the hippocampus, along with those of (D) Ngf, (E) Bdnf, and (F) Nt-3 in the PFC, were measured using RT-PCR. Data are presented as mean values ± SEMs (n = 10 for con_LVD and con_HVD; n = 7 for db_LVD and db_HVD). p-values from two-way ANOVA are shown in the upper left corner of the graph to indicate the effects of diabetes, vitamin D levels, and their interaction. Different superscript letters (a, b) represent significant group differences (p < 0.05), and p-value on the dashed line indicate difference between two groups, as determined by Fisher’s LSD multiple-comparison test.
4. Discussion
This study examined the potential impact of dietary vitamin D levels on early AD-like pathology in db/db mice, a model of T2DM. Our key findings indicate that a higher dietary vitamin D level was associated with reduced neuronal apoptosis, relatively downregulated the expression of amyloidogenic genes (App, Bace1, and Ps1), and modulated inflammatory gene expression (Mcp-1 and IκBα) in the hippocampus and PFC of db/db mice. These results suggest that vitamin D may confer protective effects against diabetes-induced neurodegeneration by targeting multiple pathological pathways.
The expression levels of amyloidogenic pathway-related genes (App, Bace1, and Ps1) in both the hippocampus and PFC were significantly lower in the db_HVD group than in the db_LVD group, suggesting that high doses of dietary vitamin D level partially attenuate the diabetes-induced upregulation of these genes and may help mitigate the activation of the amyloidogenic pathway. Similarly, in control mice, App and Ps1 expression levels in the PFC are significantly lower in the con_HVD group compared with those in the con_LVD group, indicating that vitamin D may exert amyloidogenesis-modulating effects even under non-diabetic conditions. However, despite these transcriptional changes, Aβ42 protein levels in hippocampus and PFC did not change in response to diabetes or vitamin D.
This discrepancy suggests that Aβ accumulation is influenced not only by expression of amyloidogenic genes but also by other factors, such as the activity of degrading enzymes (Ide and Nep) [36], clearance mechanisms [37], and post-translational modifications [38]. In fact, the expression levels of Aβ degradation- or clearance-related genes (Ide, Nep, and Adam10) exhibited no significant changes in this study, suggesting that the effect of vitamin D may be more focused on regulating Aβ production rather than its clearance. Furthermore, the mice in this study were 5 weeks old at baseline, and they were examined at 13 weeks of age following an 8-week experimental period. Previous studies have revealed that endogenous Aβ is barely detectable in the brains of mice during early development, with substantial Aβ accumulation exclusively observed in aged mice, typically those aged over 60 weeks [39,40]. Consequently, transgenic mouse models that overexpress human Aβ are commonly employed to study Aβ deposition and plaque formation; however, these models may not accurately reflect the sporadic forms of AD experienced by most patients [39].
Taken together, the young age of the mice in the present study may account for the lack of significant differences in Aβ levels, despite alterations in amyloidogenesis-related gene expression. Additionally, a limitation of this study is the small sample size (n = 2/group) used for Western blot analyses of Aβ levels in the PFC, which may reduce the robustness of the protein-level validation. Future research involving older diabetic mice or transgenic models with higher Aβ accumulation is warranted to confirm these findings.
Notably, histological analyses utilizing H&E and Nissl staining revealed pronounced neuronal apoptosis in the CA1 region of db_LVD mice, which was markedly attenuated in the db_HVD group. These findings indicate that, even in the absence of detectable changes in Aβ42 protein levels, a higher dietary vitamin D level was associated with lower hippocampal neuronal loss in diabetic mice, suggesting potential neuroprotective effects. Collectively, these results imply that a higher dietary vitamin D level may preserve neuronal integrity through mechanisms that are at least partially independent of Aβ accumulation, underscoring its potential as a preventive strategy against diabetes-associated neurodegeneration.
Consistent with these neuroprotective effects, the higher IκBα expression observed in the db_LVD group compared with the db_HVD group suggests that vitamin D may modulate NF-κB signaling under diabetic conditions. IκBα, a critical inhibitor of NF-κB, typically suppresses pathway activation, yet its increased expression can also reflect a feedback response to NF-κB activation and ongoing inflammatory signaling [41,42]. In this context, the concurrent reduction in Mcp-1 expression in the db_HVD group further corroborates the notion that vitamin D may attenuate neuroinflammation through complex mechanisms involving both NF-κB and downstream pathways such as MAPK [43,44]. Meanwhile, late-phase chemokines, such as Ccl5 and Cx3cl1, which are primarily induced by strong immune stimuli (e.g., IFN-γ) [45], were downregulated in db/db mice and remained unaffected by dietary vitamin D levels. Further investigation is needed to clarify the specific roles of each chemokine and to examine the effects of vitamin D in diabetes. Taken together, these findings suggest that vitamin D may mitigate diabetes-induced neuronal damage not only by reducing apoptosis but also by modulating key inflammatory pathways, supporting its potential role as a neuroprotective agent in diabetes-associated neurodegeneration.
The mRNA levels of antioxidant markers displayed brain region-specific differences in response to vitamin D. Nrf2 expression in the PFC was significantly lower in db/db mice, regardless of vitamin D intake, indicating possible functional exhaustion under sustained oxidative stress [46,47]. The expression of the antioxidant marker Ho-1 was higher in the db_LVD group than in the db_HVD group. Given that expression of Ho-1 can also be regulated by the MAPK and NF-κB pathways [48,49], its lower expression in the db_HVD group may represent a compensatory response; however, further investigation is warranted.
Many prior studies have reported that vitamin D can increase the levels of neurotrophins, including nerve growth factor (NGF), glial cell-derived neurotrophic factor (GDNF), and brain-derived neurotrophic factor (BDNF), thus promoting neurogenesis and exerting neuroprotective effects [50,51]. In the current study, the mRNA expression levels of hippocampal Ngf, Bdnf, and Nt-3 did not differ significantly among the experimental groups. Bdnf expression in the PFC significantly lower in the db_LVD group compared with that in the con_LVD group; however, the difference between the db_LVD and db_HVD groups was not statistically significant (p = 0.068). Several previous studies have reported that vitamin D can enhance BDNF expression by mitigating oxidative stress [52,53], suggesting a potential partial restoration of Bdnf expression following a high dietary vitamin D level.
In this study, mice received cholecalciferol through their diets; however, vitamin D regulates target genes via its biologically active form, 1,25-dihydroxyvitamin D, which mediates genomic actions through binding to nuclear VDRs and induces nongenomic responses through interactions with membrane-associated VDR or PDIA3 [54]. Neither dietary vitamin D level nor diabetes altered Vdr expression in the hippocampus or PFC. This finding is consistent with previous reports indicating that VDR primarily functions as a ligand-dependent transcription factor, with expression largely maintained across varying tissue vitamin D levels and predominantly regulated through ligand binding and post-translational modifications [55,56,57]. Conversely, Pdia3 levels in the PFC were significantly lower in db/db mice compared with control mice, suggesting that chronic hyperglycemia and inflammation may affect non-genomic vitamin D signaling, potentially disrupting calcium regulation and protein homeostasis. Additional studies are warranted to clarify the specific roles of Vdr and Pdia3 in mediating the effects of vitamin D on neuroinflammation and amyloidogenesis.
5. Conclusions
This study comprehensively assessed the impact of a high dietary vitamin D level (9477 IU/kg diet) on early AD-like pathology and the expression of related genes in db/db mice, a well-established T2DM model. A high dietary vitamin D level was associated with attenuated neuronal apoptosis in the CA1 region of the hippocampus and modulation of amyloidogenic genes (App, Bace1, and Ps1) and neuroinflammatory markers (Mcp-1 and IκBα)—which had been upregulated under diabetic conditions—in both the hippocampus and PFC. In contrast, hippocampal and PFC Aβ protein levels were unaffected by diabetes or dietary vitamin D level, likely due to insufficient accumulation in the 13-week-old mice used. Overall, these findings support the potential of dietary vitamin D to mitigate early AD-like pathologies in a diabetic mouse model and underscore the imperativeness of further long-term, quantitative studies.
Supplementary Materials
The following supporting information can be downloaded at: https://www.mdpi.com/article/10.3390/nu17213339/s1, Figure S1. Anatomical Diagram of the Mouse Brain, Figure S2. Full-length and uncropped Western blot images of Figure 4C, Table S1. Composition of the Experimental Diets, Table S2. List of Primers Used for qRT-PCR in Mice.
Author Contributions
Conceptualization, C.Y.P. and S.N.H.; methodology, J.K., D.W., S.N.H. and C.Y.P.; investigation, J.K., D.W. and C.Y.P.; writing—original draft preparation, J.K. and C.Y.P.; writing—review and editing, J.K., D.W., S.N.H. and C.Y.P.; funding acquisition, C.Y.P. and S.N.H. All authors have read and agreed to the published version of the manuscript.
Funding
This work was supported by the National Research Foundation of Korea (NRF) grant funded by the Korean government (MSIT) (NRF-RS-2024-00455010 and NRF-RS-2024-00353119).
Institutional Review Board Statement
The animal study protocol was approved by the Institutional Review Board of Seoul National University Institutional Animal Care and Use Committee (approval no. SNU-220907-2-1, approval date: 7 September 2022).
Data Availability Statement
The data presented in this study are available from the corresponding author on reasonable request.
Conflicts of Interest
The authors declare no conflicts of interest.
Abbreviations
ADAM10: A disintegrin and metalloproteinase domain 10; Aβ: Amyloid-beta; AD: Alzheimer’s disease; APP: Amyloid precursor protein; BACE1: Beta-site app cleaving enzyme 1; BDNF: Brain-derived neurotrophic factor; BBB: Blood–brain barrier; CAMKIIα: Calcium/calmodulin-dependent protein kinase II alpha; CCL5: Chemokine (C-C motif) ligand 5; CNS: Central nervous system; CSF: Cerebrospinal fluid; CX3CL1: Chemokine (C-X3-C motif) ligand 1; ELISA: Enzyme-Linked Immunosorbent Assay; GAPDH: Glyceraldehyde-3-phosphate dehydrogenase; GDNF: glial cell-derived neurotrophic factor; H&E: Hematoxylin and Eosin; HO-1: Heme oxygenase-1; HVD: high Vitamin D; IFN-γ: Interferon-gamma; IL-6: Interleukin-6; IDE: Insulin-degrading enzyme; IκBα: Inhibitor of nuclear factor kappa B alpha; JAK/STAT: Janus kinase / Signal transducer and activator of transcription; LVD: low Vitamin D; MAPK: Mitogen-activated protein kinase; MCP-1: Monocyte chemoattractant protein-1; NEP: Neprilysin; NF-κB: Nuclear factor kappa B; NGF: Nerve growth factor; NHANES: National Health and Nutrition Examination Survey; NRF2: Nuclear factor erythroid 2–related factor 2; NT-3: Neurotrophin-3; PDIA3: Protein disulfide isomerase family a member 3; PFC: Prefrontal cortex; PS1: Presenilin 1; qRT-PCR: Quantitative Reverse Transcription Polymerase Chain Reaction; SERCA2b: Sarco/endoplasmic reticulum calcium ATPase 2 beta; T2DM: Type 2 diabetes mellitus; TNF-α: Tumor necrosis factor alpha; VDR: Vitamin D receptor.
References
- Gauthier, S.; Webster, C.; Servaes, S.; Morais, J.; Rosa-Neto, P. World Alzheimer Report 2022: Life after Diagnosis: Navigating Treatment, Care and Support; Alzheimer’s Disease International: London, UK, 2023. [Google Scholar]
- Kinney, J.W.; Bemiller, S.M.; Murtishaw, A.S.; Leisgang, A.M.; Salazar, A.M.; Lamb, B.T. Inflammation as a central mechanism in Alzheimer’s disease. Alzheimer’s Dement. Transl. Res. Clin. Interv. 2018, 4, 575–590. [Google Scholar] [CrossRef]
- Kadowaki, H.; Nishitoh, H.; Urano, F.; Sadamitsu, C.; Matsuzawa, A.; Takeda, K.; Masutani, H.; Yodoi, J.; Urano, Y.; Nagano, T.; et al. Amyloid beta induces neuronal cell death through ROS-mediated ASK1 activation. Cell Death Differ. 2005, 12, 19–24. [Google Scholar] [CrossRef]
- Novoa, C.; Salazar, P.; Cisternas, P.; Gherardelli, C.; Vera-Salazar, R.; Zolezzi, J.M.; Inestrosa, N.C. Inflammation context in Alzheimer’s disease, a relationship intricate to define. Biol. Res. 2022, 55, 39. [Google Scholar] [CrossRef]
- Whitwell, J.L. Progression of atrophy in Alzheimer’s disease and related disorders. Neurotox. Res. 2010, 18, 339–346. [Google Scholar] [CrossRef]
- Chatterjee, S.; Mudher, A. Alzheimer’s Disease and Type 2 Diabetes: A Critical Assessment of the Shared Pathological Traits. Front. Neurosci. 2018, 12, 383. [Google Scholar] [CrossRef]
- Barbagallo, M.; Dominguez, L.J. Type 2 diabetes mellitus and Alzheimer’s disease. World J. Diabetes 2014, 5, 889–893. [Google Scholar] [CrossRef] [PubMed]
- Xue, M.; Xu, W.; Ou, Y.N.; Cao, X.P.; Tan, M.S.; Tan, L.; Yu, J.T. Diabetes mellitus and risks of cognitive impairment and dementia: A systematic review and meta-analysis of 144 prospective studies. Ageing Res. Rev. 2019, 55, 100944. [Google Scholar] [CrossRef] [PubMed]
- Rhea, E.M.; Banks, W.A. A historical perspective on the interactions of insulin at the blood-brain barrier. J. Neuroendocrinol. 2021, 33, e12929. [Google Scholar] [CrossRef] [PubMed]
- Agrawal, R.; Reno, C.M.; Sharma, S.; Christensen, C.; Huang, Y.; Fisher, S.J. Insulin action in the brain regulates both central and peripheral functions. Am. J. Physiol. Endocrinol. Metab. 2021, 321, E156–E163. [Google Scholar] [CrossRef]
- Banks, W.A. The source of cerebral insulin. Eur. J. Pharmacol. 2004, 490, 5–12. [Google Scholar] [CrossRef]
- Liu, Y.; Liu, F.; Grundke-Iqbal, I.; Iqbal, K.; Gong, C.X. Deficient brain insulin signalling pathway in Alzheimer’s disease and diabetes. J. Pathol. 2011, 225, 54–62. [Google Scholar] [CrossRef]
- Kim, E.K.; Choi, E.J. Pathological roles of MAPK signaling pathways in human diseases. Biochim. Biophys. Acta 2010, 1802, 396–405. [Google Scholar] [CrossRef]
- Gabbouj, S.; Ryhänen, S.; Marttinen, M.; Wittrahm, R.; Takalo, M.; Kemppainen, S.; Martiskainen, H.; Tanila, H.; Haapasalo, A.; Hiltunen, M.; et al. Altered Insulin Signaling in Alzheimer’s Disease Brain—Special Emphasis on PI3K-Akt Pathway. Front. Neurosci. 2019, 13, 629. [Google Scholar] [CrossRef]
- Bogush, M.; Heldt, N.A.; Persidsky, Y. Blood Brain Barrier Injury in Diabetes: Unrecognized Effects on Brain and Cognition. J. Neuroimmune Pharmacol. 2017, 12, 593–601. [Google Scholar] [CrossRef]
- Sutton, A.L.; MacDonald, P.N. Vitamin D: More than a “bone-a-fide” hormone. Mol. Endocrinol. 2003, 17, 777–791. [Google Scholar] [CrossRef]
- Ghaseminejad-Raeini, A.; Ghaderi, A.; Sharafi, A.; Nematollahi-Sani, B.; Moossavi, M.; Derakhshani, A.; Sarab, G.A. Immunomodulatory actions of vitamin D in various immune-related disorders: A comprehensive review. Front. Immunol. 2023, 14, 950465. [Google Scholar] [CrossRef] [PubMed]
- L Bishop, E.; Ismailova, A.; Dimeloe, S.; Hewison, M.; White, J.H. Vitamin D and Immune Regulation: Antibacterial, Antiviral, Anti-Inflammatory. JBMR Plus 2021, 5, e10405. [Google Scholar] [CrossRef] [PubMed]
- Latimer, C.S.; Brewer, L.D.; Searcy, J.L.; Chen, K.C.; Popović, J.; Kraner, S.D.; Thibault, O.; Blalock, E.M.; Landfield, P.W.; Porter, N.M. Vitamin D prevents cognitive decline and enhances hippocampal synaptic function in aging rats. Proc. Natl. Acad. Sci. USA 2014, 111, E4359–E4366. [Google Scholar] [CrossRef]
- Mayne, P.E.; Burne, T.H.J. Vitamin D in Synaptic Plasticity, Cognitive Function, and Neuropsychiatric Illness. Trends Neurosci. 2019, 42, 293–306. [Google Scholar] [CrossRef]
- El-Atifi, M.; Dreyfus, M.; Berger, F.; Wion, D. Expression of CYP2R1 and VDR in human brain pericytes: The neurovascular vitamin D autocrine/paracrine model. Neuroreport 2015, 26, 245–248. [Google Scholar] [CrossRef] [PubMed]
- Sailike, B.; Onzhanova, Z.; Akbay, B.; Tokay, T.; Molnár, F. Vitamin D in Central Nervous System: Implications for Neurological Disorders. Int. J. Mol. Sci. 2024, 25, 7809. [Google Scholar] [CrossRef]
- Pinzon, R.T.; Handayani, T.; Wijaya, V.O.; Buana, R.B. Low vitamin D serum levels as risk factor of Alzheimer’s disease: A systematic review and meta-analysis. Egypt. J. Neurol. Psychiatry Neurosurg. 2023, 59, 88. [Google Scholar] [CrossRef]
- Annweiler, C.; Rolland, Y.; Schott, A.M.; Blain, H.; Vellas, B.; Herrmann, F.R.; Beauchet, O. Higher vitamin D dietary intake is associated with lower risk of alzheimer’s disease: A 7-year follow-up. J. Gerontol. A Biol. Sci. Med. Sci. 2012, 67, 1205–1211. [Google Scholar] [CrossRef]
- Chiu, K.C.; Chu, A.; Go, V.L.; Saad, M.F. Hypovitaminosis D is associated with insulin resistance and beta cell dysfunction. Am. J. Clin. Nutr. 2004, 79, 820–825. [Google Scholar] [CrossRef]
- Wamberg, L.; Christiansen, T.; Paulsen, S.K.; Fisker, S.; Rask, P.; Rejnmark, L.; Richelsen, B.; Pedersen, S.B. Expression of vitamin D-metabolizing enzymes in human adipose tissue—The effect of obesity and diet-induced weight loss. Int. J. Obes. 2013, 37, 651–657. [Google Scholar] [CrossRef]
- Scragg, R.; Sowers, M.; Bell, C. Serum 25-hydroxyvitamin D, diabetes, and ethnicity in the Third National Health and Nutrition Examination Survey. Diabetes Care 2004, 27, 2813–2818. [Google Scholar] [CrossRef] [PubMed]
- Norris, J.M.; Lee, H.S.; Frederiksen, B.; Erlund, I.; Uusitalo, U.; Yang, J.; Lernmark, Å.; Simell, O.; Toppari, J.; Rewers, M.; et al. Plasma 25-Hydroxyvitamin D Concentration and Risk of Islet Autoimmunity. Diabetes 2018, 67, 146–154. [Google Scholar] [CrossRef]
- Park, C.Y.; Shin, S.; Han, S.N. Multifaceted Roles of Vitamin D for Diabetes: From Immunomodulatory Functions to Metabolic Regulations. Nutrients 2024, 16, 3185. [Google Scholar] [CrossRef] [PubMed]
- Parker, J.; Hashmi, O.; Dutton, D.; Mavrodaris, A.; Stranges, S.; Kandala, N.B.; Clarke, A.; Franco, O.H. Levels of vitamin D and cardiometabolic disorders: Systematic review and meta-analysis. Maturitas 2010, 65, 225–236. [Google Scholar] [CrossRef]
- Bharadwaj, P.; Wijesekara, N.; Liyanapathirana, M.; Newsholme, P.; Ittner, L.; Fraser, P.; Verdile, G. The Link between Type 2 Diabetes and Neurodegeneration: Roles for Amyloid-β, Amylin, and Tau Proteins. J. Alzheimers Dis. 2017, 59, 421–432. [Google Scholar] [CrossRef] [PubMed]
- Gu, J.C.; Wu, Y.G.; Huang, W.G.; Fan, X.J.; Chen, X.H.; Zhou, B.; Lin, Z.J.; Feng, X.L. Effect of vitamin D on oxidative stress and serum inflammatory factors in the patients with type 2 diabetes. J. Clin. Lab. Anal. 2022, 36, e24430. [Google Scholar] [CrossRef] [PubMed]
- Manna, P.; Achari, A.E.; Jain, S.K. Vitamin D supplementation inhibits oxidative stress and upregulate SIRT1/AMPK/GLUT4 cascade in high glucose-treated 3T3L1 adipocytes and in adipose tissue of high fat diet-fed diabetic mice. Arch. Biochem. Biophys. 2017, 615, 22–34. [Google Scholar] [CrossRef]
- Mansournia, M.A.; Ostadmohammadi, V.; Doosti-Irani, A.; Ghayour-Mobarhan, M.; Ferns, G.; Akbari, H.; Ghaderi, A.; Talari, H.R.; Asemi, Z. The Effects of Vitamin D Supplementation on Biomarkers of Inflammation and Oxidative Stress in Diabetic Patients: A Systematic Review and Meta-Analysis of Randomized Controlled Trials. Horm. Metab. Res. 2018, 50, 429–440. [Google Scholar] [CrossRef]
- Oh, M.; Jung, S.; Kim, Y.A.; Lee, G.Y.; Han, S.N. Dietary vitamin D(3) supplementation enhances splenic NK cell activity in healthy and diabetic male mice. Nutr. Res. 2024, 127, 144–155. [Google Scholar] [CrossRef]
- Grimm, M.O.; Lehmann, J.; Mett, J.; Zimmer, V.C.; Grösgen, S.; Stahlmann, C.P.; Hundsdörfer, B.; Haupenthal, V.J.; Rothhaar, T.L.; Herr, C.; et al. Impact of Vitamin D on amyloid precursor protein processing and amyloid-β peptide degradation in Alzheimer’s disease. Neurodegener. Dis. 2014, 13, 75–81. [Google Scholar] [CrossRef]
- Yoon, S.S.; Jo, S.A. Mechanisms of Amyloid-β Peptide Clearance: Potential Therapeutic Targets for Alzheimer’s Disease. Biomol. Ther. 2012, 20, 245–255. [Google Scholar] [CrossRef]
- Grochowska, K.M.; Yuanxiang, P.; Bär, J.; Raman, R.; Brugal, G.; Sahu, G.; Schweizer, M.; Bikbaev, A.; Schilling, S.; Demuth, H.U.; et al. Posttranslational modification impact on the mechanism by which amyloid-β induces synaptic dysfunction. EMBO Rep. 2017, 18, 962–981. [Google Scholar] [CrossRef] [PubMed]
- Ahlemeyer, B.; Halupczok, S.; Rodenberg-Frank, E.; Valerius, K.P.; Baumgart-Vogt, E. Endogenous Murine Amyloid-β Peptide Assembles into Aggregates in the Aged C57BL/6J Mouse Suggesting These Animals as a Model to Study Pathogenesis of Amyloid-β Plaque Formation. J. Alzheimers Dis. 2018, 61, 1425–1450. [Google Scholar] [CrossRef] [PubMed]
- De Plano, L.M.; Saitta, A.; Oddo, S.; Caccamo, A. Navigating Alzheimer’s Disease Mouse Models: Age-Related Pathology and Cognitive Deficits. Biomolecules 2024, 14, 1405. [Google Scholar] [CrossRef] [PubMed]
- Guo, Q.; Jin, Y.; Chen, X.; Ye, X.; Shen, X.; Lin, M.; Zeng, C.; Zhou, T.; Zhang, J. NF-κB in biology and targeted therapy: New insights and translational implications. Signal Transduct. Target. Ther. 2024, 9, 53. [Google Scholar] [CrossRef]
- Downton, P.; Bagnall, J.S.; England, H.; Spiller, D.G.; Humphreys, N.E.; Jackson, D.A.; Paszek, P.; White, M.R.H.; Adamson, A.D. Overexpression of IκB⍺ modulates NF-κB activation of inflammatory target gene expression. Front. Mol. Biosci. 2023, 10, 1187187. [Google Scholar] [CrossRef] [PubMed]
- Ding, C.; Wilding, J.P.; Bing, C. 1,25-dihydroxyvitamin D3 protects against macrophage-induced activation of NFκB and MAPK signalling and chemokine release in human adipocytes. PLoS ONE 2013, 8, e61707. [Google Scholar] [CrossRef] [PubMed]
- Fenercioglu, A.K.; Gonen, M.S.; Uzun, H.; Sipahioglu, N.T.; Can, G.; Tas, E.; Kara, Z.; Ozkaya, H.M.; Atukeren, P. The Association between Serum 25-Hydroxyvitamin D3 Levels and Pro-Inflammatory Markers in New-Onset Type 2 Diabetes Mellitus and Prediabetes. Biomolecules 2023, 13, 1778. [Google Scholar] [CrossRef]
- Kawka, E.; Witowski, J.; Fouqet, N.; Tayama, H.; Bender, T.O.; Catar, R.; Dragun, D.; Jörres, A. Regulation of chemokine CCL5 synthesis in human peritoneal fibroblasts: A key role of IFN-γ. Mediators Inflamm. 2014, 2014, 590654. [Google Scholar] [CrossRef]
- Zhao, J.; Liu, L.; Li, X.; Zhang, L.; Lv, J.; Guo, X.; Chen, H.; Zhao, T. Neuroprotective effects of an Nrf2 agonist on high glucose-induced damage in HT22 cells. Biol. Res. 2019, 52, 53. [Google Scholar] [CrossRef]
- Sireesh, D.; Dhamodharan, U.; Ezhilarasi, K.; Vijay, V.; Ramkumar, K.M. Association of NF-E2 Related Factor 2 (Nrf2) and inflammatory cytokines in recent onset Type 2 Diabetes Mellitus. Sci. Rep. 2018, 8, 5126. [Google Scholar] [CrossRef]
- Ryter, S.W.; Xi, S.; Hartsfield, C.L.; Choi, A.M. Mitogen activated protein kinase (MAPK) pathway regulates heme oxygenase-1 gene expression by hypoxia in vascular cells. Antioxid. Redox Signal 2002, 4, 587–592. [Google Scholar] [CrossRef]
- Huang, J.; Guo, P.; Ma, D.; Lin, X.; Fang, Q.; Wang, J. Overexpression of heme oxygenase-1 induced by constitutively activated NF-κB as a potential therapeutic target for activated B-cell-like diffuse large B-cell lymphoma. Int. J. Oncol. 2016, 49, 253–264. [Google Scholar] [CrossRef]
- Fantini, C.; Corinaldesi, C.; Lenzi, A.; Migliaccio, S.; Crescioli, C. Vitamin D as a Shield against Aging. Int. J. Mol. Sci. 2023, 24, 4546. [Google Scholar] [CrossRef] [PubMed]
- Wang, W.; Li, Y.; Meng, X. Vitamin D and neurodegenerative diseases. Heliyon 2023, 9, e12877. [Google Scholar] [CrossRef]
- Khairy, E.Y.; Attia, M.M. Protective effects of vitamin D on neurophysiologic alterations in brain aging: Role of brain-derived neurotrophic factor (BDNF). Nutr. Neurosci. 2021, 24, 650–659. [Google Scholar] [CrossRef] [PubMed]
- Mansouri, F.; Ghanbari, H.; Marefati, N.; Arab, Z.; Salmani, H.; Beheshti, F.; Hosseini, M. Protective effects of vitamin D on learning and memory deficit induced by scopolamine in male rats: The roles of brain-derived neurotrophic factor and oxidative stress. Naunyn Schmiedebergs Arch. Pharmacol. 2021, 394, 1451–1466. [Google Scholar] [CrossRef]
- Żmijewski, M.A. Nongenomic Activities of Vitamin D. Nutrients 2022, 14, 5104. [Google Scholar] [CrossRef]
- Oczkowicz, M.; Szymczyk, B.; Świątkiewicz, M.; Furgał-Dzierżuk, I.; Koseniuk, A.; Wierzbicka, A.; Steg, A. Analysis of the effect of vitamin D supplementation and sex on Vdr, Cyp2r1 and Cyp27b1 gene expression in Wistar rats’ tissues. J. Steroid Biochem. Mol. Biol. 2021, 212, 105918. [Google Scholar] [CrossRef]
- Haussler, M.R.; Haussler, C.A.; Bartik, L.; Whitfield, G.K.; Hsieh, J.C.; Slater, S.; Jurutka, P.W. Vitamin D receptor: Molecular signaling and actions of nutritional ligands in disease prevention. Nutr. Rev. 2008, 66, S98–S112. [Google Scholar] [CrossRef] [PubMed]
- Zenata, O.; Vrzal, R. Fine tuning of vitamin D receptor (VDR) activity by post-transcriptional and post-translational modifications. Oncotarget 2017, 8, 35390–35402. [Google Scholar] [CrossRef] [PubMed]


Disclaimer/Publisher’s Note: The statements, opinions and data contained in all publications are solely those of the individual author(s) and contributor(s) and not of MDPI and/or the editor(s). MDPI and/or the editor(s) disclaim responsibility for any injury to people or property resulting from any ideas, methods, instructions or products referred to in the content. |
© 2025 by the authors. Licensee MDPI, Basel, Switzerland. This article is an open access article distributed under the terms and conditions of the Creative Commons Attribution (CC BY) license (https://creativecommons.org/licenses/by/4.0/).