Synergistic Effects of MTHFR, MTRR, and MTR Gene Variants on Serum Folate Levels and Cognitive Function in Chinese Preschoolers: A Cross-Sectional Study
Abstract
1. Introduction
2. Materials and Methods
2.1. Study Design
2.2. Research Participants
2.3. Blood Sample Dispensing and Storage
2.4. DNA Extraction and Genotyping
2.5. Measurement of Serum Folate Concentration
2.6. Evaluation of Basic Cognition
2.7. Statistical Analysis
3. Results
3.1. Hardy–Weinberg Equilibrium Test
3.2. Demographic and Clinical Characteristics
3.3. Association Between Genotypes and Variables (Folate, Cognitive Scores)
3.3.1. Single Gene Polymorphism
3.3.2. Joint Gene Polymorphisms
3.4. Cumulative Genotypes and Serum Folate and Cognitive Scores
4. Discussion
5. Conclusions
Supplementary Materials
Author Contributions
Funding
Institutional Review Board Statement
Informed Consent Statement
Data Availability Statement
Acknowledgments
Conflicts of Interest
Abbreviations
| DHF | dihydrofolate |
| THF | tetrahydrofolate |
| 5,10-CH2-THF | 5,10-methylenetetrahydrofolate |
| 5-MTHF | 5-methyltetrahydrofolate |
| MTHFR | 5,10-methylenetetrahydrofolate reductase |
| MTR | 5-methyltetrahydrofolate transmethylase |
| MTRR | 5-methyltetrahydrofolate transmethylase reductase |
| SNP | single-nucleotide polymorphisms |
| LHEAITNP | the Long-term Health Effects Assessment Project of Infants and Toddlers Nutritional Pack |
| KASP | Kramer’s allele-specific PCR |
| K-ABC | Kaufman assessment battery for children |
| GLM | generalized linear model |
References
- McGarel, C.; Pentieva, K.; Strain, J.J.; McNulty, H. Emerging roles for folate and related B-vitamins in brain health across the lifecycle. Proc. Nutr. Soc. 2015, 74, 46–55. [Google Scholar] [CrossRef]
- Shulpekova, Y.; Nechaev, V.; Kardasheva, S.; Sedova, A.; Kurbatova, A.; Bueverova, E.; Kopylov, A.; Malsagova, K.; Dlamini, J.C.; Ivashkin, V. The Concept of Folic Acid in Health and Disease. Molecules 2021, 26, 3731. [Google Scholar] [CrossRef] [PubMed]
- Sobczyńska-Malefora, A.; Harrington, D.J. Laboratory assessment of folate (vitamin B9) status. J. Clin. Pathol. 2018, 71, 949–956. [Google Scholar] [CrossRef] [PubMed]
- Naninck, E.F.G.; Stijger, P.C.; Brouwer-Brolsma, E.M. The Importance of Maternal Folate Status for Brain Development and Function of Offspring. Adv. Nutr. 2019, 10, 502–519. [Google Scholar] [CrossRef]
- Hiraoka, M.; Kagawa, Y. Genetic polymorphisms and folate status. Congenit. Anom. 2017, 57, 142–149. [Google Scholar] [CrossRef]
- Li, W.X.; Dai, S.X.; Zheng, J.J.; Liu, J.Q.; Huang, J.F. Homocysteine Metabolism Gene Polymorphisms (MTHFR C677T, MTHFR A1298C, MTR A2756G and MTRR A66G) Jointly Elevate the Risk of Folate Deficiency. Nutrients 2015, 7, 6670–6687. [Google Scholar] [CrossRef]
- Mazokopakis, E.E.; Papadomanolaki, M.G.; Papadakis, J.A. Association of methylene tetrahydrofolate reductase (MTHFR) gene polymorphisms with serum folate, cobalanin and homocysteine concentrations in Greek adults. Scand. J. Clin. Lab. Investig. 2023, 83, 69–73. [Google Scholar] [CrossRef]
- Zhang, L.; Xue, Z.; Liu, Q.; Liu, Y.; Xi, S.; Cheng, Y.; Li, J.; Yan, J.; Shen, Y.; Xiao, C.; et al. Disrupted folate metabolism with anesthesia leads to myelination deficits mediated by epigenetic regulation of ERMN. EBioMedicine 2019, 43, 473–486. [Google Scholar] [CrossRef]
- Schoendorfer, N.C.; Obeid, R.; Moxon Lester, L.; Sharp, N.; Vitetta, L.; Boyd, R.N.; Davies, P.S.W. Methylation capacity in children with severe cerebral palsy. Eur. J. Clin. Investig. 2012, 42, 768–776. [Google Scholar] [CrossRef]
- Tu, M.; Chung, H.; Hsu, Y.; Yang, J.; Wu, W. Neurovascular Correlates of Cobalamin, Folate, and Homocysteine in Dementia. J. Alzheimers Dis. 2023, 96, 1329–1338. [Google Scholar] [CrossRef]
- Chen, B.; Linke, A.; Olson, L.; Kohli, J.; Kinnear, M.; Sereno, M.; Müller, R.A.; Carper, R.; Fishman, I. Cortical myelination in toddlers and preschoolers with autism spectrum disorder. Dev. Neurobiol. 2022, 82, 261–274. [Google Scholar] [CrossRef] [PubMed]
- Simpkin, A.J.; Suderman, M.; Gaunt, T.R.; Lyttleton, O.; McArdle, W.L.; Ring, S.M.; Tilling, K.; Davey Smith, G.; Relton, C.L. Longitudinal analysis of DNA methylation associated with birth weight and gestational age. Hum. Mol. Genet. 2015, 24, 3752–3763. [Google Scholar] [CrossRef]
- Anderson, O.S.; Sant, K.E.; Dolinoy, D.C. Nutrition and epigenetics: An interplay of dietary methyl donors, one-carbon metabolism and DNA methylation. J. Nutr. Biochem. 2012, 23, 853–859. [Google Scholar] [CrossRef]
- Taylor, R.M.; Smith, R.; Collins, C.E.; Evans, T.; Hure, A.J. Dietary intake and food sources of one-carbon metabolism nutrients in preschool aged children. Eur. J. Clin. Nutr. 2019, 73, 1179–1193. [Google Scholar] [CrossRef]
- Nasri, K.; Midani, F.; Kallel, A.; Ben Jemaa, N.; Aloui, M.; Boulares, M.; Lassoued, M.; Ben Halima, M.; Ben Wafi, S.; Soussi, M.; et al. Association of MTHFR C677T, MTHFR A1298C, and MTRR A66G Polymorphisms with Neural Tube Defects in Tunisian Parents. Pathobiology 2019, 86, 190–200. [Google Scholar] [CrossRef] [PubMed]
- Shi, Y.; Zhang, Z.; Wang, B.; Wang, Y.; Kong, X.; Sun, Y.; Li, A.; Cui, Y.; Zhang, Y.; Li, J.; et al. Effect of plateletcrit and methylenetetrahydrofolate reductase (MTHFR) C677T genotypes on folic acid efficacy in stroke prevention. Signal Transduct. Target. Ther. 2024, 9, 110. [Google Scholar] [CrossRef]
- Raghubeer, S.; Matsha, T.E. Methylenetetrahydrofolate (MTHFR), the One-Carbon Cycle, and Cardiovascular Risks. Nutrients 2021, 13, 4562. [Google Scholar] [CrossRef]
- Liew, S.; Gupta, E.D. Methylenetetrahydrofolate reductase (MTHFR) C677T polymorphism: Epidemiology, metabolism and the associated diseases. Eur. J. Med. Genet. 2015, 58, 1–10. [Google Scholar] [CrossRef]
- Kumari, R.; Kumar, S.; Thakur, V.K.; Singh, K.; Kumar, U. MTHFR C677T and MTR A2756G Gene Polymorphism in Neural Tube Defect Patients and Its Association with Red Blood Cell Folate Level in Eastern Indian Population. J. Indian Assoc. Pediatr. Surg. 2022, 27, 699–706. [Google Scholar] [CrossRef]
- Hsueh, Y.; Lin, Y.; Chung, C.; Huang, Y.; Hsieh, R.; Huang, P.; Wu, M.; Shiue, H.; Chien, S.; Lee, C.; et al. Combined effect of polymorphisms of MTHFR and MTR and arsenic methylation capacity on developmental delay in preschool children in Taiwan. Arch. Toxicol. 2020, 94, 2027–2038. [Google Scholar] [CrossRef]
- González-Mercado, M.G.; Rivas, F.; Gallegos-Arreola, M.P.; Morán-Moguel, M.C.; Salazar-Páramo, M.; González-López, L.; Gámez-Nava, J.I.; Muñoz-Valle, J.F.; Medina-Coss, Y.; León, R.; et al. MTRR A66G, RFC1 G80A, and MTHFR C677T and A1298C Polymorphisms and Disease Activity in Mexicans with Rheumatoid Arthritis Treated with Methotrexate. Genet. Test. Mol. Biomark. 2017, 21, 698–704. [Google Scholar] [CrossRef]
- Li, W.; Cheng, F.; Zhang, A.; Dai, S.; Li, G.; Lv, W.; Zhou, T.; Zhang, Q.; Zhang, H.; Zhang, T.; et al. Folate Deficiency and Gene Polymorphisms of MTHFR, MTR and MTRR Elevate the Hyperhomocysteinemia Risk. Clin. Lab. 2017, 63, 523–533. [Google Scholar] [CrossRef]
- He, C.; Holme, J.; Anthony, J. SNP genotyping: The KASP assay. Methods Mol Biol. 2014, 1145, 75–86. [Google Scholar] [CrossRef] [PubMed]
- Li, Y.; Wang, Z.; Mao, H.M.; Wang, J.B.; Gong, W.Y.; Chen, C.; Shi, L.L.; Sun, J.; Huo, J.S. A comparative study on the detection of serum folate by microbiological assay and electrochemiluminescence immunoassay. J. Hyg. 2021, 50, 111–115. [Google Scholar] [CrossRef]
- World Health Organization. Serum and Red Blood Cell Folate Concentrations for Assessing Folate Status in Populations; World Health Organization: Geneva, Switzerland, 2015. [Google Scholar]
- Zheng, Y.; Cantley, L.C. Toward a better understanding of folate metabolism in health and disease. J. Exp. Med. 2019, 216, 253–266. [Google Scholar] [CrossRef] [PubMed]
- Socha, D.S.; DeSouza, S.I.; Flagg, A.; Sekeres, M.; Rogers, H.J. Severe megaloblastic anemia: Vitamin deficiency and other causes. Cleve. Clin. J. Med. 2020, 87, 153–164. [Google Scholar] [CrossRef]
- Balashova, O.A.; Visina, O.; Borodinsky, L.N. Folate action in nervous system development and disease. Dev. Neurobiol. 2018, 78, 391–402. [Google Scholar] [CrossRef]
- Elizabeth, K.E.; Praveen, S.L.; Preethi, N.R.; Jissa, V.T.; Pillai, M.R. Folate, vitamin B12, homocysteine and polymorphisms in folate metabolizing genes in children with congenital heart disease and their mothers. Eur. J. Clin. Nutr. 2017, 71, 1437–1441. [Google Scholar] [CrossRef]
- Chang, R.; Wei, M.; Li, C.; Jiang, Y.; Zhang, J. Association between epigenome-wide DNA methylation changes and early neurodevelopment in preschool children: Evidence from a former impoverished county in Central China. Gene 2025, 945, 149275. [Google Scholar] [CrossRef]
- Caffrey, A.; McNulty, H.; Rollins, M.; Prasad, G.; Gaur, P.; Talcott, J.B.; Witton, C.; Cassidy, T.; Marshall, B.; Dornan, J.; et al. Effects of maternal folic acid supplementation during the second and third trimesters of pregnancy on neurocognitive development in the child: An 11-year follow-up from a randomised controlled trial. BMC Med. 2021, 19, 73. [Google Scholar] [CrossRef]
- McNulty, H.; Rollins, M.; Cassidy, T.; Caffrey, A.; Marshall, B.; Dornan, J.; McLaughlin, M.; McNulty, B.A.; Ward, M.; Strain, J.J.; et al. Effect of continued folic acid supplementation beyond the first trimester of pregnancy on cognitive performance in the child: A follow-up study from a randomized controlled trial (FASSTT Offspring Trial). BMC Med. 2019, 17, 196. [Google Scholar] [CrossRef]
- Wang, Y.; Liu, Y.; Ji, W.; Qin, H.; Wu, H.; Xu, D.; Tukebai, T.; Wang, Z. Analysis of MTR and MTRR Polymorphisms for Neural Tube Defects Risk Association. Medicine 2015, 94, e1367. [Google Scholar] [CrossRef]
- Zappacosta, B.; Graziano, M.; Persichilli, S.; Di Castelnuovo, A.; Mastroiacovo, P.; Iacoviello, L. 5,10-Methylenetetrahydrofolate reductase (MTHFR) C677T and A1298C polymorphisms: Genotype frequency and association with homocysteine and folate levels in middle-southern Italian adults. Cell Biochem. Funct. 2014, 32, 1–4. [Google Scholar] [CrossRef]
- Shivkar, R.R.; Gawade, G.C.; Padwal, M.K.; Diwan, A.G.; Mahajan, S.A.; Kadam, C.Y. Association of MTHFR C677T (rs1801133) and A1298C (rs1801131) Polymorphisms with Serum Homocysteine, Folate and Vitamin B12 in Patients with Young Coronary Artery Disease. Indian J. Clin. Biochem. 2022, 37, 224–231. [Google Scholar] [CrossRef]
- Stanger, O.; Herrmann, W.; Pietrzik, K.; Fowler, B.; Geisel, J.; Dierkes, J.; Weger, M.; DACH-LIGA, H.E.V. DACH-LIGA homocystein (german, austrian and swiss homocysteine society): Consensus paper on the rational clinical use of homocysteine, folic acid and B-vitamins in cardiovascular and thrombotic diseases: Guidelines and recommendations. Clin. Chem. Lab. Med. 2003, 41, 1392. [Google Scholar] [CrossRef]
- Ye, M.; Xu, G.; Zhang, L.; Kong, Z.; Qiu, Z. Meta Analysis of Methylenetetrahydrofolate Reductase (MTHFR) C677T polymorphism and its association with folate and colorectal cancer. BMC Cancer 2025, 25, 169. [Google Scholar] [CrossRef]
- Lisboa, J.V.D.C.; Ribeiro, M.R.; Luna, R.C.P.; Lima, R.P.A.; Do Nascimento, R.A.F.; Monteiro, M.G.C.A.; Lima, K.Q.D.F.; Fechine, C.P.N.D.; de Oliveira, N.F.P.; Persuhn, D.C.; et al. Food Intervention with Folate Reduces TNF-α and Interleukin Levels in Overweight and Obese Women with the MTHFR C677T Polymorphism: A Randomized Trial. Nutrients 2020, 12, 361. [Google Scholar] [CrossRef]
- Obeid, R.; Warnke, I.; Wittke, A.; Bendik, I.; Troesch, B.; Schoop, R.; Hecht, C.; Demmelmair, J.; Koletzko, B. Infant blood concentrations of folate markers and catabolites are modified by 5,10-methylenetetrahydrofolate reductase C677T genotype and dietary folate source. Am. J. Clin. Nutr. 2023, 117, 509–517. [Google Scholar] [CrossRef]
- Qin, X.; Spence, J.D.; Li, J.; Zhang, Y.; Li, Y.; Sun, N.; Liang, M.; Song, Y.; Zhang, Y.; Wang, B.; et al. Interaction of serum vitamin B12 and folate with MTHFR genotypes on risk of ischemic stroke. Neurology 2020, 94, e1126–e1136. [Google Scholar] [CrossRef]
- El-baz, F.; Abd El-Aal, M.; Moustafa Kamal, T.; Abdrabou Sadek, A.; Othman, A.A. Study of the C677T and 1298AC polymorphic genotypes of MTHFR Gene in autism spectrum disorder. Electron. Physician 2017, 9, 5287–5293. [Google Scholar] [CrossRef]
- Xin, Y.; Wu, L.; Lu, X.; Shangguan, S.; Wang, Z.; Chang, S.; Yin, J.; Piao, W.; Zhang, T.; Wang, L. Effects of MTHFR A1298C polymorphism on peripheral blood folate concentration in healthy populations: A meta-analysis of observational studies. Asia Pac. J. Clin. Nutr. 2018, 27, 718–727. [Google Scholar] [CrossRef] [PubMed]
- Safarinejad, M.R.; Shafiei, N.; Safarinejad, S. Relationship between three polymorphisms of methylenetetrahydrofolate reductase (MTHFR C677T, A1298C, and G1793A) gene and risk of prostate cancer: A case–control study. Prostate 2010, 70, 1645–1657. [Google Scholar] [CrossRef] [PubMed]
- Pu, D.; Shen, Y.; Wu, J. Association betweenMTHFR Gene Polymorphisms and the Risk of Autism Spectrum Disorders: AM eta-Analysis. Autism Res. 2013, 6, 384–392. [Google Scholar] [CrossRef]
- Leclerc, D.; Wilson, A.; Dumas, R.; Gafuik, C.; Song, D.; Watkins, D.; Heng, H.H.; Rommens, J.M.; Scherer, S.W.; Rosenblatt, D.S.; et al. Cloning and mapping of a cDNA for methionine synthase reductase, a flavoprotein defective in patients with homocystinuria. Proc. Natl. Acad. Sci. USA 1998, 95, 3059–3064. [Google Scholar] [CrossRef] [PubMed]
- Peng, Q.; Liao, S.; He, Y.; Liang, L.; Su, X.; Rao, C.; Li, W.; Li, S.; Lu, X. A molecular-beacon-based asymmetric PCR assay for detecting polymorphisms related to folate metabolism. J. Clin. Lab. Anal. 2020, 34, e23337. [Google Scholar] [CrossRef]
- Selhub, J.; Jacques, P.F.; Dallal, G.; Choumenkovitch, S.; Rogers, G. The use of blood concentrations of vitamins and their respective functional indicators to define folate and vitamin B12 status. Food Nutr. Bull. 2008, 29, S67–S73. [Google Scholar] [CrossRef]
- Li, W.; Lv, W.; Dai, S.; Pan, M.; Huang, J. Joint associations of folate, homocysteine and MTHFR, MTR and MTRR gene polymorphisms with dyslipidemia in a Chinese hypertensive population: A cross-sectional study. Lipids Health Dis. 2015, 14, 101. [Google Scholar] [CrossRef]
- Barbosa, P.R.; Stable, S.P.; Machado, A.L.K.; Braga, R.C.; Hirata, R.D.C.; Hirata, M.H.; Sampaio-Neto, L.F.; Allen, R.H.; Guerra-Shinohara, E.M. Association between decreased vitamin levels and MTHFR, MTR and MTRR gene polymorphisms as determinants for elevated total homocysteine concentrations in pregnant women. Eur. J. Clin. Nutr. 2008, 62, 1010–1021. [Google Scholar] [CrossRef]
- Jackson, M.D.; Tulloch-Reid, M.K.; McFarlane-Anderson, N.; Watson, A.; Seers, V.; Bennett, F.I.; Egleston, B.; Ragin, C. Complex interaction between serum folate levels and genetic polymorphisms in folate pathway genes: Biomarkers of prostate cancer aggressiveness. Genes Nutr. 2013, 8, 199–207. [Google Scholar] [CrossRef]
- Miller, J.W.; Smith, A.; Troen, A.M.; Mason, J.B.; Jacques, P.F.; Selhub, J. Excess Folic Acid and Vitamin B12 Deficiency: Clinical Implications? Food Nutr. Bull. 2024, 45, S67–S72. [Google Scholar] [CrossRef]
- Nemati, H.; Boroujeni, A.F.; Inaloo, S.; Katibeh, P.; Shahriari, M. The Cerebrospinal Fluid Concentration of Methyltetrahydrofolate and Serum Folate in Children with Developmental Delay, Regression, and/or Refractory Epilepsy. Neurol. India 2021, 69, 1343–1348. [Google Scholar] [CrossRef]


| SNP | Primer FAM | Primer HEX | Universal Primers |
|---|---|---|---|
| MTHFR C677T | GCTCCGTCATGATGAAATCGG | GCTGCGTCATCATCAAATCGA | CTGACCTGAACCACTTGAAGGA |
| MTHFR A1298C | GGAGGAGCTGACCAGTCAAGA | GGAGGAGCTGACCAGTGAAGC | GGTAAAGAACGAAGACTTCAAAGACACTT |
| MTRR A66G | GGCAAAGGCCATCGCAGAAGAAATA | GGCAAAGGCCATCGCAGAAGAAATG | TGAAGATCTGCAGAAAATCCATGTACC |
| MTR A2756G | CCTTGAGAGACTCATAATGGC | CCTTGAGAGACTCATAATGGT | CTTTGAGGAAATCATCGAAGAA |
| Variables | Serum Folate Level a | p-Value b | |||
|---|---|---|---|---|---|
| Low (n = 59) | Medium (n = 453) | High (n = 102) | |||
| M (q1–q3) or n (%) | M (q1–q3) or n (%) | M (q1–q3) or n (%) | |||
| Age (months) | 72 (68–77) | 72 (68–77) | 72 (68–77) | 0.4279 | |
| BMI | 14.9 (14.2–16.5) | 14.5 (13.7–15.6) | 14.4 (13.5–15.3) | 0.0051 | |
| Birth weight (g) | 3350 (3030–3800) | 3245 (3000–3550) | 3200 (3000–3400) | 0.0496 | |
| Birth height (cm) | 50 (50–51) | 50 (50–50) | 50 (50–50) | 0.1447 | |
| Cognitive scores | 49 (40–53) | 44 (35–52) | 43 (34–52) | 0.0805 | |
| serum folate level (ng/mL) | 5.1 (4.4–5.4) | 11.3 (8.6–14.3) | 23.6 (21.8–26.6) | <0.0001 | |
| Gender | Male | 37 (62.71) | 233 (51.43) | 45 (44.12) | 0.0748 |
| Female | 22 (37.29) | 220 (48.57) | 57 (55.88) | ||
| Province | Henan Province | 45 (76.27) | 246 (54.30) | 27 (26.47) | <0.0001 |
| Guizhou Province | 14 (23.73) | 207 (45.70) | 75 (73.53) | ||
| Educational level of caregivers | Primary school or below | 16 (27.12) | 134 (29.58) | 33 (32.35) | 0.9690 |
| Junior high school | 32 (54.24) | 238 (52.54) | 51 (50.00) | ||
| High school or above | 11 (18.64) | 81 (17.88) | 18 (17.65) | ||
| MTHFR C677T | CC | 6 (10.17) | 127 (28.04) | 37 (36.27) | <0.0001 |
| CT | 25 (42.37) | 215 (47.46) | 52 (50.98) | ||
| TT | 28 (47.46) | 111 (24.50) | 13 (12.75) | ||
| MTHFR A1298C | CC | 1 (1.69) | 20 (4.42) | 6 (5.88) | 0.0234 |
| CA | 11 (18.64) | 126 (27.81) | 40 (39.22) | ||
| AA | 47 (79.66) | 307 (67.77) | 56 (54.90) | ||
| MTRR A66G | GG | 3 (5.08) | 31 (6.84) | 5 (4.90) | 0.3982 |
| GA | 26 (44.07) | 162 (35.76) | 46 (45.10) | ||
| AA | 30 (50.85) | 260 (57.40) | 51 (50.00) | ||
| MTR A2756G | AA | 47 (79.66) | 370 (81.68) | 84 (82.35) | 0.3706 |
| AG | 10 (16.95) | 78 (17.22) | 15 (14.71) | ||
| GG | 2 (3.39) | 5 (1.10) | 3 (2.94) | ||
| Variables | n (%) | Adjusted β (95%CI) a,b | Adjusted β (95%CI) a,b | |
|---|---|---|---|---|
| MTHFR C677T | CC | 170 (27.69) | reference | reference |
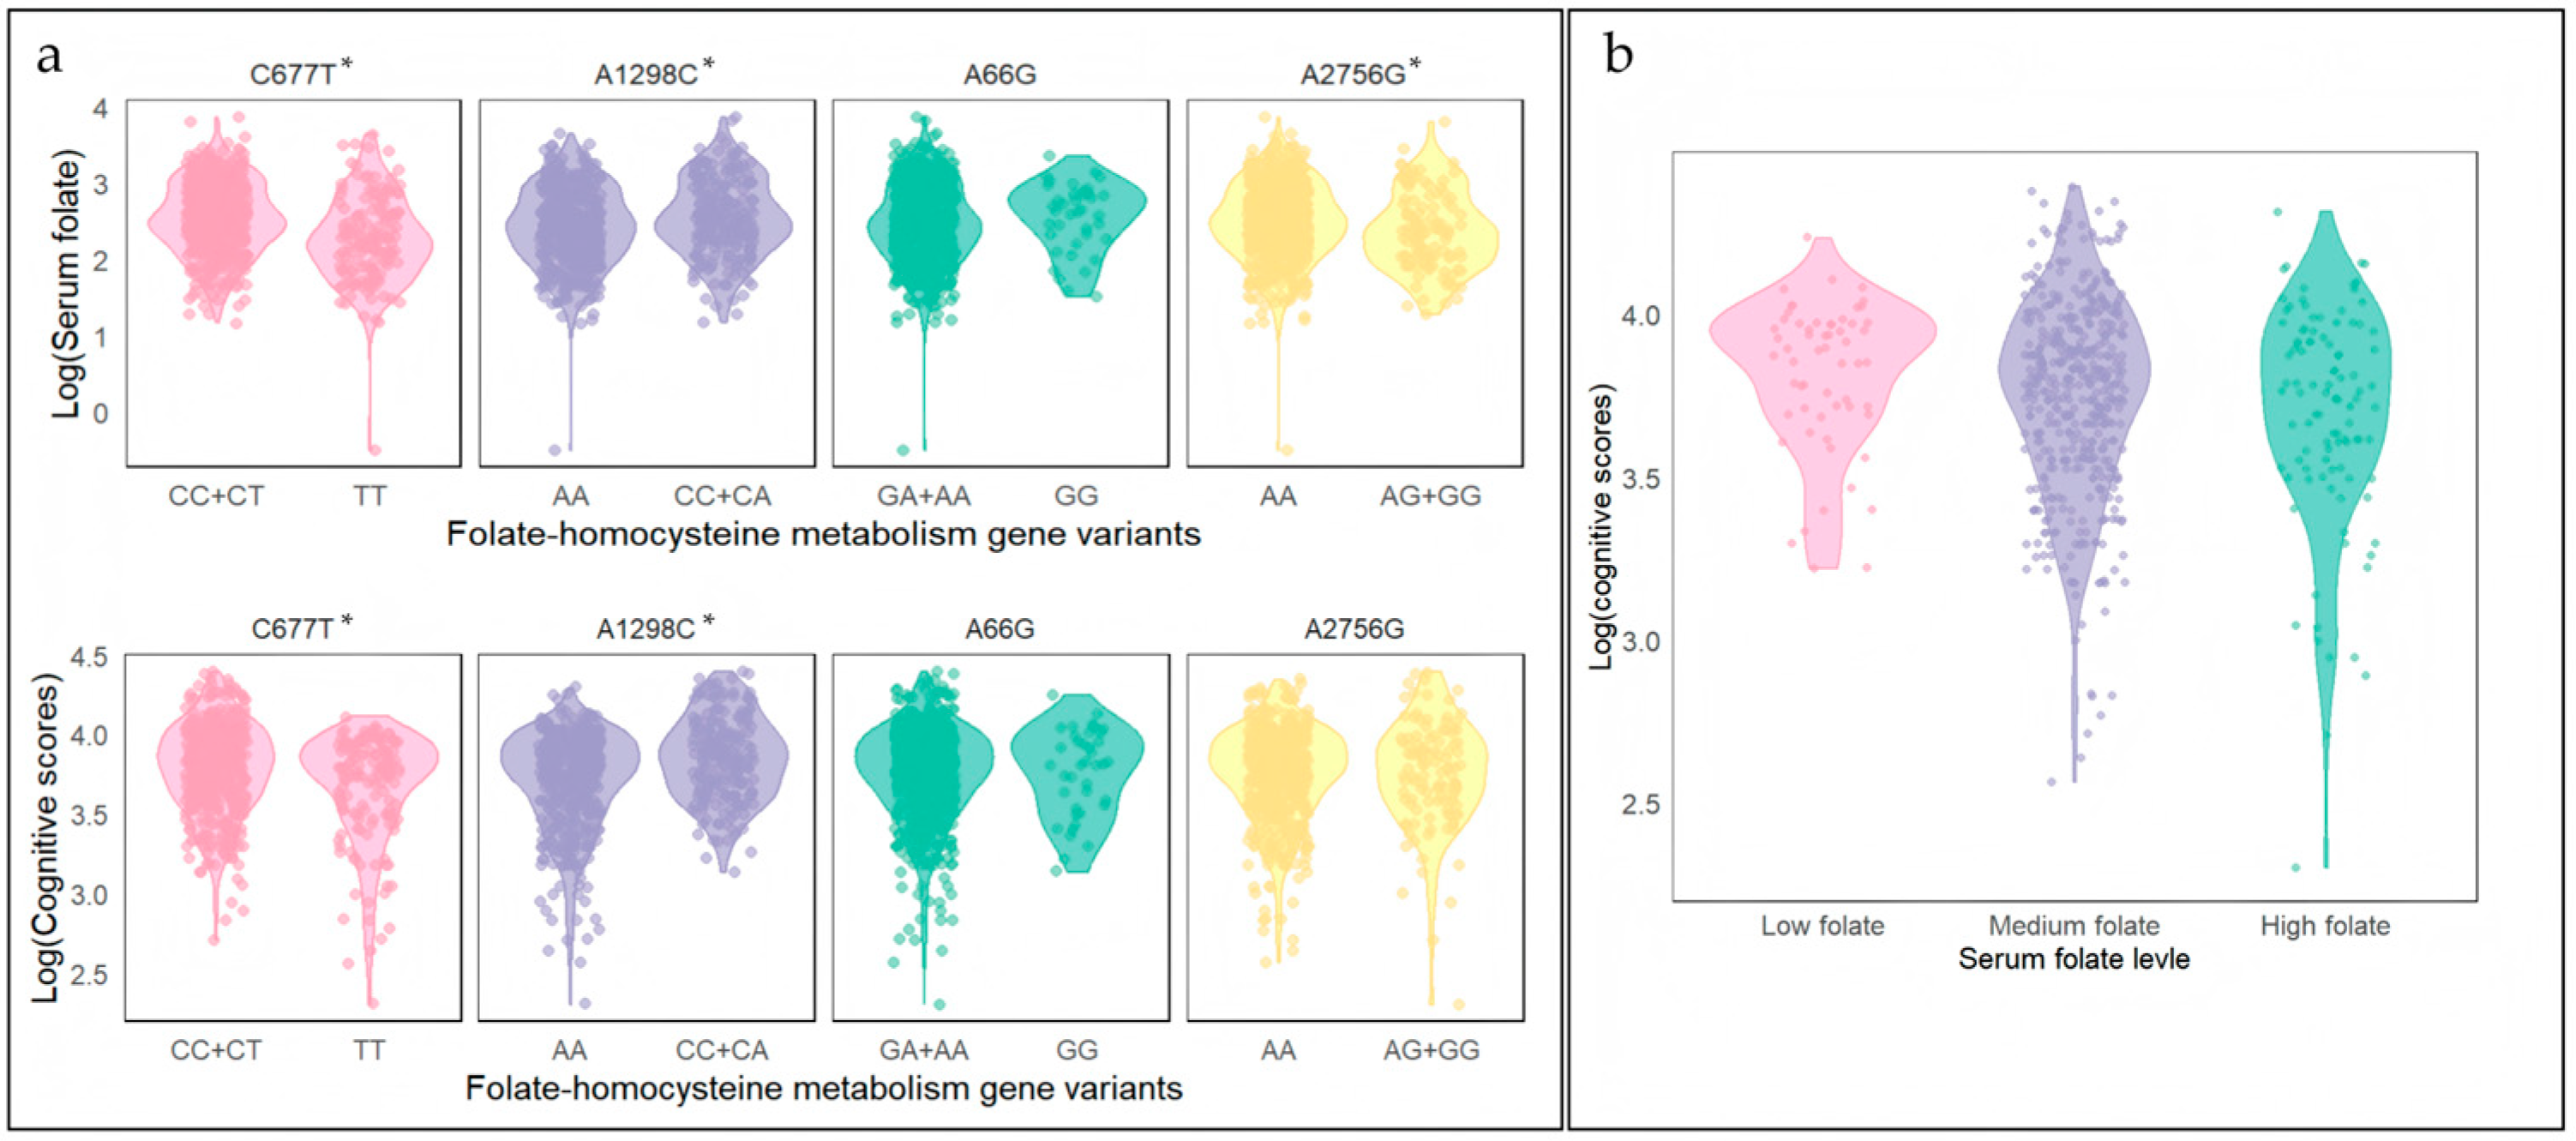
| CT | 292 (47.56) | −0.0318 (−0.1250, 0.0615) | −0.0491 (−0.1023, 0.0041) + | |
| TT | 152 (24.76) | −0.0907 (−0.1476, −0.0338) * | −0.1253 (−0.1903, −0.0604) ** | |
| CC + CT | 462 (75.24) | reference | reference | |
| TT | 152 (24.76) | −0.1595 (−0.2533, −0.0656) ** | −0.0914 (−0.1451, −0.0377) ** | |
| MTHFR A1298C | CC | 27 (4.40) | reference | reference |
| CA | 177 (28.83) | 0.0484 (−0.1512, 0.2480) | −0.0114 (−0.1237, 0.1009) | |
| AA | 410 (66.78) | −0.0154 (−0.1116, 0.0809) | −0.1264 (−0.2347, −0.0181) * | |
| CC + CA | 204 (33.22) | reference | reference | |
| AA | 410 (66.78) | −0.0728 (−0.1560, 0.0105) + | −0.1165 (−0.1633, −0.0670) ** | |
| MTRR A66G | GG | 39 (6.35) | reference | reference |
| GA | 234 (38.11) | −0.0497 (−0.2164, 0.1169) | −0.0211 (−0.1162, 0.0740) | |
| AA | 341 (55.54) | −0.0216 (−0.1033, 0.0600) | −0.0572 (−0.1503, 0.0360) | |
| GG | 39 (6.35) | reference | reference | |
| GA + AA | 575 (93.65) | −0.0460 (−0.2055, 0.1136) | −0.0422 (−0.1334, 0.0490) | |
| MTR A2756G | AA | 501 (81.60) | reference | reference |
| AG | 103 (16.78) | −0.1329 (−0.2360, −0.0298) * | 0.0264 (−0.0329, 0.0857) | |
| GG | 10 (1.63) | −0.2162 (−0.5201, 0.0877) | −0.0440 (−0.2188, 0.1308) | |
| AA | 501 (81.60) | reference | reference | |
| AG + GG | 113 (18.40) | −0.1402 (−0.2395, −0.0410) * | 0.0202 (−0.0369, 0.0773) | |
| Variables | n (%) | Folate-Adjusted β (95%CI) a,b | Cognition-Adjusted β (95%CI) a,b | |
|---|---|---|---|---|
| MTHFR C677T | MTHFR A1298C | |||
| CC + CT | CC + CA | 200 (32.57) | reference | reference |
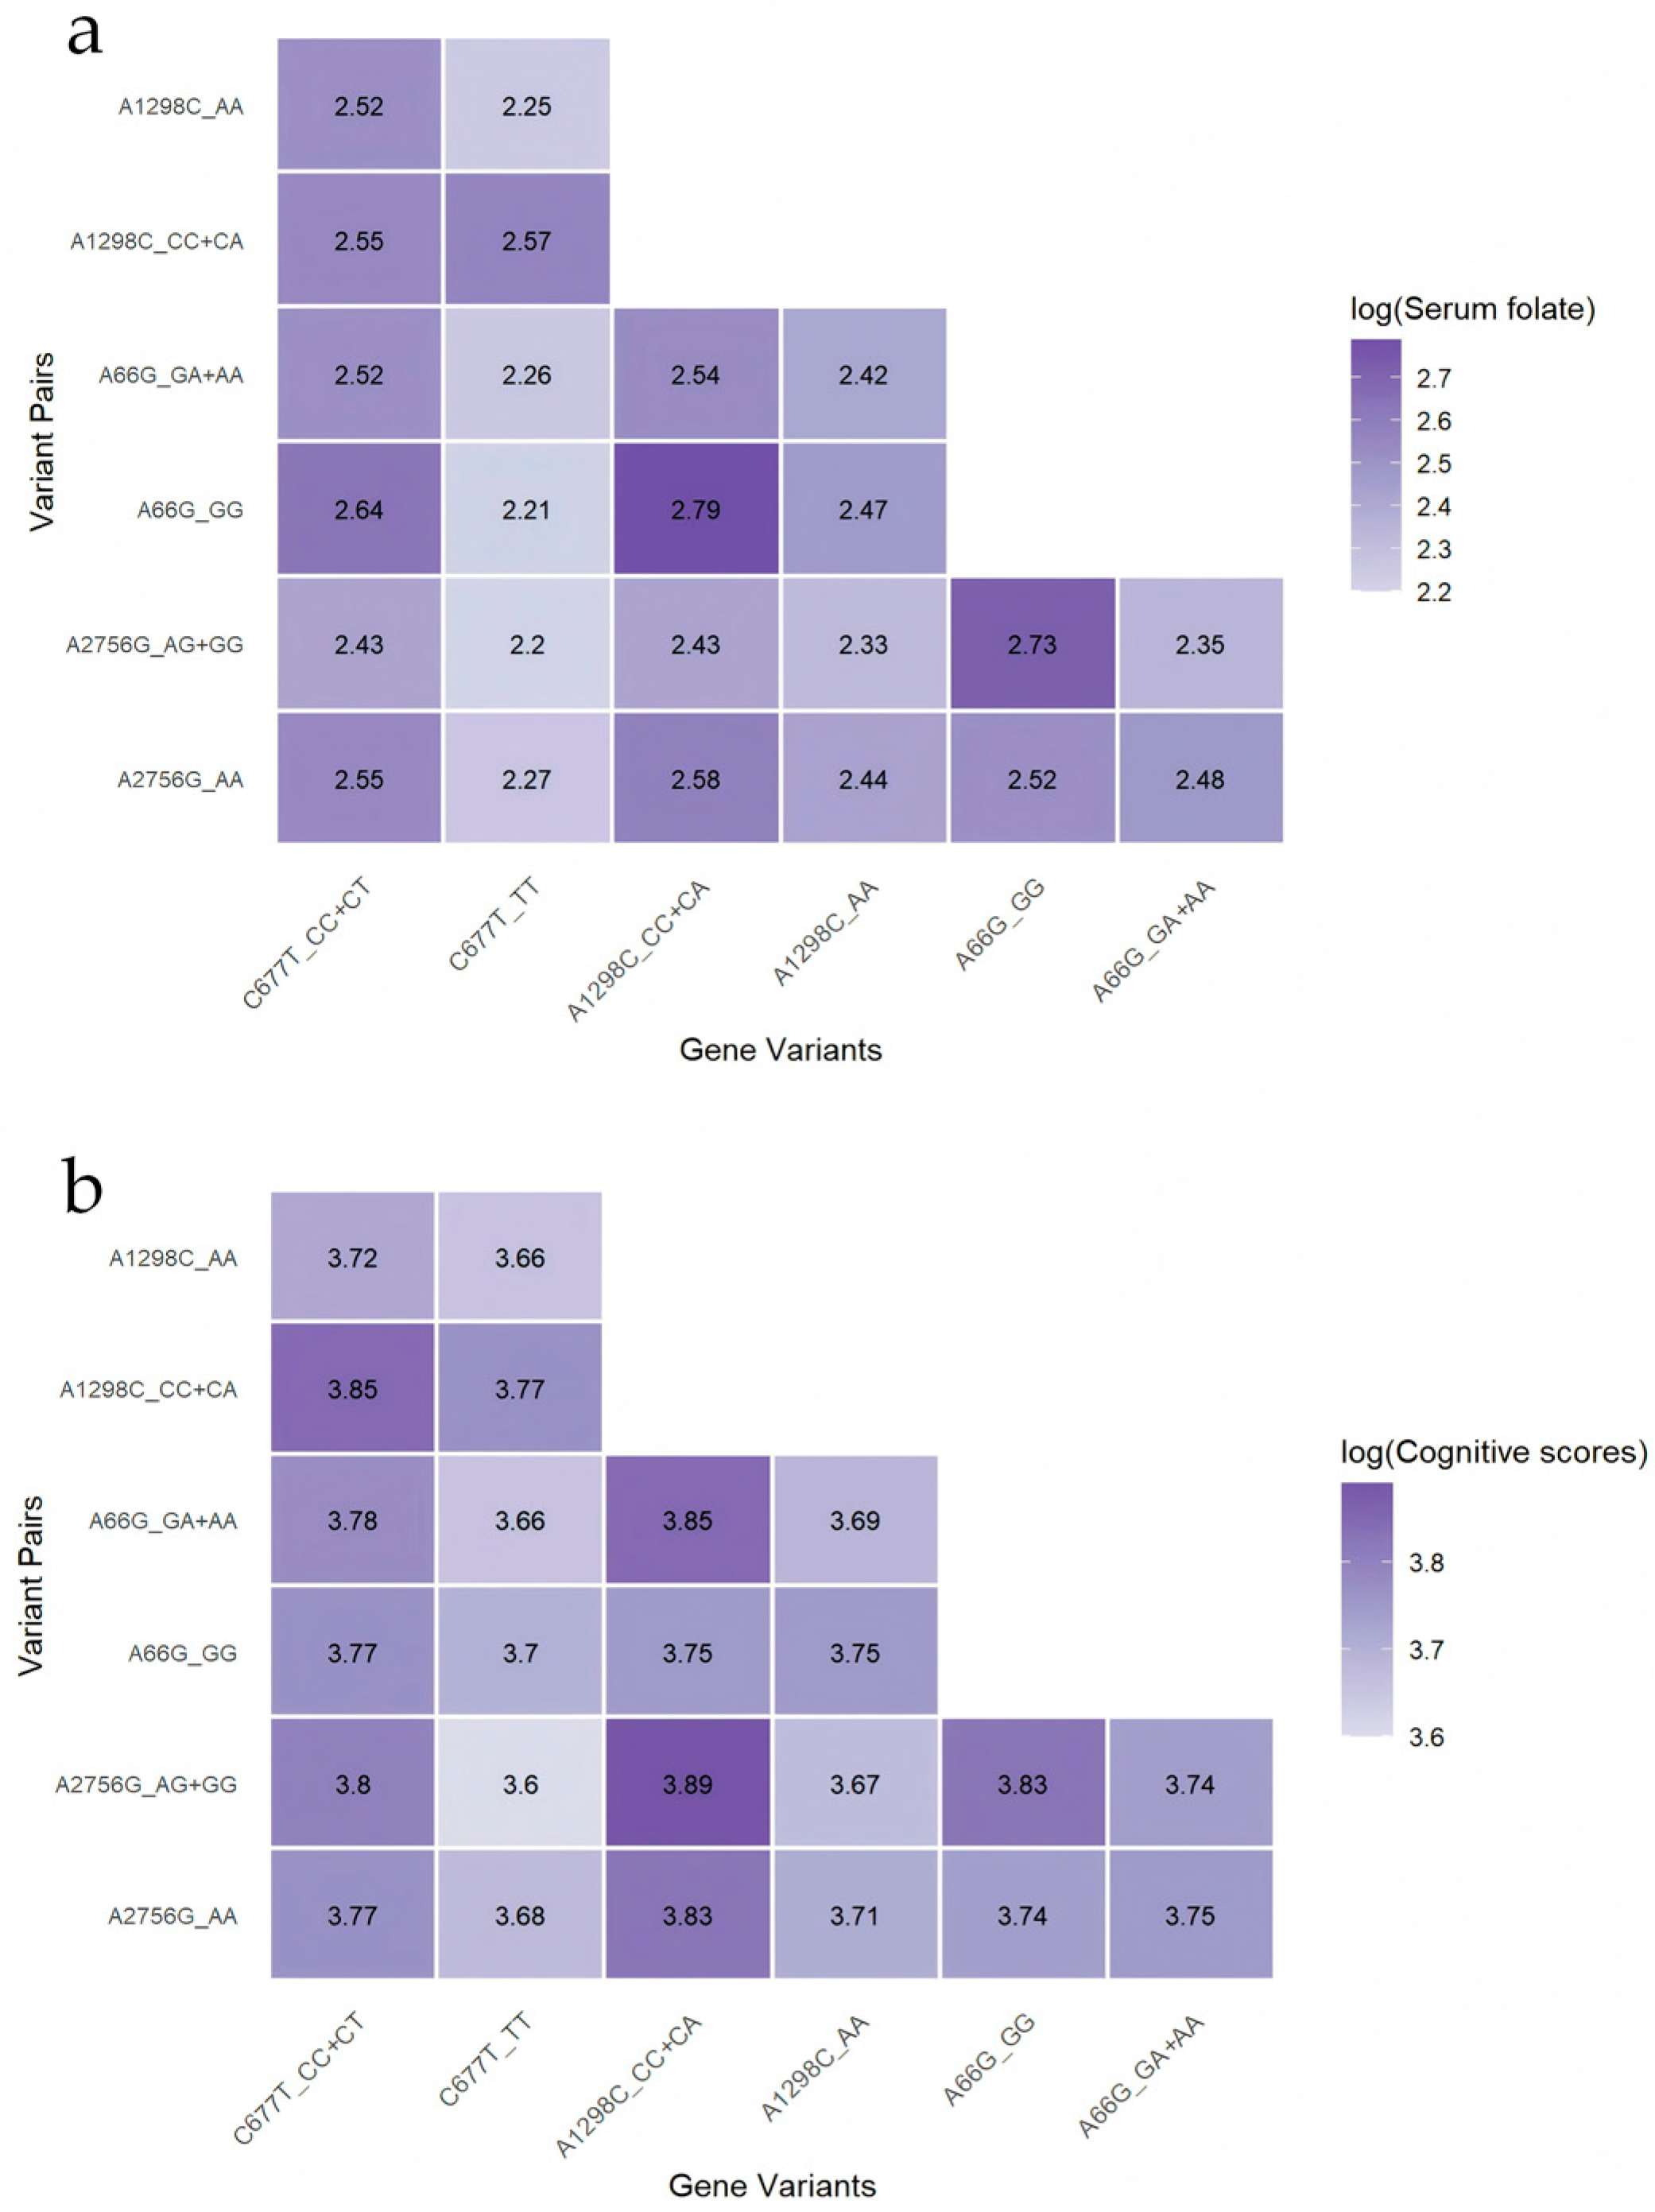
| CC + CT | AA | 262 (42.67) | −0.0177 (−0.1070, 0.0717) | −0.1001 (−0.1506, −0.0495) ** |
| TT | CC + CA | 4 (0.65) | 0.1649 (−0.3158, 0.6456) | −0.0325 (−0.3044, 0.2393) |
| TT | AA | 148 (24.10) | −0.1788 (−0.2872, −0.0704) * | −0.1538 (−0.2151, −0.0924) ** |
| MTHFR C677T | MTRR A66G | |||
| CC + CT | GG | 30 (4.89) | reference | reference |
| CC + CT | GA + AA | 432 (70.36) | −0.0739 (−0.2542, 0.10664) | −0.0202 (−0.1232, 0.0828) |
| TT | GG | 9 (1.47) | −0.2754 (−0.6398, 0.0890) | −0.0026 (−0.2109, 0.2057) |
| TT | GA + AA | 143 (23.29) | −0.2264 (−0.4216, −0.0313) * | −0.1169 (−0.2284, −0.0053) * |
| MTHFR C677T | MTR A2756G | |||
| CC + CT | AA | 380 (61.89) | reference | reference |
| CC + CT | AG + GG | 82 (13.36) | −0.1380 (−0.2531, −0.0229) * | 0.0523 (−0.0137, 0.1184) |
| TT | AA | 121 (19.71) | −0.1576 (−0.2613, −0.0540) * | −0.0708 (−0.1303, −0.0113) * |
| TT | AG + GG | 31 (5.05) | −0.2812 (−0.4595, −0.1028) * | −0.1253 (−0.2276, −0.0230) * |
| MTHFR A1298C | MTRR A66G | |||
| CC + CA | GG | 9 (1.47) | reference | reference |
| CC + CA | GA + AA | 195 (31.76) | −0.1806 (−0.5072, 0.1460) | 0.0290 (−0.1545, 0.2124) |
| AA | GG | 30 (4.89) | −0.2312 (−0.5942, 0.1318) | −0.0138 (−0.2177, 0.1901) |
| AA | GA + AA | 380 (61.89) | −0.2466 (−0.5701, 0.0770) | −0.0948 (0.2765, 0.0869) |
| MTHFR A1298C | MTR A2756G | |||
| CC + CA | AA | 163 (26.55) | reference | reference |
| CC + CA | AG + GG | 41 (6.68) | −0.1548 (−0.3211, 0.0115) + | 0.0707 (−0.233, 0.1646) |
| AA | AA | 338 (55.05) | −0.0802 (−0.1721, 0.0118) + | −0.0996 (−0.1516, −0.0477) ** |
| AA | AG + GG | 72 (11.73) | −0.2172 (−0.3528, −0.0815) * | −0.1144 (−0.1911, −0.0378) * |
| MTRR A66G | MTR A2756G | |||
| GG | AA | 34 (5.54) | reference | reference |
| GG | AG + GG | 5 (0.81) | 0.2607 (−0.1959, 0.7172) | −0.0129 (−0.2760, 0.2503) |
| GA + AA | AA | 467 (76.06) | 0.0195 (−0.1508, 0.1898) | −0.0485 (−0.1466, 0.0497) |
| GA + AA | AG + GG | 108 (17.59) | −0.1406 (−0.3280, 0.0468) | −0.0253 (−0.1333, 0.0827) |
| Number of Risk Genotypes a | Total (n = 614) | Serum Folate Level | ||
|---|---|---|---|---|
| Folate-β (95%CI) b,c | Cognition-β (95%CI) b,c | Low and Medium (n = 512) | High (n = 102) | |
| Cognition-β (95%CI) b,c | Cognition-β (95%CI) b,c | |||
| 0 (n = 154) | reference | reference | reference | reference |
| 1 (n = 247) | −0.0373 (−0.1349, 0.0604) | −0.0620 (−0.1178, −0.0061) * | −0.0567 (−0.1178, 0.0044) + | −0.0966 (−0.2405, 0.0474) |
| 2 (n = 172) | −0.1504 (−0.2583, 0.0425) * | −0.1049 (−0.1666, −0.0431) ** | −0.0899 (−0.1557, −0.0241) * | −0.2231 (−0.4119, −0.0343) * |
| 3 (n = 41) | −0.2617 (−0.4312, 0.0921) * | −0.1351 (−0.2321, −0.0381) * | −0.1019 (−0.2041, 0.0003) + | −0.3644 (−0.6750, −0.0539) * |
Disclaimer/Publisher’s Note: The statements, opinions and data contained in all publications are solely those of the individual author(s) and contributor(s) and not of MDPI and/or the editor(s). MDPI and/or the editor(s) disclaim responsibility for any injury to people or property resulting from any ideas, methods, instructions or products referred to in the content. |
© 2025 by the authors. Licensee MDPI, Basel, Switzerland. This article is an open access article distributed under the terms and conditions of the Creative Commons Attribution (CC BY) license (https://creativecommons.org/licenses/by/4.0/).
Share and Cite
Ou, L.; Peng, L.; Wang, J.; Han, C.; Zhao, X.; Wang, M.; Wang, M.; Gong, Z.; Li, Y. Synergistic Effects of MTHFR, MTRR, and MTR Gene Variants on Serum Folate Levels and Cognitive Function in Chinese Preschoolers: A Cross-Sectional Study. Nutrients 2025, 17, 2666. https://doi.org/10.3390/nu17162666
Ou L, Peng L, Wang J, Han C, Zhao X, Wang M, Wang M, Gong Z, Li Y. Synergistic Effects of MTHFR, MTRR, and MTR Gene Variants on Serum Folate Levels and Cognitive Function in Chinese Preschoolers: A Cross-Sectional Study. Nutrients. 2025; 17(16):2666. https://doi.org/10.3390/nu17162666
Chicago/Turabian StyleOu, Lingling, Luolan Peng, Jingbo Wang, Chao Han, Xiayu Zhao, Mengyao Wang, Mengtian Wang, Zhaolong Gong, and Yan Li. 2025. "Synergistic Effects of MTHFR, MTRR, and MTR Gene Variants on Serum Folate Levels and Cognitive Function in Chinese Preschoolers: A Cross-Sectional Study" Nutrients 17, no. 16: 2666. https://doi.org/10.3390/nu17162666
APA StyleOu, L., Peng, L., Wang, J., Han, C., Zhao, X., Wang, M., Wang, M., Gong, Z., & Li, Y. (2025). Synergistic Effects of MTHFR, MTRR, and MTR Gene Variants on Serum Folate Levels and Cognitive Function in Chinese Preschoolers: A Cross-Sectional Study. Nutrients, 17(16), 2666. https://doi.org/10.3390/nu17162666


