Article

The Impact of Tea Consumption on Prediabetes Regression and Progression: A Prospective Cohort Study

1
Department of Endocrinology, Zhongda Hospital, Institute of Diabetes, School of Medicine, Southeast University, Nanjing 210009, China
2
Centre of Research Excellence in Translating Nutritional Science to Good Health, Adelaide Medical School, The University of Adelaide, Adelaide, SA 5000, Australia
3
Department of General Practice, Zhongda Hospital, Institute of Diabetes, School of Medicine, Southeast University, Nanjing 210009, China
*
Authors to whom correspondence should be addressed.
Nutrients 2025, 17(14), 2366; https://doi.org/10.3390/nu17142366 (registering DOI)
Submission received: 19 June 2025 / Revised: 16 July 2025 / Accepted: 17 July 2025 / Published: 19 July 2025
(This article belongs to the Section Nutrition and Diabetes)

Abstract

Background: Lifestyle modifications are pivotal to preventing the progression of prediabetes and associated cardiometabolic diseases. Recent evidence from cross-sectional analysis of community-dwelling Chinese adults suggests that regular consumption of tea, particularly dark tea, is associated with a reduced risk of both prediabetes and type 2 diabetes. However, the effects of tea consumption on prediabetes progression and regression remain uncertain. This study investigated the associations of tea consumption with prediabetes progression and regression in Chinese adults with prediabetes. Methods: A cohort of 2662 Chinese adults with prediabetes was followed over ~3 years. Baseline tea consumption, including the type (green, black, dark, or other) and frequency (daily, sometimes, or nil), was assessed using standardized questionnaires. Prediabetes was defined according to the American Diabetes Association criteria. Multinomial logistic and linear regression analyses with multivariable adjustment was performed to evaluate associations. Results: Compared to non-tea drinkers, dark tea consumers were less likely to progress to type 2 diabetes (odds ratio [OR]: 0.28, 95% confidence interval [CI]: 0.11, 0.72, p = 0.01), whereas green tea consumption was associated with a reduced probability of regressing to normoglycemia (OR: 0.73, 95 CI%: 0.59, 0.90, p = 0.01). Conclusions: These findings support further exploration of dark tea consumption as a strategy to reduce prediabetes progression, and suggest that effects of green tea consumption should also be examined more closely in this population.

1. Introduction

Prediabetes is a highly prevalent metabolic disorder worldwide, and is estimated to affect about one third of adults in the community in China [1,2]. Mounting evidence suggests that prediabetes represents a major independent risk factor for cardiovascular disease and mortality [3,4], and that this risk can be mitigated by regression to normoglycemia [5]. International diabetes guidelines emphasize lifestyle interventions to prevent prediabetes progression and promote its regression [6,7]. In relation to dietary factors, tea consumption is generally considered to exhibit a favorable impact on glucose homeostasis [8,9]. However, we and others have provided evidence that the type of tea consumed is important [9,10,11], probably reflecting differences in the tea manufacturing process and resultant biological effects [12].
In China, tea is commonly classified according to the specialized manufacturing processes, particularly the degree of enzymatic oxidation (often referred to as fermentation) [13]. Table 1 outlines the distinct differences in production methods and compositional characteristics among green, black, and dark teas. Green tea undergoes minimal processing, with rapid heat treatment (steaming or pan-firing) applied post-harvest to inactivate oxidation enzymes. This preserves its verdant color and high concentrations of catechins, particularly epigallocatechin gallate, which are potent antioxidants and are widely perceived to drive potential health benefits [14,15]. While some studies suggest that daily green tea consumption (more than 6 cups per day) is associated with a decreased risk of type 2 diabetes [16,17], others show inconsistent findings [18,19,20]. For example, a study in Vietnam reported that higher green tea intake was linked to increased risks of diabetes and insulin resistance [18]. Similarly, a prospective study in Chinese adults found that green tea drinkers had a 20% higher risk of diabetes compared to non-drinkers [19]. Relative to green tea, semi-fermented teas, such as Oolong tea, undergo partial enzymatic oxidation, resulting in more complex aroma and flavor due to the partial conversion of catechins into theaflavins and thearubigins [21]. Black tea, by contrast, undergoes complete enzymatic oxidation, thus extensively converting catechins into theaflavins and thearubigins [22]. A prospective cohort study among Japanese male workers found that consumption of two or more cups of Oolong tea per day was associated with an increased risk of diabetes [11]. In contrast, a prospective study in Singapore Chinese adults reported that drinking more than one cup of black tea per day was associated with a decreased risk of type 2 diabetes [10]. Dark tea differs markedly in its production, undergoing a unique post-fermentation process involving microbial activity [23,24]. This results in substantial alterations in the abundance and composition of bioactive compounds, including alkaloids, free amino acids, polyphenols, polysaccharides and their derivatives [24], which may underpin its favorable cardiometabolic effects. In our recent cross-sectional analysis of a Chinese adult population, we found that regular dark tea consumption was strongly associated with an increase in urinary glucose excretion and a reduction in the risk of prediabetes and type 2 diabetes [9].
While a number of cohort studies have reported inconsistent findings on the association of tea consumption with incident type 2 diabetes [17,25,26], there is a lack of information relating to the impact of tea consumption on prediabetes progression and regression. This prospective study investigated the associations of type and frequency of tea consumption with prediabetes progression and regression in a large cohort of Chinese community-dwelling adults with prediabetes.

2. Materials and Methods
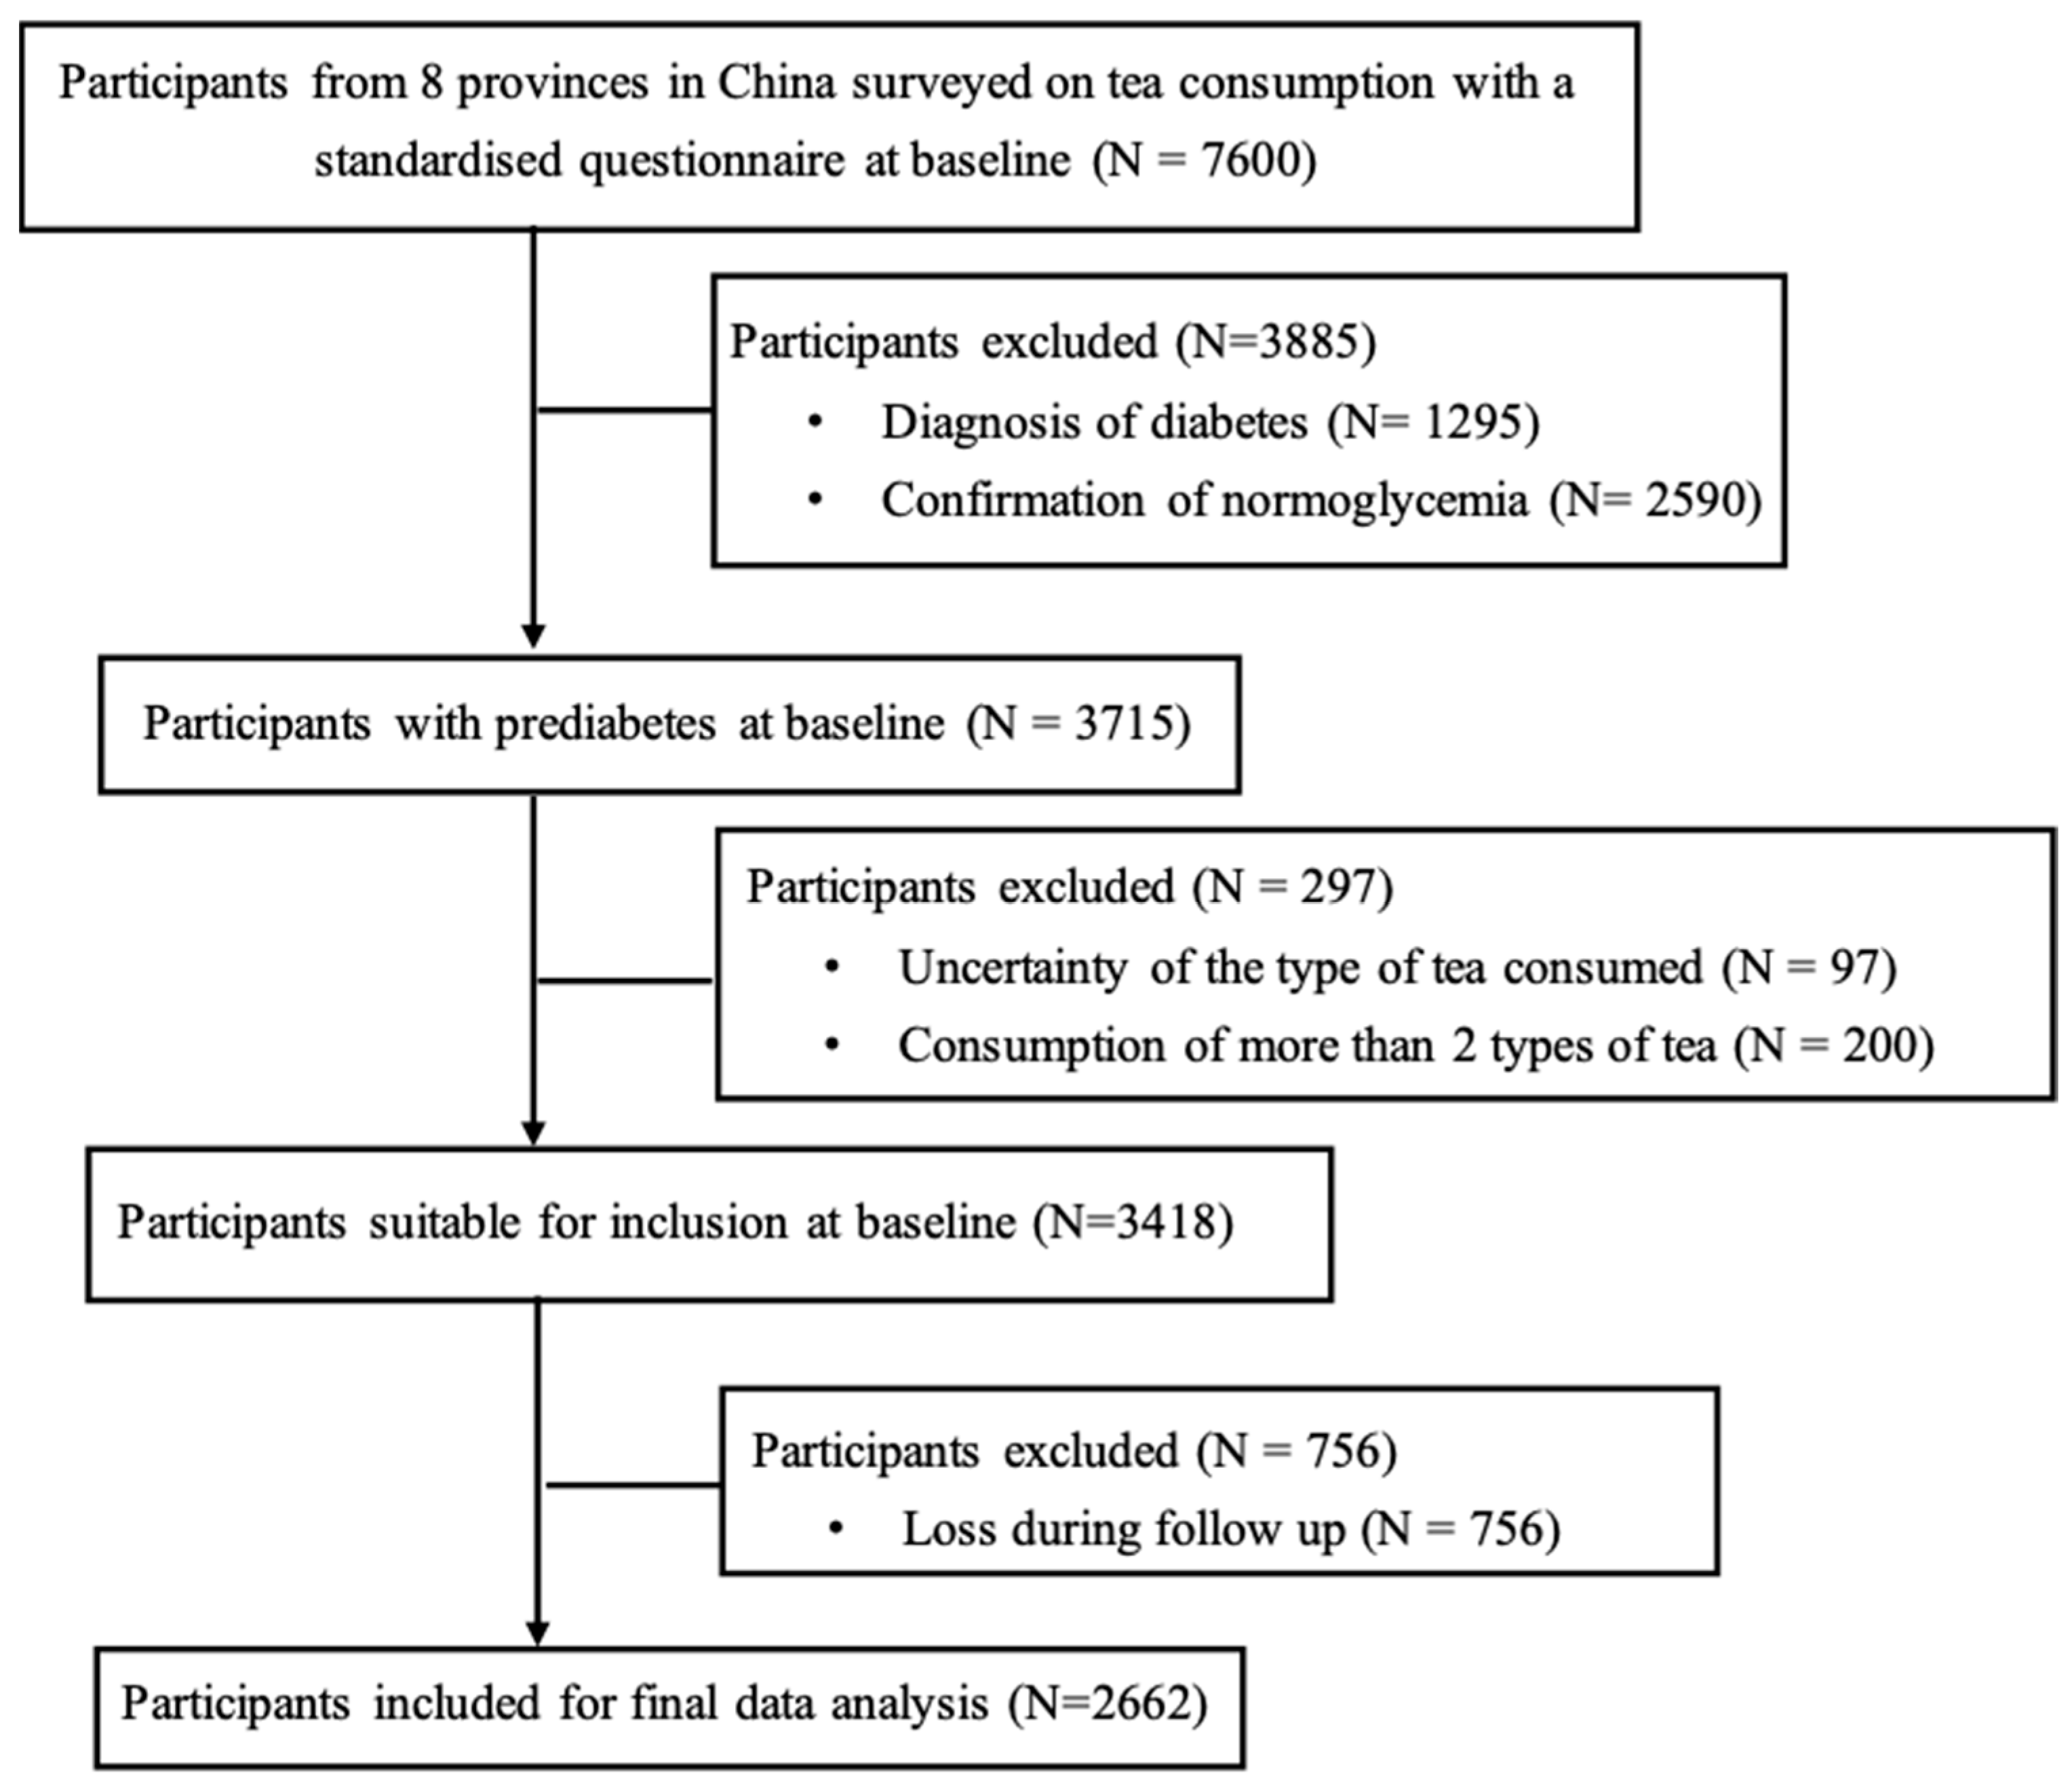
2.1. Participants

This study represents a prospective analysis of a subset of data derived from the Study on Evaluation of iNnovative Screening tools and determInation of optimal diagnostic cut-off points for type 2 diabetes in Chinese multi-Ethnic (SENSIBLE) cohort, which enrolled a nationally representative sample of community-dwellers aged ≥ 18 years from 8 provinces to determine the optimal cut-off values for advanced glycation end-products and glycated hemoglobin (HbA1c) for the diagnosis of type 2 diabetes in China [27,28]. A total of 3715 participants with prediabetes were surveyed on the type and frequency of tea consumption using standardized questionnaires (detailed in the data collection section) at baseline between November 2016 to June 2017 and followed over ~3 years. After excluding participants who had provided insufficient information about the types of tea consumed (n = 97), habitual consumption of ≥2 types of tea (n = 200) and those lost to follow-up (n = 756), 2662 participants were included in the final analysis (Figure 1). The protocol of the SENSIBLE cohort study was approved by the Human Research Ethics Committee of Zhongda Hospital, Southeast University, Nanjing, China (approval number: 2016ZDSYLL092-P01; approval date: 11 January 2017). Written informed consent was obtained from all participants.

2.2. Data Collection

At baseline, information relating to tea consumption (including the type and frequency), dietary habits (including salt and fat content, vegetable and fruit consumption categorized as minimal, low, moderate, or high), regular exercise, antihypertensive medication, family history of diabetes, smoking, and alcohol consumption were collected using a standardized questionnaire by trained interviewers. Body weight, height, waist circumference, and systolic and diastolic blood pressure (SBP and DBP) were measured according to standardized protocols, as reported previously [9,29]. At both baseline and follow-up visits, fasting venous blood was collected after an overnight fast (>8 h) for measurements of fasting plasma glucose (FPG), HbA1c, total cholesterol, triglycerides (TG), high-density lipoprotein-cholesterol (HDL-C), low-density lipoprotein-cholesterol (LDL-C) and serum creatinine. Plasma glucose at 2 h after a 75 g oral glucose drink (2hPG) was also measured in participants without known diabetes. Insulin resistance was assessed by the triglyceride-and-glucose (TyG) index [30,31]. The estimated glomerular filtration rate (eGFR) was calculated using the Chronic Kidney Disease Epidemiology Collaboration formula for the Chinese population [32].
Based on the American Diabetes Association criteria [33], prediabetes was defined as FPG 5.6–6.9 mmol/L, 2hPG 7.8–11.0 mmol/L during the 75 g oral glucose tolerance test or HbA1c 39–47 mmol/mol (5.7–6.4%), while diabetes was defined as FPG ≥ 7.0 mmol/L, 2hPG ≥ 11.1 mmol/L, HbA1c ≥ 48 mmol/mol (6.5%), self-reported history or the use of glucose-lowering medication for established type 2 diabetes, and normoglycemia was defined as FPG < 5.6 mmol/L, 2hPG < 7.8 mmol/L and HbA1c < 39 mmol/mol (5.7%). The type of tea was classified as green, black, dark, or other. The frequency of tea consumption was categorized as (1) nil, (2) occasional (at least once a month), (3) frequent (at least once a week), or (4) daily. The numbers of participants who drank tea either occasionally or frequently proved to be limited, so we combined these two groups for analysis and defined the frequency as ‘sometimes’.

2.3. Statistical Analysis

Continuous variables are presented as means ± standard deviations and categorical variables as numbers (percentages). Participants were stratified into three groups over follow-up, who (i) progressed to diabetes, (ii) regressed to normoglycemia, or (iii) remained as prediabetes. Differences across the three groups at baseline were compared using one-way analysis of variance, or χ2 tests, as appropriate, with post hoc comparisons adjusted by Bonferroni’s correction. Multinominal logistic regression analysis was performed to evaluate the associations between tea consumption and prediabetes progression and regression in both the crude model (Model 1) and adjusted model (Model 2, adjusted for age, sex, BMI, mean arterial pressure, TC, HDL-C, LDL-C, eGFR, low-salt low-fat diet, regular exercise, antihypertensive medication, family history of type 2 diabetes, current smoking status, current alcohol consumption, vegetable consumption and fruit consumption). Linear regression analysis was used to assess the associations of insulin resistance with tea consumption. A variance inflation factor (VIF) > 10 was taken to indicate collinearity between variables [34], but no significant collinearity was detected in any of our analyses. Subgroup analyses based on gender and ethnicity differences were also performed to assess these associations. All statistical analyses were conducted using SPSS (version 25.0, IBM, New York, USA). p values < 0.05 were considered statistically significant.

3. Results

3.1. Baseline Characteristics

A total of 2662 participants with prediabetes (Table 2) were included in the final analysis. Of these, 1647 remained as prediabetes, 299 progressed to type 2 diabetes, and 716 regressed to normoglycemia during the 3-year follow-up. Compared with participants who remained as prediabetes, the group who progressed to diabetes had a slightly higher proportion of males, and higher WC, blood pressure, FPG, 2hPG, HbA1c, TG, use of hypotensive medication, and proportion of current smokers, but similar age, BMI, TC, HDL-C, LDL-C, eGFR, adherence to low-salt low-fat diet and regular exercise, family history of diabetes, habitual alcohol intake, vegetable consumption, and fruit consumption. By contract, participants who regressed to normoglycemia were younger and had lower BMI, WC, blood pressure, FPG, 2hPG, HbA1c, TC, TG, LDL-C, and less regular exercise, use of hypotensive medications, and habitual alcohol intake at baseline (all p < 0.05).
Supplementary Table S1 presents baseline characteristics of participants stratified by tea type. Of the total cohort, 1198 were non-tea drinkers, while 1016 consumed green tea, 138 consumed black tea, 140 consumed dark tea, and 170 consumed other types of tea. Compared to non-tea drinkers, consumers of green, black and dark tea were generally younger and had a higher BMI, WC, and lower FPG. No significant differences were observed across the groups in BP, 2hPG, HbA1c, TC, LDL-C or HDL-C.

3.2. Tea Consumption and Prediabetes Progression and Regression

Associations of tea consumption with prediabetes regression and progression are shown in Table 3. When compared with non-tea drinkers, those who consumed dark tea, but not green, black or other tea, exhibited lower odds of progressing to diabetes (odds ratio [OR]: 0.30, 95% confidence interval [CI]: 0.12 to 0.75, p = 0.01) in the unadjusted model (Model 1). After multivariable adjustment (Model 2), the OR for dark tea drinkers was 0.28 (95% CI: 0.11 to 0.72, p = 0.01). By contract, participants who consumed green tea, but not other types, exhibited lower odds of regressing to normoglycemia (OR: 0.76, 95% CI: 0.63 to 0.93, p = 0.01) in the crude model (Model 1). After multivariable adjustment (Model 2), this association remained significant (OR: 0.73, 95% CI: 0.59 to 0.90, p = 0.01). Subgroup analyses revealed that the association between dark tea consumption and reduced odds of prediabetes progression was particularly evident in females (OR: 0.27, 95% CI: 0.08 to 0.90, p = 0.03) (Supplementary Table S2) and non-Han subgroups (OR: 0.18, 95% CI: 0.04 to 0.80, p = 0.02) (Supplementary Table S3), and that the association between green tea consumption and reduced odds of prediabetes regression was more evident in females (OR: 0.76, 95% CI: 0.58 to 0.99, p = 0.04) (Supplementary Table S2) and Han subgroups (OR: 0.72, 95% CI: 0.58 to 0.90, p = 0.01) (Supplementary Table S3).

3.3. Frequency of Tea Consumption and Prediabetes Progression and Regression

Extending the findings in Table 3, the associations between the frequency of consumption of both green and dark tea and prediabetes progression and regression were further examined, and are summarized in Table 4. Compared with non-tea drinkers, those who consumed dark tea daily exhibited lower odds of progressing to diabetes in both unadjusted and multivariable-adjusted models (model 1: OR: 0.22, 95% CI: 0.07 to 0.71, p = 0.01 and model 2: OR: 0.22, 95% CI: 0.07 to 0.71, p = 0.01, respectively). In participants who consumed green tea daily, the odds of regressing to normoglycemia were reduced (model 1: OR: 0.74, 95% CI: 0.59 to 0.94, p = 0.01 and model 2: OR: 0.72, 95% CI: 0.56 to 0.92, p = 0.01, respectively).

3.4. Tea Consumption and Insulin Resistance

As shown in Table 5, consumption of green tea was associated with an increase in TyG in both unadjusted and multivariable-adjusted models (0.08; 95% CI: 0.03 to 0.13, p = 0.001 and 0.05; 95% CI: 0.01 to 1.00, p = 0.05, respectively). By contrast, consumption of dark tea was associated with a decrease in TyG in both unadjusted and multivariable-adjusted models (−0.20; 95% CI: −0.30 to −0.10, p < 0.001 and −0.23; 95% CI: −0.34 to −0.13, p < 0.001, respectively).

4. Discussion

Our prospective study demonstrated that in Chinese community-dwelling adults with prediabetes, daily consumption of dark tea, while not linked to prediabetes regression, was associated with reduced odds of progressing to diabetes over a 3-year period. Conversely, daily consumption of green tea was not associated with prediabetes progression but was linked to a reduced probability of regressing to normoglycemia. In line with these findings, dark tea consumption was associated with a decrease in insulin resistance, whereas green tea was associated with increased insulin resistance. Subgroup analyses suggested potential sex and ethnic differences, with females and certain ethnic groups appearing to be more responsive to habitual tea consumption. These observations are indicative of distinct glycemic impacts of different teas in prediabetes, and support the need for interventional studies to validate the potential of dark tea for prevention of prediabetes progression and to define the implications of high intake of green tea in this context.
To our knowledge, this study is the first prospective evaluation of the associations between tea consumption and prediabetes progression and regression. The significant association between daily dark tea intake and a reduced likelihood of prediabetes progression aligns with cross-sectional evidence linking habitual dark tea consumption to a lower risk of type 2 diabetes [8,9] and, accordingly, provides further support for interventional studies to validate the potential of dark tea consumption to prevent progression of prediabetes. Although our subgroup analyses were constrained by small and uneven sample sizes, the reduced odds of prediabetes progression appeared to be greater in females and non-Han ethnic subgroups, suggesting that the beneficial impact of dark tea is modified by gender and ethnicity. However, dark tea intake was not associated with prediabetes regression, indicating a limited capacity of dark tea to reverse the metabolic impairments in prediabetes.
In contrast to its widely perceived benefits, daily green tea consumption in our study was not associated with prediabetes progression, but was rather associated with reduced odds of prediabetes regression, suggesting a potentially unfavorable effect of green tea in individuals with prediabetes. This finding contrasts with a Japanese cohort study, in which high green tea intake (> or =6 cups per day) was associated with a reduced incidence in type 2 diabetes [16]. Notably, other cohort studies conducted in Chinese [19] and Iranian [20] adults have reported a positive association between higher green tea consumption and increased risk of type 2 diabetes. Similarly, a cross-sectional study in rural Vietnamese adults found that higher green tea intake was related to increased prevalence of type 2 diabetes [18]. The exact reasons behind these discrepancies are not entirely clear, but may reflect, at least in part, population-specific differences. In support of this concept, our subgroup analysis indicated that the reduction in odds of prediabetes regression among green tea drinkers was more evident in females and Han Chinese. These observations underscore the need for further examination into the effects of green tea intake on glucose metabolism, particularly in individuals with prediabetes. In contrast, black tea consumption appeared to have a neutral association with both prediabetes progression and regression, consistent with findings from prior cohort and cross-sectional studies [8,9,35].
The divergent effects of dark, green, and black teas likely reflect differences in their processing methods and resulting bioactive compound profiles [36]. Indeed, various biological actions of different types of tea have been reported. Notably, dark tea is the only variety that undergoes microbial fermentation, and its microbial metabolites are believed to contribute substantially to its unique biological activities [37]. Dark tea and its bioactive compounds, such as flavonoids, theabrownins, phenolics and polysaccharides, have the capacity to enhance antioxidant enzyme activities and hence exert potent antioxidant activities [37,38,39]. In addition, dark tea polysaccharides have been reported to modulate the balance of beneficial and harmful gut microbiota, thereby influencing gut flora function and metabolite production [40]. Theabrownins extracted from Pu-erh tea, a well-known dark tea, have been observed to lower cholesterol and decrease lipogenesis via effects on gut microbiota and bile acid metabolism [41]. Furthermore, dark tea extracts have been reported to improve insulin sensitivity and glucose tolerance by enhancing insulin signaling pathways [39,42] and reducing peripheral insulin resistance [43]. These findings are consistent with our observation that dark tea consumption was associated with lower TyG levels, a surrogate marker for insulin resistance. In a recent study, habitual consumption of dark tea was also found to be associated with an increase in urinary glucose and sodium excretion [9]. In contrast, green tea has been linked to increased insulin resistance [18,44], which aligns with our finding that green tea consumption was associated with elevated TyG levels. These observations may reflect underlying differences in phytochemical composition and metabolic effects between tea types and warrant further mechanistic investigation.
Several limitations should be recognized in interpreting our findings. First, information on tea consumption was obtained by self-reported questionnaire, which inevitably entails a risk of bias. Second, the duration and quantity of tea consumption were not precisely quantified, preventing evaluation of potential dose- and time-dependent effects. Third, potential variations in tea consumption during the 3-year follow-up were not assessed. Fourth, despite adjustments for multiple covariates, residual confounding from unmeasured factors cannot be ruled out. In particular, the consumption of other beverages, such as milk, coffee, sugar-sweetened beverages (SSBs) and artificial sweetener-sweetened beverages (ASBs), which were commonly consumed, may have influenced our results. For example, coffee intake has been linked to a reduced risk of type 2 diabetes [45,46,47], while both SSBs and ASBs are demonstrably associated with increased diabetes risk [48,49,50,51,52]. Fifth, the sample sizes of the subgroups were relatively small, so that type II errors cannot be excluded. Finally, our findings indicate potential sex and ethnic disparities in the glycemic impact of tea consumption. Accordingly, future studies across different populations are warranted to better delineate the benefits and risks associated with specific types of tea.
In conclusion, among Chinese community-dwelling adults with prediabetes, daily consumption of dark tea was associated with a lower likelihood of progressing to type 2 diabetes, while green tea intake was linked to reduced odds of regressing to normoglycemia. These findings support further exploration of dark tea as a strategy to prevent prediabetes progression and the relevance of limiting green tea consumption in this population.

Supplementary Materials

The following supporting information can be downloaded at: https://www.mdpi.com/article/10.3390/nu17142366/s1, Table S1. Baseline characteristics of participants with different types of tea. Table S2. Subgroup analysis in male and female participants. Table S3. Subgroup analysis in participants with Han and other ethnicity.

Author Contributions

T.L., Z.S., S.Q. and T.W. contributed to the conception and design of the study. T.L., C.X., W.H., S.Q. and T.W. contributed to the acquisition, analysis, and interpretation of data. T.L., C.K.R., M.H., K.J., S.Q. and T.W. contributed to the writing and revising of the manuscript. S.Q. and T.W. contributed to the study supervision and are the guarantors of this work. All authors have read and agreed to the published version of the manuscript.

Funding

This study was supported by the National Key R&D Program of China (grant number 2016YFC1305700). Both C. Xie and W. Huang are supported by an Australian Diabetes Society Skip-Martin Early Career Fellowship. C.K. Rayner is supported by the Michell Bequest Foundation. T. Wu is supported by the Australian Medical Research Future Fund (MRFF: MRFCDDM000009).

Institutional Review Board Statement

The study was conducted in accordance with the Declaration of Helsinki, and approved by the Human Research Ethics Committee of Zhongda Hospital, Southeast University, Nanjing, China (approval number: 2016ZDSYLL092-P01; approval date: 11 January 2017).

Informed Consent Statement

Informed consent was obtained from all subjects involved in the study.

Data Availability Statement

The original contributions presented in the study are included in the article/Supplementary Material, further inquiries can be directed to the corresponding authors.

Conflicts of Interest

The authors declare no conflict of interest.

References

  1. Li, Y.; Teng, D.; Shi, X.; Qin, G.; Qin, Y.; Quan, H.; Shi, B.; Sun, H.; Ba, J.; Chen, B.; et al. Prevalence of diabetes recorded in mainland China using 2018 diagnostic criteria from the American Diabetes Association: National cross sectional study. BMJ 2020, 369, m997. [Google Scholar] [CrossRef] [PubMed]
  2. Wang, L.; Gao, P.; Zhang, M.; Huang, Z.; Zhang, D.; Deng, Q.; Li, Y.; Zhao, Z.; Qin, X.; Jin, D.; et al. Prevalence and Ethnic Pattern of Diabetes and Prediabetes in China in 2013. JAMA 2017, 317, 2515–2523. [Google Scholar] [CrossRef] [PubMed]
  3. Cai, X.; Zhang, Y.; Li, M.; Wu, J.H.; Mai, L.; Li, J.; Yang, Y.; Hu, Y.; Huang, Y. Association between prediabetes and risk of all cause mortality and cardiovascular disease: Updated meta-analysis. BMJ 2020, 370, m2297. [Google Scholar] [CrossRef] [PubMed]
  4. Tian, Y.; Qiu, Z.; Wang, F.; Deng, S.; Wang, Y.; Wang, Z.; Yin, P.; Huo, Y.; Zhou, M.; Liu, G.; et al. Associations of Diabetes and Prediabetes With Mortality and Life Expectancy in China: A National Study. Diabetes Care 2024, 47, 1969–1977. [Google Scholar] [CrossRef] [PubMed]
  5. Liu, X.; Wu, S.; Song, Q.; Wang, X. Reversion From Pre-Diabetes Mellitus to Normoglycemia and Risk of Cardiovascular Disease and All-Cause Mortality in a Chinese Population: A Prospective Cohort Study. J. Am. Heart Assoc. 2021, 10, e019045. [Google Scholar] [CrossRef] [PubMed]
  6. Glechner, A.; Keuchel, L.; Affengruber, L.; Titscher, V.; Sommer, I.; Matyas, N.; Wagner, G.; Kien, C.; Klerings, I.; Gartlehner, G. Effects of lifestyle changes on adults with prediabetes: A systematic review and meta-analysis. Prim. Care Diabetes 2018, 12, 393–408. [Google Scholar] [CrossRef] [PubMed]
  7. Galaviz, K.I.; Weber, M.B.; Suvada, K.B.; Gujral, U.P.; Wei, J.; Merchant, R.; Dharanendra, S.; Haw, J.S.; Narayan, K.M.V.; Ali, M.K. Interventions for Reversing Prediabetes: A Systematic Review and Meta-Analysis. Am. J. Prev. Med. 2022, 62, 614–625. [Google Scholar] [CrossRef] [PubMed]
  8. Chen, Y.; Li, W.; Qiu, S.; Vladmir, C.; Xu, X.; Wang, X.; Nian, X.; Chen, Q.; Wang, Q.; Tu, P.; et al. Tea consumption and risk of diabetes in the Chinese population: A multi-centre, cross-sectional study. Br. J. Nutr. 2020, 123, 428–436. [Google Scholar] [CrossRef] [PubMed]
  9. Li, T.; Sang, M.; Wang, J.; Sun, Z.; Wang, D.; Xie, C.; Huang, W.; Rayner, C.K.; Horowitz, M.; Qiu, S.; et al. Dark tea consumption is associated with a reduced risk of dysglycaemia and increased urinary glucose and sodium excretion in Chinese adults. Diabetes Obes. Metab. 2024, 26, 4705–4712. [Google Scholar] [CrossRef] [PubMed]
  10. Odegaard, A.O.; Pereira, M.A.; Koh, W.P.; Arakawa, K.; Lee, H.P.; Yu, M.C. Coffee, tea, and incident type 2 diabetes: The Singapore Chinese Health Study. Am. J. Clin. Nutr. 2008, 88, 979–985. [Google Scholar] [CrossRef] [PubMed]
  11. Hayashino, Y.; Fukuhara, S.; Okamura, T.; Tanaka, T.; Ueshima, H.; Group, H.-O.R. High oolong tea consumption predicts future risk of diabetes among Japanese male workers: A prospective cohort study. Diabet. Med. 2011, 28, 805–810. [Google Scholar] [CrossRef] [PubMed]
  12. Xu, L.; Xia, G.; Luo, Z.; Liu, S. UHPLC analysis of major functional components in six types of Chinese teas: Constituent profile and origin consideration. LWT 2019, 102, 52–57. [Google Scholar] [CrossRef]
  13. Feng, Z.; Li, Y.; Li, M.; Wang, Y.; Zhang, L.; Wan, X.; Yang, X. Tea aroma formation from six model manufacturing processes. Food Chem. 2019, 285, 347–354. [Google Scholar] [CrossRef] [PubMed]
  14. Randisi, F.; Perletti, G.; Marras, E.; Gariboldi, M.B. Green Tea Components: In Vitro and In Vivo Evidence for Their Anticancer Potential in Colon Cancer. Cancers 2025, 17, 623. [Google Scholar] [CrossRef] [PubMed]
  15. Tenore, G.C.; Daglia, M.; Ciampaglia, R.; Novellino, E. Exploring the nutraceutical potential of polyphenols from black, green and white tea infusions—An overview. Curr. Pharm. Biotechnol. 2015, 16, 265–271. [Google Scholar] [CrossRef] [PubMed]
  16. Iso, H.; Date, C.; Wakai, K.; Fukui, M.; Tamakoshi, A.; Group, J.S. The relationship between green tea and total caffeine intake and risk for self-reported type 2 diabetes among Japanese adults. Ann. Intern. Med. 2006, 144, 554–562. [Google Scholar] [CrossRef] [PubMed]
  17. Nie, J.; Yu, C.; Guo, Y.; Pei, P.; Chen, L.; Pang, Y.; Du, H.; Yang, L.; Chen, Y.; Yan, S.; et al. Tea consumption and long-term risk of type 2 diabetes and diabetic complications: A cohort study of 0.5 million Chinese adults. Am. J. Clin. Nutr. 2021, 114, 194–202. [Google Scholar] [CrossRef] [PubMed]
  18. Fukunaga, A.; Jimba, M.; Pham, T.T.P.; Nguyen, C.Q.; Hoang, D.V.; Phan, T.V.; Yazawa, A.; Phan, D.C.; Hachiya, M.; Le, H.X.; et al. Association of green tea consumption with prediabetes, diabetes and markers of glucose metabolism in rural Vietnam: A cross-sectional study. Br. J. Nutr. 2024, 131, 1883–1891. [Google Scholar] [CrossRef] [PubMed]
  19. Liu, X.; Xu, W.; Cai, H.; Gao, Y.T.; Li, H.; Ji, B.T.; Shu, X.; Wang, T.; Gerszten, R.E.; Zheng, W.; et al. Green tea consumption and risk of type 2 diabetes in Chinese adults: The Shanghai Women’s Health Study and the Shanghai Men’s Health Study. Int. J. Epidemiol. 2018, 47, 1887–1896. [Google Scholar] [CrossRef] [PubMed]
  20. Malaga, G.; Golozar, A.; Khademi, H.; Kamangar, F.; Poutschi, H.; Islami, F.; Abnet, C.C.; Freedman, N.D.; Taylor, P.R.; Pharoah, P.; et al. Diabetes Mellitus and Its Correlates in an Iranian Adult Population. PLoS ONE 2011, 6, e26725. [Google Scholar] [CrossRef]
  21. Wang, Y.; Kan, Z.; Thompson, H.J.; Ling, T.; Ho, C.T.; Li, D.; Wan, X. Impact of Six Typical Processing Methods on the Chemical Composition of Tea Leaves Using a Single Camellia sinensis Cultivar, Longjing 43. J. Agric. Food Chem. 2019, 67, 5423–5436. [Google Scholar] [CrossRef] [PubMed]
  22. Wang, W.; Le, T.; Wang, W.; Yu, L.; Yang, L.; Jiang, H. Effects of Key Components on the Antioxidant Activity of Black Tea. Foods 2023, 12, 3134. [Google Scholar] [CrossRef] [PubMed]
  23. Zhu, M.Z.; Li, N.; Zhou, F.; Ouyang, J.; Lu, D.M.; Xu, W.; Li, J.; Lin, H.Y.; Zhang, Z.; Xiao, J.B.; et al. Microbial bioconversion of the chemical components in dark tea. Food Chem. 2020, 312, 126043. [Google Scholar] [CrossRef] [PubMed]
  24. Pan, H.; Le, M.; He, C.; Yang, C.S.; Ling, T. Dark tea: A popular beverage with possible medicinal application. Chin. Herb. Med. 2023, 15, 33–36. [Google Scholar] [CrossRef] [PubMed]
  25. Yang, J.; Mao, Q.X.; Xu, H.X.; Ma, X.; Zeng, C.Y. Tea consumption and risk of type 2 diabetes mellitus: A systematic review and meta-analysis update. BMJ Open 2014, 4, e005632. [Google Scholar] [CrossRef] [PubMed]
  26. InterAct, C.; van Woudenbergh, G.J.; Kuijsten, A.; Drogan, D.; van der, A.D.; Romaguera, D.; Ardanaz, E.; Amiano, P.; Barricarte, A.; Beulens, J.W.; et al. Tea consumption and incidence of type 2 diabetes in Europe: The EPIC-InterAct case-cohort study. PLoS ONE 2012, 7, e36910. [Google Scholar] [CrossRef]
  27. Li, W.; Xie, B.; Qiu, S.; Huang, X.; Chen, J.; Wang, X.; Li, H.; Chen, Q.; Wang, Q.; Tu, P.; et al. Non-lab and semi-lab algorithms for screening undiagnosed diabetes: A cross-sectional study. EBioMedicine 2018, 35, 307–316. [Google Scholar] [CrossRef] [PubMed]
  28. Sang, M.; Xie, C.; Qiu, S.; Wang, X.; Horowitz, M.; Jones, K.L.; Rayner, C.K.; Sun, Z.; Wu, T. Cholecystectomy is associated with dysglycaemia: Cross-sectional and prospective analyses. Diabetes Obes. Metab. 2022, 24, 1656–1660. [Google Scholar] [CrossRef] [PubMed]
  29. Liu, Y.; Sang, M.; Yuan, Y.; Du, Z.; Li, W.; Hu, H.; Wen, L.; Wang, F.; Guo, H.; Wang, B.; et al. Novel clusters of newly-diagnosed type 2 diabetes and their association with diabetic retinopathy: A 3-year follow-up study. Acta Diabetol. 2022, 59, 827–835. [Google Scholar] [CrossRef] [PubMed]
  30. Vasques, A.C.; Novaes, F.S.; de Oliveira Mda, S.; Souza, J.R.; Yamanaka, A.; Pareja, J.C.; Tambascia, M.A.; Saad, M.J.; Geloneze, B. TyG index performs better than HOMA in a Brazilian population: A hyperglycemic clamp validated study. Diabetes Res. Clin. Pract. 2011, 93, e98–e100. [Google Scholar] [CrossRef] [PubMed]
  31. Sanchez-Garcia, A.; Rodriguez-Gutierrez, R.; Mancillas-Adame, L.; Gonzalez-Nava, V.; Diaz Gonzalez-Colmenero, A.; Solis, R.C.; Alvarez-Villalobos, N.A.; Gonzalez-Gonzalez, J.G. Diagnostic Accuracy of the Triglyceride and Glucose Index for Insulin Resistance: A Systematic Review. Int. J. Endocrinol. 2020, 2020, 4678526. [Google Scholar] [CrossRef] [PubMed]
  32. Inker, L.A.; Eneanya, N.D.; Coresh, J.; Tighiouart, H.; Wang, D.; Sang, Y.; Crews, D.C.; Doria, A.; Estrella, M.M.; Froissart, M.; et al. New Creatinine- and Cystatin C-Based Equations to Estimate GFR without Race. N. Engl. J. Med. 2021, 385, 1737–1749. [Google Scholar] [CrossRef] [PubMed]
  33. American Diabetes, A. 2. Classification and Diagnosis of Diabetes: Standards of Medical Care in Diabetes-2021. Diabetes Care 2021, 44, S15–S33. [Google Scholar] [CrossRef] [PubMed]
  34. Miles, J. Tolerance and Variance Inflation Factor. In Encyclopedia of Statistics in Behavioral Science; Wiley: Hoboken, NJ, USA, 2005. [Google Scholar] [CrossRef]
  35. Mackenzie, T.; Leary, L.; Brooks, W.B. The effect of an extract of green and black tea on glucose control in adults with type 2 diabetes mellitus: Double-blind randomized study. Metabolism 2007, 56, 1340–1344. [Google Scholar] [CrossRef] [PubMed]
  36. Luo, Q.; Luo, L.; Zhao, J.; Wang, Y.; Luo, H. Biological potential and mechanisms of Tea’s bioactive compounds: An Updated review. J. Adv. Res. 2024, 65, 345–363. [Google Scholar] [CrossRef] [PubMed]
  37. Cheng, L.; Wei, Y.; Peng, L.; Wei, K.; Liu, Z.; Wei, X. State-of-the-art review of theabrownins: From preparation, structural characterization to health-promoting benefits. Crit. Rev. Food Sci. Nutr. 2024, 64, 11321–11340. [Google Scholar] [CrossRef] [PubMed]
  38. Xu, X.; Hu, W.; Zhou, S.; Tu, C.; Xia, X.; Zhang, J.; Dong, M. Increased Phenolic Content and Enhanced Antioxidant Activity in Fermented Glutinous Rice Supplemented with Fu Brick Tea. Molecules 2019, 24, 671. [Google Scholar] [CrossRef] [PubMed]
  39. Gao, W.; Xiao, C.; Hu, J.; Chen, B.; Wang, C.; Cui, B.; Deng, P.; Yang, J.; Deng, Z. Qing brick tea (QBT) aqueous extract protects monosodium glutamate-induced obese mice against metabolic syndrome and involves up-regulation Transcription Factor Nuclear Factor-Erythroid 2-Related Factor 2 (Nrf2) antioxidant pathway. Biomed. Pharmacother. 2018, 103, 637–644. [Google Scholar] [CrossRef] [PubMed]
  40. Bond, T.; Derbyshire, E. Tea Compounds and the Gut Microbiome: Findings from Trials and Mechanistic Studies. Nutrients 2019, 11, 2364. [Google Scholar] [CrossRef] [PubMed]
  41. Huang, F.; Zheng, X.; Ma, X.; Jiang, R.; Zhou, W.; Zhou, S.; Zhang, Y.; Lei, S.; Wang, S.; Kuang, J.; et al. Theabrownin from Pu-erh tea attenuates hypercholesterolemia via modulation of gut microbiota and bile acid metabolism. Nat. Commun. 2019, 10, 4971. [Google Scholar] [CrossRef] [PubMed]
  42. Du, H.; Wang, Q.; Yang, X. Fu Brick Tea Alleviates Chronic Kidney Disease of Rats with High Fat Diet Consumption through Attenuating Insulin Resistance in Skeletal Muscle. J. Agric. Food Chem. 2019, 67, 2839–2847. [Google Scholar] [CrossRef] [PubMed]
  43. Cai, X.; Hayashi, S.; Fang, C.; Hao, S.; Wang, X.; Nishiguchi, S.; Tsutsui, H.; Sheng, J. Pu’erh tea extract-mediated protection against hepatosteatosis and insulin resistance in mice with diet-induced obesity is associated with the induction of de novo lipogenesis in visceral adipose tissue. J. Gastroenterol. 2017, 52, 1240–1251. [Google Scholar] [CrossRef] [PubMed]
  44. Pham, N.M.; Nanri, A.; Kochi, T.; Kuwahara, K.; Tsuruoka, H.; Kurotani, K.; Akter, S.; Kabe, I.; Sato, M.; Hayabuchi, H.; et al. Coffee and green tea consumption is associated with insulin resistance in Japanese adults. Metabolism 2014, 63, 400–408. [Google Scholar] [CrossRef] [PubMed]
  45. Ding, M.; Bhupathiraju, S.N.; Chen, M.; van Dam, R.M.; Hu, F.B. Caffeinated and decaffeinated coffee consumption and risk of type 2 diabetes: A systematic review and a dose-response meta-analysis. Diabetes Care 2014, 37, 569–586. [Google Scholar] [CrossRef] [PubMed]
  46. van Dam, R.M.; Willett, W.C.; Manson, J.E.; Hu, F.B. Coffee, caffeine, and risk of type 2 diabetes: A prospective cohort study in younger and middle-aged U.S. women. Diabetes Care 2006, 29, 398–403. [Google Scholar] [CrossRef] [PubMed]
  47. Bae, J.M. Coffee consumption and risk of type 2 diabetes mellitus in Asians: A meta-epidemiological study of population-based cohort studies. World J. Diabetes 2021, 12, 908–915. [Google Scholar] [CrossRef] [PubMed]
  48. Kabthymer, R.H.; Wu, T.; Beigrezaei, S.; Franco, O.H.; Hodge, A.M.; de Courten, B. The association of sweetened beverage intake with risk of type 2 diabetes in an Australian population: A longitudinal study. Diabetes Metab. 2025, 101665, in press. [Google Scholar] [CrossRef] [PubMed]
  49. Rios-Leyvraz, M.; Montez, J.; World Health Organization. Health Effects of the Use of Non-Sugar Sweeteners: A Systematic Review and Meta-Analysis; WHO: Geneva, Switzerland, 2022. [Google Scholar]
  50. Fagherazzi, G.; Vilier, A.; Saes Sartorelli, D.; Lajous, M.; Balkau, B.; Clavel-Chapelon, F. Consumption of artificially and sugar-sweetened beverages and incident type 2 diabetes in the Etude Epidemiologique aupres des femmes de la Mutuelle Generale de l’Education Nationale-European Prospective Investigation into Cancer and Nutrition cohort. Am. J. Clin. Nutr. 2013, 97, 517–523. [Google Scholar] [CrossRef] [PubMed]
  51. Malik, V.S.; Popkin, B.M.; Bray, G.A.; Despres, J.P.; Hu, F.B. Sugar-sweetened beverages, obesity, type 2 diabetes mellitus, and cardiovascular disease risk. Circulation 2010, 121, 1356–1364. [Google Scholar] [CrossRef] [PubMed]
  52. Ramne, S.; Drake, I.; Ericson, U.; Nilsson, J.; Orho-Melander, M.; Engstrom, G.; Sonestedt, E. Identification of Inflammatory and Disease-Associated Plasma Proteins that Associate with Intake of Added Sugar and Sugar-Sweetened Beverages and Their Role in Type 2 Diabetes Risk. Nutrients 2020, 12, 3129. [Google Scholar] [CrossRef] [PubMed]
Figure 1. Study flow chart.
Nutrients 17 02366 g001
Table 1. Differences between green, black and dark tea.
Tea TypeProcessing MethodKey StepsMajor Composition Differences
Green teaUnfermented/unoxidizedSteaming or pan-firing to inactivate enzymes
Rolling
Drying
High catechin content (especially EGCG)
Low theaflavins and thearubigins
Retains more polyphenols and vitamin C
Black teaFermented/oxidizedWithering
Rolling
Oxidation
Drying
High in theaflavins and thearubigins
(from catechin oxidation)
Lower catechin levels
Darker color and stronger flavor
Dark teaPost-fermentedMicrobial fermentation
Aging
Drying
High theabrownins and microbial metabolites
Very low catechin levels
Rich in polysaccharides and unique bioactive compounds
Table 2. Baseline characteristics of participants with prediabetes, who regressed to normoglycemia, remained as prediabetes and progressed to diabetes.
Regression to
Normoglycemia
(N = 716)
Remained as
Prediabetes
(N = 1647)
Progression to
Diabetes
(N = 299)
poverall
Gender <0.001
     Male (%)248 (34.6%)570 (34.6%)138 (46.2%)
     Female (%)468(65.4%)1077 (65.4%)161 (53.8%)
Age (y)51.9 ± 9.1 ***54.3 ± 8.255.0 ± 8.4<0.001
BMI (kg/m2)25.1 ± 4.0 **25.8 ± 4.426.1 ± 4.5<0.001
WC (cm)84.3 ± 9.4 *85.5 ± 10.381.1 ± 10.8 ***<0.001
SBP (mmHg)136.8 ± 19.8 ***137.1 ± 19.3144.6 ± 20.4 ***<0.001
DBP (mmHg)82.6 ± 11.783.2 ± 11.486.6 ± 11.4 ***<0.001
FPG (mmol/L)5.7 ± 0.4 ***5.8 ± 0.56.1 ± 0.5 ***<0.001
2hPG (mmol/L)6.8 ± 1.5 ***7.3 ± 1.68.3 ± 1.9 ***<0.001
HbA1c (%)5.3 ± 0.4 ***5.5 ± 0.45.7± 0.4 ***<0.001
TC (mmo/L)4.9 ± 1.0 ***5.1 ± 1.05.0 ± 1.0<0.001
TG (mmo/L)1.6 ± 1.5 *1.8 ± 1.92.2 ± 2.8 **<0.001
HDL-C (mmo/L)1.6 ± 0.4 *1.5 ± 0.41.5 ± 0.4<0.001
LDL-C (mmo/L)2.7 ± 0.7 ***2.8 ± 0.82.8 ± 0.8<0.001
eGFR (mL/min/1.73 m2)99.2 ± 15.197.9 ± 13.797.7 ± 15.20.11
Ethnicity, n (%) <0.001
     Han595 (83.1%)1311 (79.6%)271(90.6%)
     Other121 (16.9%)336 (20.4%)28 (9.4%)
Vegetable consumption, n (%) 0.85
     Minimal3 (0.4%)5 (0.3%)2 (0.7%)
     Low32 (4.5%)77 (4.7%)12 (4.0%)
     Moderate408 (57.0%)898 (54.5%)162 (54.2%)
     High273 (38.1%)667 (40.5%)123 (41.1%)
Fruit consumption, n (%) 0.26
     Minimal20 (2.8%)56 (3.4%)12 (4.0%)
     Low329 (45.9%)721 (43.8%)133 (44.5%)
     Moderate339 (47.3%)774 (47.0%)145 (48.5%)
     High28 (3.9%)95 (5.8%)9 (3.0%)
Low-salt and low-fat diet, n (%)224 (31.3%)491 (29.8%)94 (31.4%)0.71
Regular exercise, n (%)203 (28.4%) ***512 (31.1%)76 (25.4%)0.09
Hypotensive medication, n (%)135 (18.9%) ***437 (26.5%)119 (39.8%) ***<0.001
Family history of diabetes, n (%)110 (15.4%)289 (17.5%)59 (19.7%)0.20
Current smoker, n (%)116 (16.2%)273 (16.6%)77 (25.8%) ***<0.001
Habitual alcohol drinker, n (%)148 (20.7%) **365 (22.2%)79 (26.4%)0.13
Abbreviations: BMI: body mass index; WC: waist circumference; SBP: systolic blood pressure; DBP: diastolic blood pressure; FPG: fasting plasma glucose; HbA1c: hemoglobin A1c; TC: total cholesterol; TG: triglyceride; LDL-C: low-density lipoprotein cholesterol; HDL-C: high-density lipoprotein cholesterol; eGFR: estimated glomerular filtration rate. Data are presented as means ± standard deviations or numbers (%), where appropriate. One-way analysis of variance was used for comparisons of continuous variables, while the χ2 test was used for comparison of categorical variables. Post hoc comparisons were adjusted using Bonferroni’s correction. * p < 0.05 and ** p < 0.01, *** p < 0.001, compared to participants with prediabetes.
Table 3. Tea consumption and odds of prediabetes progression and regression.
N, Cases/TotalModel 1Model 2
OR (95% CI)pOR (95% CI)p
Progression to Diabetes
Type of Tea
     No tea126/11981.00 (Ref.) 1.00 (Ref.)
     Green tea141/10161.27 (0.97, 1.65)0.081.10 (0.83, 1.47)0.50
     Black tea9/1380.59 (0.29, 1.20)0.150.61 (0.29, 1.27)0.19
     Dark tea5/1400.30 (0.12, 0.75)0.010.28 (0.11, 0.72)0.01
     Other18/1701.13 (0.66, 1.94)0.661.03 (0.59, 1.80)0.92
Regression to Normoglycemia
Type of Tea
     No tea344/11981.00 (Ref.) 1.00 (Ref.)
     Green tea232/10160.76 (0.63, 0.93)0.010.73 (0.59, 0.90)0.01
     Black tea41/1380.99 (0.67, 1.46)0.940.98 (0.65, 1.48)0.92
     Dark tea39/1400.86(0.58, 1.27)0.450.81 (0.53, 1.24)0.34
     Other60/1701.38 (0.97, 1.96)0.071.19 (0.82, 1.71)0.36
Multinominal logistic regression analysis was employed to assess the associations of tea consumption with prediabetes progression and prediabetes regression. Model 1: The crude model. Model 2: Adjusted for age, sex, body mass index, mean arterial pressure, triglyceride, high-density lipoprotein-cholesterol, low-density lipoprotein-cholesterol, estimated glomerular filtration rate, low-salt low-fat diet, regular exercise, hypotensive medication, family history of diabetes, current smoking status, current alcohol consumption, vegetable consumption, and fruit consumption.
Table 4. Frequencies of different tea consumption and prediabetes progression and regression.
N, Cases/TotalModel 1Model 2
OR (95% CI)pOR (95% CI)p
Progression to Diabetes
Frequency of Green Tea Consumption
     Never158/16461.00 1.00
     Sometimes58/4731.21 (0.87, 1.68)0.251.17 (0.83, 1.63)0.37
     Daily83/5431.56 (1.16, 2.09)0.0031.27 (0.92, 1.76)0.14
Frequency of Dark Tea Consumption
     Never294/25221.00 1.00
     Sometimes2/310.42 (0.10, 1.79)0.240.49 (0.11, 2.15)0.35
     Daily3/1090.22 (0.07, 0.71)0.010.22 (0.07, 0.71)0.01
Regression to Normoglycemia
Frequency of Green Tea Consumption
     Never484/16461.00 1.00
     Sometimes111/4730.76 (0.59, 0.97)0.030.74 (0.58, 0.95)0.02
     Daily121/5430.74 (0.59, 0.94)0.010.72 (0.56, 0.92)0.01
Frequency of Dark Tea Consumption
     Never677/25221.00 1.00
     Sometimes4/310.37 (0.13, 1.06)0.060.31 (0.10, 0.91)0.03
     Daily35/1091.13 (0.75, 1.71)0.571.14 (0.73, 1.78)0.58
Multinominal logistic regression analysis was employed to assess the associations of tea consumption with prediabetes progression and prediabetes regression. Model 1: The crude model. Model 2: Adjusted for age, sex, body mass index, mean arterial pressure, triglyceride, high-density lipoprotein-cholesterol, low-density lipoprotein-cholesterol, estimated glomerular filtration rate, low-salt low-fat diet, regular exercise, Hypotensive medication, family history of diabetes, current smoking status, current alcohol consumption, vegetable consumption, and fruit consumption.
Table 5. Association of tea consumption insulin resistance.
TyG
Model 1Model 2
Mean (95% CI)pMean (95% CI)p
Type of Tea
No tea0.00 (Ref.) 0.00 (Ref.)
Green tea0.08 (0.03, 0.13)0.0010.05 (0.01, 1.00)0.05
Black tea−0.04 (−0.14, 0.06)0.43−0.06 (−0.17, 0.04)0.21
Dark tea−0.20 (−0.30, −0.10)<0.001−0.23 (−0.34, −0.13)<0.001
Other0.08 (−0.14, 0.17)0.100.05 (−0.04, 0.15)0.25
Linear regression analysis was employed to assess the associations of tea consumption with insulin resistance. Model 1: The crude model. Model 2: Adjusted for age, sex, body mass index, mean arterial pressure, estimated glomerular filtration rate, low salt low-fat diet, regular exercise, antihypertensive medication, family history of diabetes, current smoking status, current alcohol consumption, vegetable consumption, and fruit consumption.
Disclaimer/Publisher’s Note: The statements, opinions and data contained in all publications are solely those of the individual author(s) and contributor(s) and not of MDPI and/or the editor(s). MDPI and/or the editor(s) disclaim responsibility for any injury to people or property resulting from any ideas, methods, instructions or products referred to in the content.

