
Effects of a Balanced Diet and Probiotics on Blood Biomarkers and Gut Microbiota in the Elderly: A Community-Based Intervention Study
 , , ,
, , , 
Abstract
1. Introduction
2. Materials and Methods
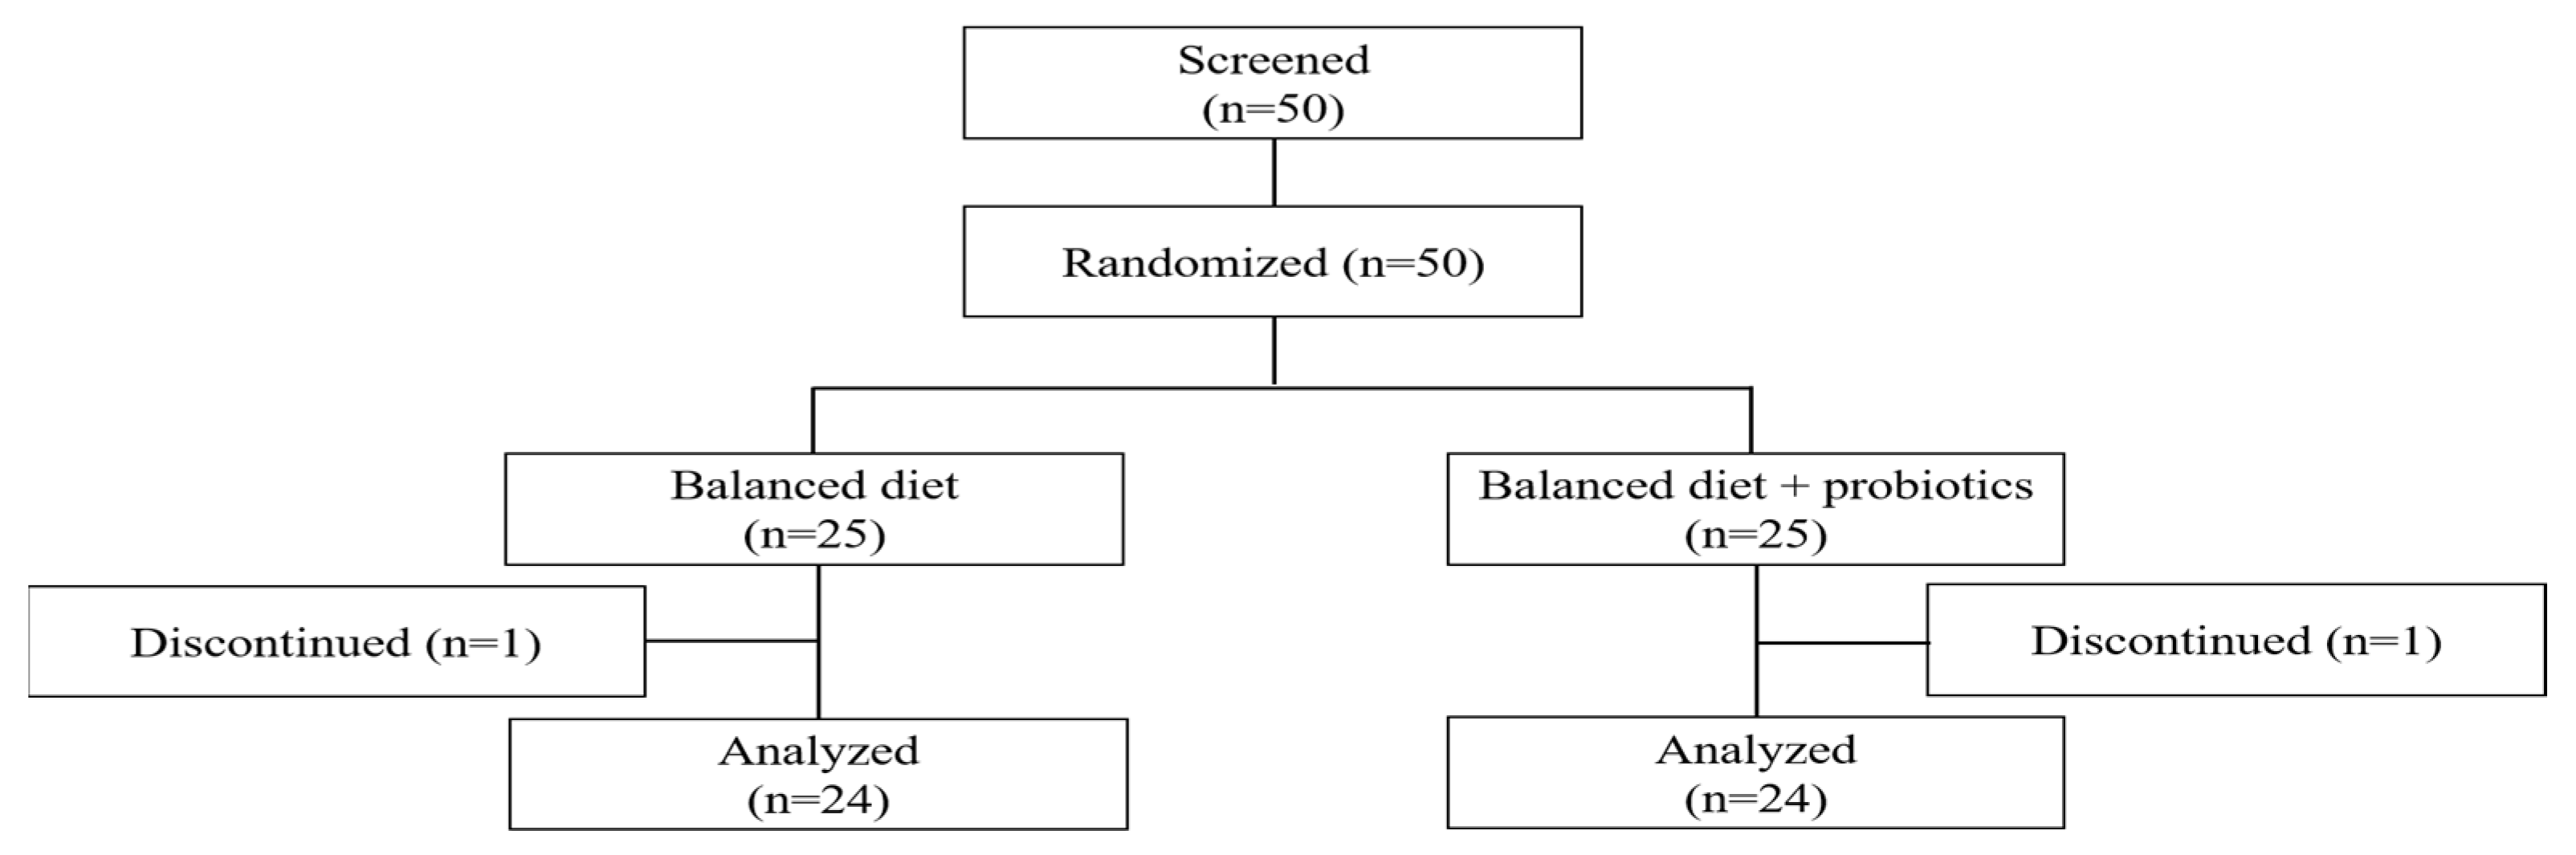
2.1. Participants
2.2. Study Design and Intervention
2.3. Anthropometric Measures and General Characteristics
2.4. Primary Outcomes
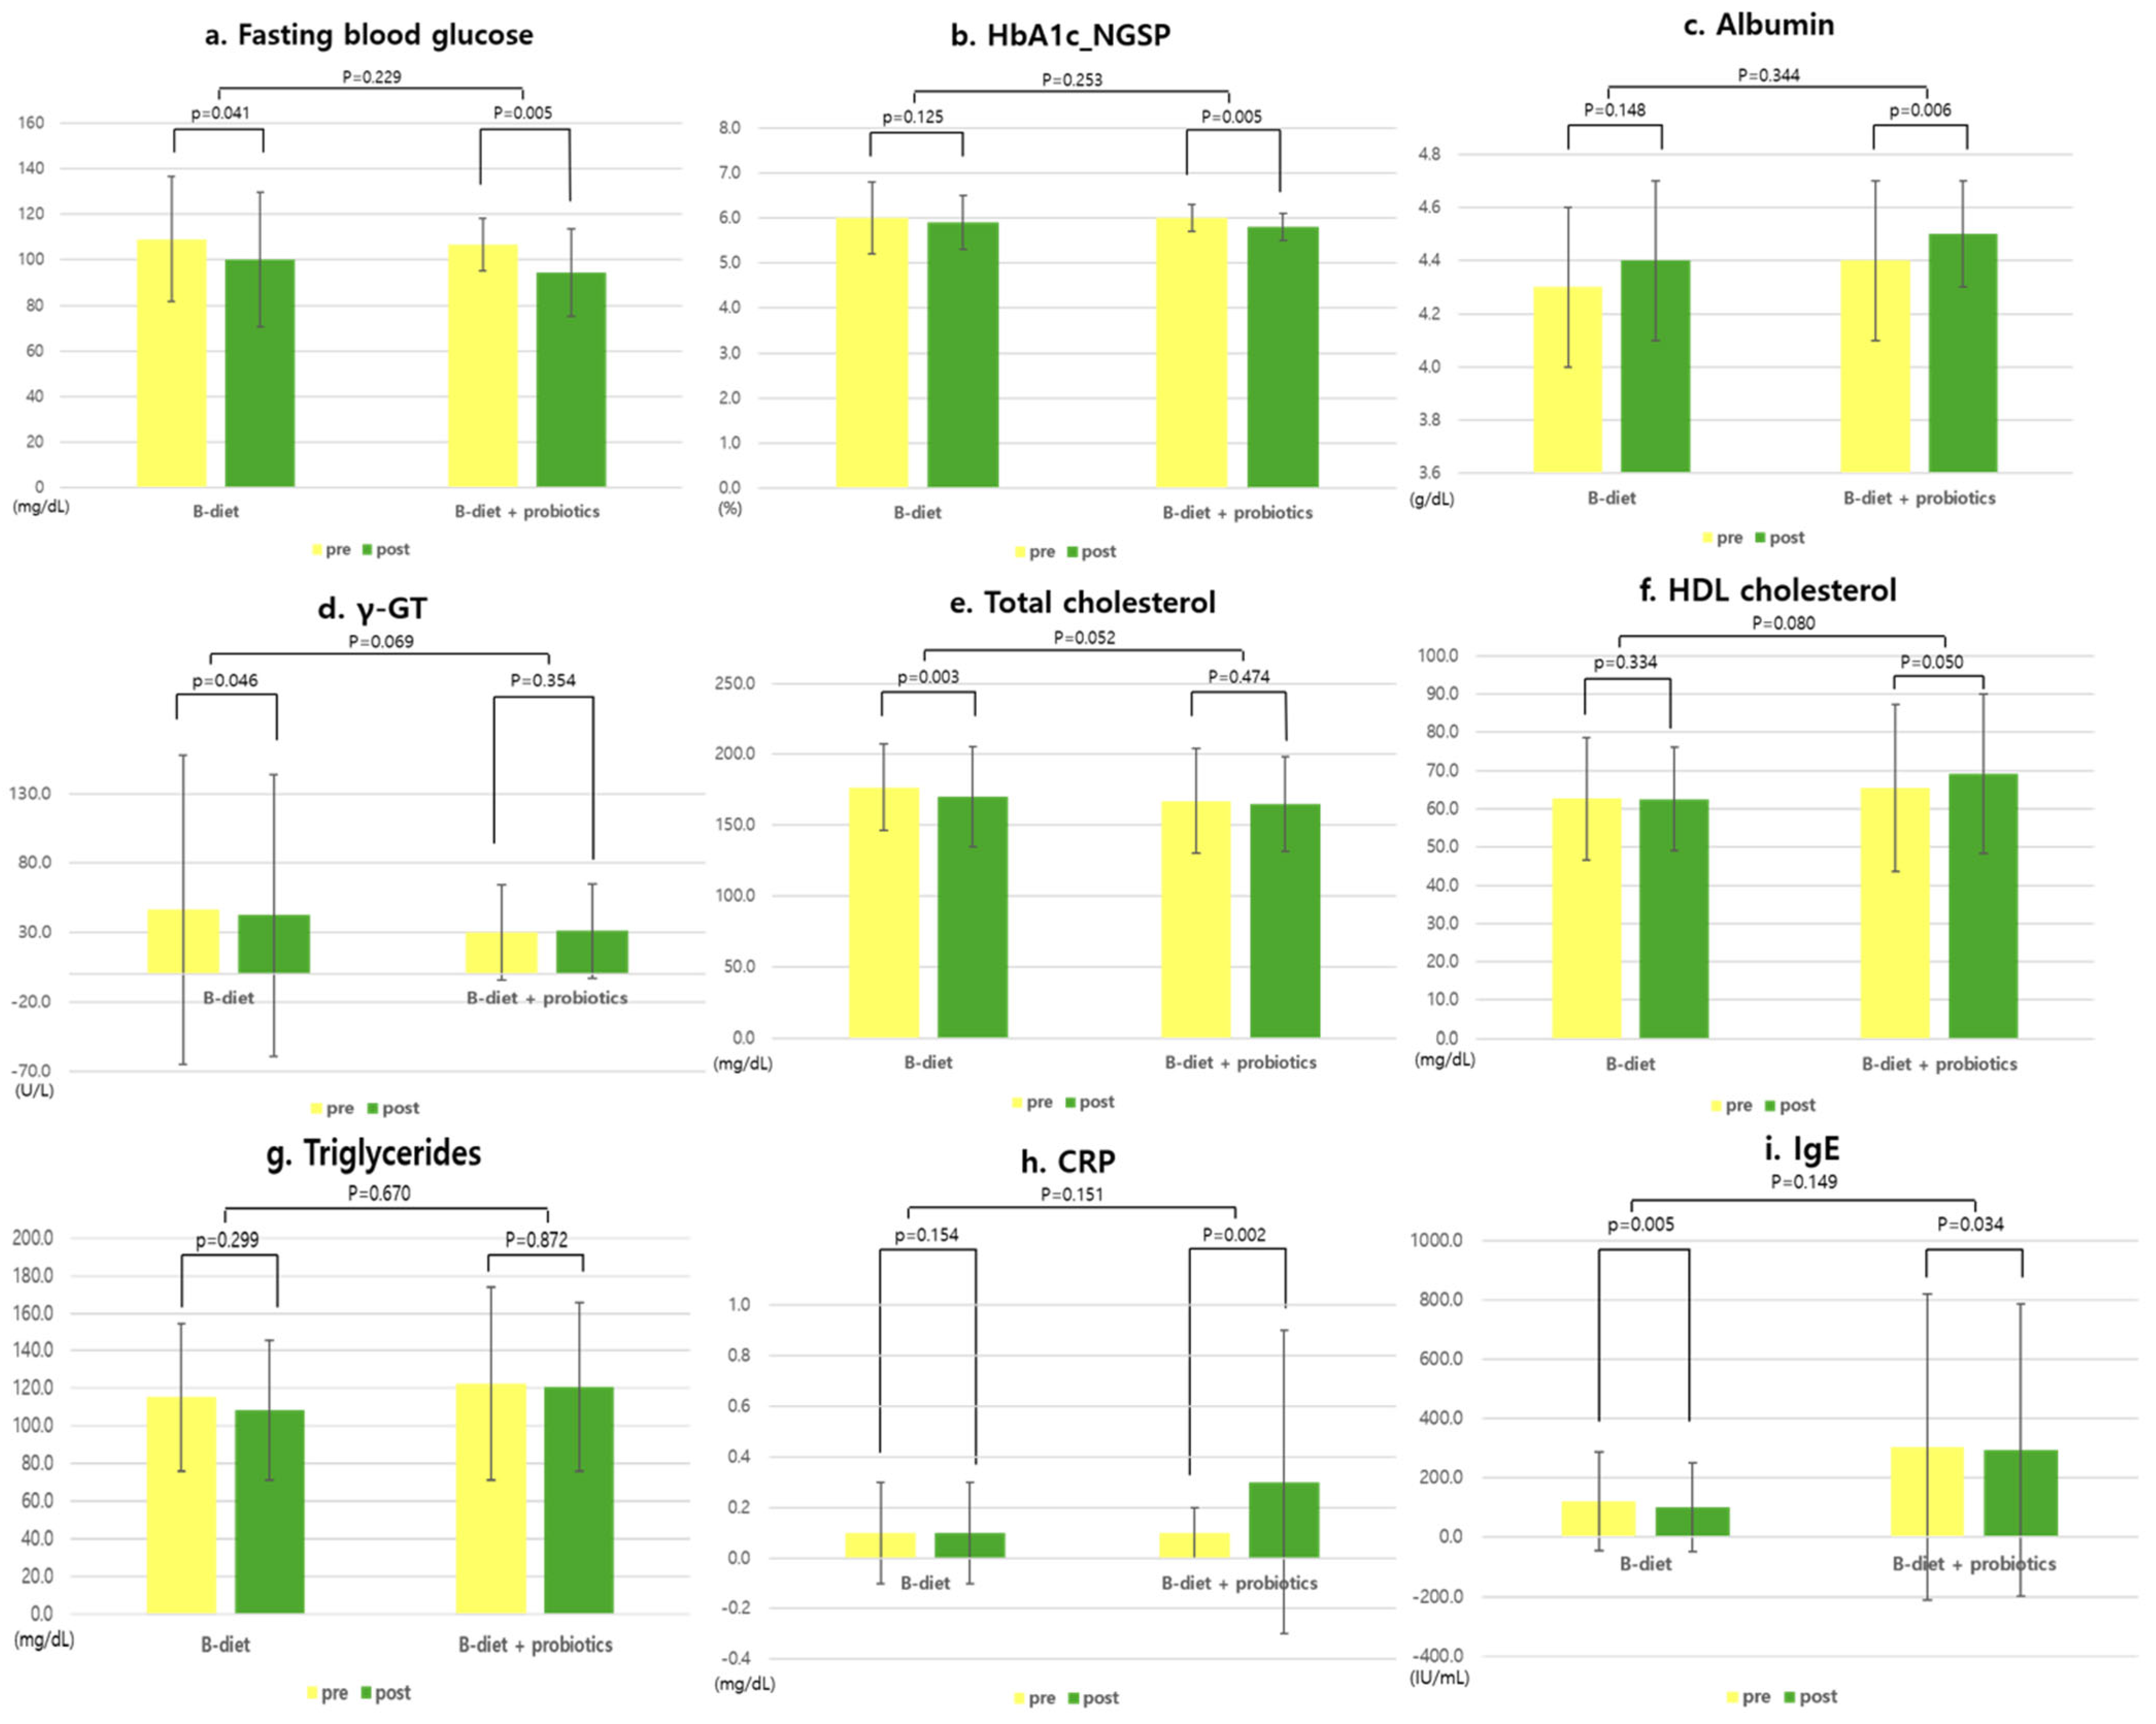
2.4.1. Blood Markers of Nutritional Status and Inflammation
2.4.2. Gut Microbiota
- DNA Extraction: For DNA extraction, fecal samples in Clinical Virus Transport Medium (Noble Bio Co., Ltd., Seongnam-si, Republic of Korea), 0.1 mm and 0.5 mm glass beads are added. Following agitation, the samples are centrifuged. The supernatant, which is mixed with isopropanol, is applied to a DNA binding column (Bioneer Corporation, Daejeon, Republic of Korea) and centrifuged. Impurities, excluding DNA, were removed using 70% ethanol washing, and pure DNA was extracted using either preheated 65 °C ultrapure water or an extraction buffer.
- DNA QuantificationSpectrophotometric Assessment: To assess the purity of the extracted DNA, absorbance measurements were taken at 260 nm, 280 nm, and 230 nm using a NanoDrop spectrophotometer. The A260/A280 ratio was used to estimate protein contamination, with values around 1.8 indicating relatively pure DNA. The A260/A230 ratio was used to evaluate contamination from organic compounds (e.g., phenol, EDTA), with ideal values typically ranging from 2.0 to 2.2. These ratios provided a qualitative measure of DNA purity and were used to screen samples prior to downstream applications.Fluorometric Quantification: DNA concentration was determined using the Quant-iTTM PicoGreen® dsDNA Reagent and Kit (Thermo Fisher Scientific, Waltham, MA, USA), which specifically binds to double-stranded DNA. Unlike spectrophotometric methods, PicoGreen is highly sensitive and selective for dsDNA, minimizing interference from RNA or free nucleotides. Fluorescence was measured at excitation/emission wavelengths of approximately 480/520 nm using a microplate reader. DNA concentrations were calculated by interpolating the sample fluorescence values against a standard curve generated from serial dilutions of a DNA standard provided in the kit. This dual approach ensured that only high-quality DNA samples were used for downstream microbiome analyses.
- PCR AmpliconPolymerase Chain Reaction (PCR): PCR was performed using a quantified QC value as a reference. PCR is conducted with an input of greater than 1 ng of DNA, using BX-Taq DNA polymerase (NICSROgeneTM, Jeonju, Republic of Korea) with a barcode primer set previously designed by the study [11]. The thermal cycling conditions consisted of an initial denaturation at 98 °C for 2 minutes, followed by 30 cycles of 98 °C for 2 min, 50 °C for 30 s, and 72 °C for 150 s, with a final hold at 4 °C. Gel Electrophoresis and Purification: The resulting PCR amplicons were examined for successful generation (4.2 kb) through gel electrophoresis. Magnetic HM SPRI beads (0.45×) are used for bead selection post-PCR. Magnetic purification and 70% ethanol washing were utilized to remove impurities, excluding the amplified PCR amplicons. Pure PCR products were then extracted using preheated ultrapure water or extraction buffer.DNA Concentration Adjustment: The final concentration of PCR amplicons was determined using the PicoGreen dsDNA Reagent and Kit, and each sample’s concentration was adjusted to 1000 ng per sample.
- Pooling and Sequencing: Each PCR amplicon was pooled and processed according to the ligation sequencing amplicon protocol provided by Oxford Nanopore Technology (Oxford, UK, SQK-LSK114, ACDE_9163_v114_revL_29Jun2022). The protocol included end repair, adaptor ligation, clean-up, and loading into flow cells. The third-generation sequencing platform Nanopore was employed to sequence the 16S-ITS-23S operon (rRNA operon).
- Microbiome Classification and Analysis: Microbiome classification and analysis were conducted using the MIrROR database (http://mirror.egnome.co.kr/) [11] and its associated bioinformatics pipeline, specifically optimized for fecal samples. DNA was amplified using universal rRNA primers, generating a 4.2 kb amplicon to analyze the microbiome composition. To minimize sequencing errors, a custom filtering script was developed to remove false-positive species based on mapping results against reference sequences in the MIrROR database. Filtering criteria included the following:Minimum residue-match value, which assesses the similarity between sequencing reads and reference sequences.Minimum block-length value, which ensures that a certain length of the read matches the reference sequence consecutively.
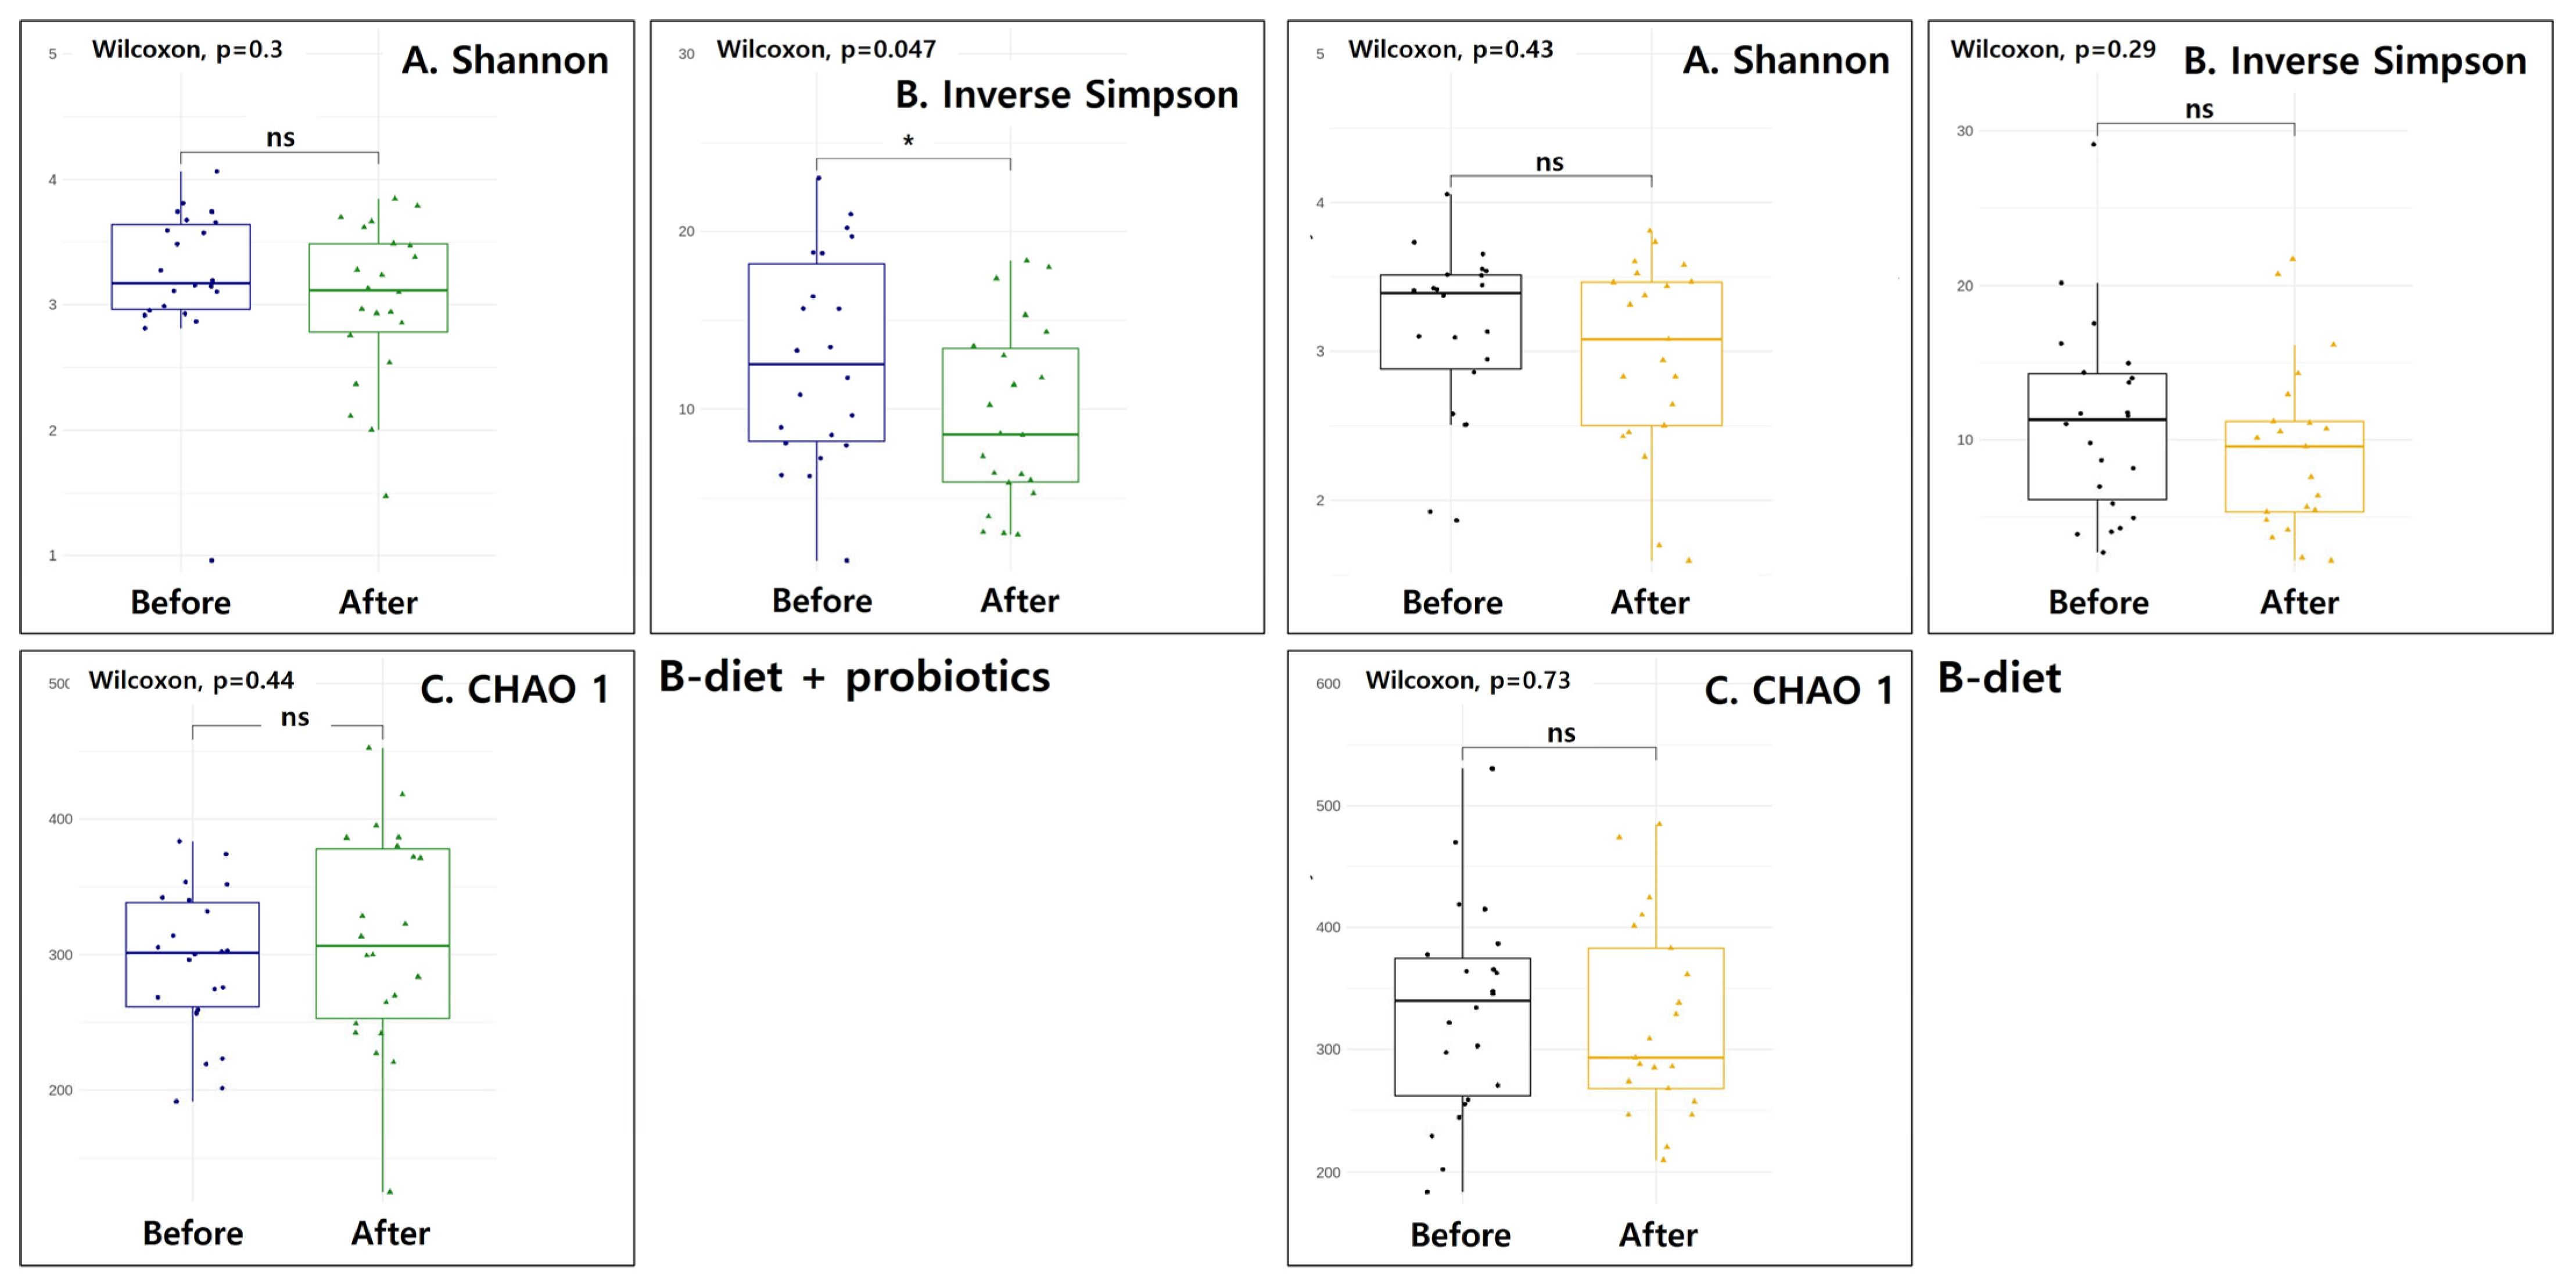
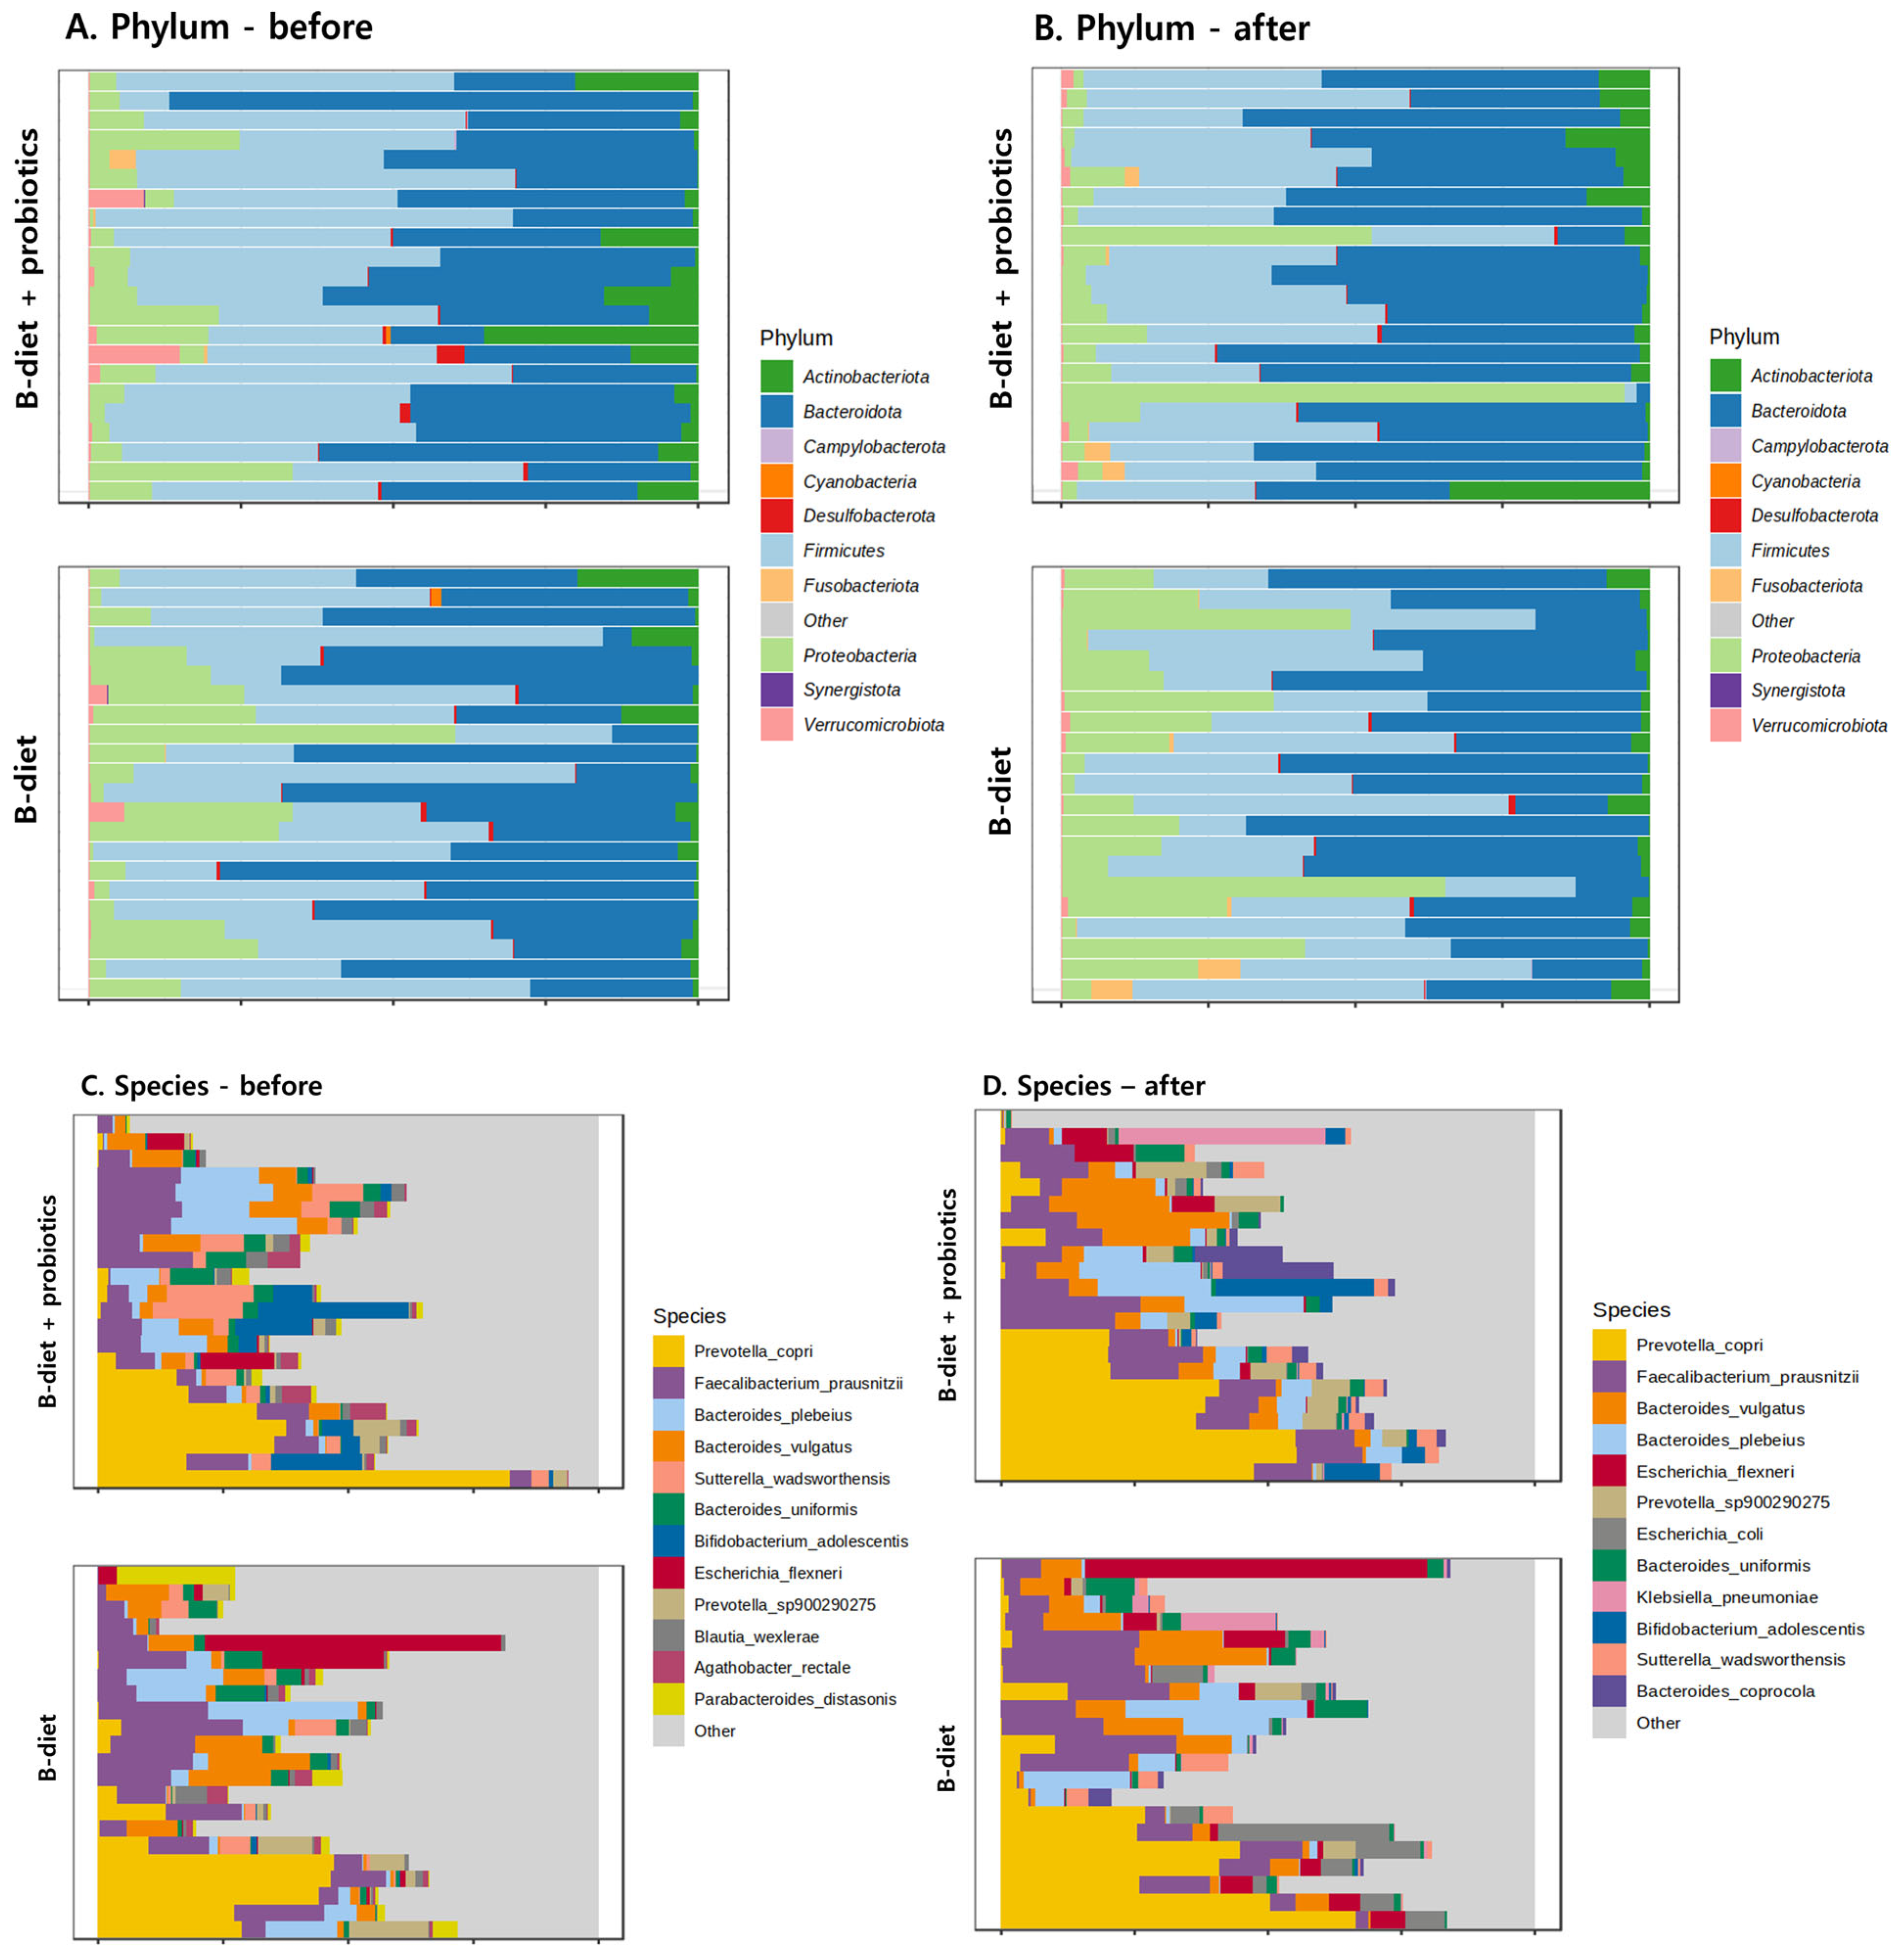
- Further Data Analysis: Statistical analyses were performed using R software (version 4.2.0), utilizing the following R packages: phyloseq, microbiome, ggplot2, vegan, microVIZ, and DESeq2. A custom R function script was also developed to convert read count files (sequence classification results) into an appropriate format for analysis. Microbiome Diversity Analysis: Alpha diversity was assessed using the Chao1 index, Shannon–Wiener index, and Inverse Simpson’s index. Beta diversity, based on the dominant microbiome composition at both phylum and genus levels, was calculated using Bray–Curtis distances and visualized by principal coordinate analysis (PCoA). Statistical significance of differences in microbiome composition between the two groups was evaluated by permutational multivariate analysis of variance (PERMANOVA) with 999 permutations. Additionally, relative abundances at phylum and genus levels were visualized using stacked bar plots. All microbiome analyses were conducted by eGnome, Inc., Seoul, Republic of Korea.
2.5. Secondary Outcomes
Nutritional Status
2.6. Statistical Analysis
3. Results
4. Discussion
5. Conclusions
Author Contributions
Funding
Institutional Review Board Statement
Informed Consent Statement
Data Availability Statement
Acknowledgments
Conflicts of Interest
References
- Hyun, K.-R.; Kang, S.; Lee, S. Population Aging and Healthcare Expenditure in Korea. Health Econ. 2016, 25, 1239–1251. [Google Scholar] [CrossRef] [PubMed]
- Kwon, O. Korean Nutrition Society. Dietary Reference Intakes for Koreans 2020: Energy and Macronutrients; Ministry of Health and Welfare: Sejong, Republic of Korea, 2020. [Google Scholar]
- Han, G.; Yang, E. Evaluation of Dietary Habit and Nutritional Intake of Korean Elderly: Data from Korea National Health and Nutrition Examination Survey 2013∼2015. J. East Asian Soc. Diet. Life 2018, 28, 258–271. [Google Scholar] [CrossRef]
- Shin, H.-R.; Kim, Y.-S.; Park, Y.-K.; Koo, S.-K.; Son, W.-H.; Han, J.-W.; Son, E.-H.; Kang, H.-J.; Choi, K.-H.; Han, J.-S.; et al. Nutritional Status and Frailty Improvement through Senior-Friendly Diet among Community-Dwelling Older Adults in South Korea. Nutrients 2023, 15, 1381. [Google Scholar] [CrossRef] [PubMed]
- Mann, T.; Heuberger, R.; Wong, H. The association between chewing and swallowing difficulties and nutritional status in older adults. Aust. Dent. J. 2013, 58, 200–206. [Google Scholar] [CrossRef]
- Calder, P.C.; Bosco, N.; Bourdet-Sicard, R.; Capuron, L.; Delzenne, N.; Doré, J.; Franceschi, C.; Lehtinen, M.J.; Recker, T.; Salvioli, S.; et al. Health relevance of the modification of low grade inflammation in ageing (inflammageing) and the role of nutrition. Ageing Res. Rev. 2017, 40, 95–119. [Google Scholar] [CrossRef]
- Morrisette-Thomas, V.; Cohen, A.A.; Fülöp, T.; Riesco, É.; Legault, V.; Li, Q.; Milot, E.; Dusseault-Bélanger, F.; Ferrucci, L. Inflamm-aging does not simply reflect increases in pro-inflammatory markers. Mech. Ageing Dev. 2014, 139, 49–57. [Google Scholar] [CrossRef]
- Arteaga-Henríquez, G.; Rosales-Ortiz, S.K.; Arias-Vásquez, A.; Bitter, I.; Ginsberg, Y.; Ibañez-Jimenez, P.; Kilencz, T.; Lavebratt, C.; Matura, S.; Reif, A.; et al. Treating impulsivity with probiotics in adults (PROBIA): Study protocol of a multicenter, double-blind, randomized, placebo-controlled trial. Trials 2020, 21, 161. [Google Scholar] [CrossRef]
- Mateo, D.; Marquès, M.; Domingo, J.L.; Torrente, M. Influence of gut microbiota on the development of most prevalent neurodegenerative dementias and the potential effect of probiotics in elderly: A scoping review. Am. J. Med. Genet. Part B Neuropsychiatr. Genet. 2024, 195, e32959. [Google Scholar] [CrossRef]
- Won, C.W.; Rho, Y.G.; Kim, S.Y.; Cho, B.R.; Lee, Y.S. The Validity and Reliability of Korean Activities of Daily Living(K-ADL) Scale. J. Korean Geriatr. Soc. 2002, 6, 98–106. [Google Scholar]
- Seol, D.; Lim Jin, S.; Sung, S.; Lee Young, H.; Jeong, M.; Cho, S.; Kwak, W.; Kim, H. Microbial Identification Using rRNA Operon Region: Database and Tool for Metataxonomics with Long-Read Sequence. Microbiol. Spectr. 2022, 10, e02017–e02021. [Google Scholar] [CrossRef]
- Monfort-Pires, M.; Ferreira, S.R.G. Inflammatory and metabolic responses to dietary intervention differ among individuals at distinct cardiometabolic risk levels. Nutrition 2017, 33, 331–337. [Google Scholar] [CrossRef]
- Valentini, L.; Pinto, A.; Bourdel-Marchasson, I.; Ostan, R.; Brigidi, P.; Turroni, S.; Hrelia, S.; Hrelia, P.; Bereswill, S.; Fischer, A.; et al. Impact of personalized diet and probiotic supplementation on inflammation, nutritional parameters and intestinal microbiota—The “RISTOMED project”: Randomized controlled trial in healthy older people. Clin. Nutr. 2015, 34, 593–602. [Google Scholar] [CrossRef] [PubMed]
- Fan, R.; Xu, M.; Wang, J.; Zhang, Z.; Chen, Q.; Li, Y.; Gu, J.; Cai, X.; Guo, Q.; Bao, L.; et al. Sustaining Effect of Intensive Nutritional Intervention Combined with Health Education on Dietary Behavior and Plasma Glucose in Type 2 Diabetes Mellitus Patients. Nutrients 2016, 8, 560. [Google Scholar] [CrossRef] [PubMed]
- Zhang, C.; Jiang, J.; Wang, C.; Li, S.; Yu, L.; Tian, F.; Zhao, J.; Zhang, H.; Chen, W.; Zhai, Q. Meta-analysis of randomized controlled trials of the effects of probiotics on type 2 diabetes in adults. Clin. Nutr. 2022, 41, 365–373. [Google Scholar] [CrossRef] [PubMed]
- Jenkins, A.L.; Jenkins, D.J.A.; Zdravkovic, U.; Würsch, P.; Vuksan, V. Depression of the glycemic index by high levels of β-glucan fiber in two functional foods tested in type 2 diabetes. Eur. J. Clin. Nutr. 2002, 56, 622–628. [Google Scholar] [CrossRef]
- Cabrerizo, S.; Cuadras, D.; Gomez-Busto, F.; Artaza-Artabe, I.; Marín-Ciancas, F.; Malafarina, V. Serum albumin and health in older people: Review and meta analysis. Maturitas 2015, 81, 17–27. [Google Scholar] [CrossRef]
- Pan, Y.; Yang, L.; Dai, B.; Lin, B.; Lin, S.; Lin, E. Effects of Probiotics on Malnutrition and Health-Related Quality of Life in Patients Undergoing Peritoneal Dialysis: A Randomized Controlled Trial. J. Ren. Nutr. 2021, 31, 199–205. [Google Scholar] [CrossRef]
- Zaharoni, H.; Rimon, E.; Vardi, H.; Friger, M.; Bolotin, A.; Shahar, D.R. Probiotics improve bowel movements in hospitalized elderly patients—The proage study. J. Nutr. Health Aging 2011, 15, 215–220. [Google Scholar] [CrossRef]
- Nanri, H.; Hara, M.; Nishida, Y.; Shimanoe, C.; Nakamura, K.; Higaki, Y.; Imaizumi, T.; Taguchi, N.; Sakamoto, T.; Horita, M.; et al. Dietary Patterns and Serum Gamma-Glutamyl Transferase in Japanese Men and Women. J. Epidemiol. 2015, 25, 378–386. [Google Scholar] [CrossRef]
- Garry, P.J.; Hunt, W.C.; Koehler, K.M.; VanderJagt, D.J.; Vellas, B.J. Longitudinal study of dietary intakes and plasma lipids in healthy elderly men and women. Am. J. Clin. Nutr. 1992, 55, 682–688. [Google Scholar] [CrossRef]
- Childs, C.E.; Calder, P.C.; Miles, E.A. Diet and Immune Function. Ageing Res. Rev. 2019, 11, 1933. [Google Scholar] [CrossRef] [PubMed]
- Cancello, R.; Turroni, S.; Rampelli, S.; Cattaldo, S.; Candela, M.; Cattani, L.; Mai, S.; Vietti, R.; Scacchi, M.; Brigidi, P.; et al. Effect of Short-Term Dietary Intervention and Probiotic Mix Supplementation on the Gut Microbiota of Elderly Obese Women. Nutrients 2019, 11, 3011. [Google Scholar] [CrossRef]
- Imdad, S.; So, B.; Jang, J.; Park, J.; Lee, S.-J.; Kim, J.-H.; Kang, C. Temporal variations in the gut microbial diversity in response to high-fat diet and exercise. Sci. Rep. 2024, 14, 3282. [Google Scholar] [CrossRef]
- Turnbaugh, P.J.; Ley, R.E.; Mahowald, M.A.; Magrini, V.; Mardis, E.R.; Gordon, J.I. An obesity-associated gut microbiome with increased capacity for energy harvest. Nature 2006, 444, 1027–1031. [Google Scholar] [CrossRef]
- Biagi, E.; Candela, M.; Turroni, S.; Garagnani, P.; Franceschi, C.; Brigidi, P. Ageing and gut microbes: Perspectives for health maintenance and longevity. Pharmacol. Res. 2013, 69, 11–20. [Google Scholar] [CrossRef] [PubMed]
- Leylabadlo, H.E.; Ghotaslou, R.; Feizabadi, M.M.; Farajnia, S.; Moaddab, S.Y.; Ganbarov, K.; Khodadadi, E.; Tanomand, A.; Sheykhsaran, E.; Yousefi, B.; et al. The critical role of Faecalibacterium prausnitzii in human health: An overview. Microb. Pathog. 2020, 149, 104344. [Google Scholar] [CrossRef]
- Lee, S.Y.; Lee, D.Y.; Kang, H.J.; Kang, J.H.; Cho, M.G.; Jang, H.W.; Kim, B.K.; Hur, S.J. Differences in the gut microbiota between young and elderly persons in Korea. Nutr. Res. 2021, 87, 31–40. [Google Scholar] [CrossRef]
- Fang, H.; Li, D.; Kang, J.; Jiang, P.; Sun, J.; Zhang, D. Metabolic engineering of Escherichia coli for de novo biosynthesis of vitamin B12. Nat. Commun. 2018, 9, 4917. [Google Scholar] [CrossRef] [PubMed]
- Conway, J.; Duggal, N.A. Ageing of the gut microbiome: Potential influences on immune senescence and inflammageing. Ageing Res. Rev. 2021, 68, 101323. [Google Scholar] [CrossRef]
- Claesson, M.J.; Jeffery, I.B.; Conde, S.; Power, S.E.; O’Connor, E.M.; Cusack, S.; Harris, H.M.B.; Coakley, M.; Lakshminarayanan, B.; O’Sullivan, O.; et al. Gut microbiota composition correlates with diet and health in the elderly. Nature 2012, 488, 178–184. [Google Scholar] [CrossRef]
- Park, S.-H.; Kim, K.-A.; Ahn, Y.-T.; Jeong, J.-J.; Huh, C.-S.; Kim, D.-H. Comparative analysis of gut microbiota in elderly people of urbanized towns and longevity villages. BMC Microbiol. 2015, 15, 49. [Google Scholar] [CrossRef]
- Ghosh, T.S.; Shanahan, F.; O’Toole, P.W. The gut microbiome as a modulator of healthy ageing. Nat. Rev. Gastroenterol. Hepatol. 2022, 19, 565–584. [Google Scholar] [CrossRef] [PubMed]
- Precup, G.; Vodnar, D.-C. Gut Prevotella as a possible biomarker of diet and its eubiotic versus dysbiotic roles: A comprehensive literature review. Br. J. Nutr. 2019, 122, 131–140. [Google Scholar] [CrossRef]
- Lynch, D.B.; Jeffery, I.B.; Cusack, S.; O’Connor, E.M.; O’Toole, P.W. Diet-microbiota-health interactions in older subjects: Implications for healthy aging. Interdiscip. Top. Gerontol. 2015, 40, 141–154. [Google Scholar] [CrossRef]
- Jönsson, A.C.; Lindgren, I.; Norrving, B.; Lindgren, A. Weight loss after stroke: A population-based study from the Lund Stroke Register. Stroke 2008, 39, 918–923. [Google Scholar] [CrossRef]
- Kim, S.H.; Ahn, J.; Ock, M.; Shin, S.; Park, J.; Luo, N.; Jo, M.W. The EQ-5D-5L valuation study in Korea. Qual. Life Res. 2016, 25, 1845–1852. [Google Scholar] [CrossRef] [PubMed]
- Lee, H.-S. The Factors Influencing Health-Related Quality of Life in the Elderly: Focused on the General Characteristics, Health Habits, Mental Health, Chronic Diseases, and Nutrient Intake Status: Data from the Fifth Korea National Health and Nutrition Examination Survey (KNHANES V), 2010~2012. Korean J. Community Nutr. 2014, 19, 479–489. [Google Scholar] [CrossRef]
- Lee, Y.; Yang, N.; Shin, M.; Lee, K.E.; Yoo, C.H.; Kim, K. The effects of a personalized nutrition intervention program on food security, health and nutritional status of lowincome older adults in Seoul city. J. Nutr. Health 2020, 53, 416–430. [Google Scholar] [CrossRef]
- Oh, C.; No, J.K.; Kim, H.S. Dietary pattern classifications with nutrient intake and body composition changes in Korean elderly. Nutr. Res. Pract. 2014, 8, 192–197. [Google Scholar] [CrossRef]
- Han, G. Evaluation of Chronic Disease and Nutritional Intake by Obesity of Korean Elderly—Data from Korea National Health and Nutrition Examination Survey 2016~2018. Korean J. Food Nutr. 2020, 33, 428–439. [Google Scholar] [CrossRef]
- Ham, S.-W.; Kim, K.-H. Evaluation of the dietary quality and nutritional status of elderly people using the Nutrition Quotient for Elderly (NQ-E) in Seoul. J. Nutr. Health 2020, 53, 68–82. [Google Scholar] [CrossRef]

| Variables | B-Diet (n = 24) | B-Diet + Probiotics (n = 24) | p-Value 1 |
|---|---|---|---|
| Age, y | 81.5 (9.5) | 82.2 (5.5) | 0.77 |
| Sex, female, % | 62.5 | 87.5 | 0.05 |
| Weight, kg | 55.2 (8.1) | 57.9 (7.0) | 0.24 |
| BMI, kg/m2 | 23.1 (2.4) | 25.0 (2.5) | 0.01 |
| SBP, mmHg | 131.5 (23.7) | 147.6 (22.2) | 0.02 |
| DBP, mmHg | 72.0 (10.4) | 78.0 (7.3) | 0.02 |
| Educational level, % | 0.78 | ||
| ≤Elementary | 30.4 | 41.7 | |
| Middle school | 4.3 | 20.8 | |
| High school | 21.7 | 20.8 | |
| College or university | 43.5 | 12.5 | |
| ≥Graduate school | 0.0 | 4.2 | |
| Stress status, % | 0.91 | ||
| No | 41.7 | 45.8 | |
| Mild to Moderate | 50.0 | 41.7 | |
| Severe | 4.2 | 8.3 | |
| Very severe | 4.2 | 4.2 | |
| Sleep duration, h | 6.9 (1.4) | 6.6 (1.9) | 0.40 |
| Alcohol intake, % | 0.38 | ||
| None | 65.2 | 79.2 | |
| Past drinkers | 8.7 | 0.0 | |
| Current drinkers | 26.1 | 20.8 | |
| Smoking status, % | 0.22 | ||
| None | 82.6 | 95.8 | |
| Past smokers | 13.0 | 4.2 | |
| Current smokers | 4.3 | 0.0 | |
| Regular exercise | 0.16 | ||
| Yes | 87.5 | 70.8 | |
| No | 12.5 | 29.2 | |
| K-IADL | 9.8 (2.7) | 11.6 (4.8) | 0.17 |
| Variables | B-Diet | B-Diet + Probiotics | Comparison of Δ Values Between Groups 2 | ||||
|---|---|---|---|---|---|---|---|
| Pre | Post | p-Value 1 | Pre | Post | p-Value 1 | ||
| Energy (kcal) | 989.9 (279.5) | 1433.4 (312.4) | 0.00 | 1247.8 (375.4) | 1417.6 (271.9) | 0.01 | 0.01 |
| Carbohydrate (g) | 161.4 (42.3) | 211.6 (43.8) | 0.00 | 184.1 (65.5) | 196.6 (37.4) | 0.05 | 0.01 |
| Protein (g) | 37.1 (13.7) | 55.6 (14.8) | 0.00 | 47.0 (14.1) | 55.2 (9.3) | 0.01 | 0.02 |
| Fat (g) | 21.5 (11.1) | 39.4 (11.2) | 0.00 | 34.4 (13.2) | 44.6 (14.0) | 0.00 | 0.07 |
| Carbohydrate (%) | 65.9 (8.1) | 59.9 (5.6) | 0.01 | 59.5 (7.6) | 56.0 (5.1) | 0.05 | 0.36 |
| Protein (%) | 15.0 (2.6) | 15.5 (2.0) | 0.46 | 15.3 (2.1) | 15.9 (2.0) | 0.35 | 0.96 |
| Fat (%) | 19.2 (6.2) | 24.6 (3.9) | 0.00 | 25.2 (6.6) | 28.1 (5.9) | 0.08 | 0.26 |
| Dietary fiber (g) | 14.7 (5.7) | 23.4 (7.3) | 0.00 | 18.3 (5.6) | 23.0 (3.6) | 0.00 | 0.02 |
| Vitamin A (µgRAE) | 182.5 (81.3) | 571.0 (241.5) | 0.00 | 270.6 (188.3) | 720.8 (116.4) | 0.00 | 0.37 |
| Vitamin D (µg) | 1.1 (1.3) | 3.1 (2.6) | 0.00 | 2.1 (2.1) | 2.1 (0.9) | 0.98 | 0.03 |
| Vitamin E (mg) | 7.2 (3.4) | 19.1 (6.2) | 0.00 | 10.8 (4.2) | 20.7 (4.9) | 0.00 | 0.22 |
| Vitamin K (µg) | 87.0 (85.5) | 269.5 (167.7) | 0.00 | 100.1 (93.0) | 283.6 (77.7) | 0.00 | 0.98 |
| Vitamin C (mg) | 61.0 (37.1) | 70.8 (55.6) | 0.42 | 38.8 (36.2) | 68.5 (36.0) | 0.98 | 0.52 |
| Thiamin (mg) | 1.0 (0.3) | 1.4 (0.3) | 0.00 | 1.3 (0.4) | 1.3 (0.3) | 0.97 | 0.00 |
| Riboflavin (mg) | 0.7 (0.4) | 1.2 (0.4) | 0.00 | 1.1 (0.5) | 1.3 (0.4) | 0.11 | 0.02 |
| Niacin (mg) | 6.5 (2.6) | 10.3 (2.8) | 0.00 | 8.9 (3.1) | 10.1(1.6) | 0.05 | 0.00 |
| Folate (µgDFE) | 269.5 (96.8) | 470.4 (133.6) | 0.00 | 345.9 (120.1) | 450.4 (87.1) | 0.00 | 0.01 |
| Calcium (mg) | 296.6 (96.7) | 536.6 (184.6) | 0.00 | 422.5 (199.2) | 555.6 (113.9) | 0.01 | 0.09 |
| Phosphorus (mg) | 637.4 (200.9) | 927.1 (242.6) | 0.00 | 771.7 (209.3) | 925.3 (172.8) | 0.01 | 0.03 |
| Sodium (mg) | 2245.3 (906.0) | 3908.9 (1089.4) | 0.00 | 2109.9 (760.2) | 3617.3 (653.3) | 0.00 | 0.57 |
| Potassium (mg) | 1614.8 (524.6) | 2826.9 (756.3) | 0.00 | 1884.3 (495.4) | 2658.1 (542.1) | 0.00 | 0.02 |
| Magnesium (mg) | 76.8 (40.2) | 76.6 (45.0) | 0.99 | 69.3 (37.3) | 58.4 (25.3) | 0.15 | 0.41 |
| Iron (mg) | 8.1 (2.5) | 16.2 (10.5) | 0.03 | 10.4 (3.2) | 14.2 (2.7) | 0.00 | 0.02 |
Disclaimer/Publisher’s Note: The statements, opinions and data contained in all publications are solely those of the individual author(s) and contributor(s) and not of MDPI and/or the editor(s). MDPI and/or the editor(s) disclaim responsibility for any injury to people or property resulting from any ideas, methods, instructions or products referred to in the content. |
© 2025 by the authors. Licensee MDPI, Basel, Switzerland. This article is an open access article distributed under the terms and conditions of the Creative Commons Attribution (CC BY) license (https://creativecommons.org/licenses/by/4.0/).
Share and Cite
Park, J.; Lee, Y.-S.; Lee, D.-K.; Hong, J.; Park, S.-J.; Lee, B.W.; Park, S.M.; Lee, H.-J. Effects of a Balanced Diet and Probiotics on Blood Biomarkers and Gut Microbiota in the Elderly: A Community-Based Intervention Study. Nutrients 2025, 17, 1933. https://doi.org/10.3390/nu17111933
Park J, Lee Y-S, Lee D-K, Hong J, Park S-J, Lee BW, Park SM, Lee H-J. Effects of a Balanced Diet and Probiotics on Blood Biomarkers and Gut Microbiota in the Elderly: A Community-Based Intervention Study. Nutrients. 2025; 17(11):1933. https://doi.org/10.3390/nu17111933
Chicago/Turabian StylePark, Junghyun, You-Suk Lee, Do-Kyung Lee, Juyong Hong, Seon-Joo Park, Byung Wook Lee, Sang Min Park, and Hae-Jeung Lee. 2025. "Effects of a Balanced Diet and Probiotics on Blood Biomarkers and Gut Microbiota in the Elderly: A Community-Based Intervention Study" Nutrients 17, no. 11: 1933. https://doi.org/10.3390/nu17111933
APA StylePark, J., Lee, Y.-S., Lee, D.-K., Hong, J., Park, S.-J., Lee, B. W., Park, S. M., & Lee, H.-J. (2025). Effects of a Balanced Diet and Probiotics on Blood Biomarkers and Gut Microbiota in the Elderly: A Community-Based Intervention Study. Nutrients, 17(11), 1933. https://doi.org/10.3390/nu17111933