
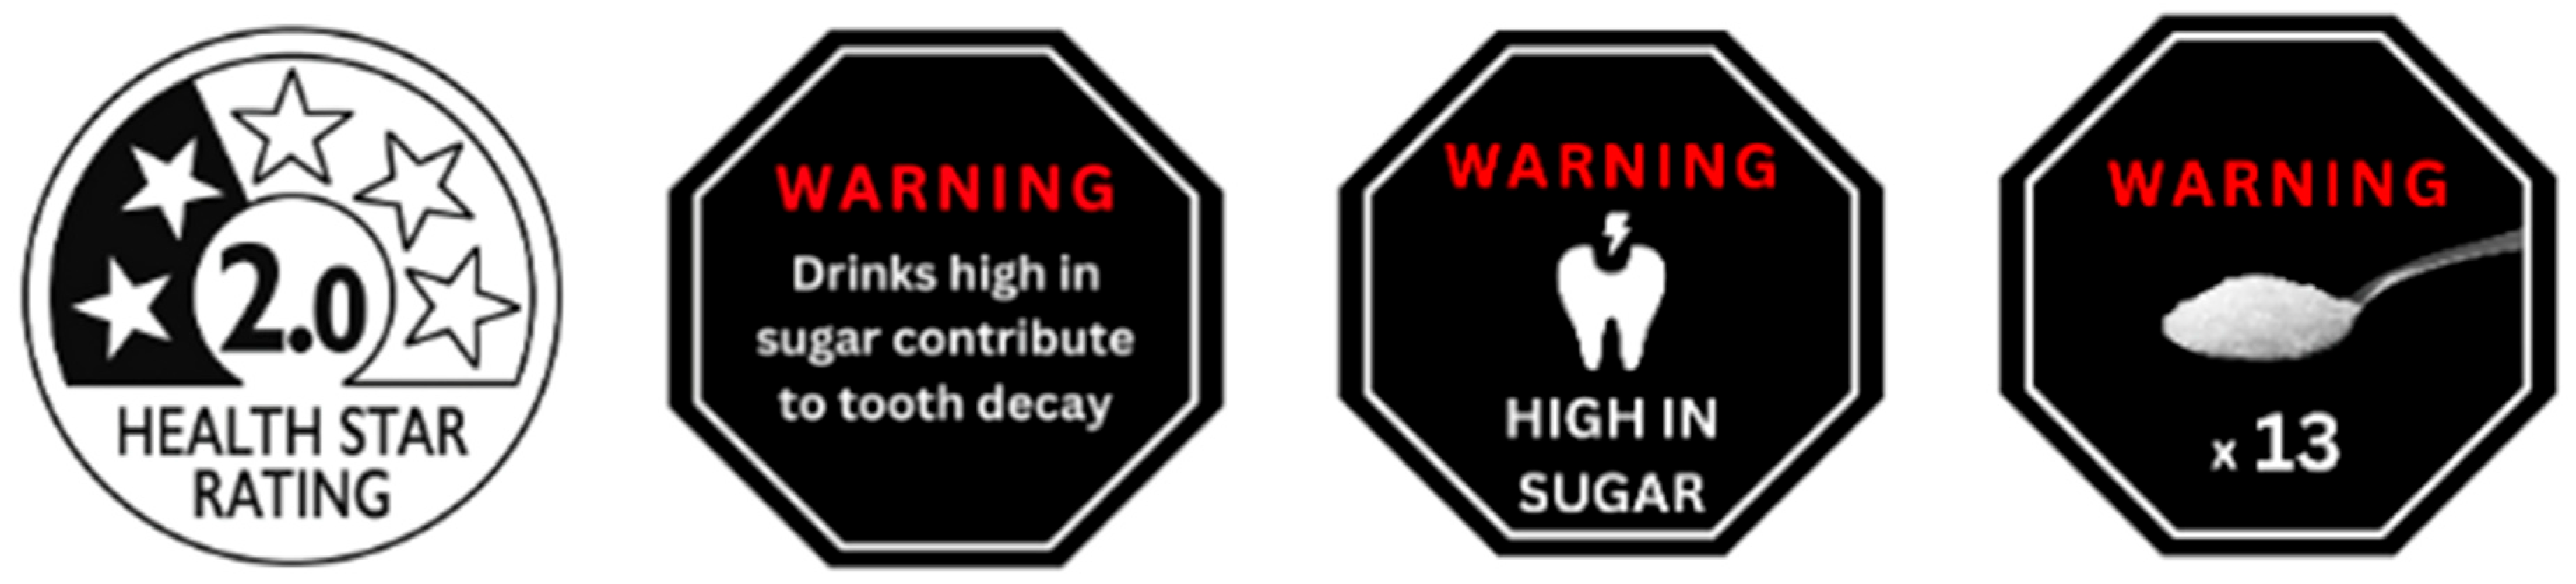
Parent and Child Choice of Sugary Drinks Under Four Labelling Conditions

 , , , , , and
Abstract
1. Introduction
1.1. Parent and Child Choice of Sugary Drinks Under Four Labelling Conditions
1.2. Aims and Hypotheses
2. Methods
2.1. Design
2.2. Participants
2.3. Measures
2.4. Procedure
2.5. Data Analysis
3. Results
3.1. Sample Characteristics
3.2. Label Perceptions and Recall
3.3. Beverage Choice by Product Type
3.4. Beverage Choice by Healthiness Rating
4. Discussion
Limitations and Future Directions
5. Conclusions
Supplementary Materials
Author Contributions
Funding
Institutional Review Board Statement
Informed Consent Statement
Data Availability Statement
Acknowledgments
Conflicts of Interest
References
- World Health Organization. Guideline: Sugars Intake for Adults and Children; World Health Organization: Geneva, Switzerland, 2015; Available online: https://www.who.int/publications-detail/9789241549028 (accessed on 19 May 2020).
- Malik, V.S.; Hu, F.B. The Role of Sugar-Sweetened Beverages in the Global Epidemics of Obesity and Chronic Diseases. Nat. Rev. Endocrinol. 2022, 18, 205–218. [Google Scholar] [CrossRef] [PubMed]
- Singh, G.M.; Micha, R.; Khatibzadeh, S.; Shi, P.; Lim, S.; Andrews, K.G.; Engell, R.E.; Ezzati, M.; Mozaffarian, D.; Global Burden of Diseases Nutrition and Chronic Diseases Expert Group (NutriCoDE). Global, Regional, and National Consumption of Sugar-Sweetened Beverages, Fruit Juices, and Milk: A Systematic Assessment of Beverage Intake in 187 Countries. PLoS ONE 2015, 10, e0124845. [Google Scholar] [CrossRef] [PubMed]
- Lei, L.; Rangan, A.; Flood, V.M.; Louie, J.C.Y. Dietary Intake and Food Sources of Added Sugar in the Australian Population. Br. J. Nutr. 2016, 115, 868–877. [Google Scholar] [CrossRef] [PubMed]
- World Health Organization. WHO Manual on Sugar-Sweetened Beverage Taxation Policies to Promote Healthy Diets; World Health Organization: Geneva, Switzerland, 2022; p. 2. ISBN 978-92-4-005629-9. [Google Scholar]
- Australian Bureau of Statistics. Australian Health Survey: Nutrition First Results–Food and Nutrients, 2011–12; 2014. Available online: https://www.abs.gov.au/statistics/health/health-conditions-and-risks/food-and-nutrients/latest-release (accessed on 30 May 2024).
- Ludwig, D.S.; Peterson, K.E.; Gortmaker, S.L. Relation between Consumption of Sugar-Sweetened Drinks and Childhood Obesity: A Prospective, Observational Analysis. Lancet 2001, 357, 505–508. [Google Scholar] [CrossRef]
- Malik, V.S.; Pan, A.; Willett, W.C.; Hu, F.B. Sugar-Sweetened Beverages and Weight Gain in Children and Adults: A Systematic Review and Meta-Analysis 1 2 3. Am. J. Clin. Nutr. 2013, 98, 1084–1102. [Google Scholar] [CrossRef]
- Munsell, C.R.; Harris, J.L.; Sarda, V.; Schwartz, M.B. Parents’ Beliefs about the Healthfulness of Sugary Drink Options: Opportunities to Address Misperceptions. Public. Health Nutr. 2016, 19, 46–54. [Google Scholar] [CrossRef]
- Bucher, T.; Siegrist, M. Children’s and Parents’ Health Perception of Different Soft Drinks. Br. J. Nutr. 2015, 113, 526–535. [Google Scholar] [CrossRef]
- Talati, Z.; Charlesworth, J.; Mackenzie, K.; McAlpine, T.; Myers, G.; Miller, C.; Dana, L.M.; O’Connor, M.; Mullan, B.A.; Dixon, H.G. Exploring Sugary Drink Consumption and Perceptions among Primary-School-Aged Children and Parents in Australia. Nutrients 2024, 16, 3320. [Google Scholar] [CrossRef]
- Musicus, A.A.; Jensen, M.L.; Mita, C.; Winters, D.R.H.; Roberts, M.T.; Mancini, S.; Harris, J.L.; Fleming-Milici, F.; Krieger, J.W. The Relationship Between Fruit Drink Front-of-Package Claims, Fruit Imagery, and Ingredient Disclosures and Consumer Perceptions, Intentions, and Behavior: A Systematic Review. J. Acad. Nutr. Diet. 2025, in press. [Google Scholar] [CrossRef]
- Brownbill, A.L.; Miller, C.L.; Braunack-Mayer, A.J. Industry Use of ‘Better-for-You’ Features on Labels of Sugar-Containing Beverages. Public. Health Nutr. 2018, 21, 3335–3343. [Google Scholar] [CrossRef]
- Dixon, H.G.; Awoke, M.A.; Scully, M.; McCann, J.; Martin, J.; Morley, B.; Rhodes, A.; McAleese, A.; Schmidtke, A. Effects of Marketing Claims on Toddler Food Products on Parents’ Product Preferences, Perceptions and Purchasing Intentions: An Online Experiment. Int. J. Behav. Nutr. Phys. Act. 2024, 21, 60. [Google Scholar] [CrossRef] [PubMed]
- Drewnowski, A.; Rehm, C.D. Socioeconomic Gradient in Consumption of Whole Fruit and 100% Fruit Juice among US Children and Adults. Nutr. J. 2015, 14, 3. [Google Scholar] [CrossRef] [PubMed]
- Sah, A.; Hillenbrand, C.; Vogt, J. Visible Sugar: Salient Sugar Information Impacts Health Perception of Fruit Juices but Only When Motivated to Be Responsible and Not When Motivated to Enjoy. Appetite 2021, 164, 105262. [Google Scholar] [CrossRef] [PubMed]
- Hua, S.V.; Musicus, A.A.; Thorndike, A.N.; Kenney, E.L.; Rimm, E.B. Child-Directed Marketing, Health Claims, and Nutrients in Popular Beverages. Am. J. Prev. Med. 2022, 63, 354–361. [Google Scholar] [CrossRef]
- Billich, N.; Blake, M.R.; Backholer, K.; Cobcroft, M.; Li, V.; Peeters, A. The Effect of Sugar-Sweetened Beverage Front-of-Pack Labels on Drink Selection, Health Knowledge and Awareness: An Online Randomised Controlled Trial. Appetite 2018, 128, 233–241. [Google Scholar] [CrossRef]
- An, R.; Zheng, J.; Xiang, X. Projecting the Influence of Sugar-Sweetened Beverage Warning Labels and Restaurant Menu Labeling Regulations on Energy Intake, Weight Status, and Health Care Expenditures in US Adults: A Microsimulation. J. Acad. Nutr. Diet. 2022, 122, 334–344. [Google Scholar] [CrossRef]
- Food Standards. Australia New Zealand Health Star Rating System. Available online: https://www.foodstandards.gov.au/consumer/labelling/Health-Star-Rating-System (accessed on 23 November 2024).
- Scully, M.; Morley, B.; Wakefield, M.; Dixon, H. Can Point-of-Sale Nutrition Information and Health Warnings Encourage Reduced Preference for Sugary Drinks?: An Experimental Study. Appetite 2020, 149, 104612. [Google Scholar] [CrossRef]
- Dixon, H.; Scully, M.; Morley, B.; Wakefield, M. Can Point-of-Sale Nutrition Information Encourage Reduced Preference for Sugary Drinks among Adolescents? Public. Health Nutr. 2021, 24, 4023–4034. [Google Scholar] [CrossRef]
- Riesenberg, D.; Peeters, A.; Backholer, K.; Martin, J.; Mhurchu, C.N.; Blake, M.R. Exploring the Effects of Added Sugar Labels on Food Purchasing Behaviour in Australian Parents: An Online Randomised Controlled Trial. PLoS ONE 2022, 17, e0271435. [Google Scholar] [CrossRef]
- Rosenblatt, D.H.; Bode, S.; Dixon, H.; Murawski, C.; Summerell, P.; Ng, A.; Wakefield, M. Health Warnings Promote Healthier Dietary Decision Making: Effects of Positive versus Negative Message Framing and Graphic versus Text-Based Warnings. Appetite 2018, 127, 280–288. [Google Scholar] [CrossRef]
- An, R.; Liu, J.; Liu, R.; Barker, A.R.; Figueroa, R.B.; McBride, T.D. Impact of Sugar-Sweetened Beverage Warning Labels on Consumer Behaviors: A Systematic Review and Meta-Analysis. Am. J. Prev. Med. 2021, 60, 115–126. [Google Scholar] [CrossRef] [PubMed]
- Grummon, A.H.; Hall, M.G. Sugary Drink Warnings: A Meta-Analysis of Experimental Studies. PLoS Med. 2020, 17, e1003120. [Google Scholar] [CrossRef] [PubMed]
- Adams, J.M.; Hart, W.; Gilmer, D.O.; Lloyd-Richardson, E.E.; Burton, K.A. Concrete Images of the Sugar Content in Sugar-Sweetened Beverages Reduces Attraction to and Selection of These Beverages. Appetite 2014, 83, 10–18. [Google Scholar] [CrossRef] [PubMed]
- Mantzari, E.; Vasiljevic, M.; Turney, I.; Pilling, M.; Marteau, T. Impact of Warning Labels on Sugar-Sweetened Beverages on Parental Selection: An Online Experimental Study. Prev. Med. Rep. 2018, 12, 259–267. [Google Scholar] [CrossRef]
- Miller, C.; Wright, K.; Dono, J.; Pettigrew, S.; Wakefield, M.; Coveney, J.; Wittert, G.; Roder, D.; Durkin, S.; Martin, J.; et al. “You Can’t Just Eat 16 Teaspoons of Sugar so Why Would You Drink 16 Teaspoons’ Worth of Sugar?”: A Qualitative Study of Young Adults’ Reactions to Sugary Drink Warning Labels. BMC Public Health 2022, 22, 1241. [Google Scholar] [CrossRef]
- Grummon, A.H.; Taillie, L.S.; Golden, S.D.; Hall, M.G.; Ranney, L.M.; Brewer, N.T. Sugar-Sweetened Beverage Health Warnings and Purchases: A Randomized Controlled Trial. Am. J. Prev. Med. 2019, 57, 601–610. [Google Scholar] [CrossRef]
- Basto-Abreu, A.; Torres-Alvarez, R.; Reyes-Sánchez, F.; González-Morales, R.; Canto-Osorio, F.; Colchero, M.A.; Barquera, S.; Rivera, J.A.; Barrientos-Gutierrez, T. Predicting Obesity Reduction after Implementing Warning Labels in Mexico: A Modeling Study. PLoS Med. 2020, 17, e1003221. [Google Scholar] [CrossRef]
- Lima, M.; Ares, G.; Deliza, R. How Do Front of Pack Nutrition Labels Affect Healthfulness Perception of Foods Targeted at Children? Insights from Brazilian Children and Parents. Food Qual. Prefer. 2018, 64, 111–119. [Google Scholar] [CrossRef]
- Arrúa, A.; Curutchet, M.R.; Rey, N.; Barreto, P.; Golovchenko, N.; Sellanes, A.; Velazco, G.; Winokur, M.; Giménez, A.; Ares, G. Impact of Front-of-Pack Nutrition Information and Label Design on Children’s Choice of Two Snack Foods: Comparison of Warnings and the Traffic-Light System. Appetite 2017, 116, 139–146. [Google Scholar] [CrossRef]
- VanEpps, E.M.; Roberto, C.A. The Influence of Sugar-Sweetened Beverage Warnings. Am. J. Prev. Med. 2016, 51, 664–672. [Google Scholar] [CrossRef]
- Hall, M.G.; Grummon, A.H.; Lazard, A.J.; Maynard, O.M.; Taillie, L.S. Reactions to Graphic and Text Health Warnings for Cigarettes, Sugar-Sweetened Beverages, and Alcohol: An Online Randomized Experiment of US Adults. Prev. Med. 2020, 137, 106120. [Google Scholar] [CrossRef] [PubMed]
- Hock, K.; Acton, R.B.; Jáuregui, A.; Vanderlee, L.; White, C.M.; Hammond, D. Experimental Study of Front-of-Package Nutrition Labels’ Efficacy on Perceived Healthfulness of Sugar-Sweetened Beverages among Youth in Six Countries. Prev. Med. Rep. 2021, 24, 101577. [Google Scholar] [CrossRef] [PubMed]
- Taillie, L.S.; Hall, M.G.; Gómez, L.F.; Higgins, I.; Bercholz, M.; Murukutla, N.; Mora-Plazas, M. Designing an Effective Front-of-Package Warning Label for Food and Drinks High in Added Sugar, Sodium, or Saturated Fat in Colombia: An Online Experiment. Nutrients 2020, 12, 3124. [Google Scholar] [CrossRef] [PubMed]
- Grummon, A.H.; Hall, M.G.; Taillie, L.S.; Brewer, N.T. How Should Sugar-Sweetened Beverage Health Warnings Be Designed? A Randomized Experiment. Prev. Med. 2019, 121, 158–166. [Google Scholar] [CrossRef]
- Cabrera, M.; Machín, L.; Arrúa, A.; Antúnez, L.; Curutchet, M.R.; Giménez, A.; Ares, G. Nutrition Warnings as Front-of-Pack Labels: Influence of Design Features on Healthfulness Perception and Attentional Capture. Public. Health Nutr. 2017, 20, 3360–3371. [Google Scholar] [CrossRef]
- Birch, L.L.; Ventura, A.K. Preventing Childhood Obesity: What Works? Int. J. Obes. 2009, 33, S74–S81. [Google Scholar] [CrossRef]
- Vivarini, P.; Kerr, J.A.; Clifford, S.A.; Grobler, A.C.; Jansen, P.W.; Mensah, F.K.; Baur, L.A.; Gibbons, K.; Wake, M. Food Choices: Concordance in Australian Children Aged 11–12 Years and Their Parents. BMJ Open 2019, 9 (Suppl. S3), 147–156. [Google Scholar] [CrossRef]
- Pettigrew, S.; Jongenelis, M.; Chapman, K.; Miller, C. Predictors of the Frequency of Australian Children’s Consumption of Unhealthy Foods. Pediatr. Obes. 2016, 11, e18–e21. [Google Scholar] [CrossRef]
- Miller, C.; Dono, J.; Wright, K.; Pettigrew, S.; Wakefield, M.; Coveney, J.; Wittert, G.; Roder, D.; Durkin, S.; Martin, J. “No Child or Adult Would Ever Probably Choose to Have 16 Teaspoons of Sugar”: A Preliminary Study of Parents’ Responses to Sugary Drink Warning Label Options. Nutrients 2022, 14, 4173. [Google Scholar] [CrossRef]
- Awoke, M.; Scully, M.; Haynes, A.; McCann, J.; Taillie, L.; Schmidtke, A.; Martin, J.; Silva, M.; Rhodes, A.; Kelly, B.; et al. Evaluating the Effectiveness of Added Sugar Warning Labels on Parent’s Perceptions, Preferences and Purchase Intentions towards Ready-Made Infant and Toddler Foods: An Experimental Study. In Proceedings of the Australia New Zealand Obesity Society Annual Meeting, Sydney, Australia, 16–18 October 2024. [Google Scholar] [CrossRef]
- Australian Bureau of Statistics Socio-Economic Indexes for Areas (SEIFA): Technical Paper. Available online: https://www.abs.gov.au/statistics/detailed-methodology-information/concepts-sources-methods/socio-economic-indexes-areas-seifa-technical-paper/latest-release (accessed on 29 August 2024).
- Australian Government Department of Health. The Health Star Rating System Excel Calculator. Available online: https://www.healthstarrating.gov.au/calculator (accessed on 29 August 2024).
- Diepeveen, S.; Ling, T.; Suhrcke, M.; Roland, M.; Marteau, T.M. Public Acceptability of Government Intervention to Change Health-Related Behaviours: A Systematic Review and Narrative Synthesis. BMC Public Health 2013, 13, 756. [Google Scholar] [CrossRef]
- National Health and Medical Research Council Australian Dietary Guidelines; Australian Government Department of Health and Ageing: Canberra, Australia. 2013. Available online: https://www.nhmrc.gov.au/sites/default/files/documents/australian-dietary-guidelines-2013.pdf (accessed on 19 June 2019).
- Taillie, L.S.; Hall, M.G.; Popkin, B.M.; Ng, S.W.; Murukutla, N. Experimental Studies of Front-of-Package Nutrient Warning Labels on Sugar-Sweetened Beverages and Ultra-Processed Foods: A Scoping Review. Nutrients 2020, 12, 569. [Google Scholar] [CrossRef] [PubMed]
- Sehl, C.G.; Tran, E.; Denison, S.; Friedman, O. Novelty Preferences Depend on Goals. Psychon. Bull. Rev. 2022, 29, 2293–2301. [Google Scholar] [CrossRef] [PubMed]
- Peters, G.-J.Y.; Ruiter, R.A.C.; Kok, G. Threatening Communication: A Critical Re-Analysis and a Revised Meta-Analytic Test of Fear Appeal Theory. Health Psychol. Rev. 2013, 7, S8–S31. [Google Scholar] [CrossRef] [PubMed]
- Witte, K.; Allen, M. A Meta-Analysis of Fear Appeals: Implications for Effective Public Health Campaigns. Health Educ. Behav. 2000, 27, 591–615. [Google Scholar] [CrossRef]
- Zahid, A.; Davey, C.; Reicks, M. Beverage Intake among Children: Associations with Parent and Home-Related Factors. Int. J. Environ. Res. Public. Health 2017, 14, 929. [Google Scholar] [CrossRef]
- Mazarello Paes, V.; Hesketh, K.; O’Malley, C.; Moore, H.; Summerbell, C.; Griffin, S.; van Sluijs, E.M.F.; Ong, K.K.; Lakshman, R. Determinants of Sugar-Sweetened Beverage Consumption in Young Children: A Systematic Review. Obes. Rev. 2015, 16, 903–913. [Google Scholar] [CrossRef]
- Egnell, M.; Talati, Z.; Hercberg, S.; Pettigrew, S.; Julia, C. Objective Understanding of Front-of-Package Nutrition Labels: An International Comparative Experimental Study across 12 Countries. Nutrients 2018, 10, 1542. [Google Scholar] [CrossRef]
- Muzzioli, L.; Penzavecchia, C.; Donini, L.M.; Pinto, A. Are Front-of-Pack Labels a Health Policy Tool? Nutrients 2022, 14, 771. [Google Scholar] [CrossRef]
- Ikonen, I.; Sotgiu, F.; Aydinli, A.; Verlegh, P.W.J. Consumer Effects of Front-of-Package Nutrition Labeling: An Interdisciplinary Meta-Analysis. J. Acad. Mark. Sci. 2020, 48, 360–383. [Google Scholar] [CrossRef]
- Talati, Z.; Dixon, H.; Myers, G.; Miller, C.; Dana, L.; McAlpine, T.; Charlesworth, J.; Mullan, B.; Sartori, A. Parent and Child Choice of Sugary Drinks under Four Labelling Conditions. Obes. Res. Clin. Pract. 2024, 18, S21–S22. [Google Scholar] [CrossRef]


| Condition | |||||
|---|---|---|---|---|---|
| Variable | Total (N = 1229) | HSR (n = 305) | Text-Based (n = 301) | Tooth Pictorial (n = 310) | Teaspoons of Sugar (n = 298) |
| Parents | |||||
| Age (M (SD)) | |||||
| Years | 39.10 (7.65) | 39.16 (7.74) | 38.87 (7.68) | 39.32 (7.71) | 38.96 (7.61) |
| Gender (n (%)) | |||||
| Male | 430 (35.0) | 101 (33.1) | 108 (35.9) | 108 (34.8) | 109 (36.6) |
| Female | 792 (64.4) | 202 (66.2) | 192 (63.8) | 199 (64.2) | 189 (63.4) |
| Non-binary | 4 (0.3) | 1 (0.3) | 1 (0.3) | 2 (0.6) | 0 (0.0) |
| Prefer not to say | 2 (0.2) | 1 (0.3) | 0 (0.0) | 1 (0.3) | 0 (0.0) |
| Main Grocery Buyer (n (%)) | |||||
| Mainly me | 1055 (85.8) | 264 (86.6) | 256 (85.0) | 273 (88.1) | 251(84.2) |
| Mainly someone else | 23 (1.9) | 5 (7.5) | 7 (2.3) | 2 (0.6) | 9 (3.0) |
| Equally shared | 150 (12.2) | 36 (11.8) | 38 (12.6) | 35 (11.3) | 38 (12.8) |
| Highest Education Level (n (%)) | |||||
| Primary | 5 (0.4) | 2 (0.7) | 0 (0.0) | 1 (0.3) | 2 (0.7) |
| Secondary | 189 (15.4) | 43 (14.1) | 49 (16.3) | 47 (15.2) | 48 (16.1) |
| TAFE/Technical College | 402 (32.7) | 111 (36.4) | 98 (32.6) | 94 (30.3) | 95 (31.9) |
| University, undergraduate | 406 (33.0) | 94 (30.8) | 90 (29.9) | 112 (36.1) | 106 (35.6) |
| University, postgraduate | 226 (18.4) | 55 (18.0) | 64 (21.2) | 56 (18.1) | 47 (15.8) |
| SES Quintile (n (%)) | |||||
| 1 | 146 (11.8) | 37 (12.1) | 42 (14.0) | 29 (9.4) | 37 (12.4) |
| 2 | 195 (15.8) | 50 (16.4) | 49 (16.3) | 45 (14.5) | 48 (16.1) |
| 3 | 252 (20.5) | 68 (22.3) | 59 (19.6) | 59 (19.0) | 62 (20.8) |
| 4 | 272 (22.1) | 71 (23.3) | 63 (20.9) | 73 (23.5) | 61 (20.5) |
| 5 | 363 (29.6) | 79 (25.9) | 88 (29.2) | 104 (33.5) | 90 (30.2) |
| Label Recall (n (%)) | |||||
| Yes | 793 (65.8) | 211 (70.3) | 197 (66.1) | 213 (68.7) | 172 (57.9) |
| No | 80 (6.6) | 22 (7.3) | 20 (6.7) | 12 (3.9) | 26 (8.8) |
| Cannot Say | 332 (27.6) | 67 (22.3) | 81 (27.2) | 85 (27.4) | 99 (33.3) |
| Correct Recall | 382 (48.2) | 157 (67.4) | 62 (28.7) | 105 (46.7) | 58 (29.1) |
| Child | |||||
| Age (M (SD)) | |||||
| Years | 7.43 (2.31) | 7.45 (2.31) | 7.45 (2.30) | 7.46 (2.26) | 7.45 (2.30) |
| Age-group (n (%)) | |||||
| 4–7 yrs old | 602 (50) | 150 (50) | 149 (50) | 155 (50) | 148 (50) |
| 8–11 yrs old | 600 (50) | 149 (50) | 148 (50) | 154 (50) | 149 (50) |
| Gender (n (%)) | |||||
| Male | 666 (54.2) | 162 (53.1) | 162 (53.8) | 164 (52.9) | 171 (57.4) |
| Female | 558 (45.4) | 141 (46.2) | 138 (45.8) | 144 (46.5) | 127 (42.6) |
| Non-binary | 1 (0.1) | 0 (0.0) | 1 (0.3) | 0 (0.0) | 0 (0.0) |
| Prefer not to say | 4 (0.3) | 2 (0.6) | 0 (0.0) | 2 (0.6) | 0 (0.0) |
| Label Recall (n (%)) | |||||
| Yes | 636 (52.8) | 148 (49.5) | 159 (53.5) | 164 (52.9) | 165 (55.4) |
| No | 137 (35.8) | 39 (13.0) | 31 (10.4) | 30 (9.7) | 37 (12.4) |
| Cannot Say | 431 (11.4) | 112 (37.5) | 107 (36.0) | 116 (37.4) | 96 (32.2) |
| Correct Recall | 565 (73.1) | 149 (79.7) | 129 (67.9) | 145 (74.7) | 142 (70.6) |
| Condition | |||||||||
|---|---|---|---|---|---|---|---|---|---|
| HSR | Text-Based | Tooth Pictorial | Teaspoons of Sugar | ||||||
| Perception | η2 | M | SD | M | SD | M | SD | M | SD |
| Parent | (n= 298) | (n = 296) | (n = 309) | (n = 297) | |||||
| Easy to understand *,✝ | 0.03 | 5.55 | 1.27 | 6.08 a | 1.02 | 6.06 a | 1.19 | 5.90 a | 1.30 |
| Believable *,✝ | 0.06 | 5.20 | 1.41 | 5.96 a | 1.08 | 5.97 a | 1.19 | 5.75 a | 1.18 |
| Relevant to me *,✝ | 0.02 | 5.24 | 1.41 | 5.51 | 1.31 | 5.71 a | 1.18 | 5.58 | 1.20 |
| Made me stop and think *,✝ | 0.03 | 4.70 | 1.69 | 5.08 | 1.57 | 5.19 a | 1.61 | 5.50 a | 1.39 |
| Would talk to others about * | 0.04 | 4.16 | 1.73 | 4.67 a | 1.70 | 4.81 a | 1.63 | 5.13 a | 1.54 |
| Taught me something new *,✝ | 0.06 | 4.18 | 1.74 | 3.72 | 1.88 | 4.22 | 1.84 | 4.97 | 1.53 |
| Convincing *,✝ | 0.03 | 4.90 | 1.56 | 5.32 a | 1.33 | 5.43 a | 1.36 | 5.54 a | 1.22 |
| Made strong argument *,✝ | 0.03 | 4.90 | 1.62 | 5.43 a | 1.39 | 5.26 | 1.61 | 5.62 a | 1.35 |
| Made me feel concerned * | 0.07 | 4.25 | 1.56 | 4.94 a | 1.59 | 5.05 a | 1.55 | 5.45 ab | 1.39 |
| Effective *,✝ | 0.04 | 4.91 | 1.58 | 5.23 | 1.45 | 5.41 a | 1.44 | 5.67 a | 1.21 |
| Exaggerated | 0.01 | 3.66 | 1.58 | 3.37 | 1.69 | 3.65 | 1.72 | 3.37 | 1.59 |
| Children (4–7 yrs old) | (n = 150) | (n= 149) | (n= 155) | (n = 148) | |||||
| Easy to understand | 0.02 | 4.11 | 1.86 | 4.62 | 1.62 | 4.75 | 1.54 | 4.39 | 1.78 |
| Tells the truth | 0.01 | 4.79 | 1.45 | 5.17 | 1.16 | 5.00 | 1.34 | 5.02 | 1.28 |
| Matters to me | 0.01 | 4.06 | 1.74 | 4.44 | 1.50 | 4.27 | 1.59 | 4.26 | 1.76 |
| Made me stop and think | 0.01 | 3.69 | 1.90 | 4.29 | 1.69 | 4.14 | 1.69 | 4.08 | 1.76 |
| Would talk to others about | 0.01 | 3.88 | 1.86 | 4.32 | 1.69 | 4.24 | 1.74 | 4.26 | 1.79 |
| Taught me something new | 0.01 | 4.40 | 1.80 | 4.70 | 1.49 | 4.49 | 1.49 | 4.88 | 1.56 |
| Made me change my mind | 0.01 | 3.44 | 1.80 | 3.83 | 1.68 | 3.66 | 1.79 | 3.88 | 1.90 |
| Made strong argument | 0.02 | 4.31 | 1.82 | 4.99 | 1.45 | 4.55 | 1.63 | 4.70 | 1.61 |
| Made me feel worried * | 0.05 | 3.48 | 1.67 | 4.52 a | 1.52 | 4.12 | 1.65 | 4.20 a | 1.77 |
| Effective | 0.01 | 4.57 | 1.69 | 4.95 | 1.45 | 4.80 | 1.52 | 4.86 | 1.54 |
| Exaggerated | 0.01 | 3.46 | 1.63 | 3.74 | 1.41 | 3.70 | 1.46 | 3.94 | 1.52 |
| Children (8–11 yrs old) | (n = 149) | (n = 148) | (n = 154) | (n = 149) | |||||
| Easy to understand *,✝ | 0.08 | 4.79 | 1.57 | 5.57 a | 1.22 | 5.79 a | 0.99 | 5.21 | 1.43 |
| Tells the truth * | 0.04 | 4.91 | 1.23 | 5.37 | 1.23 | 5.51 a | 1.14 | 5.08 | 1.37 |
| Matters to me | 0.02 | 4.24 | 1.57 | 4.83 | 1.58 | 4.79 | 1.52 | 4.48 | 1.57 |
| Made me stop and think * | 0.03 | 4.14 | 1.71 | 4.75 | 1.58 | 4.81 | 1.61 | 4.67 | 1.59 |
| Would talk to others about | 0.01 | 3.77 | 1.77 | 4.09 | 1.79 | 4.25 | 1.64 | 4.09 | 1.73 |
| Taught me something new | 0.02 | 4.69 | 1.56 | 4.59 | 1.59 | 4.80 | 1.60 | 5.21 | 1.40 |
| Made me change my mind | 0.01 | 3.84 | 1.74 | 4.30 | 1.84 | 4.28 | 1.88 | 4.26 | 1.82 |
| Understand why I should drink less | 0.02 | 4.44 | 1.63 | 5.09 | 1.45 | 4.95 | 1.64 | 4.72 | 1.62 |
| Made me feel worried * | 0.03 | 3.72 | 1.63 | 4.45 a | 1.66 | 4.44 a | 1.73 | 4.32 | 1.71 |
| Effective | 0.01 | 4.90 | 1.28 | 5.06 | 1.39 | 5.25 | 1.39 | 5.03 | 1.50 |
| Exaggerated | 0.01 | 3.70 | 1.59 | 3.72 | 1.58 | 3.98 | 1.65 | 3.79 | 1.54 |
| Beverage Type | Pre-Label Exposure (N = 1229) | Condition | ||||
|---|---|---|---|---|---|---|
| HSR (n = 305) | Text-Based (n = 301) | Tooth Pictorial (n = 311) | Teaspoons of Sugar (n = 298) | |||
| Parents | Water | 322 (26.2) | 88 (28.9) | 95 (31.6) | 105 (33.8) | 96 (32.1) |
| NNS Beverage | 258 (21.0) | 70 (23.0) | 75 (24.9) | 72 (23.2) | 67 (22.4) | |
| Soft Drink | 237 (19.3) | 54 (17.7) | 43 (14.3) | 51 (16.4) | 47 (15.7) | |
| 100% Juice | 167 (13.6) | 40 (13.1) | 38 (12.6) | 32 (10.3) | 27 (9.0) | |
| Fruit Drink | 80 (6.5) | 18 (5.9) | 16 (5.3) | 11 (3.5) | 20 (6.7) | |
| Flavoured Milk | 70 (5.7) | 18 (5.9) | 17 (5.6) | 15 (4.8) | 18 (6.0) | |
| No Purchase | 63 (5.1) | 7 (2.3) | 7 (2.3) | 19 (6.1) | 18 (6.0) | |
| Full Cream Plain Milk | 32 (2.6) | 10 (3.3) | 10 (3.3) | 6 (1.9) | 5 (1.7) | |
| Beverage Type | Pre-Label Exposure (N = 1205) | Condition | ||||
|---|---|---|---|---|---|---|
| HSR (n = 299) | Text-Based (n = 297) | Tooth Pictorial (n = 310) | Teaspoons of Sugar (n = 298) | |||
| Children | Flavoured Milk | 316 (26.2) | 77 (25.8) | 80 (26.9) | 57 (18.4) | 64 (21.5) |
| 100% Juice | 241 (20.0) | 52 (17.4) | 36 (12.1) | 49 (15.8) | 58 (19.4) | |
| Soft Drink | 212 (17.6) | 49 (16.4) | 40 (13.4) | 35 (11.3) | 41 (13.8) | |
| Fruit Drink | 196 (16.3) | 46 (15.4) | 51 (17.2) | 40 (12.9) | 34 (11.4) | |
| Water | 107 (8.9) | 26 (8.7) | 33 (11.1) | 55 (17.7) | 44 (14.8) | |
| NNS Beverage | 82 (6.8) | 30 (10.0) | 33 (11.1) | 39 (12.6) | 35 (11.7) | |
| Full Cream Plain Milk | 32 (2.7) | 13 (4.3) | 20 (6.7) | 25 (8.1) | 17 (5.7) | |
| No Purchase | 19 (1.6) | 6 (2.0) | 4 (1.3) | 10 (3.2) | 5 (1.7) | |
| All respondents | Respondents Who Correctly Recalled the Label | ||||||
|---|---|---|---|---|---|---|---|
| Condition | Mean Change | SE | 95% CI [LL, UL] | Mean Change | SE | 95% CI [LL, UL] | |
| Parents | HSR | 0.37 * | 0.15 | [0.07, 0.67] | 0.48 * | 0.21 | [0.08, 0.89] |
| Text-based | 0.25 | 0.15 | [−0.05, 0.55] | −0.21 | 0.33 | [−0.85, 0.44] | |
| Tooth Pictorial | 0.54 *** | 0.15 | [0.24, 0.83] | 0.49 | 0.25 | [−0.01, 0.99] | |
| Teaspoons of Sugar | 0.20 | 0.16 | [−0.11, 0.50] | 1.38 *** | 0.34 | [0.72,2.04] | |
| Children | HSR | −0.01 | 0.12 | [−0.25, 0.23] | 0.22 | 0.17 | [−0.12, 0.56] |
| Text-based | 0.43 *** | 0.12 | [0.20, 0.67] | 0.47 * | 0.19 | [0.10, 0.83] | |
| Tooth Pictorial | 0.53 *** | 0.12 | [0.29, 0.76] | 0.55 ** | 0.18 | [0.20, 0.89] | |
| Teaspoons of Sugar | 0.62 *** | 0.12 | [0.38, 0.89] | 0.71 *** | 0.18 | [0.37, 1.06] | |
Disclaimer/Publisher’s Note: The statements, opinions and data contained in all publications are solely those of the individual author(s) and contributor(s) and not of MDPI and/or the editor(s). MDPI and/or the editor(s) disclaim responsibility for any injury to people or property resulting from any ideas, methods, instructions or products referred to in the content. |
© 2025 by the authors. Licensee MDPI, Basel, Switzerland. This article is an open access article distributed under the terms and conditions of the Creative Commons Attribution (CC BY) license (https://creativecommons.org/licenses/by/4.0/).
Share and Cite
Talati, Z.; McAlpine, T.; Mackenzie, K.; Myers, G.; Dana, L.M.; Charlesworth, J.; O’Connor, M.; Miller, C.; Mullan, B.A.; Dixon, H.G. Parent and Child Choice of Sugary Drinks Under Four Labelling Conditions. Nutrients 2025, 17, 1920. https://doi.org/10.3390/nu17111920
Talati Z, McAlpine T, Mackenzie K, Myers G, Dana LM, Charlesworth J, O’Connor M, Miller C, Mullan BA, Dixon HG. Parent and Child Choice of Sugary Drinks Under Four Labelling Conditions. Nutrients. 2025; 17(11):1920. https://doi.org/10.3390/nu17111920
Chicago/Turabian StyleTalati, Zenobia, Thomas McAlpine, Katlyn Mackenzie, Gael Myers, Liyuwork M. Dana, Jessica Charlesworth, Moira O’Connor, Caroline Miller, Barbara A. Mullan, and Helen G. Dixon. 2025. "Parent and Child Choice of Sugary Drinks Under Four Labelling Conditions" Nutrients 17, no. 11: 1920. https://doi.org/10.3390/nu17111920
APA StyleTalati, Z., McAlpine, T., Mackenzie, K., Myers, G., Dana, L. M., Charlesworth, J., O’Connor, M., Miller, C., Mullan, B. A., & Dixon, H. G. (2025). Parent and Child Choice of Sugary Drinks Under Four Labelling Conditions. Nutrients, 17(11), 1920. https://doi.org/10.3390/nu17111920