


Integrated Analysis of Genomic and Genome-Wide Association Studies Identified Candidate Genes for Nutrigenetic Studies in Flavonoids and Vascular Health: Path to Precision Nutrition for (Poly)phenols


Highlights
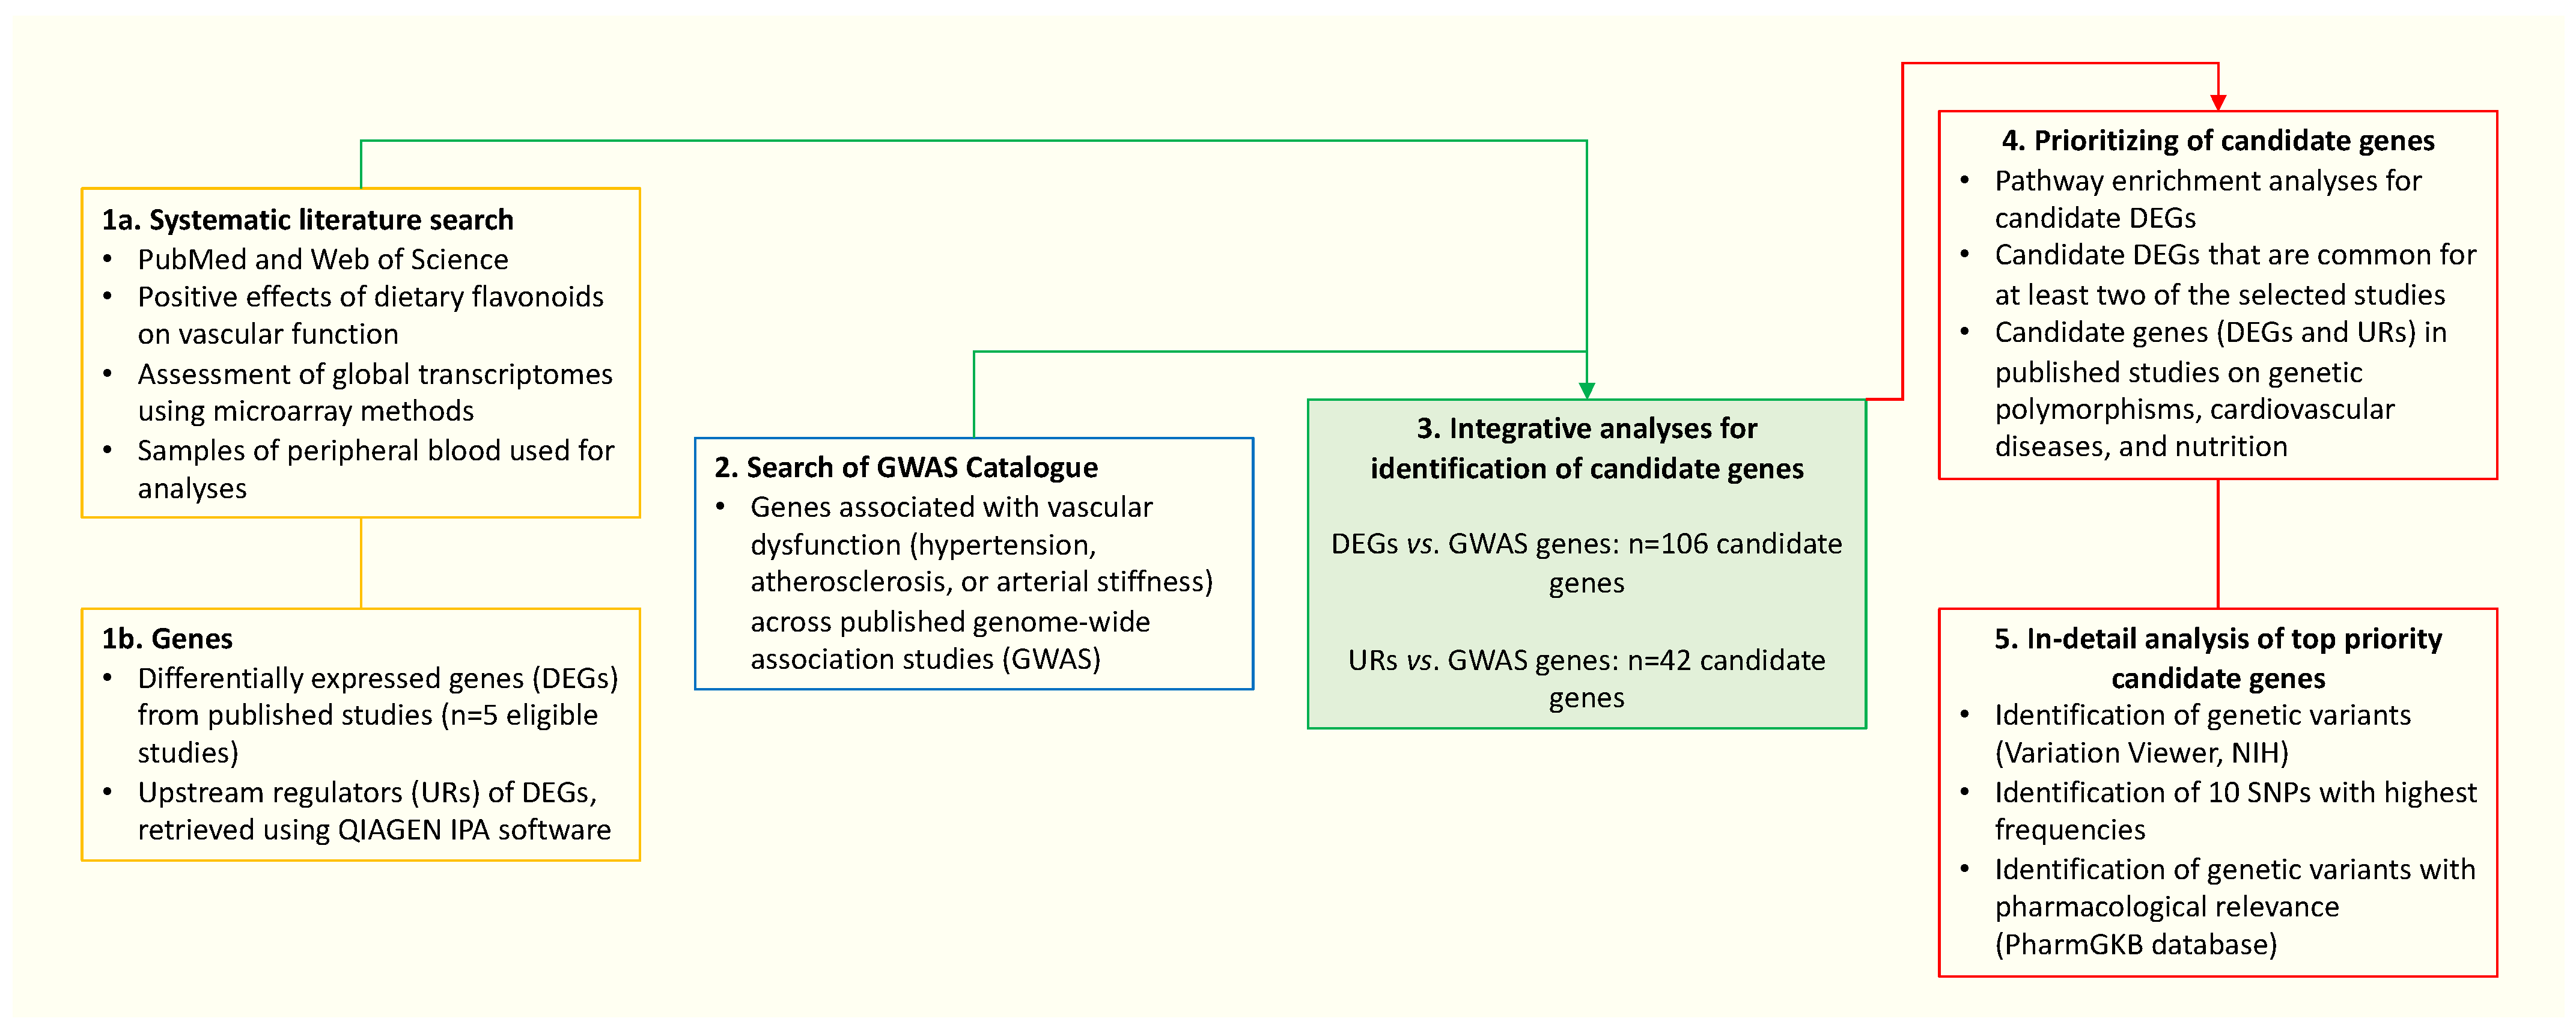
- An integrative analysis of flavonoid-intake-induced global genomic modulations (i.e., genomic data) with GWAS genes associated with vascular dysfunction (i.e., genetic data) identified more than a hundred genes directly governing the vasculoprotective health effects of flavonoids in humans.
- Subsequent functional analyses and literature searches identified the following top-priority genes: ALDH2, APOE, CAPZA1, CYP11B2, GNA13, IL6, IRF5, LDLR, LPL, LSP1, MKNK1, MMP3, MTHFR, MYO6, NCR3, PPARG, SARM1, TCF20, TCF7L2, and TNF.
- Polymorphisms in these genes may potentially determine the interindividual variabilities in the vasculoprotective effects of dietary flavonoids in humans, which should be examined in future well-designed human nutrigenetic studies that will include only individuals with high levels of circulating metabolites of the tested flavonoids.
- The results of this study provide key insights into the identification of gene variants associated with a better vascular response to dietary flavonoids in humans, thereby building the foundation for precision nutrition research in the field of (poly)phenols.
Abstract
1. Introduction
2. Materials and Methods
3. Results
3.1. Flavonoids Affect Global Gene Expression in Human Peripheral Blood Cells
3.1.1. General Overview of Selected Studies and DEGs
3.1.2. Upstream Regulators of DEGs
3.2. Identification of Genes Associated with Vascular Dysfunction from GWAS Studies
3.3. Integration of Transcriptomic Data with GWAS Identified Genes
Functional Analysis of Candidate DEGs
3.4. Identification of Candidate Genes for Nutrigenetic Studies among the URs of DEGs
3.5. Candidate Genes (DEGs and URs) in Published Studies on Genetic Polymorphisms, Cardiovascular Diseases, and Nutrition
3.6. Selection of Top-Priority Candidate Genes and Their Polymorphisms Potentially Associated with Flavonoids and Vascular Health
4. Discussion
5. Conclusions
Supplementary Materials
Author Contributions
Funding
Institutional Review Board Statement
Informed Consent Statement
Data Availability Statement
Conflicts of Interest
Acronyms
References
- Grosso, G.; Stepaniak, U.; Topor-Mądry, R.; Szafraniec, K.; Pająk, A. Estimated dietary intake and major food sources of polyphenols in the Polish arm of the HAPIEE study. Nutrition 2014, 30, 1398–1403. [Google Scholar] [CrossRef]
- Miranda, A.M.; Steluti, J.; Fisberg, R.M.; Marchioni, D.M. Dietary intake and food contributors of polyphenols in adults and elderly adults of Sao Paulo: A population-based study. Br. J. Nutr. 2016, 115, 1061–1070. [Google Scholar] [CrossRef]
- Huang, Q.; Braffett, B.H.; Simmens, S.J.; Young, H.A.; Ogden, C.L. Dietary Polyphenol Intake in US Adults and 10-Year Trends: 2007–2016. J. Acad. Nutr. Diet. 2020, 120, 1821–1833. [Google Scholar] [CrossRef]
- Del Rio, D.; Rodriguez-Mateos, A.; Spencer, J.P.; Tognolini, M.; Borges, G.; Crozier, A. Dietary (poly)phenolics in human health: Structures, bioavailability, and evidence of protective effects against chronic diseases. Antioxid. Redox Signal 2013, 18, 1818–1892. [Google Scholar] [CrossRef]
- Neveu, V.; Perez-Jiménez, J.; Vos, F.; Crespy, V.; du Chaffaut, L.; Mennen, L.; Knox, C.; Eisner, R.; Cruz, J.; Wishart, D.; et al. Phenol-Explorer: An online comprehensive database on polyphenol contents in foods. Database 2010, 2010, bap024. [Google Scholar] [CrossRef]
- Vivarelli, S.; Costa, C.; Teodoro, M.; Giambò, F.; Tsatsakis, A.M.; Fenga, C. Polyphenols: A route from bioavailability to bioactivity addressing potential health benefits to tackle human chronic diseases. Arch. Toxicol. 2023, 97, 3–38. [Google Scholar] [CrossRef]
- Guo, X.F.; Ruan, Y.; Li, Z.H.; Li, D. Flavonoid subclasses and type 2 diabetes mellitus risk: A meta-analysis of prospective cohort studies. Crit. Rev. Food Sci. Nutr. 2019, 59, 2850–2862. [Google Scholar] [CrossRef]
- Liu, F.; Sirisena, S.; Ng, K. Efficacy of flavonoids on biomarkers of type 2 diabetes mellitus: A systematic review and meta-analysis of randomized controlled trials. Crit. Rev. Food Sci. Nutr. 2023, 63, 4916–4941. [Google Scholar] [CrossRef]
- Kay, C.D.; Hooper, L.; Kroon, P.A.; Rimm, E.B.; Cassidy, A. Relative impact of flavonoid composition, dose and structure on vascular function: A systematic review of randomised controlled trials of flavonoid-rich food products. Mol. Nutr. Food Res. 2012, 56, 1605–1616. [Google Scholar] [CrossRef]
- Sesso, H.D.; Manson, J.E.; Aragaki, A.K.; Rist, P.M.; Johnson, L.G.; Friedenberg, G.; Copeland, T.; Clar, A.; Mora, S.; Moorthy, M.V.; et al. Effect of cocoa flavanol supplementation for the prevention of cardiovascular disease events: The COcoa Supplement and Multivitamin Outcomes Study (COSMOS) randomized clinical trial. Am. J. Clin. Nutr. 2022, 115, 1490–1500. [Google Scholar] [CrossRef]
- Bayram, B.; González-Sarrías, A.; Istas, G.; Garcia-Aloy, M.; Morand, C.; Tuohy, K.; García-Villalba, R.; Mena, P. Breakthroughs in the Health Effects of Plant Food Bioactives: A Perspective on Microbiomics, Nutri(epi)genomics, and Metabolomics. J. Agric. Food Chem. 2018, 66, 10686–10692. [Google Scholar] [CrossRef]
- Curtis, P.J.; Potter, J.; Kroon, P.A.; Wilson, P.; Dhatariya, K.; Sampson, M.; Cassidy, A. Vascular function and atherosclerosis progression after 1 y of flavonoid intake in statin-treated postmenopausal women with type 2 diabetes: A double-blind randomized controlled trial. Am. J. Clin. Nutr. 2013, 97, 936–942. [Google Scholar] [CrossRef]
- Morand, C.; Tomás-Barberán, F.A. Contribution of plant food bioactives in promoting health effects of plant foods: Why look at interindividual variability? Eur. J. Nutr. 2019, 58, 13–19. [Google Scholar] [CrossRef]
- Donato, A.J.; Machin, D.R.; Lesniewski, L.A. Mechanisms of Dysfunction in the Aging Vasculature and Role in Age-Related Disease. Circ. Res. 2018, 123, 825–848. [Google Scholar] [CrossRef]
- Barbosa, S.S.; Sousa, L.C.M.; de Oliveira Silva, D.F.; Pimentel, J.B.; Evangelista, K.; Lyra, C.O.; Lopes, M.; Lima, S. A Systematic Review on Processed/Ultra-Processed Foods and Arterial Hypertension in Adults and Older People. Nutrients 2022, 14, 1215. [Google Scholar] [CrossRef]
- Koenen, M.; Hill, M.A.; Cohen, P.; Sowers, J.R. Obesity, Adipose Tissue and Vascular Dysfunction. Circ. Res. 2021, 128, 951–968. [Google Scholar] [CrossRef]
- ALrefai, A.A.; Habib, M.S.; Yaseen, R.I.; Gabr, M.K.; Habeeb, R.M. Association of endothelial nitric oxide synthase (eNOS) gene G894T polymorphism with hypertension risk and complications. Mol. Cell Biochem. 2016, 421, 103–110. [Google Scholar] [CrossRef]
- Kim, M.P.; Wahl, L.M.; Yanek, L.R.; Becker, D.M.; Becker, L.C. A monocyte chemoattractant protein-1 gene polymorphism is associated with occult ischemia in a high-risk asymptomatic population. Atherosclerosis 2007, 193, 366–372. [Google Scholar] [CrossRef]
- George, T.W.; Waroonphan, S.; Niwat, C.; Gordon, M.H.; Lovegrove, J.A. The Glu298Asp single nucleotide polymorphism in the endothelial nitric oxide synthase gene differentially affects the vascular response to acute consumption of fruit and vegetable puree based drinks. Mol. Nutr. Food Res. 2012, 56, 1014–1024. [Google Scholar] [CrossRef]
- Fraga, L.N.; Milenkovic, D.; Coutinho, C.P.; Rozenbaum, A.C.; Lajolo, F.M.; Hassimotto, N.M.A. Interaction between APOE, APOA1, and LPL Gene Polymorphisms and Variability in Changes in Lipid and Blood Pressure following Orange Juice Intake: A Pilot Study. Mol. Nutr. Food Res. 2023, 67, e2200847. [Google Scholar] [CrossRef]
- Li, B.; Ritchie, M.D. From GWAS to Gene: Transcriptome-Wide Association Studies and Other Methods to Functionally Understand GWAS Discoveries. Front. Genet. 2021, 12, 713230. [Google Scholar] [CrossRef]
- Zhu, Z.; Zhang, F.; Hu, H.; Bakshi, A.; Robinson, M.R.; Powell, J.E.; Montgomery, G.W.; Goddard, M.E.; Wray, N.R.; Visscher, P.M.; et al. Integration of summary data from GWAS and eQTL studies predicts complex trait gene targets. Nat. Genet. 2016, 48, 481–487. [Google Scholar] [CrossRef]
- Hao, K.; Ermel, R.; Sukhavasi, K.; Cheng, H.; Ma, L.; Li, L.; Amadori, L.; Koplev, S.; Franzén, O.; d’Escamard, V.; et al. Integrative Prioritization of Causal Genes for Coronary Artery Disease. Circ. Genom. Precis. Med. 2022, 15, e003365. [Google Scholar] [CrossRef]
- Wang, B.; Lunetta, K.L.; Dupuis, J.; Lubitz, S.A.; Trinquart, L.; Yao, L.; Ellinor, P.T.; Benjamin, E.J.; Lin, H. Integrative Omics Approach to Identifying Genes Associated With Atrial Fibrillation. Circ. Res. 2020, 126, 350–360. [Google Scholar] [CrossRef]
- Ruskovska, T.; Budić-Leto, I.; Corral-Jara, K.F.; Ajdžanović, V.; Arola-Arnal, A.; Bravo, F.I.; Deligiannidou, G.E.; Havlik, J.; Janeva, M.; Kistanova, E.; et al. Systematic analysis of nutrigenomic effects of polyphenols related to cardiometabolic health in humans—Evidence from untargeted mRNA and miRNA studies. Ageing Res. Rev. 2022, 79, 101649. [Google Scholar] [CrossRef]
- Milenkovic, D.; Deval, C.; Dubray, C.; Mazur, A.; Morand, C. Hesperidin displays relevant role in the nutrigenomic effect of orange juice on blood leukocytes in human volunteers: A randomized controlled cross-over study. PLoS ONE 2011, 6, e26669. [Google Scholar] [CrossRef]
- Milenkovic, D.; Vanden Berghe, W.; Boby, C.; Leroux, C.; Declerck, K.; Szarc vel Szic, K.; Heyninck, K.; Laukens, K.; Bizet, M.; Defrance, M.; et al. Dietary flavanols modulate the transcription of genes associated with cardiovascular pathology without changes in their DNA methylation state. PLoS ONE 2014, 9, e95527. [Google Scholar] [CrossRef]
- Rodriguez-Mateos, A.; Istas, G.; Boschek, L.; Feliciano, R.P.; Mills, C.E.; Boby, C.; Gomez-Alonso, S.; Milenkovic, D.; Heiss, C. Circulating Anthocyanin Metabolites Mediate Vascular Benefits of Blueberries: Insights From Randomized Controlled Trials, Metabolomics, and Nutrigenomics. J. Gerontol. A Biol. Sci. Med. Sci. 2019, 74, 967–976. [Google Scholar] [CrossRef]
- Krga, I.; Corral-Jara, K.F.; Barber-Chamoux, N.; Dubray, C.; Morand, C.; Milenkovic, D. Grapefruit Juice Flavanones Modulate the Expression of Genes Regulating Inflammation, Cell Interactions and Vascular Function in Peripheral Blood Mononuclear Cells of Postmenopausal Women. Front. Nutr. 2022, 9, 907595. [Google Scholar] [CrossRef] [PubMed]
- Milenkovic, D.; Rodriguez-Mateos, A.; Lucosz, M.; Istas, G.; Declerck, K.; Sansone, R.; Deenen, R.; Köhrer, K.; Corral-Jara, K.F.; Altschmied, J.; et al. Flavanol Consumption in Healthy Men Preserves Integrity of Immunological-Endothelial Barrier Cell Functions: Nutri(epi)genomic Analysis. Mol. Nutr. Food Res. 2022, 66, e2100991. [Google Scholar] [CrossRef] [PubMed]
- Buniello, A.; MacArthur, J.A.L.; Cerezo, M.; Harris, L.W.; Hayhurst, J.; Malangone, C.; McMahon, A.; Morales, J.; Mountjoy, E.; Sollis, E.; et al. The NHGRI-EBI GWAS Catalog of published genome-wide association studies, targeted arrays and summary statistics 2019. Nucleic Acids Res 2019, 47, D1005–D1012. [Google Scholar] [CrossRef] [PubMed]
- Gerstner, N.; Kehl, T.; Lenhof, K.; Müller, A.; Mayer, C.; Eckhart, L.; Grammes, N.L.; Diener, C.; Hart, M.; Hahn, O.; et al. GeneTrail 3: Advanced high-throughput enrichment analysis. Nucleic Acids Res. 2020, 48, W515–W520. [Google Scholar] [CrossRef]
- Kanehisa, M.; Goto, S. KEGG: Kyoto encyclopedia of genes and genomes. Nucleic Acids Res. 2000, 28, 27–30. [Google Scholar] [CrossRef]
- Agrawal, A.; Balcı, H.; Hanspers, K.; Coort, S.L.; Martens, M.; Slenter, D.N.; Ehrhart, F.; Digles, D.; Waagmeester, A.; Wassink, I.; et al. WikiPathways 2024: Next generation pathway database. Nucleic Acids Res 2024, 52, D679–D689. [Google Scholar] [CrossRef]
- Slenter, D.N.; Kutmon, M.; Hanspers, K.; Riutta, A.; Windsor, J.; Nunes, N.; Mélius, J.; Cirillo, E.; Coort, S.L.; Digles, D.; et al. WikiPathways: A multifaceted pathway database bridging metabolomics to other omics research. Nucleic Acids Res. 2018, 46, D661–D667. [Google Scholar] [CrossRef] [PubMed]
- Heberle, H.; Meirelles, G.V.; da Silva, F.R.; Telles, G.P.; Minghim, R. InteractiVenn: A web-based tool for the analysis of sets through Venn diagrams. BMC Bioinform. 2015, 16, 169. [Google Scholar] [CrossRef] [PubMed]
- Whirl-Carrillo, M.; Huddart, R.; Gong, L.; Sangkuhl, K.; Thorn, C.F.; Whaley, R.; Klein, T.E. An Evidence-Based Framework for Evaluating Pharmacogenomics Knowledge for Personalized Medicine. Clin. Pharmacol. Ther. 2021, 110, 563–572. [Google Scholar] [CrossRef]
- Whirl-Carrillo, M.; McDonagh, E.M.; Hebert, J.M.; Gong, L.; Sangkuhl, K.; Thorn, C.F.; Altman, R.B.; Klein, T.E. Pharmacogenomics knowledge for personalized medicine. Clin. Pharmacol. Ther. 2012, 92, 414–417. [Google Scholar] [CrossRef]
- Stelzer, G.; Rosen, N.; Plaschkes, I.; Zimmerman, S.; Twik, M.; Fishilevich, S.; Stein, T.I.; Nudel, R.; Lieder, I.; Mazor, Y.; et al. The GeneCards Suite: From Gene Data Mining to Disease Genome Sequence Analyses. Curr. Protoc. Bioinform. 2016, 54, 1.30.31–31.30.33. [Google Scholar] [CrossRef]
- Morand, C.; Dubray, C.; Milenkovic, D.; Lioger, D.; Martin, J.F.; Scalbert, A.; Mazur, A. Hesperidin contributes to the vascular protective effects of orange juice: A randomized crossover study in healthy volunteers. Am. J. Clin. Nutr. 2011, 93, 73–80. [Google Scholar] [CrossRef]
- Weseler, A.R.; Ruijters, E.J.; Drittij-Reijnders, M.J.; Reesink, K.D.; Haenen, G.R.; Bast, A. Pleiotropic benefit of monomeric and oligomeric flavanols on vascular health--a randomized controlled clinical pilot study. PLoS ONE 2011, 6, e28460. [Google Scholar] [CrossRef]
- Sansone, R.; Rodriguez-Mateos, A.; Heuel, J.; Falk, D.; Schuler, D.; Wagstaff, R.; Kuhnle, G.G.; Spencer, J.P.; Schroeter, H.; Merx, M.W.; et al. Cocoa flavanol intake improves endothelial function and Framingham Risk Score in healthy men and women: A randomised, controlled, double-masked trial: The Flaviola Health Study. Br. J. Nutr. 2015, 114, 1246–1255. [Google Scholar] [CrossRef] [PubMed]
- Habauzit, V.; Verny, M.A.; Milenkovic, D.; Barber-Chamoux, N.; Mazur, A.; Dubray, C.; Morand, C. Flavanones protect from arterial stiffness in postmenopausal women consuming grapefruit juice for 6 mo: A randomized, controlled, crossover trial. Am. J. Clin. Nutr. 2015, 102, 66–74. [Google Scholar] [CrossRef] [PubMed]
- El-Sohemy, A. Nutrigenetics. Forum Nutr. 2007, 60, 25–30. [Google Scholar] [CrossRef] [PubMed]
- Cornelis, M.C.; El-Sohemy, A.; Kabagambe, E.K.; Campos, H. Coffee, CYP1A2 genotype, and risk of myocardial infarction. JAMA 2006, 295, 1135–1141. [Google Scholar] [CrossRef] [PubMed]
- Guest, N.; Corey, P.; Vescovi, J.; El-Sohemy, A. Caffeine, CYP1A2 Genotype, and Endurance Performance in Athletes. Med. Sci. Sports Exerc. 2018, 50, 1570–1578. [Google Scholar] [CrossRef]
- Mahdavi, S.; Palatini, P.; El-Sohemy, A. CYP1A2 Genetic Variation, Coffee Intake, and Kidney Dysfunction. JAMA Netw. Open 2023, 6, e2247868. [Google Scholar] [CrossRef] [PubMed]
- Tam, V.; Patel, N.; Turcotte, M.; Bossé, Y.; Paré, G.; Meyre, D. Benefits and limitations of genome-wide association studies. Nat. Rev. Genet. 2019, 20, 467–484. [Google Scholar] [CrossRef]
- Sollis, E.; Mosaku, A.; Abid, A.; Buniello, A.; Cerezo, M.; Gil, L.; Groza, T.; Güneş, O.; Hall, P.; Hayhurst, J.; et al. The NHGRI-EBI GWAS Catalog: Knowledgebase and deposition resource. Nucleic Acids Res. 2023, 51, D977–D985. [Google Scholar] [CrossRef]
- Cano-Gamez, E.; Trynka, G. From GWAS to Function: Using Functional Genomics to Identify the Mechanisms Underlying Complex Diseases. Front. Genet. 2020, 11, 424. [Google Scholar] [CrossRef]
- Zhu, M.; Zhao, S. Candidate gene identification approach: Progress and challenges. Int. J. Biol. Sci. 2007, 3, 420–427. [Google Scholar] [CrossRef] [PubMed]
- Ueno, K.; Aiba, Y.; Hitomi, Y.; Shimoda, S.; Nakamura, H.; Gervais, O.; Kawai, Y.; Kawashima, M.; Nishida, N.; Kohn, S.S.; et al. Integrated GWAS and mRNA Microarray Analysis Identified IFNG and CD40L as the Central Upstream Regulators in Primary Biliary Cholangitis. Hepatol. Commun. 2020, 4, 724–738. [Google Scholar] [CrossRef] [PubMed]
- Milenkovic, D.; Deval, C.; Gouranton, E.; Landrier, J.F.; Scalbert, A.; Morand, C.; Mazur, A. Modulation of miRNA expression by dietary polyphenols in apoE deficient mice: A new mechanism of the action of polyphenols. PLoS ONE 2012, 7, e29837. [Google Scholar] [CrossRef] [PubMed]
- Williamson, G.; Clifford, M.N. Colonic metabolites of berry polyphenols: The missing link to biological activity? Br. J. Nutr. 2010, 104 (Suppl. S3), S48–S66. [Google Scholar] [CrossRef] [PubMed]
- Saxena, R.; Gianniny, L.; Burtt, N.P.; Lyssenko, V.; Giuducci, C.; Sjögren, M.; Florez, J.C.; Almgren, P.; Isomaa, B.; Orho-Melander, M.; et al. Common single nucleotide polymorphisms in TCF7L2 are reproducibly associated with type 2 diabetes and reduce the insulin response to glucose in nondiabetic individuals. Diabetes 2006, 55, 2890–2895. [Google Scholar] [CrossRef] [PubMed]
- Lyssenko, V.; Lupi, R.; Marchetti, P.; Del Guerra, S.; Orho-Melander, M.; Almgren, P.; Sjögren, M.; Ling, C.; Eriksson, K.F.; Lethagen, A.L.; et al. Mechanisms by which common variants in the TCF7L2 gene increase risk of type 2 diabetes. J. Clin. Investig. 2007, 117, 2155–2163. [Google Scholar] [CrossRef] [PubMed]
- Huertas-Vazquez, A.; Plaisier, C.; Weissglas-Volkov, D.; Sinsheimer, J.; Canizales-Quinteros, S.; Cruz-Bautista, I.; Nikkola, E.; Herrera-Hernandez, M.; Davila-Cervantes, A.; Tusie-Luna, T.; et al. TCF7L2 is associated with high serum triacylglycerol and differentially expressed in adipose tissue in families with familial combined hyperlipidaemia. Diabetologia 2008, 51, 62–69. [Google Scholar] [CrossRef] [PubMed]
- Perez-Martinez, P.; Perez-Caballero, A.I.; Garcia-Rios, A.; Yubero-Serrano, E.M.; Camargo, A.; Gomez-Luna, M.J.; Marin, C.; Gomez-Luna, P.; Dembinska-Kiec, A.; Rodriguez-Cantalejo, F.; et al. Effects of rs7903146 variation in the Tcf7l2 gene in the lipid metabolism of three different populations. PLoS ONE 2012, 7, e43390. [Google Scholar] [CrossRef] [PubMed]
- Li, J.; Zhou, L.; Ouyang, X.; He, P. Transcription Factor-7-Like-2 (TCF7L2) in Atherosclerosis: A Potential Biomarker and Therapeutic Target. Front. Cardiovasc. Med. 2021, 8, 701279. [Google Scholar] [CrossRef]
- Kononov, S.; Mal, G.; Azarova, I.; Klyosova, E.; Bykanova, M.; Churnosov, M.; Polonikov, A. Pharmacogenetic loci for rosuvastatin are associated with intima-media thickness change and coronary artery disease risk. Pharmacogenomics 2022, 23, 15–34. [Google Scholar] [CrossRef]
- Gouissem, I.; Midani, F.; Soualmia, H.; Bouchemi, M.; Ouali, S.; Kallele, A.; Romdhane, N.B.; Mourali, M.S.; Feki, M. Contribution of the ACE (rs1799752) and CYP11B2 (rs1799998) Gene Polymorphisms to Atrial Fibrillation in the Tunisian Population. Biol. Res. Nurs. 2022, 24, 31–39. [Google Scholar] [CrossRef] [PubMed]
- Liu, M.; Sariya, S.; Khasiyev, F.; Tosto, G.; Dueker, N.D.; Cheung, Y.K.; Wright, C.B.; Sacco, R.L.; Rundek, T.; Elkind, M.S.V.; et al. Genetic determinants of intracranial large artery stenosis in the northern Manhattan study. J. Neurol. Sci. 2022, 436, 120218. [Google Scholar] [CrossRef] [PubMed]
- Azova, M.; Timizheva, K.; Ait Aissa, A.; Blagonravov, M.; Gigani, O.; Aghajanyan, A.; Tskhovrebova, L. Gene Polymorphisms of the Renin-Angiotensin-Aldosterone System as Risk Factors for the Development of In-Stent Restenosis in Patients with Stable Coronary Artery Disease. Biomolecules 2021, 11, 763. [Google Scholar] [CrossRef] [PubMed]
- He, Q.; Pan, J.; Wang, L.; Fang, Y.; Hu, R. Prospective study: Aldehyde dehydrogenase 2 gene is associated with cardio-cerebrovascular complications in type 2 diabetes patients. J. Diabetes Investig. 2021, 12, 1845–1854. [Google Scholar] [CrossRef] [PubMed]
- Zhong, S.; Li, L.; Liang, N.; Zhang, L.; Xu, X.; Chen, S.; Yin, H. Acetaldehyde Dehydrogenase 2 regulates HMG-CoA reductase stability and cholesterol synthesis in the liver. Redox Biol. 2021, 41, 101919. [Google Scholar] [CrossRef] [PubMed]
- Miranda, A.M.; Steluti, J.; Norde, M.M.; Fisberg, R.M.; Marchioni, D.M. The association between genetic risk score and blood pressure is modified by coffee consumption: Gene-diet interaction analysis in a population-based study. Clin. Nutr. 2019, 38, 1721–1728. [Google Scholar] [CrossRef]
- Jiang, Y.; Sun-Waterhouse, D.; Chen, Y.; Li, F.; Li, D. Epigenetic mechanisms underlying the benefits of flavonoids in cardiovascular health and diseases: Are long non-coding RNAs rising stars? Crit. Rev. Food Sci. Nutr. 2022, 62, 3855–3872. [Google Scholar] [CrossRef] [PubMed]
- Rajendran, P.; Abdelsalam, S.A.; Renu, K.; Veeraraghavan, V.; Ben Ammar, R.; Ahmed, E.A. Polyphenols as Potent Epigenetics Agents for Cancer. Int. J. Mol. Sci. 2022, 23, 11712. [Google Scholar] [CrossRef]
- Dechamethakun, S.; Muramatsu, M. Long noncoding RNA variations in cardiometabolic diseases. J. Hum. Genet. 2017, 62, 97–104. [Google Scholar] [CrossRef]

| Paper | Title and Reference | Study Population | Bioactives | Outcomes | Associated Paper for Outcomes |
|---|---|---|---|---|---|
| 1. | Hesperidin displays relevant role in the nutrigenomic effect of orange juice on blood leukocytes in human volunteers: a randomized controlled cross-over study [26] | Healthy, middle-aged, moderately overweight men | Hesperidin | Decreased diastolic blood pressure | Hesperidin contributes to the vascular protective effects of orange juice: a randomized crossover study in healthy volunteers [40] |
| 2. | Dietary flavanols modulate the transcription of genes associated with cardiovascular pathology without changes in their DNA methylation state [27] | Non-obese, healthy male smokers, smoking 10 and more cigarettes per day for at least 5 years | Monomeric and oligomeric flavanols from grape seeds | Improved vascular health index | Pleiotropic benefit of monomeric and oligomeric flavanols on vascular health: a randomized controlled clinical pilot study [41] |
| 3. | Circulating anthocyanin metabolites mediate vascular benefits of blueberries: insights from randomized controlled trials, metabolomics, and nutrigenomics [28] | Healthy male volunteers | Wild blueberry anthocyanins | Increased flow-mediated vasodilatation Decreased 24 h systolic blood pressure | / |
| 4. | Flavanol consumption in healthy men preserves integrity of immunological–endothelial barrier cell functions: nutri(epi)genomic analysis [30] | Healthy middle-aged men | Cocoa flavanols | Increased flow-mediated vasodilatation Decreased systolic and diastolic blood pressure Decreased pulse wave velocity | Cocoa flavanol intake improves endothelial function and Framingham Risk Score in healthy men and women: a randomised, controlled, double-masked trial: the Flaviola Health Study [42] |
| 5. | Grapefruit juice flavanones modulate the expression of genes regulating inflammation, cell interactions and vascular function in peripheral blood mononuclear cells of postmenopausal women [29] | Healthy, non-smoking women, 3 to 10 years after menopause | Grapefruit juice flavanones | Decreased carotid–femoral pulse wave velocity | Flavanones protect from arterial stiffness in postmenopausal women consuming grapefruit juice for 6 mo: a randomized, controlled, crossover trial [43] |
| Canonical Pathways | Number of Hits | Genes |
|---|---|---|
| Pathways directly involved in vascular dysfunction | ||
| VEGFA-VEGFR2 Signaling Pathway * | 6 | CSK, MKNK1, MYO6, PTPRJ, SMARCA2, TNXB |
| Regulation of actin cytoskeleton ** | 4 | BRK1, CSK, GNA13, SOS2 |
| Adherens junction | 3 | PTPRJ, TCF7L2, YES1 |
| Angiopoietin Like Protein 8 Regulatory Pathway * | 3 | LPL, PRKAG2, SOS2 |
| ECM-receptor interaction | 3 | NPNT, TNXB, VTN |
| Focal adhesion | 3 | SOS2, TNXB, VTN |
| Apelin signaling pathway | 2 | GNA13, PRKAG2 |
| Cholesterol metabolism | 2 | LDLR, LPL |
| Composition of Lipid Particles * | 2 | LDLR, LPL |
| Fluid shear stress and atherosclerosis | 2 | BMPR1B, GSTA4 |
| Glycerolipid metabolism | 2 | ALDH2, LPL |
| Metabolic pathway of LDL, HDL and TG, including diseases * | 2 | LDLR, LPL |
| Platelet activation | 2 | GNA13, LYN |
| Statin Pathway * | 2 | LDLR, LPL |
| Pathways involved in inflammation | ||
| Chemokine signaling pathway ** | 3 | CSK, LYN, SOS2 |
| Cytokine-cytokine receptor interaction | 3 | BMPR1B, GDF10, LTB |
| NF-kappa B signaling pathway ** | 3 | LTB, LYN, TAB2 |
| Regulation of toll-like receptor signaling pathway * | 3 | IRF5, SARM1, TAB2 |
| B cell receptor signaling pathway | 2 | LYN, SOS2 |
| Interleukin-11 Signaling Pathway * | 2 | FES, YES1 |
| Natural killer cell mediated cytotoxicity | 2 | NCR3, SOS2 |
| Structural Pathway of Interleukin 1 (IL-1) * | 2 | MKNK1, TAB2 |
| TNF signaling pathway | 2 | DAB2IP, TAB2 |
| Toll-like receptor signaling pathway ** | 2 | IRF5, TAB2 |
| Cell signaling pathways | ||
| MAPK signaling pathway ** | 4 | MKNK1, SOS2, STK3, TAB2 |
| PI3K-Akt signaling pathway ** | 4 | MCL1, SOS2, TNXB, VTN |
| EGF/EGFR Signaling Pathway * | 3 | CSK, SOS2, TWIST1 |
| Insulin signaling pathway | 3 | MKNK1, PRKAG2, SOS2 |
| Sterol Regulatory Element-Binding Proteins (SREBP) signalling * | 3 | LDLR, LPL, PRKAG2 |
| cGMP-PKG signaling pathway | 2 | ATP2B1, GNA13 |
| FoxO signaling pathway | 2 | PRKAG2, SOS2 |
| Jak-STAT signaling pathway | 2 | MCL1, SOS2 |
| Phospholipase D signaling pathway | 2 | GNA13, SOS2 |
| Wnt Signaling Pathway and Pluripotency * | 2 | LDLR, TCF7L2 |
| Antioxidant protection | ||
| NRF2 pathway * | 2 | GSTA4, SLC39A8 |
| Gene | Variant Type (Number) | Molecular Consequences (Number) | Most Severe Clinical Significance (Number) | Number of Associations with Pharmacological Significance | 10 Variants with Highest Frequencies | ||||
|---|---|---|---|---|---|---|---|---|---|
| Variant ID | Molecular Consequences | Alleles | Alleles with Highest Frequencies | Frequency | |||||
| ALDH2 | single nucleotide variant (172) deletion (3) insertion (2) indel (22) | missense variant (1) intron variant (131) 3 prime UTR variant (27) 500 B downstream variant (1) 2 KB upstream variant (14) | pathogenic (1) | 9 | rs7296651 rs6489793 rs2106697 rs10774638 rs886205 rs4767939 rs10774637 rs9971942 rs10774639 rs11066028 | intron variant 3 prime UTR variant not specified intron variant 2 KB upstream variant intron variant intron variant not specified not specified intron variant | C,A,G T,G T,A,C,G T,A,C A,C,G,T A,G C,G,T C,T G,A,C,T A,C,G,T | C T T T A G T T A A | 0.497804 0.497604 0.496406 0.492612 0.491214 0.419728 0.419129 0.410743 0.410743 0.372804 |
| APOE | single nucleotide variant (8) | missense variant (3) synonymous variant (1) intron variant (4) 5 prime UTR variant (1) 500 B downstream variant (1) 2 KB upstream variant (1) | pathogenic (2) drug-response (2) | 33 | rs405509 rs440446 rs769450 rs429358 rs7412 rs769449 rs1081105 rs877973 | 2 KB upstream variant missense variant, intron variant, synonymous variant intron variant missense variant missense variant intron variant 500 B downstream variant 5 prime UTR variant, intron variant | T,G C,G,T G,A T,C C,T G,A A,C,G C,A,T | T C A C T A C A | 0.471845 0.373802 0.327276 0.150559 0.0750799 0.0648962 0.0301518 0.0159744 |
| CAPZA1 | single nucleotide variant (136) deletion (1) insertion (1) indel (26) | missense variant (1) synonymous variant (2) intron variant (149) nc transcript variant (1) 5 prime UTR variant (3) 3 prime UTR variant (1) 500 B downstream variant (2) 2 KB upstream variant (22) | / | / | rs3013440 rs7524494 rs7415820 rs3103450 rs2932536 rs3013439 rs12046329 rs12046466 rs12046208 rs9429486 | intron variant intron variant intron variant intron variant intron variant intron variant intron variant intron variant intron variant intron variant | G,A A,G,T G,A G,A,T G,A,T T,A,G T,A,C,G T,A,C C,T T,A,C,G | G A G G G T T T T T | 0.478435 0.478435 0.478035 0.478035 0.478035 0.477835 0.477835 0.477835 0.436502 0.435703 |
| CYP11B2 | single nucleotide variant (86) insertion (2) indel (3) | missense variant (9) synonymous variant (6) intron variant (66) 3 prime UTR variant (7) 500 B downstream variant (2) 2 KB upstream variant (5) | pathogenic (1) association (1) benign (17) | 3 | rs10110732 rs28615142 rs28366703 rs13263682 rs6421 rs79201878 rs80062072 rs74838461 rs28394055 rs6429 | intron variant intron variant intron variant intron variant intron variant intron variant intron variant intron variant intron variant intron variant | C,T T,C A,G A,C T,C A,T A,G T,C C,T G,A,C,T | C C G C C T G C T C | 0.495208 0.483227 0.482628 0.479433 0.460064 0.45607 0.45607 0.45607 0.445887 0.44389 |
| GNA13 | single nucleotide variant (164) deletion (2) insertion (1) indel (18) | missense variant (2) synonymous variant (1) intron variant (133) 5 prime UTR variant (2) 3 prime UTR variant (11) 500 B downstream variant (1) 2 KB upstream variant (6) | / | / | rs9911189 rs2011307 rs6504271 rs12944877 rs12939956 rs7501452 rs3960369 rs8082708 rs12945514 rs4791243 | intron variant intron variant intron variant intron variant not specified not specified not specified intron variant intron variant intron variant | A,G C,T C,T G,A,C,T C,T T,C C,A,G,T T,C G,C,T T,A,C,G | A C C G C T C T G T | 0.440096 0.244209 0.244209 0.238618 0.236621 0.235024 0.234026 0.233826 0.228235 0.228035 |
| IL6 | single nucleotide variant (38) insertion (1) indel (3) | missense variant (4) synonymous variant (2) intron variant (27) nc transcript variant (5) 3 prime UTR variant (6) 500 B downstream variant (10) 2 KB upstream variant (16) | risk-factor (1) benign (2) | 11 | rs7802308 rs34328912 rs1800796 rs1524107 rs2066992 rs2069845 rs1554606 rs2069840 rs1474347 rs367801961 | intron variant 500 B downstream variant nc transcript variant, intron variant intron variant, 2 KB upstream variant intron variant, 2 KB upstream variant 3 prime UTR variant, intron variant intron variant, 2 KB upstream variant intron variant, 2 KB upstream variant intron variant, 2 KB upstream variant 500 B downstream variant | T,A A,C,T G,A,C C,G,T G,A,C,T G,A,C,T T,A,G C,G C,A,G G,A,T | A C C T T G T G C A | 0.454473 0.336062 0.313898 0.308307 0.308107 0.252596 0.249401 0.185503 0.168331 0.167133 |
| IRF5 | single nucleotide variant (59) indel (6) | intron variant (44) splice donor variant (1) 5 prime UTR variant (8) 3 prime UTR variant (6) 500 B downstream variant (3) 2 KB upstream variant (4) | risk-factor (2) benign (1) | / | rs3757385 rs3807135 rs752637 rs3757388 rs10954213 rs13242262 rs7808907 rs11770589 rs1874327 rs10954214 | 5 prime UTR variant intron variant intron variant 2 KB upstream variant 3 prime UTR variant not specified intron variant 3 prime UTR variant intron variant 3 prime UTR variant | T,G T,C T,A,C G,A G,A A,G,T T,C G,A,C,T A,C,T C,T | T T T A G A C A A C | 0.497604 0.49361 0.491014 0.471845 0.464058 0.463858 0.460264 0.453474 0.400559 0.399561 |
| LDLR | single nucleotide variant (297) deletion (1) indel (41) | missense variant (4) nonsense (stop gained) (1) synonymous variant (8) intron variant (232) nc transcript variant (41) 3 prime UTR variant (28) 500 B downstream variant (11) 2 KB upstream variant (19) | pathogenic (1) conflicting-interpretations-of-pathogenicity (1) uncertain-significance (2) likely-benign (8) benign-likely-benign (7) benign (30) | 5 | rs17248931 rs73017023 rs73017025 rs4804145 rs8102912 rs2738459 rs10422256 rs3180023 rs2738456 rs2738458 | intron variant intron variant intron variant intron variant intron variant intron variant intron variant nc transcript variant, 3 prime UTR variant intron variant intron variant | G,A,C A,T A,G G,A G,A,C A,C,G,T G,A,C,T C,A,G,T T,A,C T,C,G | A T G A A A A C C C | 0.453674 0.453474 0.453275 0.451278 0.446486 0.425519 0.421526 0.41274 0.40655 0.40635 |
| LPL | single nucleotide variant (196) deletion (2) indel (18) | missense variant (1) nonsense (stop gained) (1) synonymous variant (3) intron variant (161) 3 prime UTR variant (16) 500 B downstream variant (6) 2 KB upstream variant (9) | other (1) association (2) likely-benign (1) benign (21) | 3 | rs253 rs1534649 rs10104051 rs2197089 rs258 rs285 rs314 rs301 rs326 rs56321069 | intron variant intron variant intron variant not specified intron variant intron variant intron variant intron variant intron variant intron variant | C,G,T G,A,T C,T G,A G,A,C,T C,G,T G,A T,C A,G T,A,G | C T T G G C A C G A | 0.487819 0.480032 0.476038 0.457867 0.440695 0.439297 0.390176 0.381989 0.349441 0.346246 |
| LSP1 | single nucleotide variant (269) deletion (2) insertion (1) indel (18) | missense variant (4) synonymous variant (2) intron variant (238) nc transcript variant (1) 5 prime UTR variant (10) 3 prime UTR variant (2) 500 B downstream variant (8) 2 KB upstream variant (42) | / | / | rs7396311 rs810021 rs28971510 rs1092608 rs542605 rs10734623 rs517101 rs3781961 rs3817197 rs7122680 | not specified not specified not specified not specified intron variant intron variant intron variant intron variant intron variant intron variant | A,G G,A,C,T G,A,C,T T,A,G A,C,G,T C,T A,G,T C,G,T G,A,C G,A,C,T | G G G T A T A C G C | 0.499002 0.482628 0.48143 0.480831 0.479633 0.475639 0.470647 0.449081 0.447484 0.447284 |
| MKNK1 | single nucleotide variant (200) deletion (2) indel (28) | missense variant (2) synonymous variant (4) intron variant (206) nc transcript variant (14) 5 prime UTR variant (35) 3 prime UTR variant (6) 500 B downstream variant (9) 2 KB upstream variant (17) | / | / | rs11211303 rs3766243 rs7543083 rs1258049 rs2181414 rs3766240 rs11211319 rs11211320 rs12022855 rs12136479 | intron variant intron variant intron variant intron variant intron variant intron variant, 500 B downstream variant intron variant intron variant intron variant intron variant | T,A,C A,G,T G,A G,A,T T,A,C G,A,C,T T,A,C T,C,G C,T A,C,G,T | C T A A T G T T C A | 0.496006 0.49381 0.49361 0.479633 0.472244 0.446086 0.413339 0.413339 0.390375 0.380791 |
| MMP3 | single nucleotide variant (37) deletion (1) indel (2) | missense variant (2) nonsense (stop gained) (1) synonymous variant (4) intron variant (32) nc transcript variant (3) 3 prime UTR variant (2) 500 B downstream variant (1) 2 KB upstream variant (3) | benign (6) | 4 | rs650108 rs538161727 rs639752 rs602128 rs575027 rs520540 rs678815 rs591058 rs679620 rs617819 | intron variant intron variant nc transcript variant, intron variant missense variant, synonymous variant intron variant, 500 B downstream variant synonymous variant intron variant intron variant missense variant, nonsense (stop gained) 2 KB upstream variant | G,A,T C,A,T C,A,T A,C,G A,C,G,T A,G,T G,A,C,T T,A,C T,A,C,G C,A,G | A T C A A A G T T C | 0.442692 0.390974 0.385383 0.38139 0.378994 0.377596 0.35643 0.355232 0.347843 0.347244 |
| MTHFR | single nucleotide variant (133) insertion (1) indel (17) | missense variant (13) nonsense (stop gained) (1) synonymous variant (7) intron variant (134) nc transcript variant (10) 5 prime UTR variant (10) 3 prime UTR variant (23) 500 B downstream variant (5) 2 KB upstream variant (24) | pathogenic (1) likely-pathogenic (1) other (1) uncertain-significance (1) benign (5) | 139 | rs10864543 rs4846052 rs6541005 rs3737966 rs1994798 rs7526128 rs6541003 rs4846049 rs11586659 rs2151655 | synonymous variant intron variant intron variant 3 prime UTR variant, intron variant intron variant intron variant intron variant 3 prime UTR variant, 500 B downstream variant intron variant intron variant, 500 B downstream variant | C,G,T T,A,C A,T C,A,G,T G,A C,A,G,T G,A,C T,A,G T,A,C,G G,A,C,T | T T A C G C G T T G | 0.498003 0.492612 0.452276 0.441494 0.420727 0.417931 0.408946 0.371605 0.345248 0.294329 |
| MYO6 | single nucleotide variant (701) deletion (8) insertion (3) indel (104) | missense variant (6) synonymous variant (3) intron variant (715) nc transcript variant (29) 5 prime UTR variant (1) 3 prime UTR variant (28) 500 B downstream variant (2) 2 KB upstream variant (10) | uncertain-significance (2) likely-benign (15) benign (14) | / | rs276696 rs9360941 rs2748949 rs2842550 rs2647404 rs9360958 rs7742137 rs2842554 rs6920348 rs6903077 | intron variant intron variant not specified 2 KB upstream variant intron variant intron variant nc transcript variant, 3 prime UTR variant not specified intron variant intron variant | C,T A,G,T C,A,G G,A,T G,A A,C,G C,A,T C,A,T T,A,G A,C,G | C A G A A A C C G G | 0.48103 0.476238 0.471645 0.470847 0.470847 0.465455 0.449481 0.422324 0.421526 0.421526 |
| NCR3 | single nucleotide variant (27) deletion (1) indel (3) | missense variant (2) synonymous variant (4) intron variant (17) nc transcript variant (2) 5 prime UTR variant (2) 3 prime UTR variant (5) 500 B downstream variant (5) 2 KB upstream variant (4) | risk-factor (1) | / | rs1052248 rs2736191 rs2736190 rs3087617 rs986475 rs11575842 rs3896375 rs41268892 rs11575836 rs41268888 | nc transcript variant, 3 prime UTR variant, 500 B downstream variant 2 KB upstream variant 2 KB upstream variant nc transcript variant, 3 prime UTR variant, 500 B downstream variant 3 prime UTR variant, 500 B downstream variant intron variant intron variant intron variant 5 prime UTR variant intron variant | T,A,C C,G T,A,C,G A,T A,G,T G,A G,A G,A,C A,G G,C | A G T T G A A A G C | 0.301717 0.228235 0.174121 0.105232 0.104832 0.0782748 0.0778754 0.0778754 0.0776757 0.0760783 |
| PPARG | single nucleotide variant (633) deletion (8) insertion (1) indel (65) | missense variant (1) synonymous variant (1) intron variant (556) 5 prime UTR variant (4) 3 prime UTR variant (27) 500 B downstream variant (2) 2 KB upstream variant (6) | likely-benign (2) | 7 | rs147070788 rs7618026 rs7618046 rs17819328 rs1152003 rs4684104 rs10602803 rs4684854 rs2960420 rs2959269 | not specified not specified not specified not specified not specified not specified not specified not specified not specified intron variant | G,A,T T,C T,A,C T,A,G G,C A,C,G,T G,A,T G,A,C,T C,G T,A,C | A C C G C A A C G C | 0.495407 0.491414 0.491014 0.489816 0.480232 0.478035 0.460863 0.458866 0.457867 0.455471 |
| SARM1 | single nucleotide variant (70) deletion (1) indel (10) | intron variant (64) 5 prime UTR variant (1) 3 prime UTR variant (17) 500 B downstream variant (1) 2 KB upstream variant (9) | uncertain-significance (1) benign (11) | / | rs2027993 rs967645 rs2239911 rs2239907 rs7212349 rs7212510 rs2239908 rs4795434 rs4795433 rs4794828 | intron variant intron variant 3 prime UTR variant 3 prime UTR variant 2 KB upstream variant intron variant 3 prime UTR variant intron variant intron variant intron variant | G,C,T C,A,G,T G,C,T T,A,C,G T,A,C T,A G,A,C,T G,T C,A,G,T G,A,T | G C G T T T G G C G | 0.469449 0.46845 0.466054 0.451478 0.423522 0.405351 0.394768 0.394369 0.389776 0.389177 |
| TCF20 | single nucleotide variant (496) deletion (6) insertion (4) indel (67) | missense variant (5) synonymous variant (5) intron variant (438) nc transcript variant (7) splice donor variant (1) 5 prime UTR variant (4) 3 prime UTR variant (2) 500 B downstream variant (7) 2 KB upstream variant (36) | benign (4) | / | rs134885 rs134886 rs760648 rs134867 rs134899 rs134891 rs134889 rs134888 rs6002655 rs86669 | intron variant intron variant intron variant intron variant not specified intron variant intron variant intron variant intron variant 2 KB upstream variant | C,A,G,T A,C,G,T G,A,C,T T,A,C T,A,G T,C A,C,G,T C,G,T C,A,G,T C,G,T | C A A T T T A C C T | 0.47484 0.474641 0.467252 0.462061 0.460264 0.454273 0.453275 0.448083 0.441693 0.439497 |
| TCF7L2 | single nucleotide variant (846) deletion (11) insertion (9) indel (129) | missense variant (4) frameshift variant (1) synonymous variant (1) intron variant (844) 5 prime UTR variant (6) 3 prime UTR variant (8) 500 B downstream variant (5) 2 KB upstream variant (15) | drug-response (1) risk-factor (2) benign (2) | 14 | rs720785 rs7918976 rs11196171 rs11196170 rs2296784 rs720784 rs7897438 rs290476 rs10885399 rs61875109 | intron variant not specified intron variant intron variant intron variant intron variant intron variant intron variant intron variant intron variant | G,A,C C,A,G,T A,C,G G,A,C,T T,C A,C,G,T C,A,G,T G,A,C,T T,A,G C,A,G,T | G A A G T A A T A A | 0.499401 0.498602 0.495607 0.494609 0.494409 0.49401 0.478235 0.477835 0.477436 0.477236 |
| TNF | single nucleotide variant (9) indel (4) | synonymous variant (1) intron variant (7) 3 prime UTR variant (1) 500 B downstream variant (1) 2 KB upstream variant (3) | benign (1) | 39 | rs1800610 rs3093662 rs3093664 rs361525 rs3093661 rs673 rs3093665 rs2228088 rs41297589 | intron variant intron variant intron variant 2 KB upstream variant intron variant 2 KB upstream variant 3 prime UTR variant synonymous variant 2 KB upstream variant | G,A A,G A,G G,A G,A,C G,A A,C G,A,C,T T,A | A G G A A A C T A | 0.100439 0.0798722 0.0788738 0.0609026 0.0521166 0.0191693 0.01877 0.0175719 0.0105831 |
| Variant and Risk Allele | Mapped Gene/s in GWAS | Gene: Consequence in dbSNP | Global Frequency in 1000 Genomes | Associated Trait in GWAS | SNP Identified in GWAS | Gene Identified in Flavonoid Study/-ies | Number of Citations in dbSNP |
|---|---|---|---|---|---|---|---|
| rs671; A | ALDH2 | ALDH2: Missense Variant | A = 0.0357 | Hypertension | GCST011141 | ALDH2: DEG in Paper 1 | 293 |
| rs445925; G rs445925; A | APOE (also APOC1) APOE (also APOC1) | APOC1: 2KB Upstream Variant APOC1: 2KB Upstream Variant | G = 0.8502 A = 0.1498 | Atherosclerosis Atherosclerosis | GCST001231 GCST001231 | APOE: UR in Papers 1, 4, and 5 | 28 |
| rs10745332; A rs17030613; A | CAPZA1 CAPZA1 | CAPZA1: Intron Variant CAPZA1: Intron Variant | A = 0.8131 A = 0.7678 | Hypertension Hypertension | GCST002627 GCST007707 | CAPZA1: DEG in Papers 2, 3, and 4 | 0 2 |
| rs62524579; A rs12679242; T rs6418; A rs1799998; G | CYP11B2 (also LY6E-DT) CYP11B2 CYP11B2 (also GML) CYP11B2 (also LY6E-DT) | None CYP11B2: Intron Variant CYP11B2: Intron Variant CYP11B2: 2KB Upstream Variant | A = 0.4794 T = 0.3470 A = 0.6450 G = 0.3472 | Hypertension Hypertension Hypertension Hypertension | GCST007707 GCST007707 GCST007707 GCST011141 | CYP11B2: UR in Paper 4 | 1 0 0 35 |
| rs12941507; C | GNA13 (also AMZ2P1) | None | C = 0.0647 | Hypertension | GCST011952; GCST011953 | GNA13: DEG in Papers 2 and 3 | 0 |
| rs4722172; G | IL6 (also MTCYBP42) | None | G = 0.0595 | Atherosclerosis | GCST008474; GCST90061371 | IL6: UR in Papers 4 and 5 | 1 |
| rs4728142; A | IRF5 (also KCP) | None | A = 0.2945 | Hypertension | GCST006023 | IRF5: DEG in Paper 5; UR in Papers 4 and 5 | 54 |
| rs6511720; T rs138294113; C | LDLR LDLR (also SMARCA4) | LDLR: Intron Variant; LDLR-AS1: 2KB Upstream Variant None | T = 0.0917 C = 0.9095 | Atherosclerosis Atherosclerosis | GCST001231 GCST008474; GCST90061371 | LDLR: DEG in Paper 1; UR in Papers 2 and 5 | 73 0 |
| rs322; A | LPL | LPL: Intron Variant | A = 0.7079 | Atherosclerosis | GCST008474; GCST90061371 | LPL: DEG in Paprer 2 | 0 |
| rs1973765; T rs569550; T rs661348; T rs4980389; A | LSP1 LSP1 LSP1 LSP1 | LSP1: Intron Variant LSP1: Intron Variant * LSP1: Intron Variant LSP1: Intron Variant ** | T = 0.5641 T = 0.5765 T = 0.6182 A = 0.4267 | Hypertension Hypertension Hypertension Hypertension | GCST007707 GCST007707 GCST007707 GCST007707 | LSP1: DEG in Papers 3 and 4; UR in Paper 5 | 0 1 7 0 |
| rs139537100; C | MKNK1 (also MOB3C) | MOB3C: Intron Variant *** Allele Frequency Aggregator | C = 0.999938 | Hypertension | GCST010477 | MKNK1: DEG in Paper 4; UR in Paper 4 | 0 |
| rs566125; T | MMP3 | MMP3: Intron Variant | T = 0.0755 | Atherosclerosis | GCST008474; GCST90061371 | MMP3: UR in Paper 4 | 2 |
| rs17367504; not reported | MTHFR | MTHFR: Intron Variant | / | Hypertension | GCST009685 | MTHFR: DEG in Paper 5 | 33 |
| rs3798440; A x rs9350602; C | no mapped genes x MYO6 (SNP x SNP interaction) | rs3798440; MYO6: Intron Variant **** rs9350602; MYO6: Intron Variant **** | rs3798440; A = not present rs9350602; C = 0.8972 | Hypertension | GCST001085 | MYO6: DEG in Paper 4; UR in Paper 5 | 0 0 |
| rs2515920; T | NCR3 (also UQCRHP1) | NCR3: 2KB Upstream Variant | T = 0.0495 | Hypertension | GCST010477 | NCR3: DEG in Papers 2 and 5; UR in Paper 5 | 0 |
| rs17036160; C | PPARG | PPARG: Intron Variant ***** | C = 0.9319 | Arterial stiffness | GCST008403 | PPARG: UR in Papers 4 and 5 | 3 |
| rs704; A | SARM1 (also VTN) | VTN: Missense Variant | A = 0.5551 | Hypertension | GCST90000064 | SARM1: DEG in Papers 4 and 5 | 9 |
| rs17478227; not reported | TCF20 | TCF20: Intron Variant | / | Arterial stiffness | GCST007846 | TCF20: DEG in Papers 1 and 4; UR in Paper 4 | 1 |
| rs7903146; T | TCF7L2 | TCF7L2: Intron Variant ****** | T = 0.2278 | Atherosclerosis | GCST008474; GCST90061371 | TCF7L2: DEG in Paper 1; UR in Papers 3 and 4 | 660 |
| rs769177; G | TNF (also LTB) | None | rs769177; G = not present | Hypertension | GCST010477 | TNF: UR in Papers 2, 4 and 5 | 7 |
Disclaimer/Publisher’s Note: The statements, opinions and data contained in all publications are solely those of the individual author(s) and contributor(s) and not of MDPI and/or the editor(s). MDPI and/or the editor(s) disclaim responsibility for any injury to people or property resulting from any ideas, methods, instructions or products referred to in the content. |
© 2024 by the authors. Licensee MDPI, Basel, Switzerland. This article is an open access article distributed under the terms and conditions of the Creative Commons Attribution (CC BY) license (https://creativecommons.org/licenses/by/4.0/).
Share and Cite
Ruskovska, T.; Postolov, F.; Milenkovic, D. Integrated Analysis of Genomic and Genome-Wide Association Studies Identified Candidate Genes for Nutrigenetic Studies in Flavonoids and Vascular Health: Path to Precision Nutrition for (Poly)phenols. Nutrients 2024, 16, 1362. https://doi.org/10.3390/nu16091362
Ruskovska T, Postolov F, Milenkovic D. Integrated Analysis of Genomic and Genome-Wide Association Studies Identified Candidate Genes for Nutrigenetic Studies in Flavonoids and Vascular Health: Path to Precision Nutrition for (Poly)phenols. Nutrients. 2024; 16(9):1362. https://doi.org/10.3390/nu16091362
Chicago/Turabian StyleRuskovska, Tatjana, Filip Postolov, and Dragan Milenkovic. 2024. "Integrated Analysis of Genomic and Genome-Wide Association Studies Identified Candidate Genes for Nutrigenetic Studies in Flavonoids and Vascular Health: Path to Precision Nutrition for (Poly)phenols" Nutrients 16, no. 9: 1362. https://doi.org/10.3390/nu16091362
APA StyleRuskovska, T., Postolov, F., & Milenkovic, D. (2024). Integrated Analysis of Genomic and Genome-Wide Association Studies Identified Candidate Genes for Nutrigenetic Studies in Flavonoids and Vascular Health: Path to Precision Nutrition for (Poly)phenols. Nutrients, 16(9), 1362. https://doi.org/10.3390/nu16091362