


Soy Product Consumption and the Risk of Cancer: A Systematic Review and Meta-Analysis of Observational Studies

Abstract
1. Introduction
2. Materials and Methods
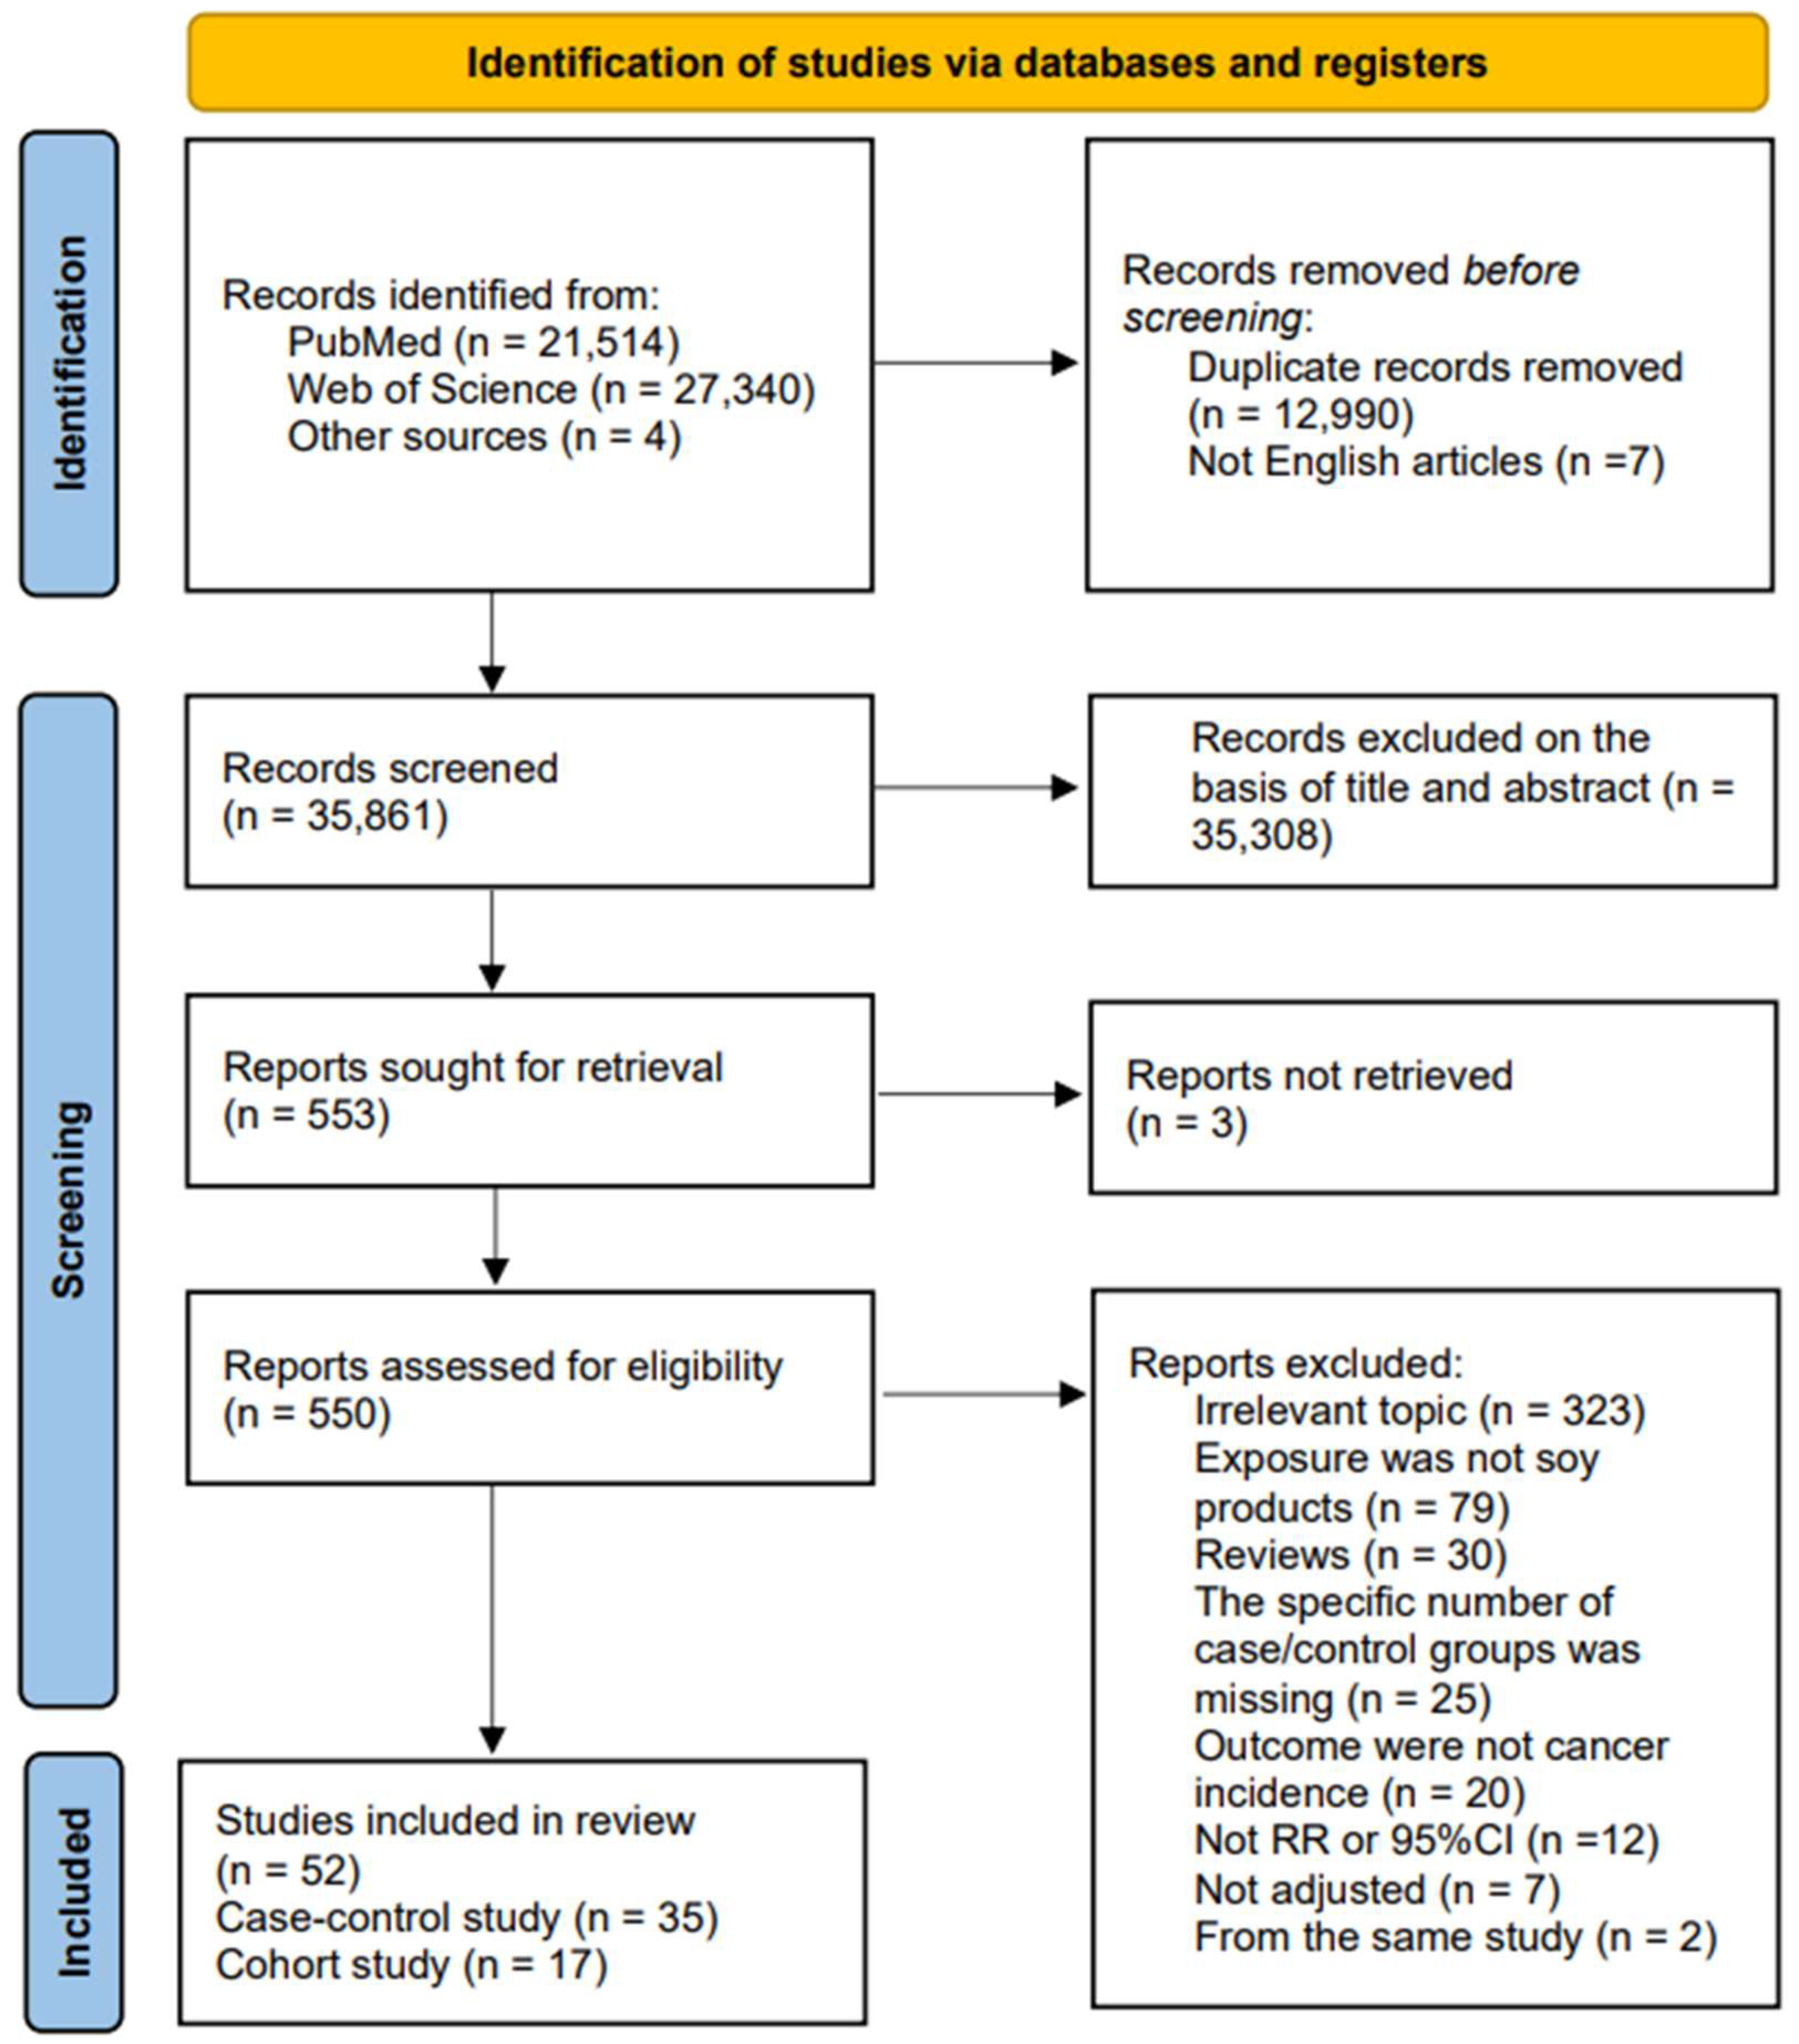
2.1. Literature Search
2.2. Study Selection and Exclusion Criteria
2.3. Date Extraction and Quality Assessment
2.4. Statistical Analysis
3. Result
3.1. Study Characteristics
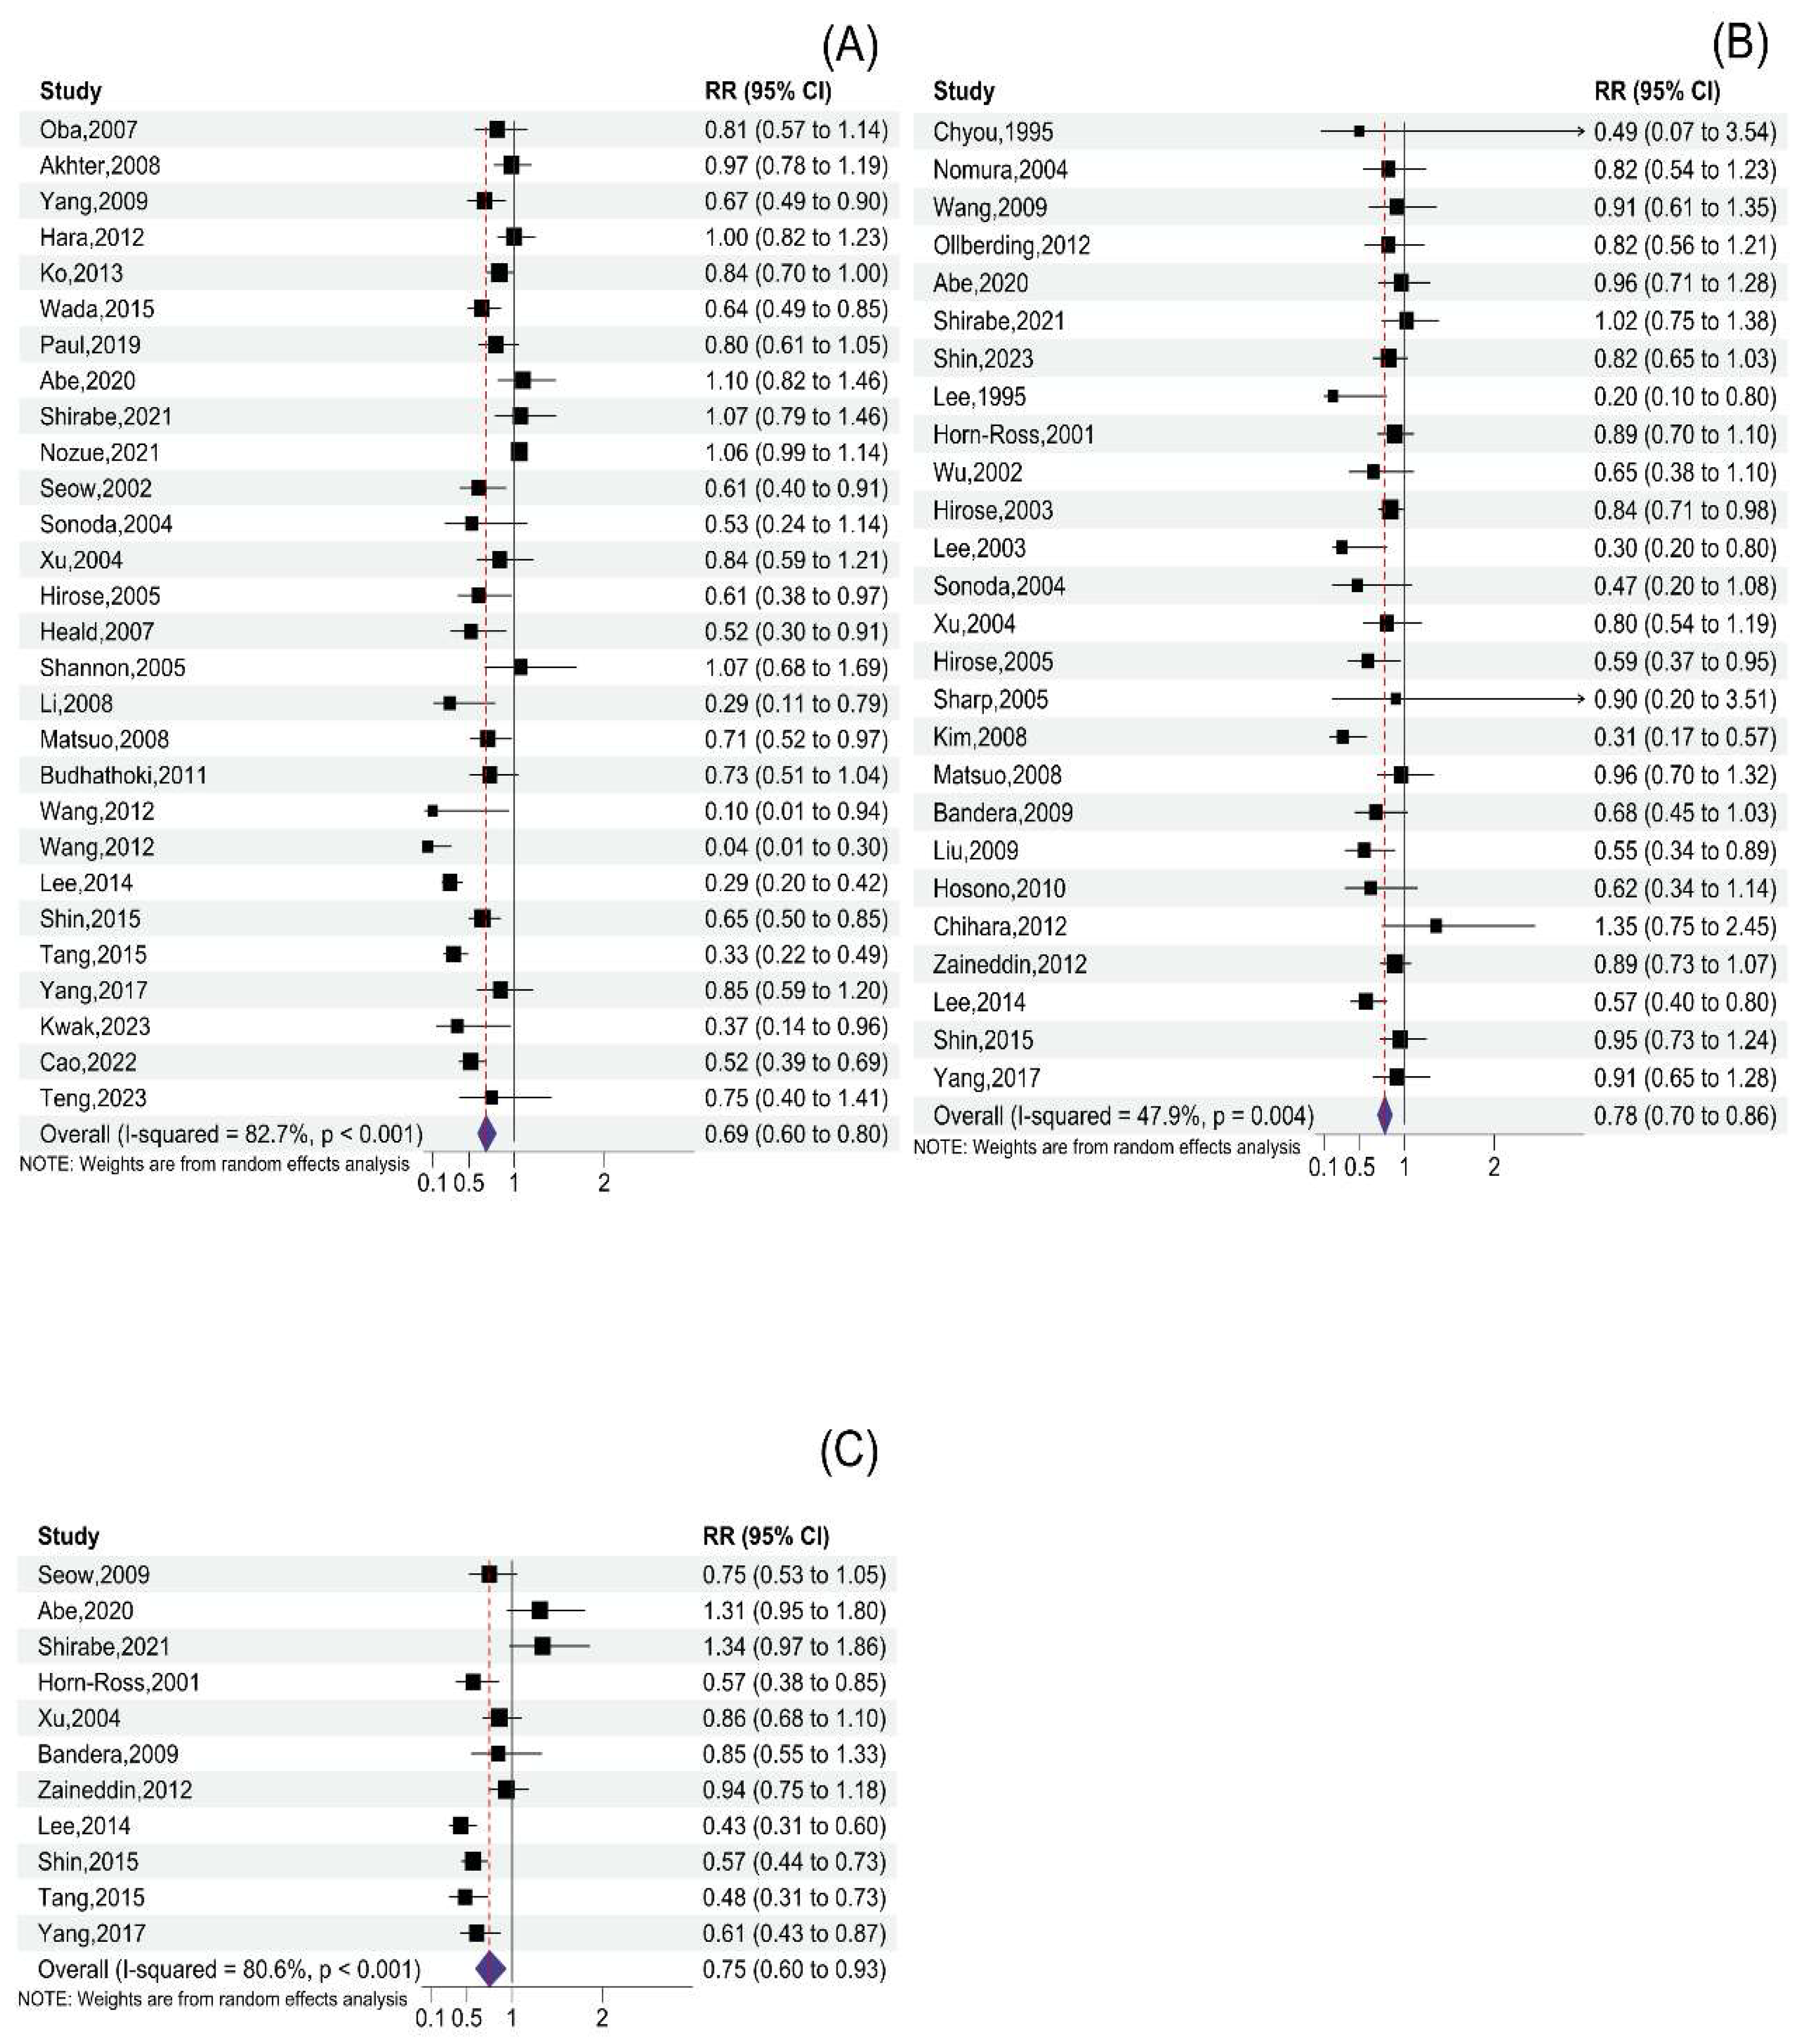
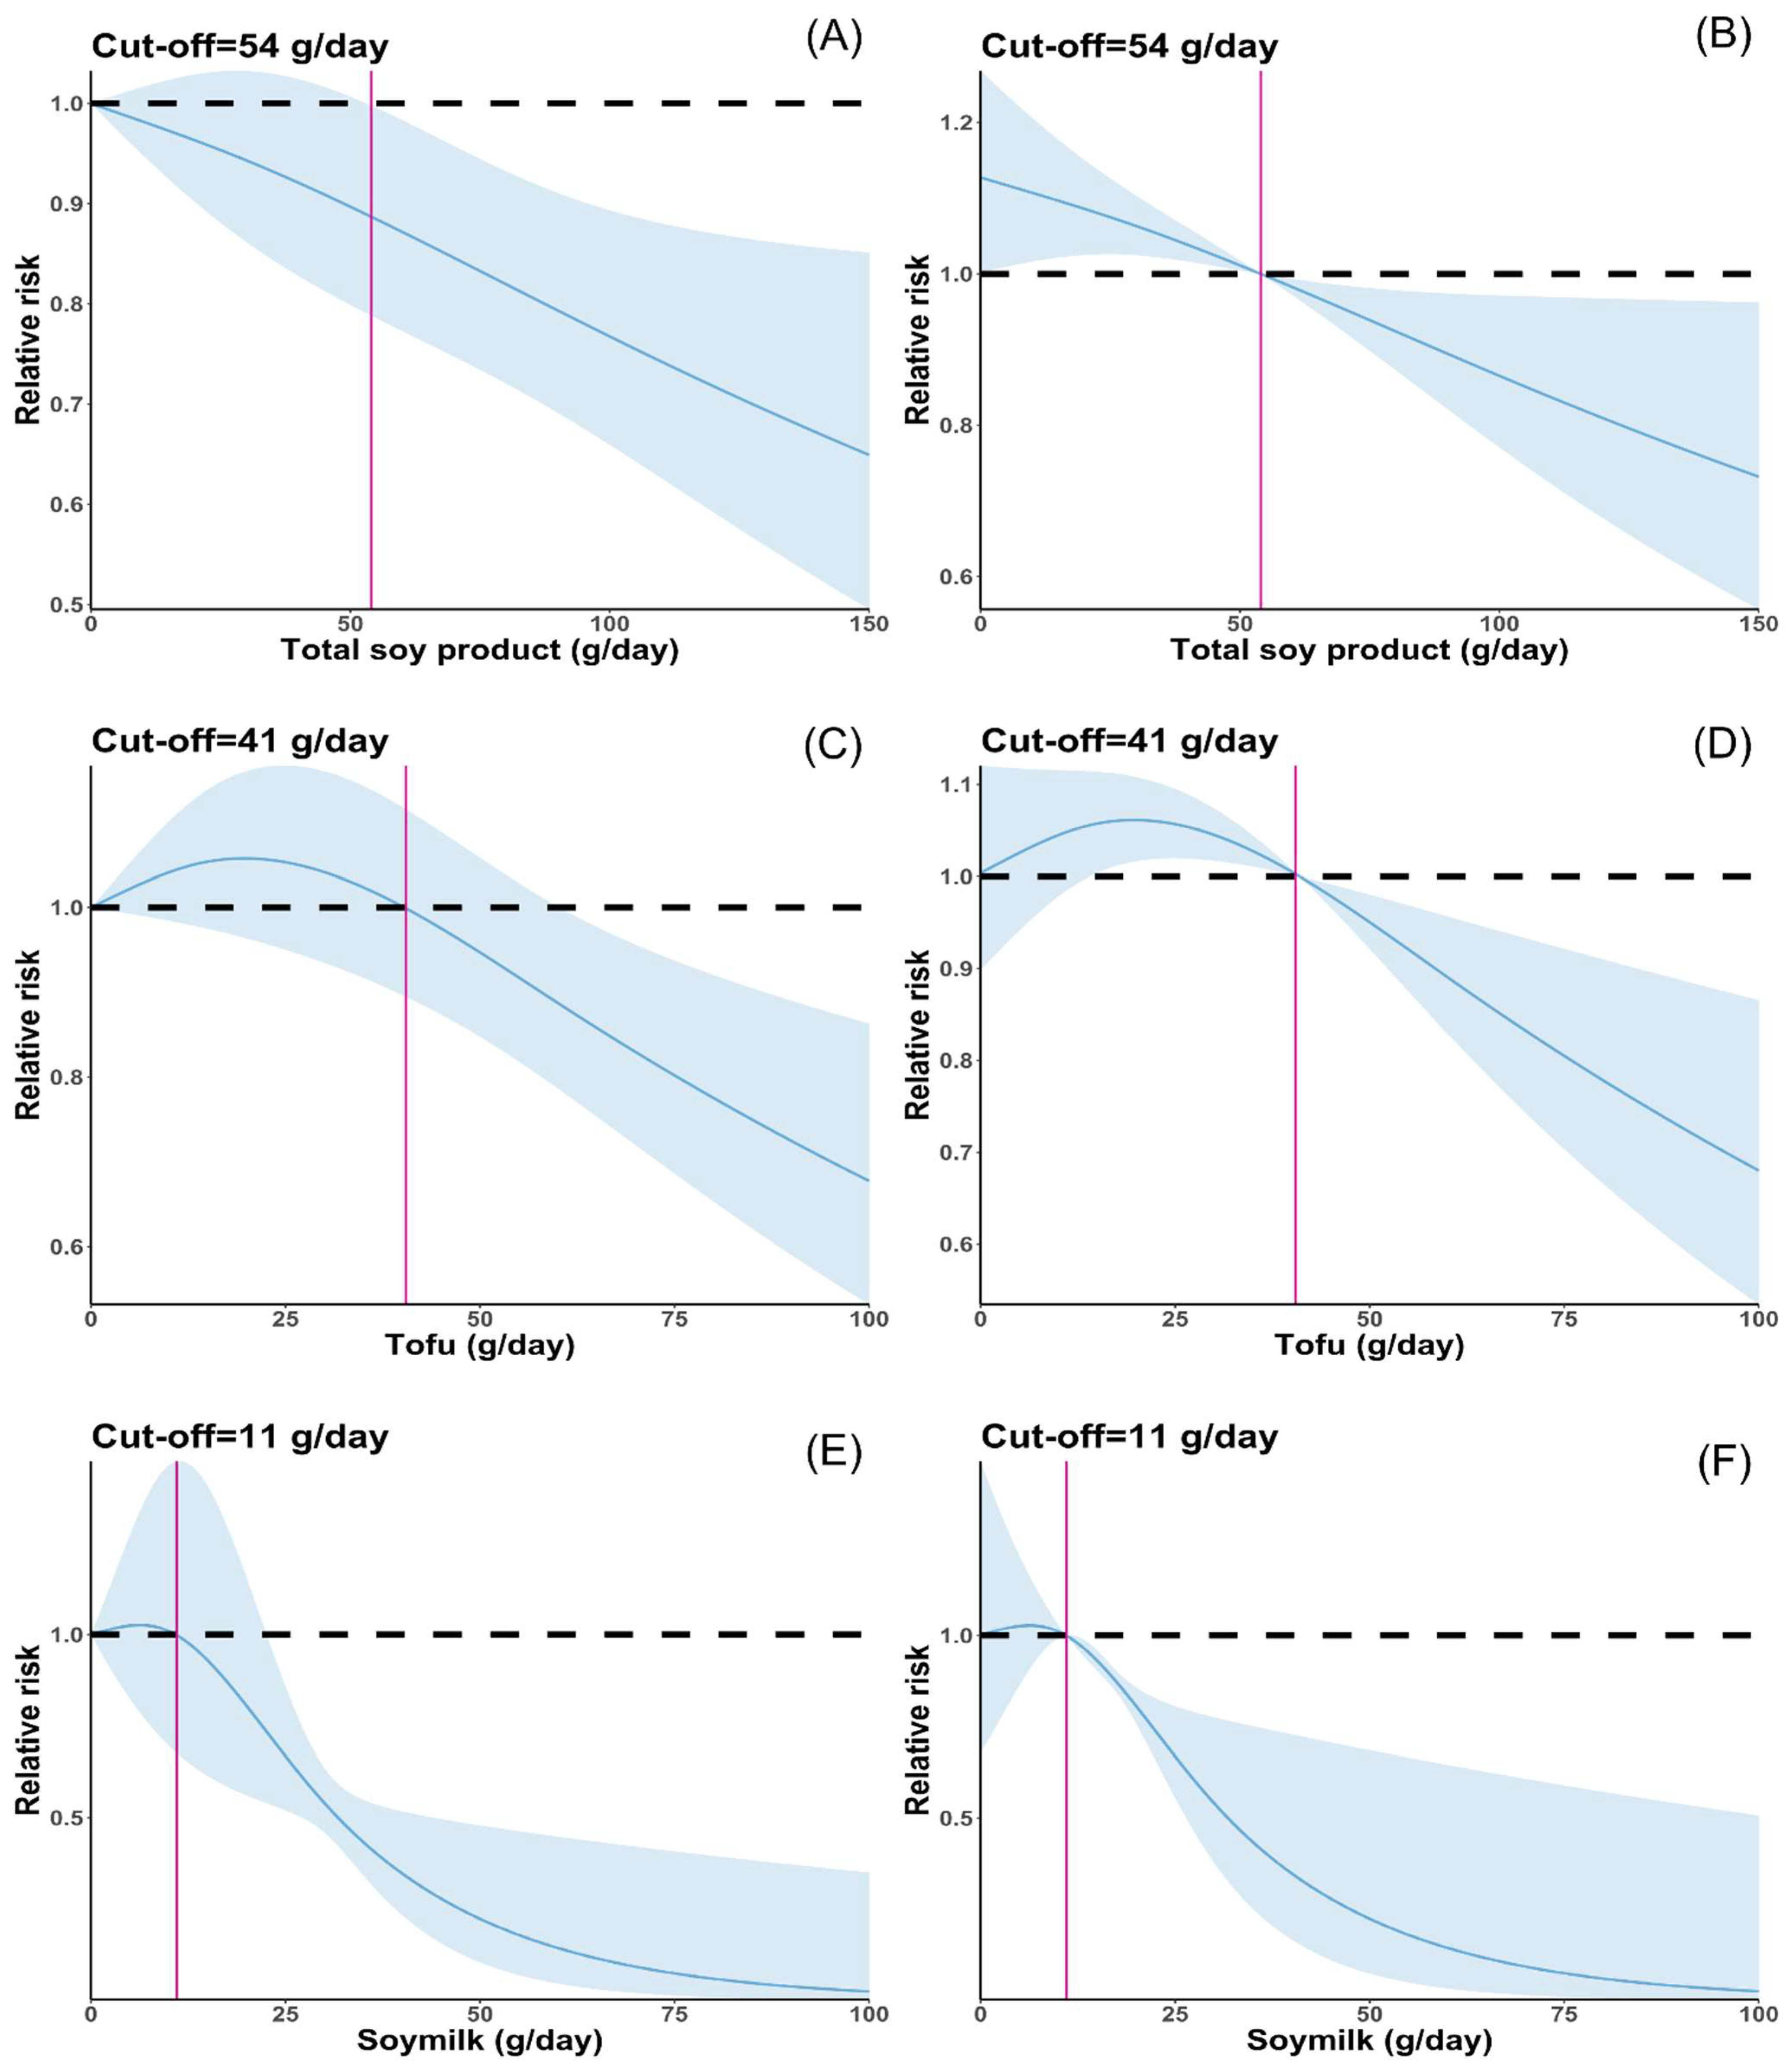
3.2. Total Soy Product Consumption and Cancer Risk
3.3. Tofu Consumption and Cancer Risk
3.4. Soymilk Consumption and Cancer Risk
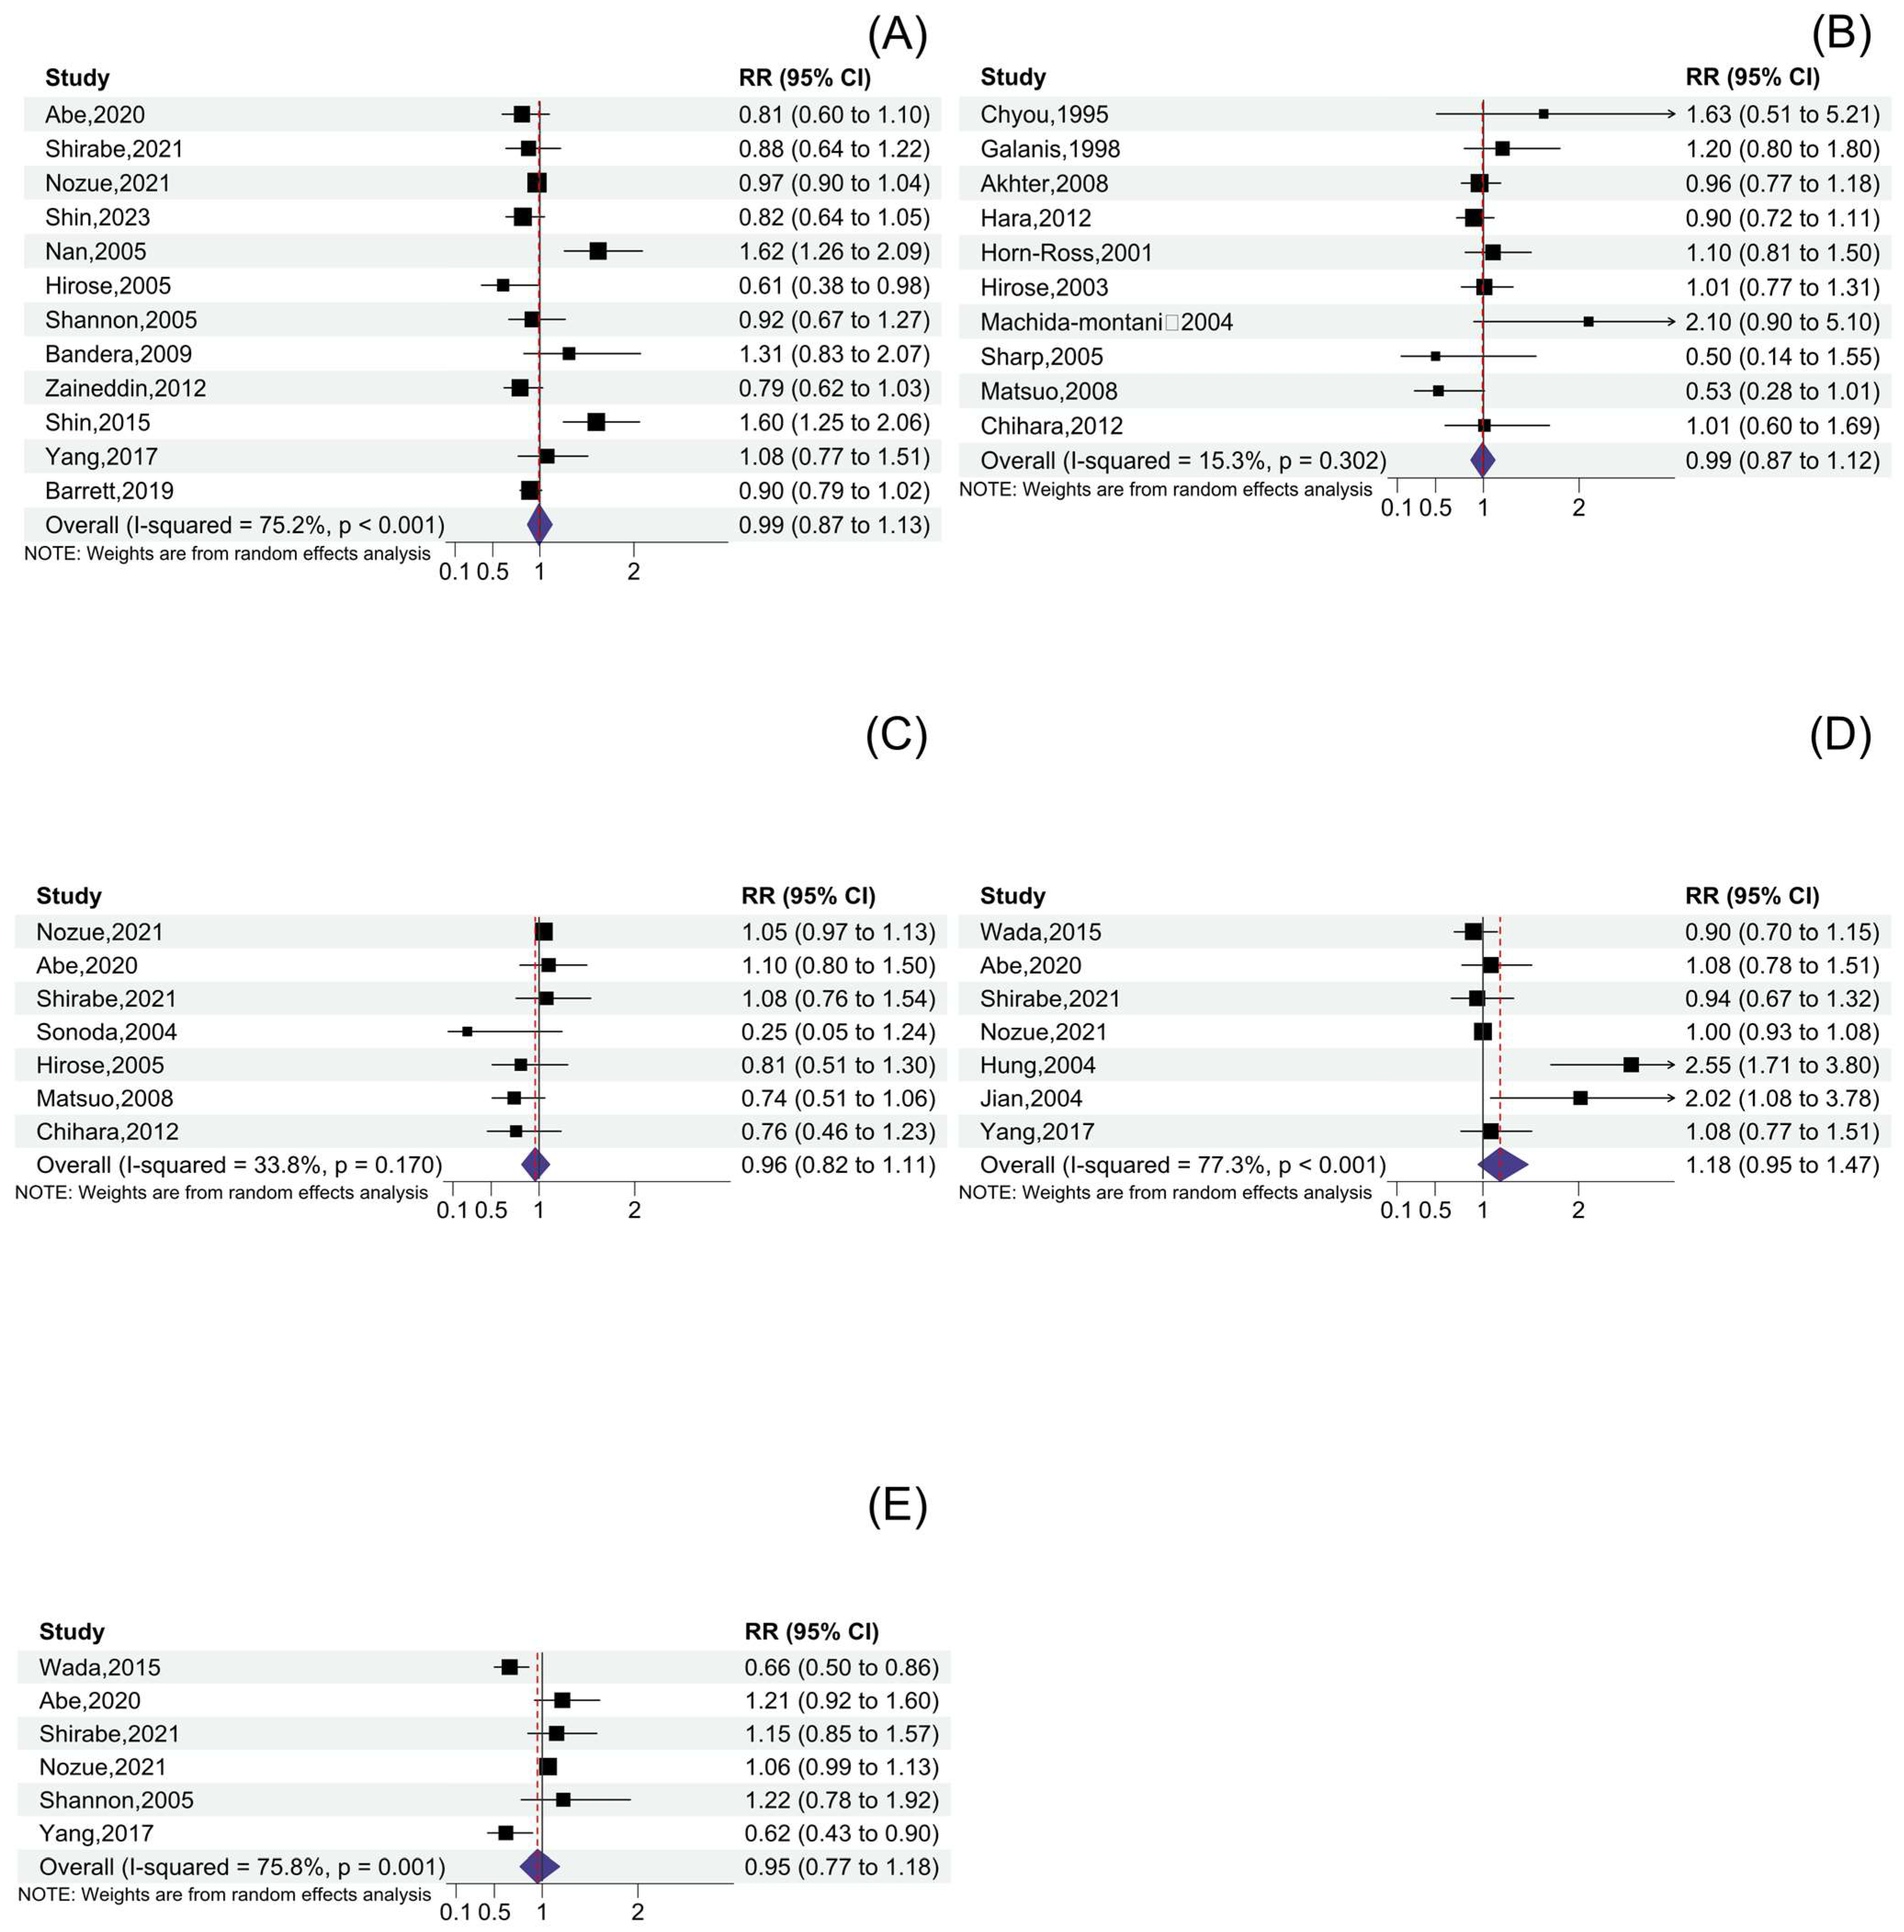
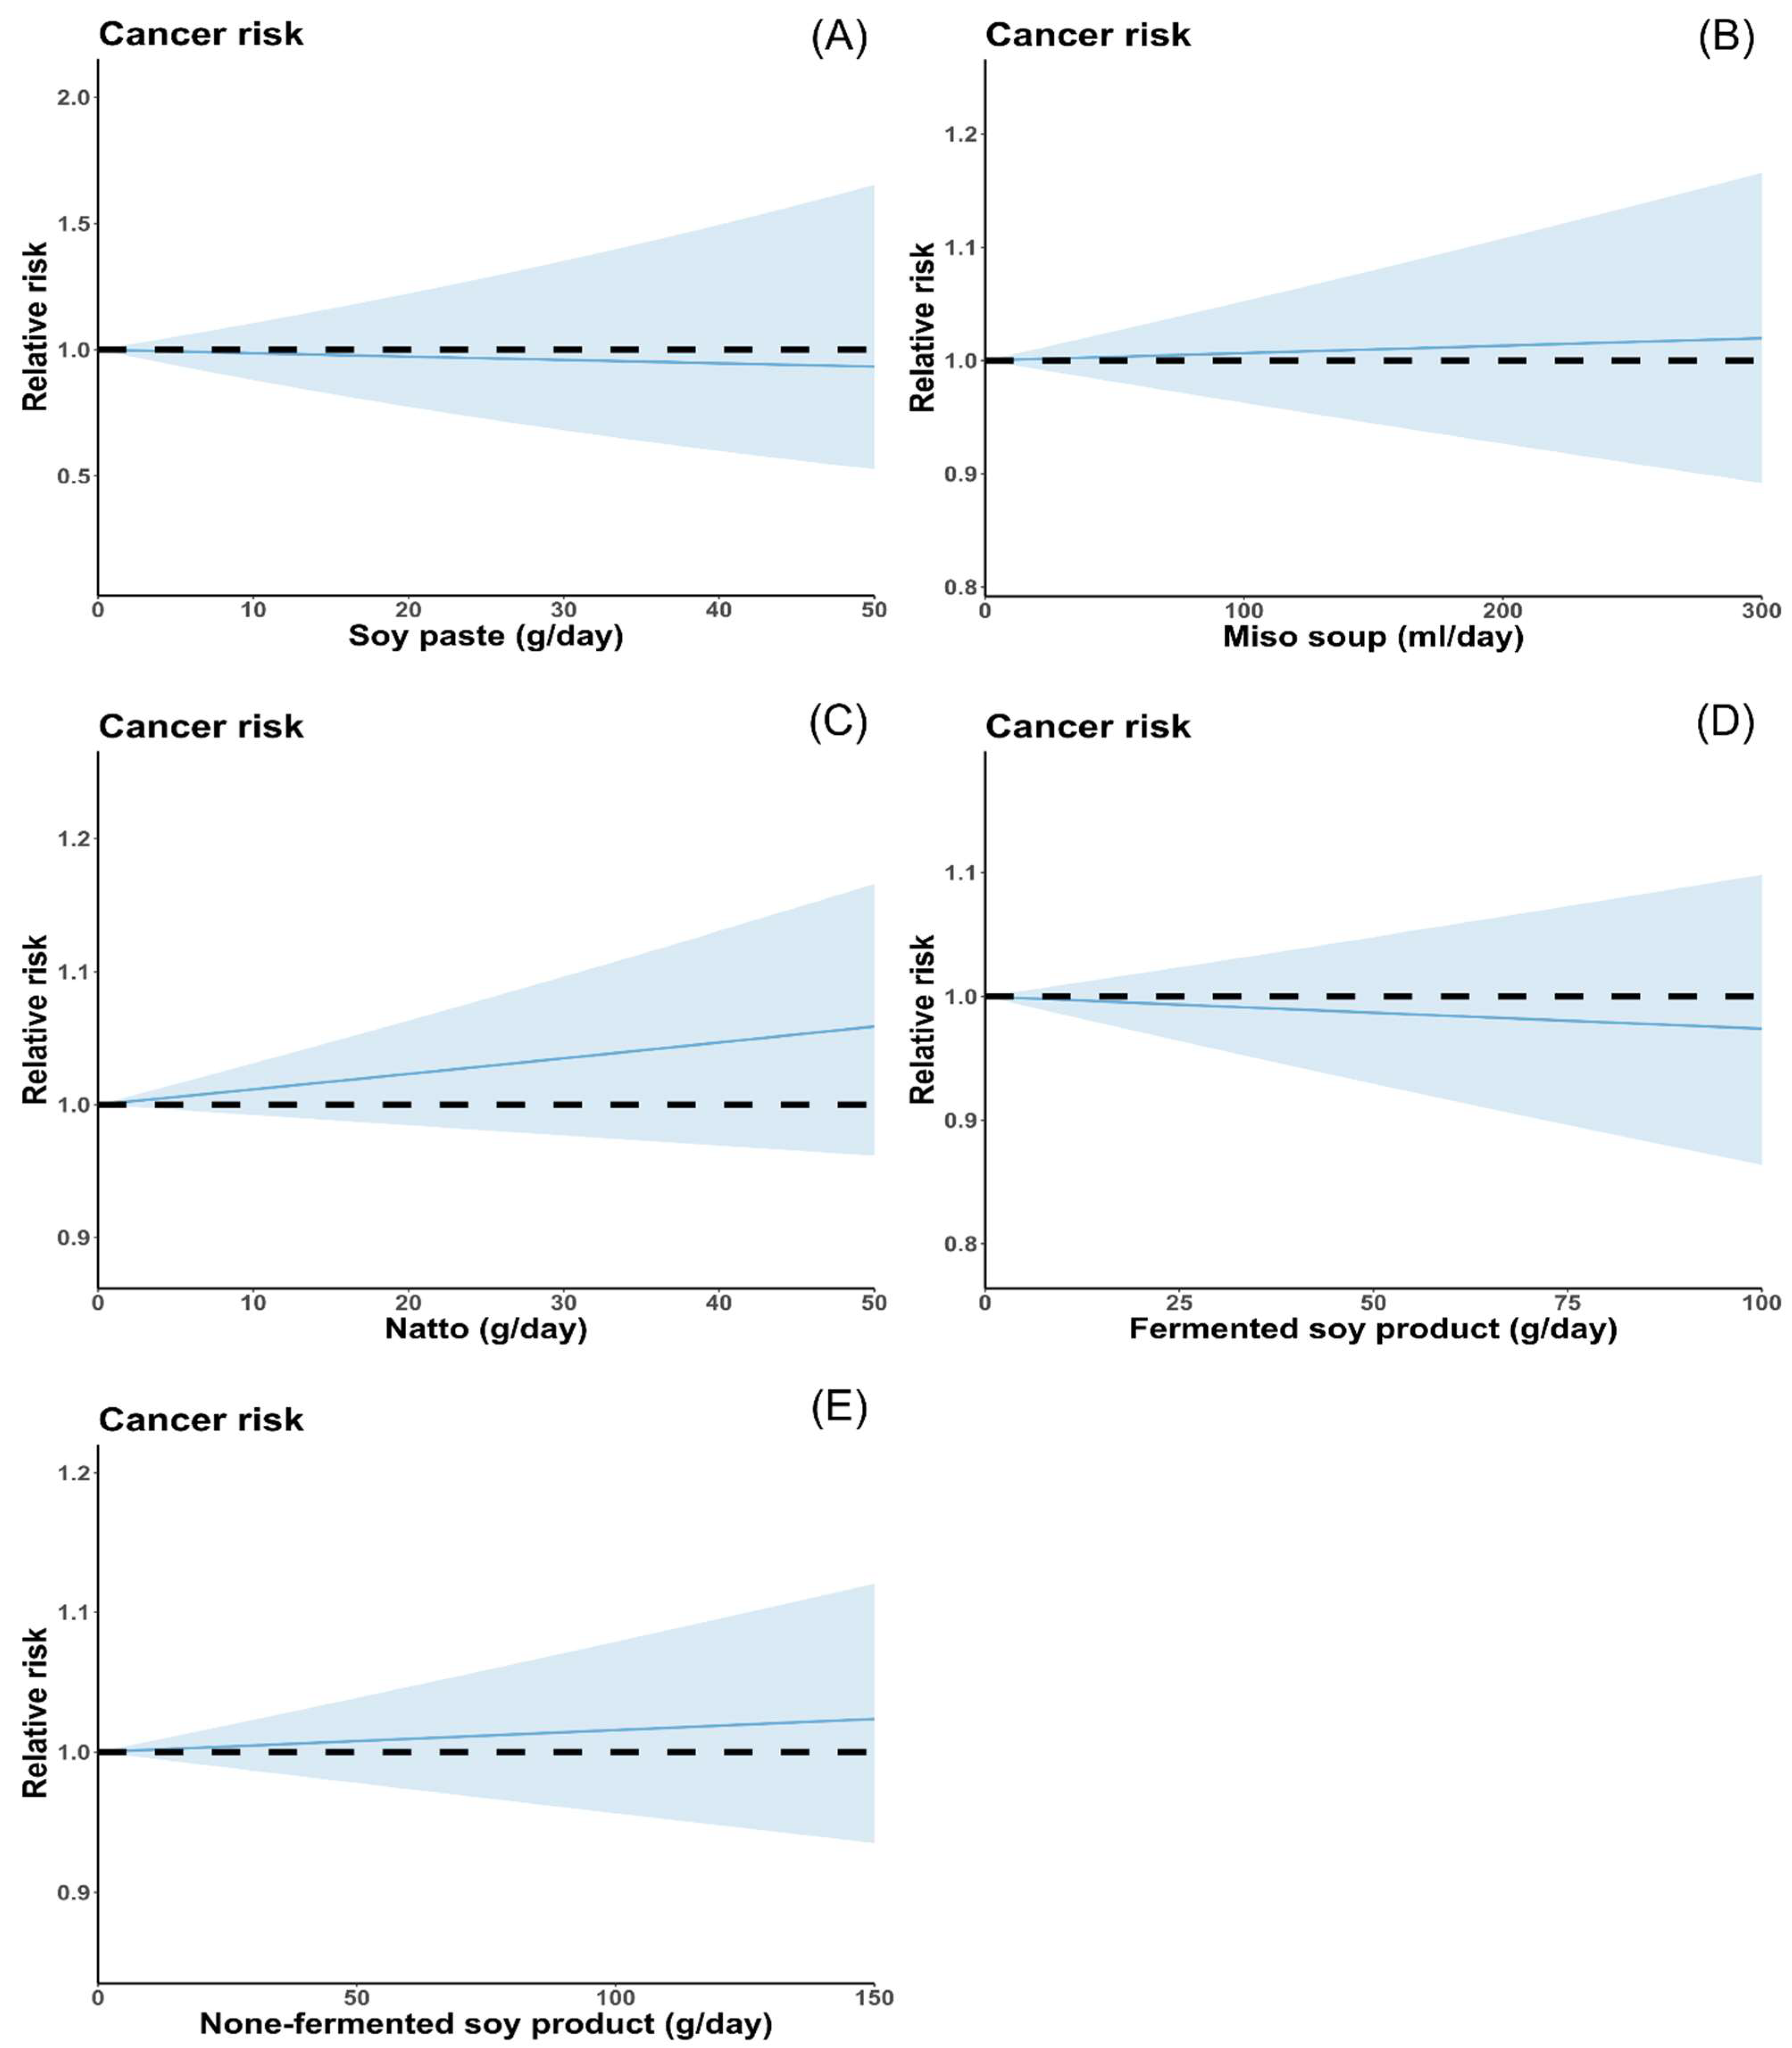
3.5. Other Soy Product Consumption and Cancer Risk
3.6. Sensitivity Analysis and Publication Bias
4. Discussion
5. Conclusions
Supplementary Materials
Author Contributions
Funding
Data Availability Statement
Conflicts of Interest
References
- Sung, H.; Ferlay, J.; Siegel, R.L.; Laversanne, M.; Soerjomataram, I.; Jemal, A.; Bray, F. Global Cancer Statistics 2020: GLOBOCAN Estimates of Incidence and Mortality Worldwide for 36 Cancers in 185 Countries. CA. Cancer J. Clin. 2021, 71, 209–249. [Google Scholar] [CrossRef] [PubMed]
- Arnold, M.; Morgan, E.; Rumgay, H.; Mafra, A.; Singh, D.; Laversanne, M.; Vignat, J.; Gralow, J.R.; Cardoso, F.; Siesling, S.; et al. Current and future burden of breast cancer: Global statistics for 2020 and 2040. Breast 2022, 66, 15–23. [Google Scholar] [CrossRef] [PubMed]
- Arnold, M.; Abnet, C.C.; Neale, R.E.; Vignat, J.; Giovannucci, E.L.; McGlynn, K.A.; Bray, F. Global Burden of 5 Major Types of Gastrointestinal Cancer. Gastroenterology 2020, 159, 335–349.e15. [Google Scholar] [CrossRef] [PubMed]
- Sugimura, T. Food and cancer. Toxicology 2002, 181–182, 17–21. [Google Scholar] [CrossRef]
- Nan, H.M.; Park, J.W.; Song, Y.J.; Yun, H.Y.; Park, J.S.; Hyun, T.; Youn, S.J.; Kim, Y.D.; Kang, J.W.; Kim, H. Kimchi and soybean pastes are risk factors of gastric cancer. World J. Gastroenterol. 2005, 11, 3175–3181. [Google Scholar] [CrossRef] [PubMed]
- Messina, M.; Nagata, C.; Wu, A.H. Estimated Asian adult soy protein and isoflavone intakes. Nutr. Cancer 2006, 55, 1–12. [Google Scholar] [CrossRef]
- Shimizu, H.; Ross, R.K.; Bernstein, L.; Yatani, R.; Henderson, B.E.; Mack, T.M. Cancers of the prostate and breast among Japanese and white immigrants in Los Angeles County. Br. J. Cancer 1991, 63, 963–966. [Google Scholar] [CrossRef]
- Wang, X.; He, T.; Xu, S.; Li, H.; Wu, M.; Lin, Z.; Huang, F.; Zhu, Y. Soy Food intake Associated with Obesity and Hypertension in Children and Adolescents in Guangzhou, Southern China. Nutrients 2022, 14, 425. [Google Scholar] [CrossRef]
- Mizushina, Y.; Shiomi, K.; Kuriyama, I.; Takahashi, Y.; Yoshida, H. Inhibitory effects of a major soy isoflavone, genistein, on human DNA topoisomerase II activity and cancer cell proliferation. Int. J. Oncol. 2013, 43, 1117–1124. [Google Scholar] [CrossRef]
- Cabot, W. Phytoestrogens. J. Am. Acad. Orthop. Surg. 2003, 11, 153–156. [Google Scholar] [CrossRef]
- Mahmoud, A.M.; Yang, W.; Bosland, M.C. Soy isoflavones and prostate cancer: A review of molecular mechanisms. J. Steroid Biochem. Mol. Biol. 2014, 140, 116–132. [Google Scholar] [CrossRef] [PubMed]
- Lee, J.K.; Park, B.J.; Yoo, K.Y.; Ahn, Y.O. Dietary factors and stomach cancer: A case-control study in Korea. Int. J. Epidemiol. 1995, 24, 33–41. [Google Scholar] [CrossRef] [PubMed]
- Lee, S.A.; Kang, D.; Shim, K.N.; Choe, J.W.; Hong, W.S.; Choi, H. Effect of diet and Helicobacter pylori infection to the risk of early gastric cancer. J. Epidemiol. 2003, 13, 162–168. [Google Scholar] [CrossRef] [PubMed]
- Hirose, K.; Imaeda, N.; Tokudome, Y.; Goto, C.; Wakai, K.; Matsuo, K.; Ito, H.; Toyama, T.; Iwata, H.; Tokudome, S.; et al. Soybean products and reduction of breast cancer risk: A case-control study in Japan. Br. J. Cancer 2005, 93, 15–22. [Google Scholar] [CrossRef] [PubMed]
- Shin, A.; Lee, J.; Lee, J.; Park, M.S.; Park, J.W.; Park, S.C.; Oh, J.H.; Kim, J. Isoflavone and Soyfood Intake and Colorectal Cancer Risk: A Case-Control Study in Korea. PLoS ONE 2015, 10, e0143228. [Google Scholar] [CrossRef] [PubMed]
- Matsuo, K.; Hiraki, A.; Ito, H.; Kosaka, T.; Suzuki, T.; Hirose, K.; Wakai, K.; Yatabe, Y.; Mitsudomi, T.; Tajima, K. Soy consumption reduces the risk of non-small-cell lung cancers with epidermal growth factor receptor mutations among Japanese. Cancer Sci. 2008, 99, 1202–1208. [Google Scholar] [CrossRef]
- Shin, W.K.; Lee, H.W.; Huang, D.; De la Torre, K.; Min, S.; Shin, A.; Lee, J.K.; Lee, J.E.; Kang, D. Soybean product consumption decreases risk of gastric cancer: Results from the Health Examinees Study. Eur. J. Nutr. 2023, 62, 1743–1753. [Google Scholar] [CrossRef] [PubMed]
- Yang, S.; Park, Y.; Lee, J.; Choi, I.J.; Kim, Y.W.; Ryu, K.W.; Sung, J.; Kim, J. Effects of Soy Product Intake and Interleukin Genetic Polymorphisms on Early Gastric Cancer Risk in Korea: A Case-Control Study. Cancer Res. Treat. 2017, 49, 1044–1056. [Google Scholar] [CrossRef]
- Wada, K.; Tsuji, M.; Tamura, T.; Konishi, K.; Kawachi, T.; Hori, A.; Tanabashi, S.; Matsushita, S.; Tokimitsu, N.; Nagata, C. Soy isoflavone intake and stomach cancer risk in Japan: From the Takayama study. Int. J. Cancer 2015, 137, 885–892. [Google Scholar] [CrossRef]
- Abe, S.K.; Sawada, N.; Ishihara, J.; Takachi, R.; Mori, N.; Yamaji, T.; Shimazu, T.; Goto, A.; Iwasaki, M.; Inoue, M.; et al. JPHC Study Group. Comparison between the impact of fermented and unfermented soy intake on the risk of liver cancer: The JPHC Study. Eur. J. Nutr. 2021, 60, 1389–1401. [Google Scholar] [CrossRef]
- Wang, Y.; Guo, J.; Yu, F.; Tian, Y.; Wu, Y.; Cui, L.; Liu, L.E. The association between soy-based food and soy isoflavone intake and the risk of gastric cancer: A systematic review and meta-analysis. J. Sci. Food Agric. 2021, 101, 5314–5324. [Google Scholar] [CrossRef]
- Wang, Q.; Liu, X.; Ren, S. Tofu intake is inversely associated with risk of breast cancer: A meta-analysis of observational studies. PLoS ONE 2020, 15, e0226745. [Google Scholar] [CrossRef] [PubMed]
- Woo, H.D.; Park, S.; Oh, K.; Kim, H.J.; Shin, H.R.; Moon, H.K.; Kim, J. Diet and cancer risk in the Korean population: A meta- analysis. Asian Pac. J. Cancer Prev. 2014, 15, 8509–8519. [Google Scholar] [CrossRef] [PubMed]
- Tse, G.; Eslick, G.D. Soy and isoflavone consumption and risk of gastrointestinal cancer: A systematic review and meta-analysis. Eur. J. Nutr. 2016, 55, 63–73. [Google Scholar] [CrossRef] [PubMed]
- Lu, D.; Pan, C.; Ye, C.; Duan, H.; Xu, F.; Yin, L.; Tian, W.; Zhang, S. Meta-analysis of Soy Consumption and Gastrointestinal Cancer Risk. Sci. Rep. 2017, 7, 4048. [Google Scholar] [CrossRef] [PubMed]
- Kazemi, A.; Barati-Boldaji, R.; Soltani, S.; Mohammadipoor, N.; Esmaeilinezhad, Z.; Clark, C.C.T.; Babajafari, S.; Akbarzadeh, M. Intake of Various Food Groups and Risk of Breast Cancer: A Systematic Review and Dose-Response Meta-Analysis of Prospective Studies. Adv. Nutr. 2021, 12, 809–849. [Google Scholar] [CrossRef] [PubMed]
- Zhao, T.T.; Jin, F.; Li, J.G.; Xu, Y.Y.; Dong, H.T.; Liu, Q.; Xing, P.; Zhu, G.L.; Xu, H.; Miao, Z.F. Dietary isoflavones or isoflavone-rich food intake and breast cancer risk: A meta-analysis of prospective cohort studies. Clin. Nutr. 2019, 38, 136–145. [Google Scholar] [CrossRef] [PubMed]
- Wu, J.; Zeng, R.; Huang, J.; Li, X.; Zhang, J.; Ho, J.C.; Zheng, Y. Dietary Protein Sources and Incidence of Breast Cancer: A Dose-Response Meta-Analysis of Prospective Studies. Nutrients 2016, 8, 730. [Google Scholar] [CrossRef] [PubMed]
- Chen, M.; Rao, Y.; Zheng, Y.; Wei, S.; Li, Y.; Guo, T.; Yin, P. Association between soy isoflavone intake and breast cancer risk for pre- and post-menopausal women: A meta-analysis of epidemiological studies. PLoS ONE 2014, 9, e89288. [Google Scholar] [CrossRef]
- Qin, L.Q.; Xu, J.Y.; Wang, P.Y.; Hoshi, K. Soyfood intake in the prevention of breast cancer risk in women: A meta-analysis of observational epidemiological studies. J. Nutr. Sci. Vitaminol. 2006, 52, 428–436. [Google Scholar] [CrossRef][Green Version]
- Page, M.J.; McKenzie, J.E.; Bossuyt, P.M.; Boutron, I.; Hoffmann, T.C.; Mulrow, C.D.; Shamseer, L.; Tetzlaff, J.M.; Akl, E.A.; Brennan, S.E.; et al. The PRISMA 2020 statement: An updated guideline for reporting systematic reviews. BMJ 2021, 372, n71. [Google Scholar] [CrossRef] [PubMed]
- Wells, G.A.; Shea, B.; O’Connell, D.; Peterson, J.; Welch, V.; Losos, M.; Tugwell, P. The Newcastle-Ottawa Scale (NOS) for assessing the quality of nonrandomised studies in meta-analyses. In Proceedings of the 3rd Symposium on Systematic Reviews: Beyond the Basics, Oxford, UK, 3–5 January 2014. [Google Scholar]
- DerSimonian, R.; Laird, N. Meta-analysis in clinical trials. Control. Clin. Trials 1986, 7, 177–188. [Google Scholar] [CrossRef] [PubMed]
- Galanis, D.J.; Kolonel, L.N.; Lee, J.; Nomura, A. Intakes of selected foods and beverages and the incidence of gastric cancer among the Japanese residents of Hawaii: A prospective study. Int. J. Epidemiol. 1998, 27, 173–180. [Google Scholar] [CrossRef] [PubMed]
- Akhter, M.; Inoue, M.; Kurahashi, N.; Iwasaki, M.; Sasazuki, S.; Tsugane, S.; Japan Public Health Center-Based Prospective Study Group. Dietary soy and isoflavone intake and risk of colorectal cancer in the Japan public health center-based prospective study. Cancer Epidemiol. Biomark. Prev. 2008, 17, 2128–2135. [Google Scholar] [CrossRef] [PubMed]
- Hara, A.; Sasazuki, S.; Inoue, M.; Iwasaki, M.; Shimazu, T.; Sawada, N.; Yamaji, T.; Tsugane, S.; Japan Public Health Center–Based Prospective Study Group. Isoflavone intake and risk of gastric cancer: A population-based prospective cohort study in Japan. Am. J. Clin. Nutr. 2012, 95, 147–154. [Google Scholar] [CrossRef] [PubMed]
- Nozue, M.; Shimazu, T.; Charvat, H.; Mori, N.; Mutoh, M.; Sawada, N.; Iwasaki, M.; Yamaji, T.; Inoue, M.; Kokubo, Y.; et al. Fermented soy products intake and risk of cardiovascular disease and total cancer incidence: The Japan Public Health Center-based Prospective study. Eur. J. Clin. Nutr. 2021, 75, 954–968. [Google Scholar] [CrossRef] [PubMed]
- Chihara, D.; Matsuo, K.; Kanda, J.; Hosono, S.; Ito, H.; Nakamura, S.; Seto, M.; Morishima, Y.; Tajima, K.; Tanaka, H. Inverse association between soy intake and non-Hodgkin lymphoma risk among women: A case-control study in Japan. Ann. Oncol. 2012, 23, 1061–1066. [Google Scholar] [CrossRef] [PubMed]
- Teng, C.; Zheng, S.; Wan, W.; Liu, L.; Yu, S.; Cao, M.; Lu, W.; Shan, Y. Fatty foods and the risk of bladder cancer: A case-control study. Nutrition 2023, 106, 111868. [Google Scholar] [CrossRef] [PubMed]
- Oba, S.; Nagata, C.; Shimizu, N.; Shimizu, H.; Kametani, M.; Takeyama, N.; Ohnuma, T.; Matsushita, S. Soy product consumption and the risk of colon cancer: A prospective study in Takayama, Japan. Nutr. Cancer 2007, 57, 151–157. [Google Scholar] [CrossRef]
- Budhathoki, S.; Joshi, A.M.; Ohnaka, K.; Yin, G.; Toyomura, K.; Kono, S.; Mibu, R.; Tanaka, M.; Kakeji, Y.; Maehara, Y.; et al. Soy food and isoflavone intake and colorectal cancer risk: The Fukuoka Colorectal Cancer Study. Scand. J. Gastroenterol. 2011, 46, 165–172. [Google Scholar] [CrossRef]
- Hung, H.C.; Huang, M.C.; Lee, J.M.; Wu, D.C.; Hsu, H.K.; Wu, M.T. Association between diet and esophageal cancer in Taiwan. J. Gastroenterol. Hepatol. 2004, 19, 632–637. [Google Scholar] [CrossRef] [PubMed]
- Barrett, D.; Ploner, A.; Chang, E.T.; Liu, Z.; Zhang, C.X.; Liu, Q.; Cai, Y.; Zhang, Z.; Chen, G.; Huang, Q.H.; et al. Past and Recent Salted Fish and Preserved Food Intakes Are Weakly Associated with Nasopharyngeal Carcinoma Risk in Adults in Southern China. J. Nutr. 2019, 149, 1596–1605. [Google Scholar] [CrossRef]
- Hirose, K.; Takezaki, T.; Hamajima, N.; Miura, S.; Tajima, K. Dietary factors protective against breast cancer in Japanese premenopausal and postmenopausal women. Int. J. Cancer 2003, 107, 276–282. [Google Scholar] [CrossRef]
- Seow, A.; Poh, W.T.; Teh, M.; Eng, P.; Wang, Y.T.; Tan, W.C.; Chia, K.S.; Yu, M.C.; Lee, H.P. Diet, reproductive factors and lung cancer risk among Chinese women in Singapore: Evidence for a protective effect of soy in nonsmokers. Int. J. Cancer 2022, 97, 365–371. [Google Scholar] [CrossRef]
- Hosono, S.; Matsuo, K.; Kajiyama, H.; Hirose, K.; Suzuki, T.; Kawase, T.; Kidokoro, K.; Nakanishi, T.; Hamajima, N.; Kikkawa, F.; et al. Association between dietary calcium and vitamin D intake and cervical carcinogenesis among Japanese women. Eur. J. Clin. Nutr. 2010, 64, 400–409. [Google Scholar] [CrossRef]
- Ko, K.P.; Kim, S.W.; Ma, S.H.; Park, B.; Ahn, Y.; Lee, J.W.; Lee, M.H.; Kang, E.; Kim, L.S.; Jung, Y.; et al. Dietary intake and breast cancer among carriers and noncarriers of BRCA mutations in the Korean Hereditary Breast Cancer Study. Am. J. Clin. Nutr. 2013, 98, 1493–1501. [Google Scholar] [CrossRef] [PubMed]
- Higgins, J.P.; Thompson, S.G.; Deeks, J.J.; Altman, D.G. Measuring inconsistency in meta-analyses. BMJ 2003, 327, 557–560. [Google Scholar] [CrossRef] [PubMed]
- Greenland, S.; Longnecker, M.P. Methods for trend estimation from summarized dose-response data, with applications to meta-analysis. Am. J. Epidemiol. 1992, 135, 1301–1309. [Google Scholar] [CrossRef] [PubMed]
- Orsini, N.; Bellocco, R.; Greenland, S.J.T. Generalized least squares for trend estimation of summarized dose–response data. Stand. Genomic. Sci. 2006, 6, 40–57. [Google Scholar] [CrossRef]
- Orsini, N.; Li, R.; Wolk, A.; Khudyakov, P.; Spiegelman, D. Meta-analysis for linear and nonlinear dose-response relations: Examples, an evaluation of approximations, and software. Am. J. Epidemiol. 2012, 175, 66–73. [Google Scholar] [CrossRef]
- Begg, C.B.; Mazumdar, M. Operating characteristics of a rank correlation test for publication bias. Biometrics 1994, 50, 1088–1101. [Google Scholar] [CrossRef]
- Egger, M.; Davey Smith, G.; Schneider, M.; Minder, C. Bias in meta-analysis detected by a simple, graphical test. BMJ 1997, 315, 629–634. [Google Scholar] [CrossRef] [PubMed]
- Duval, S.; Tweedie, R. Trim and fill: A simple funnel-plot-based method of testing and adjusting for publication bias in meta-analysis. Biometrics 2000, 56, 455–463. [Google Scholar] [CrossRef]
- Orsini, N. Multivariate does-response meta-analysis: An update on glst. In Proceedings of the Nordic and Baltic Users Group Meeting, Stockholm, Sweden, 27 September 2013. [Google Scholar]
- Horn-Ross, P.L.; John, E.M.; Lee, M.; Stewart, S.L.; Koo, J.; Sakoda, L.C.; Shiau, A.C.; Goldstein, J.; Davis, P.; Perez-Stable, E.J. Phytoestrogen consumption and breast cancer risk in a multiethnic population: The Bay Area Breast Cancer Study. Am. J. Epidemiol. 2001, 154, 434–441. [Google Scholar] [CrossRef]
- Wu, A.H.; Wan, P.; Hankin, J.; Tseng, C.C.; Yu, M.C.; Pike, M.C. Adolescent and adult soy intake and risk of breast cancer in Asian-Americans. Carcinogenesis 2002, 23, 1491–1496. [Google Scholar] [CrossRef] [PubMed]
- Jian, L.; Zhang, D.H.; Lee, A.H.; Binns, C.W. Do preserved foods increase prostate cancer risk? Br. J. Cancer 2004, 90, 1792–1795. [Google Scholar] [CrossRef]
- Machida-Montani, A.; Sasazuki, S.; Inoue, M.; Natsukawa, S.; Shaura, K.; Koizumi, Y.; Kasuga, Y.; Hanaoka, T.; Tsugane, S. Association of Helicobacter pylori infection and environmental factors in non-cardia gastric cancer in Japan. Gastric Cancer 2004, 7, 46–53. [Google Scholar] [CrossRef]
- Sonoda, T.; Nagata, Y.; Mori, M.; Miyanaga, N.; Takashima, N.; Okumura, K.; Goto, K.; Naito, S.; Fujimoto, K.; Hirao, Y.; et al. A case-control study of diet and prostate cancer in Japan: Possible protective effect of traditional Japanese diet. Cancer Sci 2004, 95, 238–242. [Google Scholar] [CrossRef] [PubMed]
- Xu, W.H.; Zheng, W.; Xiang, Y.B.; Ruan, Z.X.; Cheng, J.R.; Dai, Q.; Gao, Y.T.; Shu, X.O. Soya food intake and risk of endometrial cancer among Chinese women in Shanghai: Population based case-control study. BMJ 2004, 328, 1285. [Google Scholar] [CrossRef]
- Sharp, G.B.; Lagarde, F.; Mizuno, T.; Sauvaget, C.; Fukuhara, T.; Allen, N.; Suzuki, G.; Tokuoka, S. Relationship of hepatocellular carcinoma to soya food consumption: A cohort-based, case-control study in Japan. Int. J. Cancer 2005, 115, 290–295. [Google Scholar] [CrossRef]
- Shannon, J.; Ray, R.; Wu, C.; Nelson, Z.; Gao, D.L.; Li, W.; Hu, W.; Lampe, J.; Horner, N.; Satia, J.; et al. Food and botanical groupings and risk of breast cancer: A case-control study in Shanghai, China. Cancer Epidemiol. Biomark. Prev. 2005, 14, 81–90. [Google Scholar] [CrossRef]
- Heald, C.L.; Ritchie, M.R.; Bolton-Smith, C.; Morton, M.S.; Alexander, F.E. Phyto-oestrogens and risk of prostate cancer in Scottish men. Br. J. Nutr. 2007, 98, 388–396. [Google Scholar] [CrossRef] [PubMed]
- Kim, M.K.; Kim, J.H.; Nam, S.J.; Ryu, S.; Kong, G. Dietary intake of soy protein and tofu in association with breast cancer risk based on a case-control study. Nutr. Cancer 2008, 60, 568–576. [Google Scholar] [CrossRef] [PubMed]
- Li, X.M.; Li, J.; Tsuji, I.; Nakaya, N.; Nishino, Y.; Zhao, X.J. Mass screening-based case-control study of diet and prostate cancer in Changchun, China. Asian J. Androl. 2008, 10, 551–560. [Google Scholar] [CrossRef] [PubMed]
- Bandera, E.V.; Williams, M.G.; Sima, C.; Bayuga, S.; Pulick, K.; Wilcox, H.; Soslow, R.; Zauber, A.G.; Olson, S.H. Phytoestrogen consumption and endometrial cancer risk: A population-based case-control study in New Jersey. Cancer Causes Control 2009, 20, 1117–1127. [Google Scholar] [CrossRef] [PubMed]
- Liu, C.Y.; Hsu, Y.H.; Wu, M.T.; Pan, P.C.; Ho, C.K.; Su, L.; Xu, X.; Li, Y.; Christiani, D.C.; Kaohsiung Leukemia Research Group. Cured meat, vegetables, and bean-curd foods in relation to childhood acute leukemia risk: A population based case-control study. BMC Cancer 2009, 9, 15. [Google Scholar] [CrossRef] [PubMed]
- Wang, Q.; Wang, Y.; Ji, Z.; Chen, X.; Pan, Y.; Gao, G.; Gu, H.; Yang, Y.; Choi, B.C.; Yan, Y. Risk factors for multiple myeloma: A hospital-based case-control study in Northwest China. Cancer Epidemiol. 2012, 36, 439–444. [Google Scholar] [CrossRef]
- Wang, X.Q.; Yan, H.; Terry, P.D.; Wang, J.S.; Cheng, L.; Wu, W.A.; Hu, S.K. Interaction between dietary factors and Helicobacter pylori infection in noncardia gastric cancer: A population-based case-control study in China. J. Am. Coll. Nutr. 2012, 31, 375–384. [Google Scholar] [CrossRef]
- Zaineddin, A.K.; Buck, K.; Vrieling, A.; Heinz, J.; Flesch-Janys, D.; Linseisen, J.; Chang-Claude, J. The association between dietary lignans, phytoestrogen-rich foods, and fiber intake and postmenopausal breast cancer risk: A German case-control study. Nutr. Cancer 2012, 64, 652–665. [Google Scholar] [CrossRef]
- Lee, A.H.; Su, D.; Pasalich, M.; Tang, L.; Binns, C.W.; Qiu, L. Soy and isoflavone intake associated with reduced risk of ovarian cancer in southern Chinese women. Nutr. Res. 2014, 34, 302–307. [Google Scholar] [CrossRef]
- Tang, L.; Lee, A.H.; Xu, F.; Zhang, T.; Lei, J.; Binns, C.W. Soya and isoflavone intakes associated with reduced risk of oesophageal cancer in north-west China. Public Health Nutr. 2015, 18, 130–134. [Google Scholar] [CrossRef] [PubMed]
- Cao, S.; Liu, L.; Zhu, Q.; Zhu, Z.; Zhou, J.; Wei, P.; Wu, M. Adherence to the Vegetable-Fruit-Soy Dietary Pattern, a Reference From Mediterranean Diet, Protects Against Postmenopausal Breast Cancer Among Chinese Women. Front. Nutr. 2022, 9, 800996. [Google Scholar] [CrossRef] [PubMed]
- Kwak, J.H.; Eun, C.S.; Han, D.S.; Kim, Y.S.; Song, K.S.; Choi, B.Y.; Kim, H.J. Association between soy products, fruits, vegetables, and dairy products and gastric cancer risk in Helicobacter pylori-infected subjects: A case-control study in Korea. Nutr. Res. Pract. 2023, 17, 122–134. [Google Scholar] [CrossRef] [PubMed]
- Chyou, P.H.; Nomura, A.M.; Stemmermann, G.N. Diet, alcohol, smoking and cancer of the upper aerodigestive tract: A prospective study among Hawaii Japanese men. Int. J. Cancer 1995, 60, 616–621. [Google Scholar] [CrossRef]
- Nomura, A.M.; Hankin, J.H.; Lee, J.; Stemmermann, G.N. Cohort study of tofu intake and prostate cancer: No apparent association. Cancer Epidemiol. Biomark. Prev. 2004, 13, 2277–2279. [Google Scholar] [CrossRef]
- Seow, A.; Koh, W.P.; Wang, R.; Lee, H.P.; Yu, M.C. Reproductive variables, soy intake, and lung cancer risk among nonsmoking women in the Singapore Chinese Health Study. Cancer Epidemiol. Biomark. Prev. 2009, 18, 821–827. [Google Scholar] [CrossRef]
- Wang, L.; Lee, I.M.; Zhang, S.M.; Blumberg, J.B.; Buring, J.E.; Sesso, H.D. Dietary intake of selected flavonols, flavones, and flavonoid-rich foods and risk of cancer in middle-aged and older women. Am. J. Clin. Nutr. 2009, 89, 905–912. [Google Scholar] [CrossRef]
- Yang, G.; Shu, X.O.; Li, H.; Chow, W.H.; Cai, H.; Zhang, X.; Gao, Y.T.; Zheng, W. Prospective cohort study of soy food intake and colorectal cancer risk in women. Am. J. Clin. Nutr. 2009, 89, 577–583. [Google Scholar] [CrossRef]
- Ollberding, N.J.; Lim, U.; Wilkens, L.R.; Setiawan, V.W.; Shvetsov, Y.B.; Henderson, B.E.; Kolonel, L.N.; Goodman, M.T. Legume, soy, tofu, and isoflavone intake and endometrial cancer risk in postmenopausal women in the multiethnic cohort study. J. Natl. Cancer Inst. 2012, 104, 67–76. [Google Scholar] [CrossRef]
- Paul, P.; Koh, W.P.; Jin, A.; Michel, A.; Waterboer, T.; Pawlita, M.; Wang, R.; Yuan, J.M.; Butler, L.M. Soy and tea intake on cervical cancer risk: The Singapore Chinese Health Study. Cancer Causes Control 2019, 30, 847–857. [Google Scholar] [CrossRef]
- Shirabe, R.; Saito, E.; Sawada, N.; Ishihara, J.; Takachi, R.; Abe, S.K.; Shimazu, T.; Yamaji, T.; Goto, A.; Iwasaki, M.; et al. Fermented and non-fermented soy foods and the risk of breast cancer in a Japanese population-based cohort study. Cancer Med. 2021, 10, 757–771. [Google Scholar] [CrossRef] [PubMed]
- Applegate, C.C.; Rowles, J.L.; Ranard, K.M.; Jeon, S.; Erdman, J.W. Soy Consumption and the Risk of Prostate Cancer: An Updated Systematic Review and Meta-Analysis. Nutrients 2018, 10, 40. [Google Scholar] [CrossRef] [PubMed]
- Yan, L.; Spitznagel, E.L. Soy consumption and prostate cancer risk in men: A revisit of a meta-analysis. Am. J. Clin. Nutr. 2009, 89, 1155–1163. [Google Scholar] [CrossRef] [PubMed]
- Yan, L.; Spitznagel, E.L. Meta-analysis of soy food and risk of prostate cancer in men. Int. J. Cancer 2005, 117, 667–669. [Google Scholar] [CrossRef]
- Yang, W.S.; Va, P.; Wong, M.Y.; Zhang, H.L.; Xiang, Y.B. Soy intake is associated with lower lung cancer risk: Results from a meta-analysis of epidemiologic studies. Am. J. Clin. Nutr. 2011, 94, 1575–1583. [Google Scholar] [CrossRef] [PubMed]
- Takata, Y.; Yang, J.J.; Yu, D.; Smith-Warner, S.A.; Blot, W.J.; White, E.; Robien, K.; Prizment, A.; Wu, K.; Sawada, N.; et al. Calcium Intake and Lung Cancer Risk: A Pooled Analysis of 12 Prospective Cohort Studies. J. Nutr. 2023, 153, 2051–2060. [Google Scholar] [CrossRef] [PubMed]
- Yang, G.; Shu, X.O.; Chow, W.H.; Zhang, X.; Li, H.L.; Ji, B.T.; Cai, H.; Wu, S.; Gao, Y.T.; Zheng, W. Soy food intake and risk of lung cancer: Evidence from the Shanghai Women’s Health Study and a meta-analysis. Am. J. Epidemiol. 2012, 176, 846–855. [Google Scholar] [CrossRef] [PubMed]
- Rizzo, G.; Baroni, L. Soy, Soy Foods and Their Role in Vegetarian Diets. Nutrients 2018, 10, 43. [Google Scholar] [CrossRef] [PubMed]
- Zaheer, K.; Humayoun Akhtar, M. An updated review of dietary isoflavones: Nutrition, processing, bioavailability and impacts on human health. Crit. Rev. Food Sci. Nutr. 2017, 57, 1280–1293. [Google Scholar] [CrossRef]
- Warner, M.; Huang, B.; Gustafsson, J.A. Estrogen Receptor β as a Pharmaceutical Target. Trends Pharmacol. Sci. 2017, 38, 92–99. [Google Scholar] [CrossRef]
- Nelles, J.L.; Hu, W.Y.; Prins, G.S. Estrogen action and prostate cancer. Expert Rev. Endocrinol. Metab. 2011, 6, 437–451. [Google Scholar] [CrossRef]
- Bogush, T.A.; Dudko, E.A.; Beme, A.A.; Bogush, E.A.; Kim, A.I.; Polotsky, B.E.; Tjuljandin, S.A.; Davydov, M.I. Estrogen receptors, antiestrogens, and non-small cell lung cancer. Biochemistry 2010, 75, 1421–1427. [Google Scholar] [CrossRef] [PubMed]
- Yan, L.; Spitznagel, E.L.; Bosland, M.C. Soy consumption and colorectal cancer risk in humans: A meta-analysis. Cancer Epidemiol. Biomark. Prev. 2010, 19, 148–158. [Google Scholar] [CrossRef]
- Yu, Y.; Jing, X.; Li, H.; Zhao, X.; Wang, D. Soy isoflavone consumption and colorectal cancer risk: A systematic review and meta-analysis. Sci. Rep. 2016, 6, 25939. [Google Scholar] [CrossRef]
- Weng, K.G.; Yuan, Y.L. Soy food intake and risk of gastric cancer: A dose-response meta-analysis of prospective studies. Medicine 2017, 96, e7802. [Google Scholar] [CrossRef] [PubMed]
- Hämäläinen, M.; Nieminen, R.; Vuorela, P.; Heinonen, M.; Moilanen, E. Anti-inflammatory effects of flavonoids: Genistein, kaempferol, quercetin, and daidzein inhibit STAT-1 and NF-kappaB activations, whereas flavone, isorhamnetin, naringenin, and pelargonidin inhibit only NF-kappaB activation along with their inhibitory effect on iNOS expression and NO production in activated macrophages. Mediat. Inflamm. 2007, 2007, 45673. [Google Scholar]
- Merga, Y.J.; O’Hara, A.; Burkitt, M.D.; Duckworth, C.A.; Probert, C.S.; Campbell, B.J.; Pritchard, D.M. Importance of the alternative NF-κB activation pathway in inflammation-associated gastrointestinal carcinogenesis. Am. J. Physiol. Gastrointest. Liver Physiol. 2016, 310, G1081–G1090. [Google Scholar] [CrossRef]
- Kucuk, O. Soy foods, isoflavones, and breast cancer. Cancer 2017, 123, 1901–1903. [Google Scholar] [CrossRef]
- Yamamoto, S.; Sobue, T.; Kobayashi, M.; Sasaki, S.; Tsugane, S.; Japan Public Health Center-Based Prospective Study on Cancer Cardiovascular Diseases Group. Soy, isoflavones, and breast cancer risk in Japan. J. Natl. Cancer Inst. 2003, 95, 906–913. [Google Scholar] [CrossRef]
- Zheng, S.; Wang, X.; Zhao, D.; Liu, H.; Hu, Y. Calcium homeostasis and cancer: Insights from endoplasmic reticulum-centered organelle communications. Trends. Cell Biol. 2023, 33, 312–323. [Google Scholar] [CrossRef]
- Huang, H.; Krishnan, H.B.; Pham, Q.; Yu, L.L.; Wang, T.T. Soy and Gut Microbiota: Interaction and Implication for Human Health. J. Agric. Food Chem. 2016, 64, 8695–8709. [Google Scholar] [CrossRef] [PubMed]
- Kim, J.; Kang, M.; Lee, J.S.; Inoue, M.; Sasazuki, S.; Tsugane, S. Fermented and non-fermented soy food consumption and gastric cancer in Japanese and Korean populations: A meta-analysis of observational studies. Cancer Sci. 2011, 102, 231–244. [Google Scholar] [CrossRef] [PubMed]
- Willett, W.; Stampfer, M.J. Total energy intake: Implications for epidemiologic analyses. Am. J. Epidemiol. 1986, 124, 17–27. [Google Scholar] [CrossRef] [PubMed]


| First Author, Year | Country (Study Name) | Study Design (Study Period) | Age (Years) | Cases/ Sample | Exposure Category (Lowest vs. Highest) | Cancer Type |
|---|---|---|---|---|---|---|
| Chyou, 1995 [76] | USA | Cohort (1965–1993) | 45–68 | 92/7994 | Miso soup, tofu <1 times/week (ref) ≥5 times/week | Upper aerodigestive tract |
| Galanis, 1998 [34] | USA | Cohort (1975–1994) | 46.4 ± 16.6 | 108/11,907 | Miso soup None (ref), 1 or more times/week | Gastric |
| Nomura, 2004 [77] | USA | Cohort (1971–1995) | NA | 304/5826 | Tofu 0 g/week (ref), >240 g/week | Prostate |
| Oba, 2007 [40] | Japan (Takayama Study) | Cohort (1993–2000) | >35 | 210/30,221 | Soy product 49.2 g/day (ref), 141.1 g/day (M) 46.3 g/day (ref), 128.0 g/day (F) | Colon |
| Akhter, 2008 [35] | Japan (Japan Public Health Center-Based Prospective Study) | Cohort (1995–2004) | 45–74 | 886/83,063 | Soy food 35.4 g/day (ref), 169.9 g/day (M) 35.6 g/day (ref), 170.3 g/day (F) Miso soup 147.5 mL/day (ref) 313.7 mL/day (M) 125.6 mL/day (ref) 261.3 mL/day (F) | Colorectal |
| Seow, 2009 [78] | Singapore (Singapore Chinese Health Study) | Cohort (1993–2005) | 45–74 | 298/34,028 | Soybean drink 30.7 g/day (ref), 197.7 g/day | Lung |
| Wang, 2009 [79] | USA (The Women’s Health Study) | Cohort (1992–2007) | ≥45 | 3196/37,938 | Tofu <1 serving/month (ref) ≥2 servings/week | Total |
| Yang, 2009 [80] | China (Shanghai Women’s Health Study) | Cohort (1997–2005) | 51.6 ± 9 | 321/68,412 | Soy foods ≤12.8 g/day (ref), >21 g/day | Colorectal |
| Hara, 2012 [36] | Japan (Japan Public Health Center-Based Prospective Study) | Cohort (1995–2006) | 45–74 | 1249/84,881 | Miso soup 63 mL/day (ref), 449 mL/day (M) 47 mL/day (ref), 384 mL/day (F) Soy food 33.4 g/day (ref), 140.6 g/day (M) 33.6 g/day (ref), 141 g/day (F) | Gastric |
| Ollberding, 2012 [81] | USA (Multiethnic Postmenopausal Women’s Cohort Study) | Cohort (1993–2007) | 61.6 ± 7.7 | 489/46,027 | Tofu 0–0.21 g/1000 kcal/day (ref) ≥7.56 g/1000 kcal/day | Endometrial |
| Ko, 2013 [47] | Korea (Korean Hereditary Breast Cancer Study) | Cohort (2007–2011) | ≥20 | 2002/2271 | Soybean products 0–1 times/week (ref) 4–5 times/week | Breast |
| Wada, 2015 [19] | Japan (Takayama Study) | Cohort (1992–2008) | >35 | 678/30,792 | Soy foods 38.4 g/day (ref), 176.3 g/day (M) 43.5 g/day (ref), 168.7 g/day (F) Fermented soy foods 6.6 g/day (ref), 37.3 g/day (M) 7.5 g/day (ref), 34.0 g/day (F) Non-fermented 27.7 g/day (ref), 147.8 g/day (M) 32.0 g/day (ref), 140.8 g/day (F) | Stomach |
| Paul, 2019 [82] | Singapore (Singapore Chinese Health Study) | Cohort (1993–2013) | 45–74 | 312/30,744 | Soy food 31.29 g/1000 kcal/day 115.86 g/1000 kcal/day | Cervical |
| Abe, 2020 [20] | Japan (Japan Public Health Center-Based Prospective Study) | Cohort (1995–2013) | 40–69 | 534/75,089 | Miso, natto, tofu, fermented Non-fermented, total soy food Quartile 1 (ref), quartile 4 Soymilk Non-consumer (ref), consumer | Liver |
| Shirabe, 2021 [83] | Japan (Japan Public Health Center-Based Prospective Study) | Cohort (1995–2013) | 45–74 | 825/47,614 | Total soy foods 31.8 g/day (ref), 137 g/day Fermented soy foods 7.3 g/day (ref), 53.2 g/day Miso 2.9 g/day (ref), 29.1 g/day Natto 0.01 g/day (ref), 32.7 g/day Non-fermented soy foods 13.5 g/day (ref), 98.5 g/day Tofu 10.3 g/day (ref), 74.1 g/day Soy milk No (ref), Yes | Breast |
| Nozue, 2021 [37] | Japan (Japan Public Health Center-based Prospective Study) | Cohort (1995–2012) | 40–69 | 9972/79,648 | Total soy product 33.6 g/day (ref), 140.9 g/day (W) 33.7 g/day (ref), 130.9 g/day (M) Fermented soy products 8.6 g/day (ref), 55.1 g/day (W) 9.5 g/day (ref), 60 g/day (M) Non-fermented soy products 13.5 g/day (ref), 99.5 g/day (W) 12.1 g/day (ref), 97 g/day (M) Miso 3.8 g/day (ref), 30.5 g/day (W) 5.1 g/day (ref), 35.8 g/day (M) Natto 0 g/day (ref), 32.4 g/day (W) 0 g/day (ref), 32.1 g/day (M) | Total |
| Shin, 2023 [17] | Korea (the Health Examinees study) | Cohort (2004–2013) | 40–69 | 767/109,161 | Soybean paste, tofu Almost never (ref) ≥2 times/week | Gastric |
| Lee, 1995 [12] | Korea | Case–control (1990–1991) | >25 | 213/425 | Tofu None or 4–5 times/year (ref) ≥2–3 times/week | Stomach |
| Horn-Ross, 2001 [56] | USA (Multiethnic Bay Area Breast Cancer Study) | Case–control (1995–1998) | 35–79 | 1314/2917 | Tofu, miso soup Non-consumers (ref) ≥1 times/month Soy milk Non-consumers (ref), consumers | Breast |
| Seow, 2002 [45] | Singapore (Singapore Chinese Women’s health study) | Case–control (1996–1998) | 20–89 | 303/1064 | Soy foods <2.2 servings/week (ref) ≥5.4 servings/week | Lung |
| Wu, 2002 [57] | USA | Case–control (1995–1998) | 25–74 | 494/1086 | Tofu Less than monthly (ref) >4 times/week | Breast |
| Hirose, 2003 [44] | Japan (Aichi Cancer Center-Based Women’s Health Study) | Case–control (1988–2000) | >30 | 2382/21,377 | Soybean curd <1–3 times/month ≥5 times/week Miso soup Almost never (ref), 2 times/day | Breast |
| Lee, 2003 [13] | Korea | Case–control (1999) | >18 | 69/268 | Soybean curd <1 times/week (ref) ≥1 times/month | Gastric |
| Jian, 2004 [58] | China | Case–control (2001–2002) | >45 | 130/404 | Fermented soy products 0 g/day (ref), >4 g/day | Prostate |
| Hung, 2004 [42] | China | Case–control (1996–2002) | Case (41–93) Control (41–89) | 522/1428 | Fermented bean product <1 (ref), ≥1 times/week | Esophageal |
| Machida-montani, 2004 [59] | Japan | Case–control (1998–2002) | 20–74 | 122/357 | Miso soup <3 (ref), ≥4 cups/day | Gastric |
| Sonoda, 2004 [60] | Japan | Case–control (1996–2002) | 59–73 | 140/280 | Tofu ≤19.7 g/day (ref), ≥96.4 g/day All soy products ≤77 g/day (ref), ≥187.2 g/day Natto ≤5.7 g/day (ref), ≥40 g/d | Prostate |
| Xu, 2004 [61] | China (Shanghai Women’s Population-Based Case–control Study) | Case–control (1997–2001) | 30–69 | 832/1678 | Soy milk Never (ref), >1.9 g/day Tofu ≤0.8 (ref), >3.5 g/day Soya products (no tofu) ≤1.8 (ref), >8.8 g/day | Endometrial |
| Nan, 2005 [5] | Korea | Case–control (1997–2003) | Case 60 ± 11 Control 59 ± 10 | 421/1053 | Soybean paste Low (ref), high | Gastric |
| Hirose, 2005 [14] | Japan (Aichi Cancer Center-Based Women’s Health Study) | Case–control (2001–2002) | >30 | 167/1021 | Soybean products, tofu, Miso, natto Tertile 1 (ref), Tertile 3 | Breast |
| Sharp, 2005 [62] | Japan (A-bomb Survivors Cohort-Based, Case–control Study) | Case–control (1965–1988) | NA | 102/339 | Miso soup, tofu Never or ≤1/week (ref) ≥5 times/week | Hepatocellular |
| Shannon, 2005 [63] | China (Shanghai Women’s Study) | Case–control (1995–2000) | >35 | 378/1448 | Total soy food ≤2.6 servings/week (ref) ≥1.1 servings/day Unfermented soy food ≤2.3 servings/week (ref) ≥1 servings/day | Breast |
| Heald, 2007 [64] | Scottish (Prostate Cancer And Diet Study) | Case–control (1998–2001) | 50–74 | 433/916 | Soy food consumption No (ref), Yes | Prostate |
| Kim, 2008 [65] | Korea | Case–control (2004–2006) | Case 46.1 ± 8.5 Control 46 ± 8.6 | 362/724 | Tofu <7.73 g/day (ref), ≥49.5 g/day | Breast |
| Li, 2008 [66] | China (Changchun Mass Screening-Based Case–control study) | Case–control (1998–2000) | >50 | 28/308 | Soybean food (tofu and foymilk) ≤2 times/day (ref) ≥1 times/day | Prostate |
| Matsuo, 2008 [16] | Japan (Aichi Cancer Center Hospital-Based Case–control Study) | Case–control (2001–2005) | 18–79 | 353/2110 | Soybean products 19.8 (ref), 81.8 g/day Miso soup ≤3–4 times/week (ref) twice a day Tofu ≤1–3 times/month (ref) ≥3–4 times/week Natto ≤1–3 times/month (ref) ≥ once a day | Lung |
| Bandera, 2009 [67] | USA (Estrogen, Diet, Genetics and Endometrial Cancer Study) | Case–control (2001–2003) | >21 | 408/797 | Tofu, soy milk, miso Never (ref), Ever | Endometrial |
| Liu, 2009 [68] | China | Case–control (1997–2005) | 2–20 | 195/683 | Bean curd foods Rare or occasional (ref), frequent | Leukemia |
| Hosono, 2010 [46] | Japan | Case–control (2001–2005) | NA | 405/2430 | Tofu None (ref), >5 times/week | Cervical |
| Budhathoki, 2011 [41] | Japan (The Fukuoka Colorectal Cancer Study) | Case–control (2000–2003) | Case 60.5 ± 9.1 Control 58.9 ± 10.7 | 816/1631 | Soy foods 5.4 g/day (ref), 26.8 g/day | Colorectal |
| Chihara, 2012 [38] | Japan | Case–control (2001–2005) | 18–80 | 295/1765 | Miso soup, tofu, natto <1 times/day (ref), ≥1 times/day | Non-Hodgkin lymphoma |
| Wang, 2012 [69] | China (Northwest China’s Hospital-Based Case–control Study) | Case–control (2009–2011) | NA | 220/440 | Soy food Never (ref), ≥3 times/week | Multiple myeloma |
| Wang, 2012 [70] | China (XiAn’s Population- Based Case–control Study) | Case–control (2008–2010) | 30–79 | 257/771 | Soya products Tertile 1 (ref), Tertile 3 | Gastric |
| Zaineddin, 2012 [71] | Germany (German Case–control Study) | Case–control (2005–2006) | 50–74 | 3157/9211 | Soy milk, tofu, paste No consumption (ref) High consumption | Breast |
| Lee, 2014 [72] | China (Guangdong Hospital-Based 1:1 Case–control Study) | Case–control (2006–2008) | Average 75 | 500/1000 | Total soy foods ≤61.4 g/day (ref), >119 g/day Soy milk ≤12.9 mL/day (ref), >38.6 mL/day Tofu ≤8.6 g/day (ref), >20 g/day | Ovarian |
| Tang, 2015 [73] | China (Xinjiang Hospital-Based Case–control Study) | Case–control (2008–2009) | Average 61 | 359/539 | Total soya foods <26 g/day (ref), >97 g/day Soya milk <2 mL/day (ref), >60 mL/day | Esophageal |
| Shin, 2015 [15] | Korea | Case–control (2010–2013) | NA | 962/3727 | Soy products <40.34 g/day (ref) ≥105.03 g/day (M) <42.77 g/day (ref) ≥113.66 g/day (F) Tofu <17.19 g/day (ref) ≥52.86 g/day (M) <18.73 g/day (ref) ≥54.91 g/day (F) Soymilk 0 g/day (ref), ≥21.35 g/day (M) 0 g/day (ref), ≥19.1 g/day (F) Fermented soy paste <1.95 g/day (ref) ≥8.32 g/day (M) <2.08 g/day (ref) ≥8.7 g/day (F) | Colorectal |
| Yang, 2017 [18] | Korea (National Cancer Center Gastric Cancer Research) | Case–control (2011–2014) | Case 53.9 ± 9.19 Control 53.8 ± 9.05 | 377/1131 | Total soy products ≤48.39 g/day (ref), >86.2 g/day Fermented soy foods ≤2.29 g/day (ref), >5.78 g/day Non-fermented soy foods ≤42.95 g/day (ref), >85.54 g/day Tofu ≤20.47 g/day (ref), >40.05 g/day Soymilk ≤4.24 × 10⁻⁹ g/day (ref), ≥3.55 g/day | Gastric |
| Barrett, 2019 [43] | China (NPC Genes, Environment, and EBV Study) | Case–control (2010–2013) | 20–74 | 4806/9614 | Fermented bean curds (adult) 0 g/day (ref), ≥0.66 g/day (M) 0 g/day (ref), >0.33 g/day (W) Bean paste (adult) 0 g/day (ref), ≥1.66 g/day Fermented bean curds (adolescent) 0 g/day (ref), ≥0.66 g/day (M) 0 g/day (ref), >0.54 g/day (W) Bean paste (adolescent) 0 g/day (ref), >2.5 g/day | Nasopharyngeal carcinoma |
| Cao, 2022 [74] | China (Chinese Wuxi Exposure and Breast Cancer Study) | Case–control (2013–2014) | >18 | 818/1753 | Soy foods 0–3.3 g/day (ref), ≥57.1 g/day | Breast |
| Teng, 2023 [39] | China | Case–control (2018–2019) | 25–80 | 113/405 | Soybean products 0–10 g/day (ref) 41.8–181.7 g/day | Bladder |
| Kwak, 2023 [75] | Korea | Case–control (2002–2006) | 20–70 | 82/164 | Soy products Tertile 1 (ref), Tertile 3 | Gastric |
| Characteristic | Studies (n) | RR (95% CI) | Heterogeneity | p-Difference |
|---|---|---|---|---|
| Total soy foods | ||||
| All studies | 28 | 0.69 (0.6, 0.8) | I2 = 82.7%, p < 0.001 | |
| Study design | ||||
| Case–control study | 18 | 0.56 (0.46, 0.69) | I2 = 69.8%, p < 0.001 | p = 0.004 |
| Cohort study | 10 | 0.90 (0.80, 1.01) | I2 = 66.8%, p = 0.001 | |
| Sex | ||||
| Male | 12 | 0.86 (0.74, 1.00) | I2 = 59.0%, p = 0.005 | p = 0.454 |
| Female | 20 | 0.76 (0.65, 0.89) | I2 = 78.3%, p < 0.001 | |
| Cancer type | ||||
| Gastrointestinal cancer | 10 | 0.74 (0.61, 0.89) | I2 = 68.7%, p = 0.001 | |
| Stomach | 5 | 0.63 (0.41, 0.97) | I2 = 81.5%, p < 0.001 | |
| Colorectal | 5 | 0.77 (0.65, 0.91) | I2 = 43.1%, p = 0.134 | |
| Gynecological cancer | 8 | 0.71 (0.54, 0.92) | I2 = 83.3%, p < 0.001 | p = 0.902 |
| Breast | 5 | 0.79 (0.60, 1.03) | I2 = 73.9%, p = 0.004 | |
| Ovarian | 1 | 0.29 (0.20, 0.42) | ||
| Cervical | 1 | 0.80 (0.61, 1.05) | ||
| Endometrial | 1 | 0.84 (0.59, 1.20) | ||
| Prostate cancer | 3 | 0.47 (0.31, 0.71) | I2 = 0%, p = 0.566 | p = 0.163 |
| Lung cancer | 2 | 0.67 (0.52, 0.86) | I2 = 0%, p = 0.564 | p = 0.608 |
| Bladder cancer | 1 | 0.75 (0.40, 1.41) | p = 0.983 | |
| Upper aerodigestive tract cancer | 1 | 0.33 (0.22, 0.49) | p = 0.062 | |
| Multiple myeloma | 1 | 0.10 (0.01, 0.97) | p = 0.257 | |
| Liver cancer | 1 | 1.10 (0.82, 1.47) | p = 0.296 | |
| Geographic location | ||||
| Japan | 10 | 0.89 (0.77, 1.02) | I2 = 65.7%, p = 0.002 | |
| China | 11 | 0.48 (0.34, 0.69) | I2 = 80.8%, p < 0.001 | p = 0.022 |
| Korea | 4 | 0.75 (0.61, 0.92) | I2 = 40.0%, p = 0.172 | p = 0.241 |
| Singapore | 2 | 0.73 (0.57, 0.94) | I2 = 14.1%, p = 0.281 | p = 0.285 |
| USA | 1 | 0.73 (0.51, 1.04) | p = 0.488 | |
| Europe | 1 | 0.52 (0.60, 0.80) | p = 0.160 | |
| Tofu | ||||
| All studies | 26 | 0.78 (0.70, 0.86) | I2 = 47.9%, p = 0.004 | |
| Study design | ||||
| Case–control study | 19 | 0.72 (0.63, 0.83) | I2 = 58.9%, p = 0.001 | p = 0.186 |
| Cohort study | 7 | 0.89 (0.78, 1.01) | I2 = 0%, p = 0.901 | |
| Sex | ||||
| Male | 7 | 0.83 (0.71, 0.98) | I2 = 20.3%, p = 0.268 | p = 0974 |
| Female | 19 | 0.82 (0.74, 0.91) | I2 = 34.7%, p = 0.069 | |
| Cancer type | ||||
| Gastrointestinal cancer | 5 | 0.67 (0.47, 0.96) | I2 = 76.0%, p = 0.002 | |
| Stomach | 4 | 0.56 (0.34, 0.93) | I2 = 79.7%, p = 0.002 | |
| Colorectal | 1 | 0.95 (0.73, 1.24) | ||
| Gynecological cancer | 12 | 0.76 (0.66, 0.87) | I2 = 48.7%, p = 0.029 | p = 0898 |
| Breast | 7 | 0.79 (0.66, 0.94) | I2 = 61.6%, p = 0.016 | |
| Endometrial | 3 | 0.77 (0.61, 0.97) | I2 = 0%, p = 0.785 | |
| Cervical | 1 | 0.62 (0.34, 1.14) | ||
| Ovarian | 1 | 0.57 (0.40, 0.81) | ||
| Prostate cancer | 2 | 0.70 (0.43, 1.15) | I2 = 26.0%, p = 0.245 | p = 0.917 |
| Liver cancer | 2 | 0.96 (0.72, 1.28) | I2 = 0%, p = 0.931 | p = 0.465 |
| Lung cancer | 1 | 0.96 (0.70, 1.32) | p = 0.542 | |
| Non-Hodgkin lymphoma | 1 | 1.35 (0.75, 2.44) | p = 0.341 | |
| Upper aerodigestive tract cancer | 1 | 0.49 (0.07, 3.48) | p = 0.874 | |
| Leukemia | 1 | 0.55 (0.34, 0.89) | p = 0.898 | |
| Geographic location | ||||
| Japan | 9 | 0.87 (0.76, 1.00) | I2 = 20.0%, p = 0.265 | |
| USA | 7 | 0.82 (0.71, 0.95) | I2 = 0%, p = 0.863 | p = 0.546 |
| Korea | 6 | 0.58 (0.40, 0.85) | I2 = 80.7%, p < 0.001 | p = 0.169 |
| China | 3 | 0.63 (0.50, 0.80) | I2 = 1.4%, p = 0.363 | p = 0.049 |
| Europe | 1 | 0.89 (0.74, 1.08) | p = 0.876 | |
| Soy milk | ||||
| All studies | 11 | 0.75 (0.60, 0.93) | I2 = 80.6%, p < 0.001 | |
| Study design | ||||
| Case–control study | 8 | 0.65 (0.52, 0.80) | I2 = 72.4%, p = 0.001 | p = 0.031 |
| Cohort study | 3 | 1.10 (0.76, 1.58) | I2 = 72.9%, p = 0.025 | |
| Sex | ||||
| Male | 3 | 0.72 (0.37, 1.41) | I2 = 90.4%, p < 0.001 | p = 0.699 |
| Female | 10 | 0.81 (0.65, 1.00) | I2 = 71.8%, p < 0.001 | |
| Cancer type | ||||
| Gastrointestinal cancer | 2 | 0.58 (0.47, 0.72) | I2 = 0%, p = 0.759 | |
| Stomach | 1 | 0.61 (0.43, 0.87) | ||
| Colorectal | 1 | 0.57 (0.44, 0.73) | ||
| Gynecological cancer | 6 | 0.79 (0.58, 1.06) | I2 = 82.2%, p < 0.001 | p = 0.359 |
| Breast | 3 | 0.91 (0.60, 1.38) | I2 = 80.9%, p = 0.005 | |
| Endometrial | 2 | 0.86 (0.69, 1.06) | I2 = 0%, p = 0.964 | |
| Ovarian | 1 | 0.43 (0.31, 0.6) | ||
| Upper aerodigestive tract cancer | 1 | 0.48 (0.31, 0.74) | p = 0.569 | |
| Lung cancer | 1 | 0.75 (0.53, 1.06) | p = 0.150 | |
| Liver cancer | 1 | 1.31 (0.95, 1.80) | p = 0.433 | |
| Geographic location | ||||
| Japan | 2 | 1.32 (1.05, 1.66) | I2 = 0%, p = 0.922 | |
| China | 3 | 0.57 (0.35, 0.93) | I2 = 84.7%, p = 0.001 | p = 0.068 |
| USA | 2 | 0.69 (0.47, 1.02) | I2 = 41.8%, p = 0.190 | p = 0.074 |
| Korea | 2 | 0.58 (0.47, 0.72) | I2 = 0%, p = 0.759 | p = 0.035 |
| Singapore | 1 | 0.75 (0.53, 1.06) | p = 0.225 | |
| Europe | 1 | 0.94 (0.75, 1.18) | p = 0.284 |
| Characteristic | Studies (n) | RR (95% CI) | Heterogeneity | p-Difference |
|---|---|---|---|---|
| Soy paste | ||||
| All studies | 12 | 0.99 (0.87, 1.13) | I2 = 75.2%, p < 0.001 | |
| Study design | ||||
| Case–control study | 8 | 1.06 (0.85, 1.33) | I2 = 82.1%, p < 0.001 | p = 0.271 |
| Cohort study | 4 | 0.95 (0.89, 1.01) | I2 = 0%, p = 0.401 | |
| Sex | ||||
| Male | 7 | 0.93 (0.71, 1.22) | I2 = 78.1%, p < 0.001 | p = 0.884 |
| Female | 11 | 0.92 (0.82, 1.02) | I2 = 18.8%, p = 0.264 | |
| Cancer type | ||||
| Gastrointestinal cancer | 4 | 1.23 (0.88, 1.74) | I2 = 84.7%, p < 0.001 | |
| Stomach | 3 | 1.13 (0.74, 1.73) | I2 = 80.6%, p = 0.001 | |
| Colorectal | 1 | 1.60 (1.25, 2.05) | ||
| Gynecological cancer | 5 | 0.87 (0.72, 1.05) | I2 = 32.2%, p = 0.207 | p = 0.117 |
| Breast | 4 | 0.82 (0.70, 0.96) | I2 = 0%, p = 0.520 | |
| Endometrial | 1 | 1.31 (0.83, 2.07) | ||
| Upper aerodigestive tract cancer | 1 | 0.90 (0.79, 1.02) | p = 0.441 | |
| Liver cancer | 1 | 0.81 (0.60, 1.10) | p = 0.352 | |
| Geographic location | ||||
| Japan | 4 | 0.88 (0.75, 1.03) | I2 = 39.4%, p = 0.175 | |
| Korea | 4 | 1.23 (0.88, 1.74) | I2 = 84.7%, p < 0.001 | p = 0.093 |
| China | 2 | 0.90 (0.80, 1.02) | I2 = 0%, p = 0.900 | p = 0.997 |
| USA | 1 | 1.31 (0.83, 2.07) | p = 0.236 | |
| Europe | 1 | 0.79 (0.61, 1.02) | p = 0.593 | |
| Miso soup | ||||
| All studies | 10 | 0.99 (0.87, 1.12) | I2 = 15.3%, p = 0.302 | |
| Study design | ||||
| Case–control study | 6 | 0.98 (0.76, 1.27) | I2 = 39.2%, p = 0.144 | p = 0.780 |
| Cohort study | 4 | 0.97 (0.84, 1.11) | I2 = 0%, p = 0.514 | |
| Sex | ||||
| Male | 5 | 1.01 (0.77, 1.32) | I2 = 50.4%, p = 0.089 | p = 0.682 |
| Female | 7 | 0.97 (0.84, 1.12) | I2 = 0%, p = 0.508 | |
| Cancer type | ||||
| Gastrointestinal cancer | 4 | 1.01 (0.83, 1.22) | I2 = 34.1%, p = 0.207 | |
| Stomach | 3 | 1.12 (0.78, 1.61) | I2 = 55.5%, p = 0.106 | |
| Colorectal | 1 | 0.96 (0.78, 1.19) | ||
| Breast cancer | 2 | 1.05 (0.86, 1.28) | I2 = 0%, p = 0.681 | p = 0.648 |
| Liver cancer | 1 | 0.5 (0.15, 1.66) | p = 0.442 | |
| Lung cancer | 1 | 0.53 (0.28, 1.01) | p = 0.234 | |
| Upper aerodigestive tract cancer | 1 | 1.63 (0.51, 5.21) | p = 0.539 | |
| Non-Hodgkin lymphoma | 1 | 1.01 (0.60, 1.70) | p = 0.933 | |
| Geographic location | ||||
| Japan | 7 | 0.94 (0.80, 1.10) | I2 = 24.7%, p = 0.240 | p = 0.188 |
| USA | 3 | 1.15 (0.91, 1.47) | I2 = 0%, p = 0.791 | |
| Natto | ||||
| All studies | 7 | 0.96 (0.82, 1.11) | I2 = 33.8%, p = 0.170 | |
| Study design | ||||
| Case–control study | 4 | 0.74 (0.58, 0.95) | I2 = 0%, p = 0.592 | p = 0.045 |
| Cohort study | 3 | 1.05 (0.98, 1.13) | I2 = 0%, p = 0.952 | |
| Sex | ||||
| Male | 5 | 0.96 (0.74, 1.26) | I2 = 57.6%, p = 0.051 | p = 0.402 |
| Female | 6 | 0.99 (0.90, 1.10) | I2 = 0%, p = 0.680 | |
| Cancer type | ||||
| Breast cancer | 2 | 0.97 (0.73, 1.29) | I2 = 0%, p = 0.336 | |
| Prostate cancer | 1 | 0.25 (0.05, 1.24) | p = 0.350 | |
| Lung cancer | 1 | 0.74 (0.51, 1.07) | p = 0.453 | |
| Non-Hodgkin lymphoma | 1 | 0.76 (0.46, 1.24) | p = 0.550 | |
| Liver caner | 1 | 1.10 (0.80, 1.51) | p = 0.67 | |
| Fermented soy foods | ||||
| All studies | 7 | 1.18 (0.95, 1.47) | I2 = 77.3%, p < 0.001 | |
| Study design | ||||
| Case-control study | 3 | 1.74 (0.96, 3.15) | I2 = 81.8%, p = 0.004 | p = 0.056 |
| Cohort study | 4 | 0.99 (0.93, 1.06) | I2 = 0%, p = 0.805 | |
| Sex | ||||
| Male | 5 | 1.03 (0.91, 1.17) | I2 = 19.3%, p = 0.292 | p = 0.573 |
| Female | 5 | 0.98 (0.89, 1.09) | I2 = 0%, p = 0.460 | |
| Cancer type | ||||
| Stomach cancer | 2 | 0.96 (0.79, 1.17) | I2 = 0%, p = 0.393 | |
| Breast cancer | 1 | 0.94 (0.67, 1.32) | p = 0.935 | |
| Prostate cancer | 1 | 2.02 (1.08, 3.78) | p = 0.270 | |
| Liver cancer | 1 | 1.08 (0.78, 1.50) | p = 0.656 | |
| Upper aerodigestive tract cancer | 1 | 2.55 (1.71, 3.80) | p = 0.146 | |
| Geographic location | ||||
| Japan | 4 | 0.99 (0.93, 1.06) | I2 = 0%, p = 0.805 | |
| China | 2 | 2.38 (1.70, 3.34) | I2 = 0%, p = 0.539 | p = 0.008 |
| Korea | 1 | 1.08 (0.77, 1.51) | p = 0.698 | |
| Unfermented soy foods | ||||
| All studies | 6 | 0.95 (0.77, 1.18) | I2 = 75.8%, p = 0.001 | |
| Study design | ||||
| Case–control study | 2 | 0.86 (0.44, 1.67) | I2 = 80.7%, p = 0.023 | p = 0.624 |
| Cohort study | 4 | 1.00 (0.80, 1.25 | I2 = 76.3%, p = 0.005 | |
| Sex | ||||
| Male | 4 | 0.81 (0.60, 1.10) | I2 = 82.6%, p = 0.001 | p = 0.239 |
| Female | 6 | 1.08 (0.93, 1.25) | I2 = 24.6%, p = 0.249 | |
| Cancer type | ||||
| Stomach cancer | 2 | 0.65 (0.52, 0.80) | I2 = 0%, p = 0.789 | |
| Breast cancer | 2 | 1.17 (0.91, 1.51) | I2 = 0%, p = 0.832 | p = 0.073 |
| Liver cancer | 1 | 1.21 (0.92, 1.60) | p = 0.178 | |
| Geographic location | ||||
| Japan | 4 | 1.00 (0.80, 1.25) | I2 = 76.3%, p = 0.005 | |
| China | 1 | 1.22 (0.78, 1.91) | p = 0.613 | |
| Korea | 1 | 0.62 (0.43, 0.90) | p = 0.253 |
Disclaimer/Publisher’s Note: The statements, opinions and data contained in all publications are solely those of the individual author(s) and contributor(s) and not of MDPI and/or the editor(s). MDPI and/or the editor(s) disclaim responsibility for any injury to people or property resulting from any ideas, methods, instructions or products referred to in the content. |
© 2024 by the authors. Licensee MDPI, Basel, Switzerland. This article is an open access article distributed under the terms and conditions of the Creative Commons Attribution (CC BY) license (https://creativecommons.org/licenses/by/4.0/).
Share and Cite
Wang, C.; Ding, K.; Xie, X.; Zhou, J.; Liu, P.; Wang, S.; Fang, T.; Xu, G.; Tang, C.; Hong, H. Soy Product Consumption and the Risk of Cancer: A Systematic Review and Meta-Analysis of Observational Studies. Nutrients 2024, 16, 986. https://doi.org/10.3390/nu16070986
Wang C, Ding K, Xie X, Zhou J, Liu P, Wang S, Fang T, Xu G, Tang C, Hong H. Soy Product Consumption and the Risk of Cancer: A Systematic Review and Meta-Analysis of Observational Studies. Nutrients. 2024; 16(7):986. https://doi.org/10.3390/nu16070986
Chicago/Turabian StyleWang, Chenting, Keqing Ding, Xuanzhen Xie, Jinyue Zhou, Pengju Liu, Shuang Wang, Ting Fang, Guozhang Xu, Chunlan Tang, and Hang Hong. 2024. "Soy Product Consumption and the Risk of Cancer: A Systematic Review and Meta-Analysis of Observational Studies" Nutrients 16, no. 7: 986. https://doi.org/10.3390/nu16070986
APA StyleWang, C., Ding, K., Xie, X., Zhou, J., Liu, P., Wang, S., Fang, T., Xu, G., Tang, C., & Hong, H. (2024). Soy Product Consumption and the Risk of Cancer: A Systematic Review and Meta-Analysis of Observational Studies. Nutrients, 16(7), 986. https://doi.org/10.3390/nu16070986