

The Nutri-Score Scale—A Tool for Assessing the Nutritional Quality of Processed Meat Products Available on the Polish Market
 , , , and
Abstract
1. Introduction
2. Materials and Methods
2.1. Data Collection
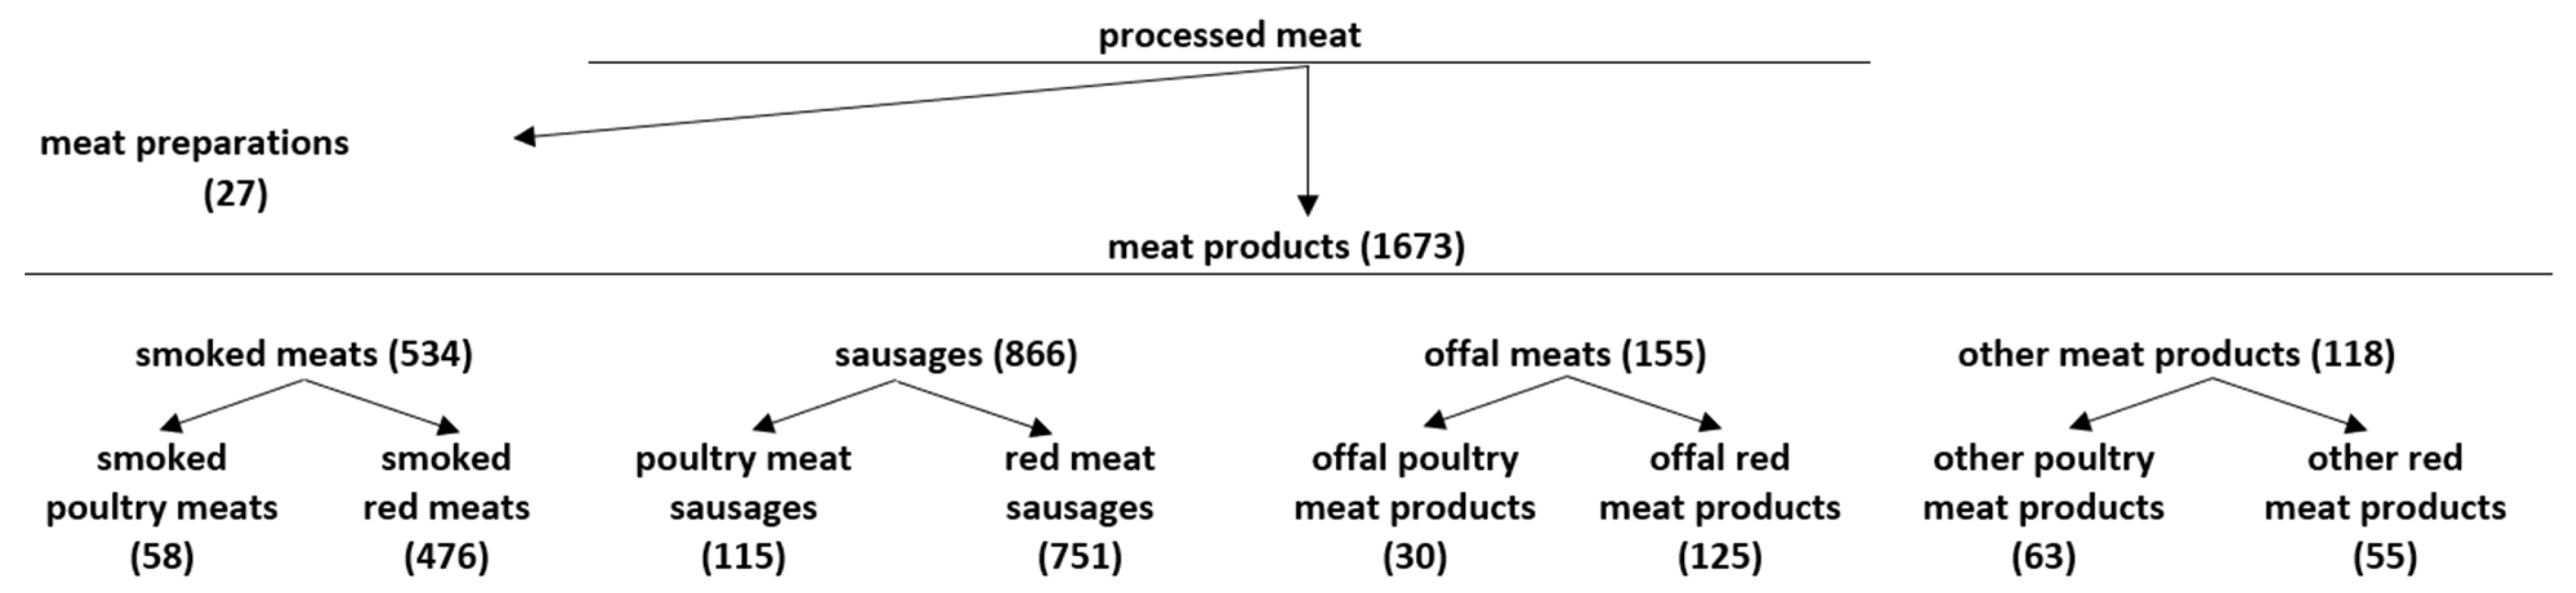
2.2. Classification of Products
2.3. Nutri-Score Calculations
2.4. Statistical Analyses
3. Results
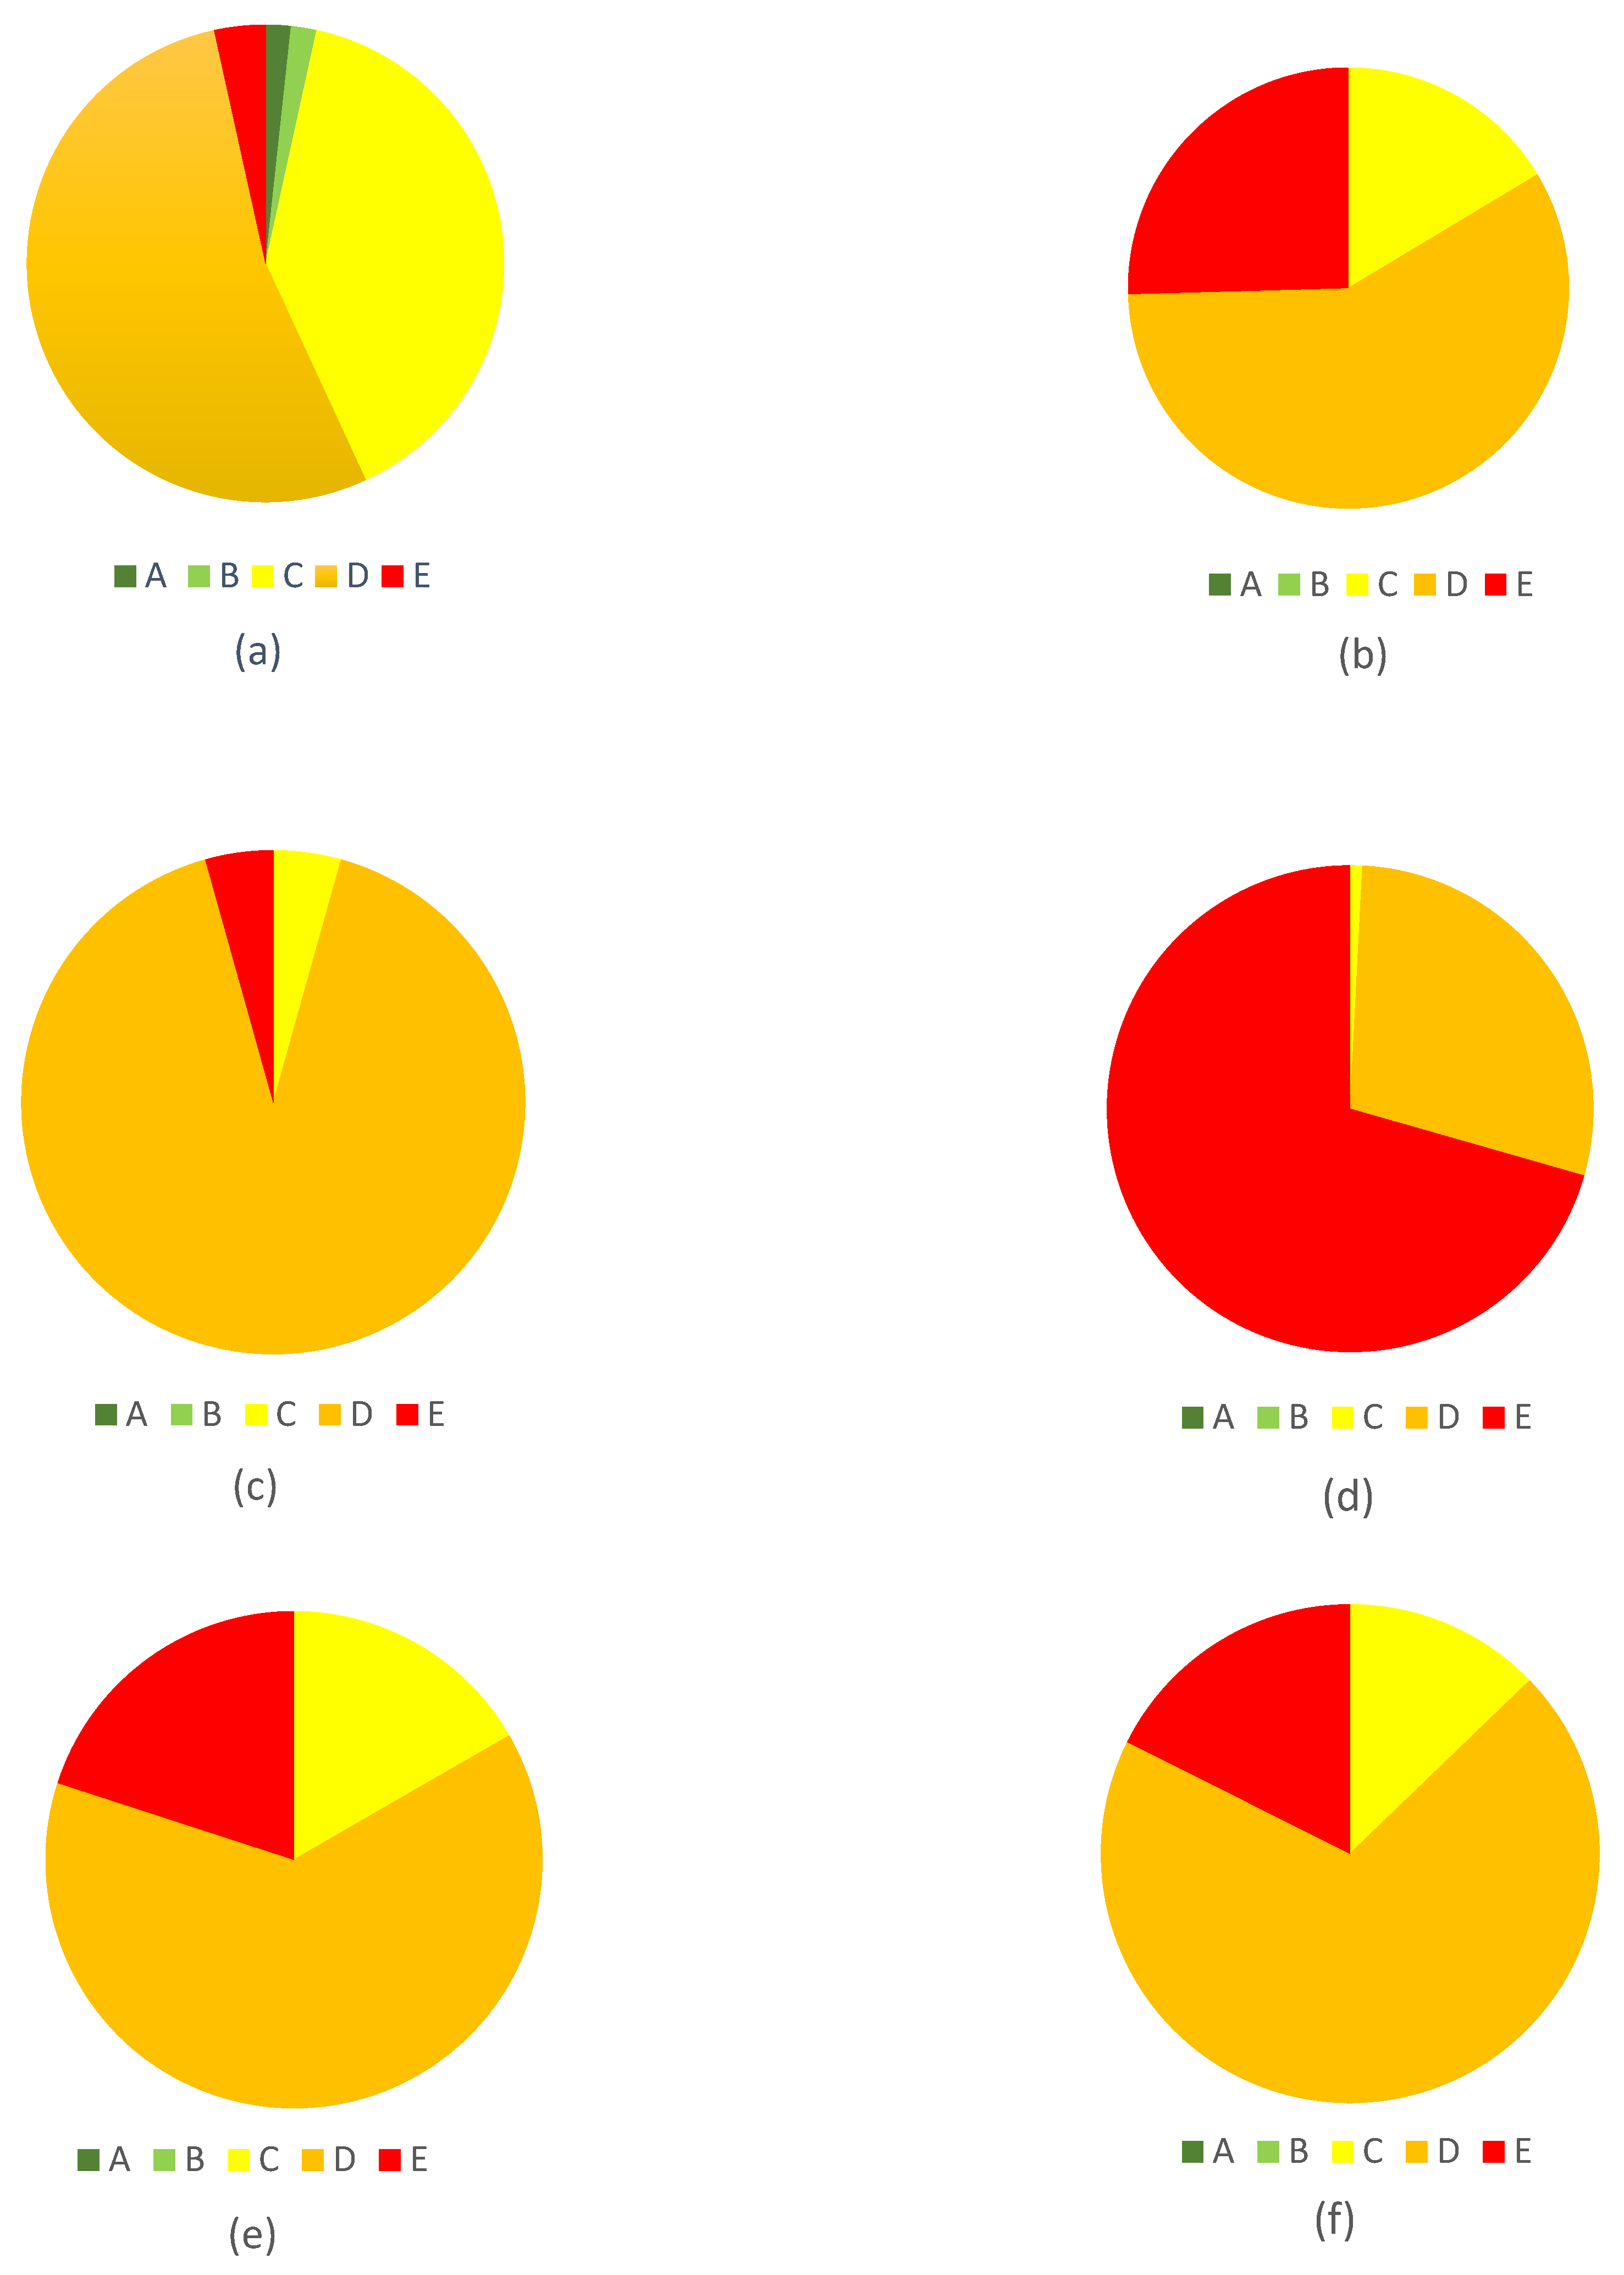
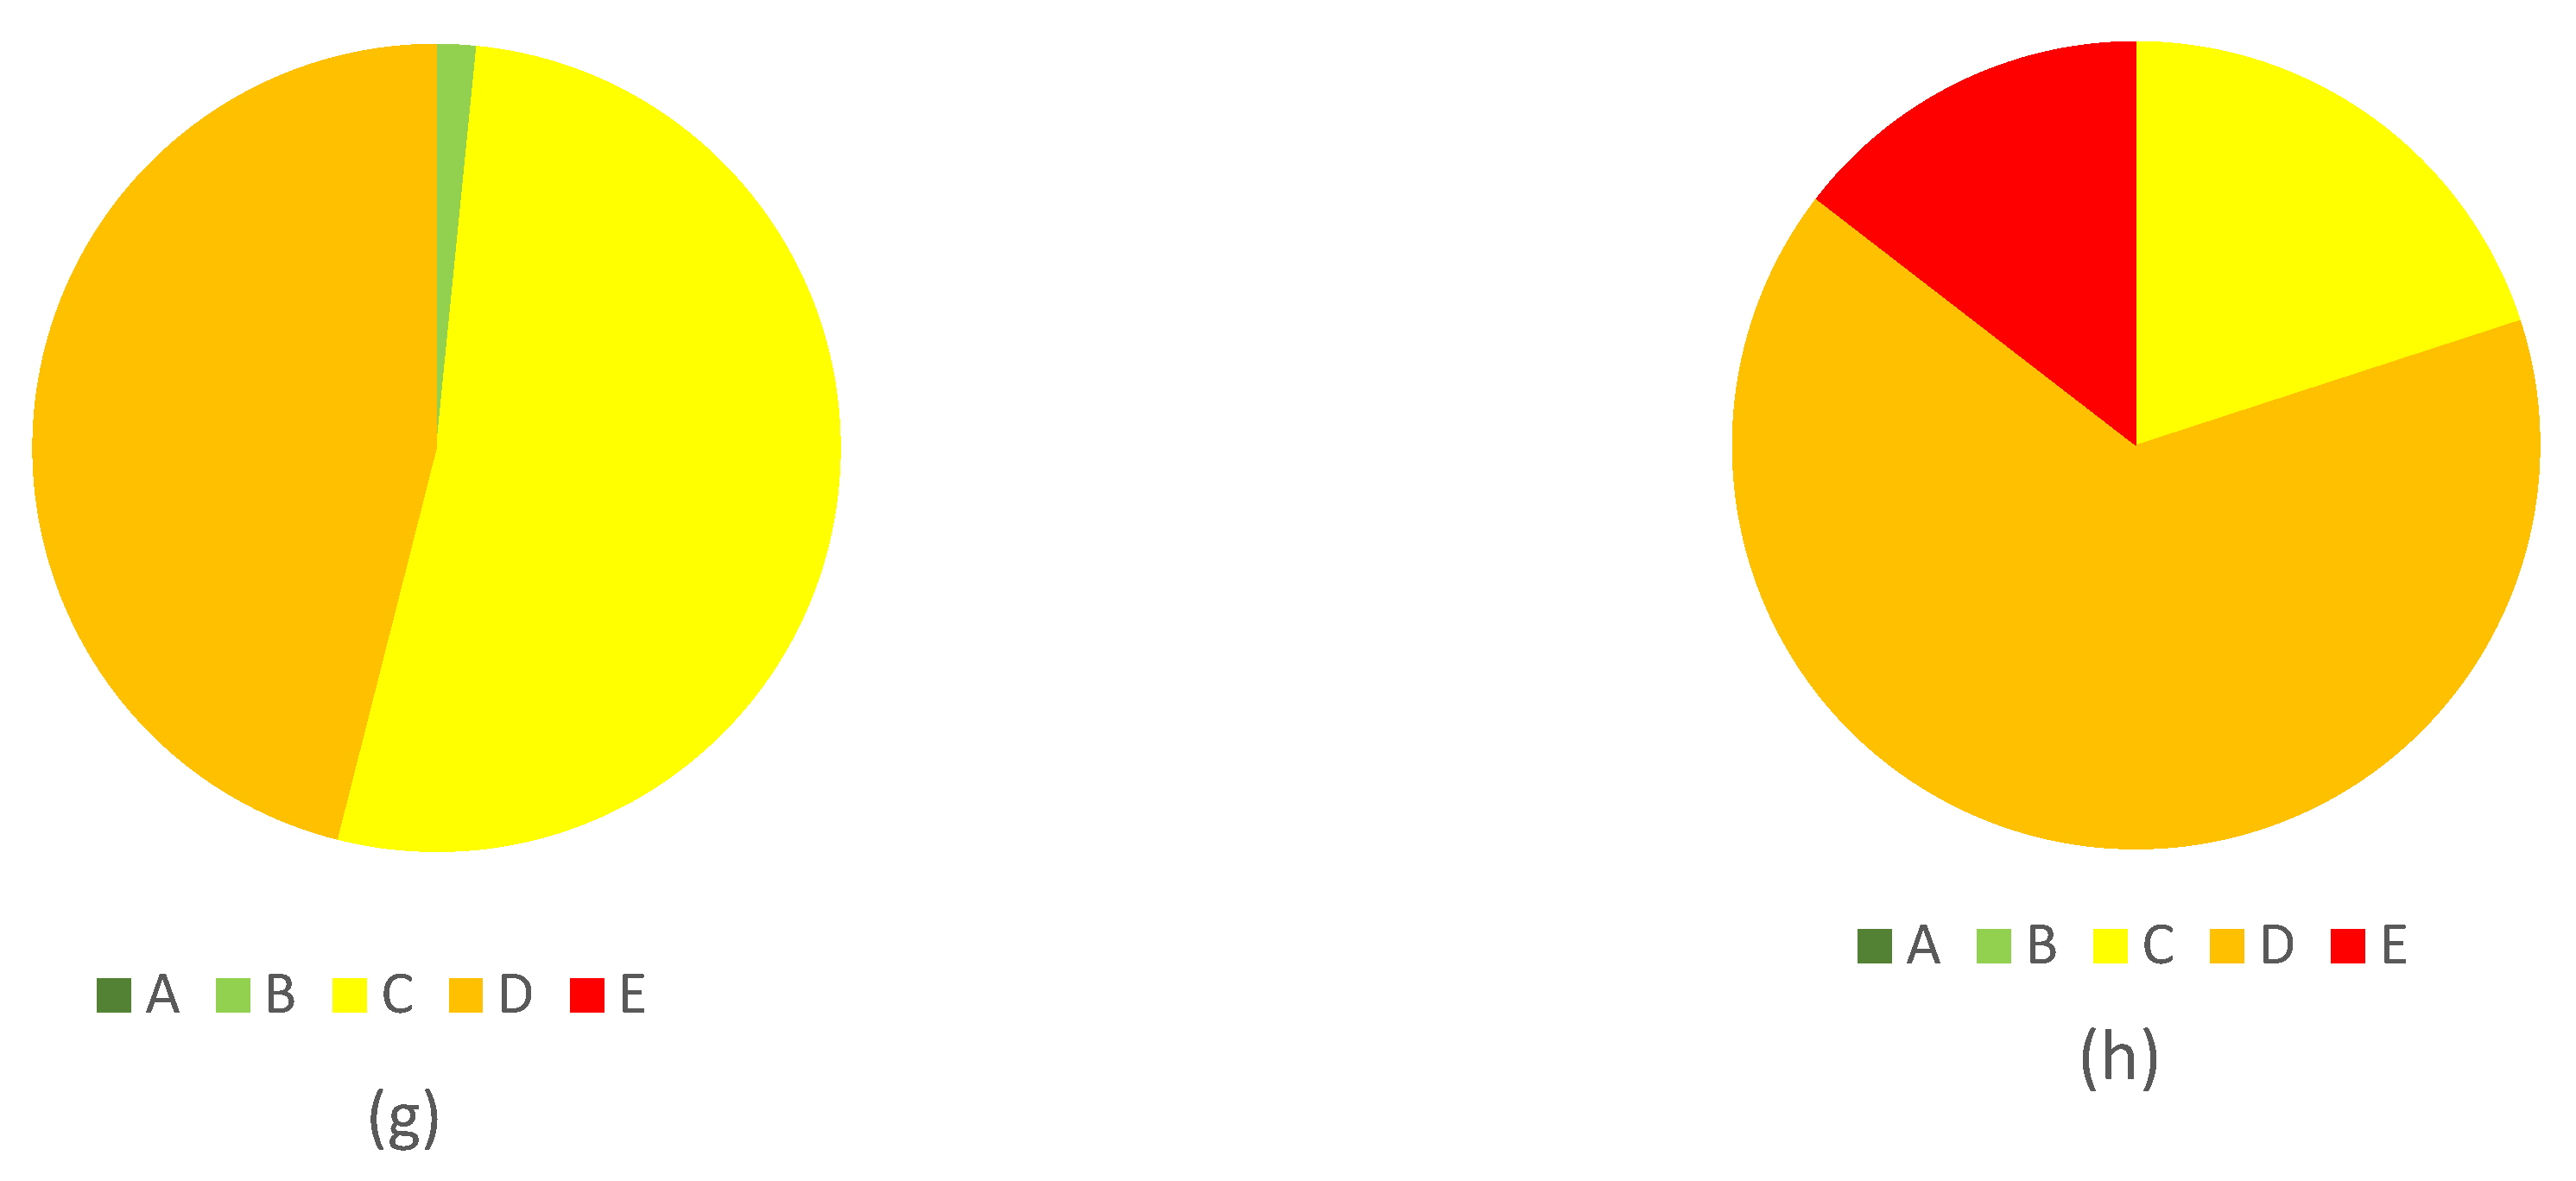
3.1. Distribution of the Nutri-Score Classes within Different Food Groups
3.2. Comparison of Original and Refined Algorithms
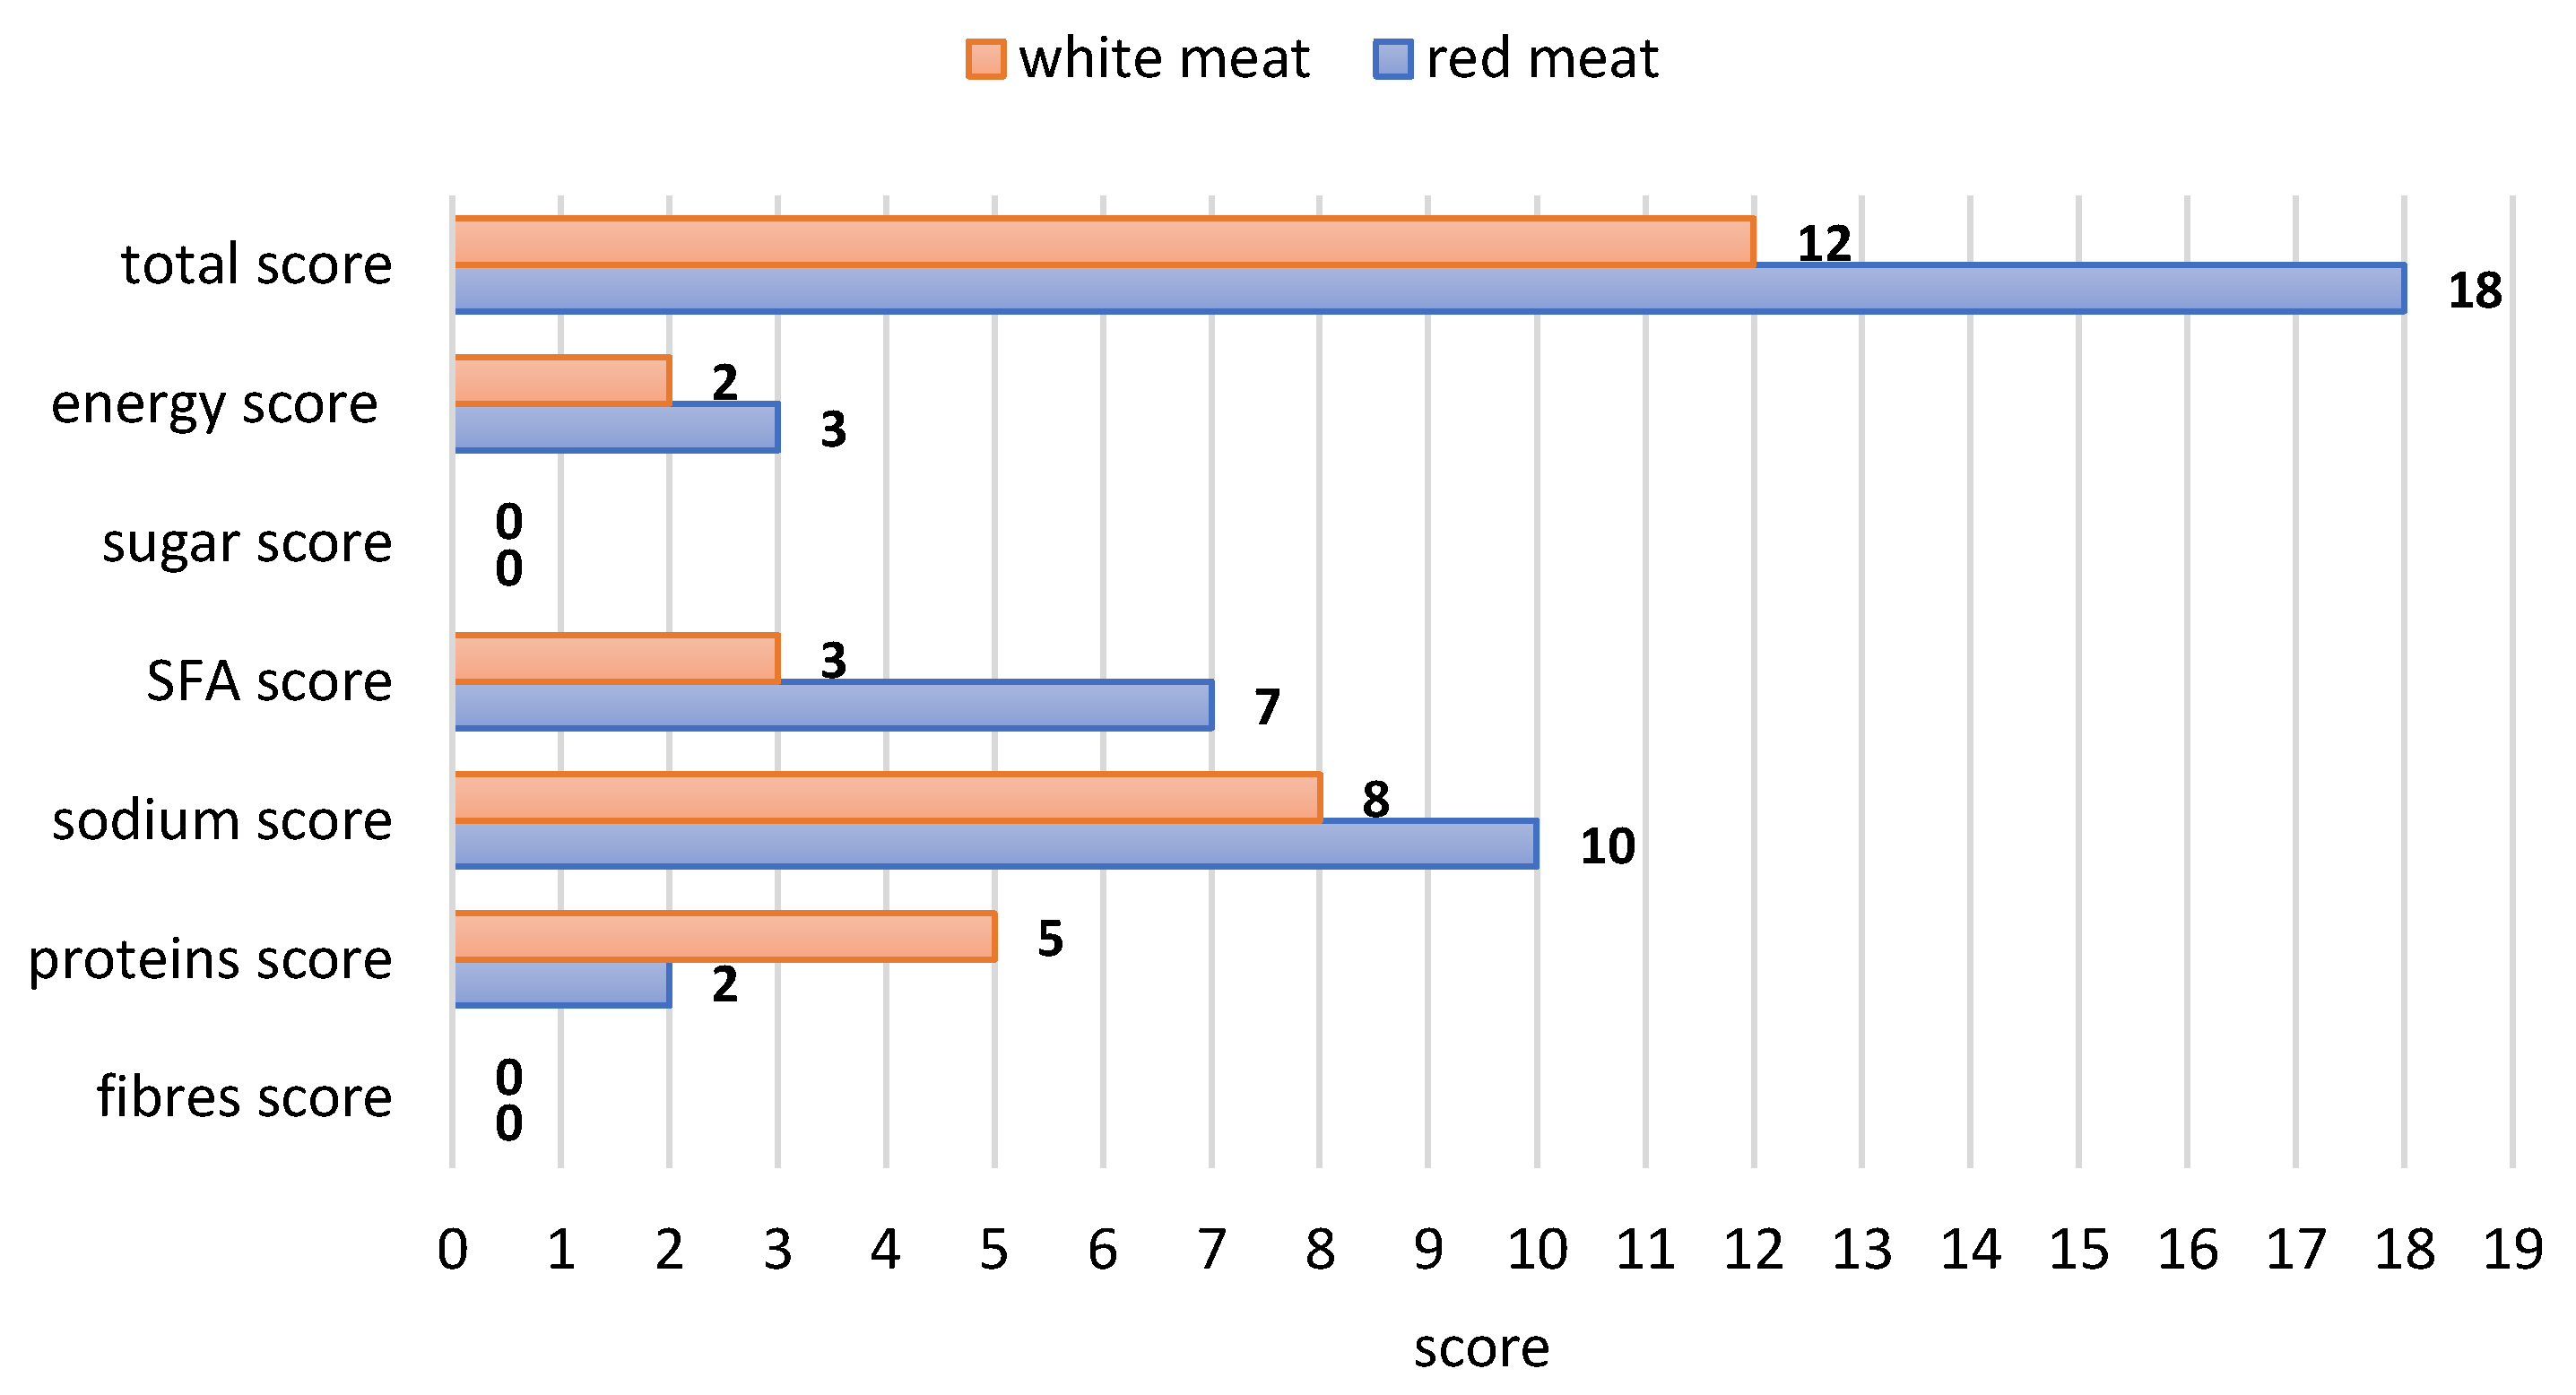
3.3. Comparison of White and Red Meat Products
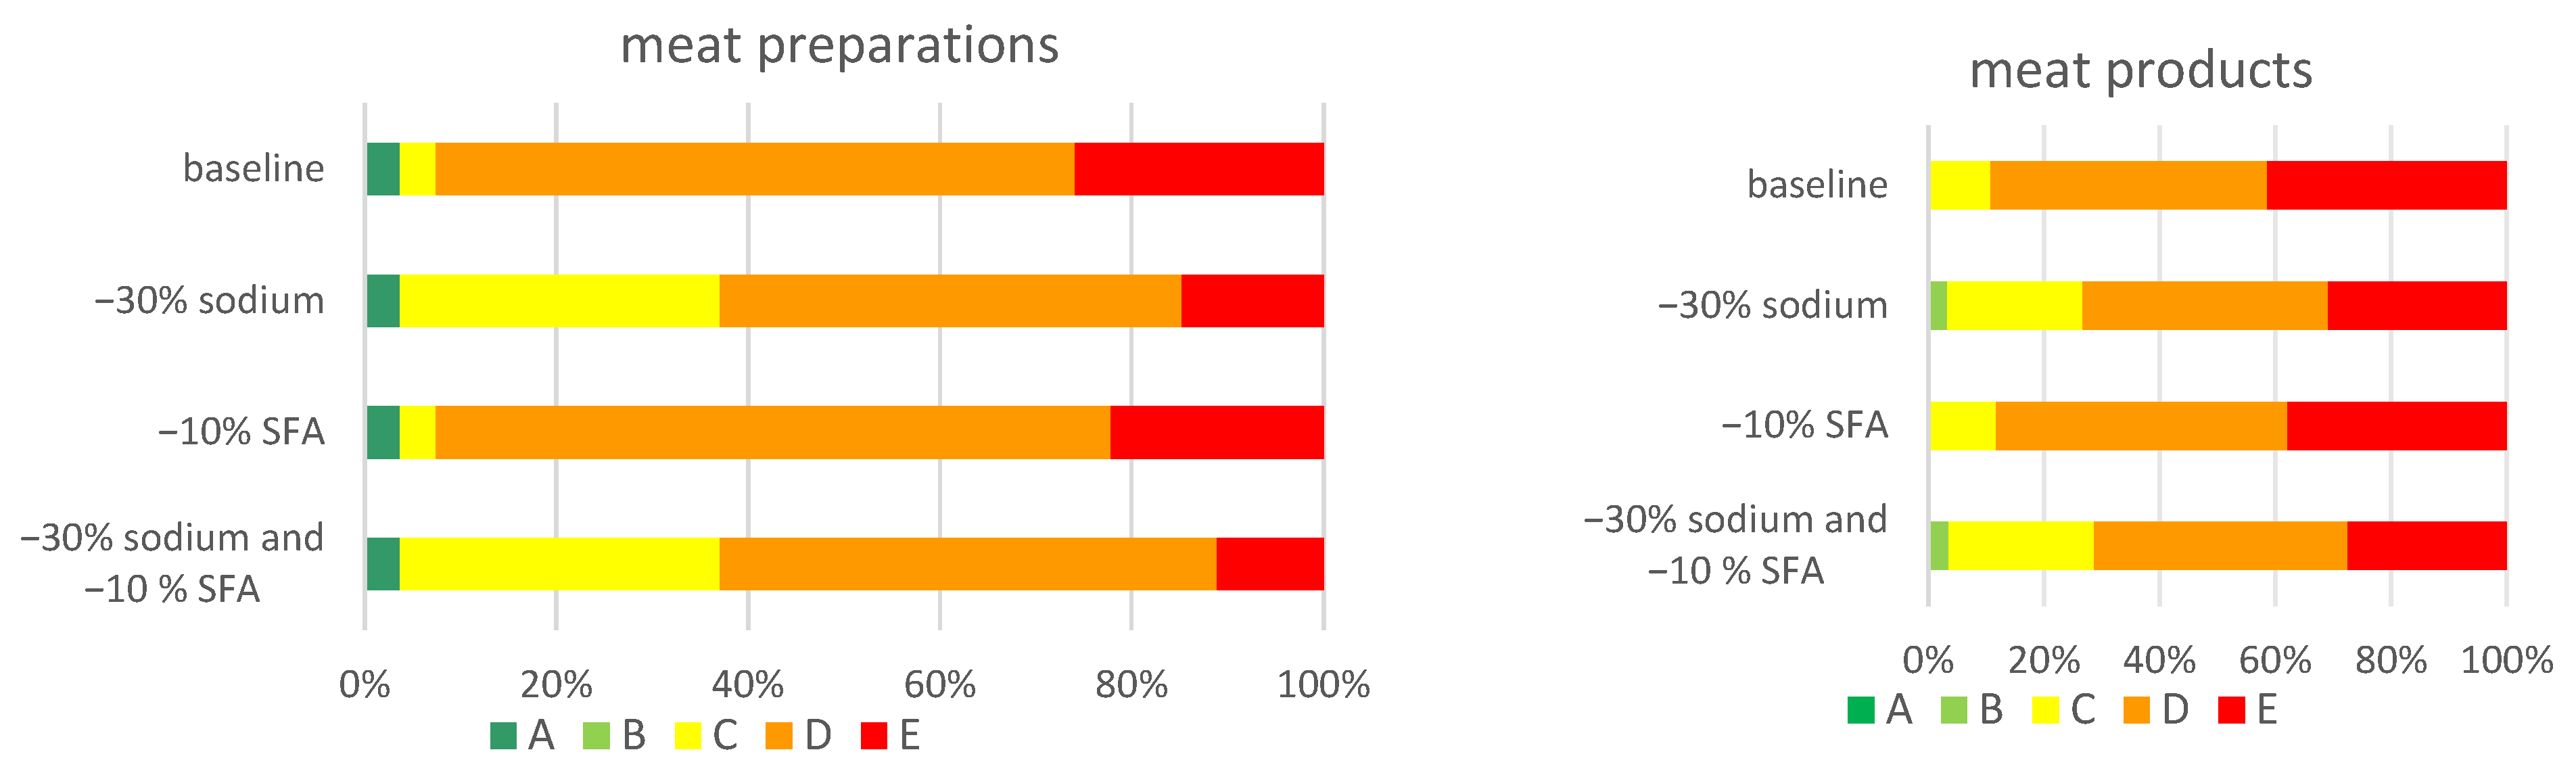
3.4. The Formulation Change Scenarios
3.5. Salt Content and the Presence of Flavour Enhancers in Products
4. Discussion
5. Conclusions
Author Contributions
Funding
Institutional Review Board Statement
Informed Consent Statement
Data Availability Statement
Conflicts of Interest
References
- Geiker, N.R.W.; Bertram, H.C.; Mejborn, H.; Dragsted, L.O.; Kristensen, L.; Carrascal, J.R.; Bügel, S.; Astrup, A. Meat and Human Health—Current Knowledge and Research Gaps. Foods 2021, 10, 1556. [Google Scholar] [CrossRef] [PubMed]
- Laskowski, W.; Górska-Warsewicz, H.; Kulykovets, O. Meat, Meat Products and Seafood as Sources of Energy and Nutrients in the Average Polish Diet. Nutrients 2018, 10, 1412. [Google Scholar] [CrossRef]
- Thornton, P.K. Livestock production: Recent trends, future prospects. Philosophical transactions of the Royal Society of London. Biol. Sci. 2010, 365, 2853–2867. [Google Scholar] [CrossRef]
- Daniel, C.R.; Cross, A.J.; Koebnick, C.; Sinha, R. Trends in meat consumption in the USA. Public Health Nutr. 2011, 14, 575–583. [Google Scholar] [CrossRef]
- Pan, A.; Sun, Q.; Bernstein, A.M.; Schulze, M.B.; Manson, J.E.; Willett, W.C.; Hu, F.B. Red meat consumption and risk of type 2 diabetes: 3 cohorts of US adults and an updated meta-analysis. Am. J. Clin. Nutr. 2011, 94, 1088–1096. [Google Scholar] [CrossRef] [PubMed]
- Micha, R.; Wallace, S.K.; Mozaffarian, D. Red and processed meat consumption and risk of incident coronary heart disease, stroke, and diabetes mellitus: A systematic review and meta-analysis. Circulation 2010, 121, 2271–2283. [Google Scholar] [CrossRef] [PubMed]
- Steinbrecher, A.; Erber, E.; Grandinetti, A.; Kolonel, L.N.; Maskarinec, G. Meat consumption and risk of type 2 diabetes: The Multiethnic Cohort. Public Health Nutr. 2011, 14, 568–574. [Google Scholar] [CrossRef]
- Micha, R.; Michas, G.; Mozaffarian, D. Unprocessed red and processed meats and risk of coronary artery disease and type 2 diabetes—An updated review of the evidence. Curr. Atheroscler. Rep. 2012, 14, 515–524. [Google Scholar] [CrossRef]
- Schwingshackl, L.; Hoffmann, G.; Lampousi, A.M.; Knüppel, S.; Iqbal, K.; Schwedhelm, C.; Bechthold, A.; Schlesinger, S.; Boeing, H. Food groups and risk of type 2 diabetes mellitus: A systematic review and meta-analysis of prospective studies. Eur. J. Epidemiol. 2017, 32, 363–375. [Google Scholar] [CrossRef]
- Zhang, R.; Fu, J.; Moore, J.B.; Stoner, L.; Li, R. Processed and Unprocessed Red Meat Consumption and Risk for Type 2 Diabetes Mellitus: An Updated Meta-Analysis of Cohort Studies. Int. J. Environ. Res. Public Health 2021, 18, 10788. [Google Scholar] [CrossRef]
- Abete, I.; Romaguera, D.; Vieira, A.R.; Lopez de Munain, A.; Norat, T. Association between total, processed, red and white meat consumption and all-cause, CVD and IHD mortality: A meta-analysis of cohort studies. Br. J. Nutr. 2014, 112, 762–775. [Google Scholar] [CrossRef] [PubMed]
- Yang, C.; Pan, L.; Sun, C.; Xi, Y.; Wang, L.; Li, D. Red Meat Consumption and the Risk of Stroke: A Dose-Response Meta-analysis of Prospective Cohort Studies. J. Stroke Cerebrovasc. Dis. 2016, 25, 1177–1186. [Google Scholar] [CrossRef] [PubMed]
- Kim, K.; Hyeon, J.; Lee, S.A.; Kwon, S.O.; Lee, H.; Keum, N.; Lee, J.K.; Park, S.M. Role of Total, Red, Processed, and White Meat Consumption in Stroke Incidence and Mortality: A Systematic Review and Meta-Analysis of Prospective Cohort Studies. J. Am. Heart Assoc. 2017, 6, e005983. [Google Scholar] [CrossRef]
- Kaluza, J.; Wolk, A.; Larsson, S.C. Red meat consumption and risk of stroke: A meta-analysis of prospective studies. Stroke 2012, 43, 2556–2560. [Google Scholar] [CrossRef] [PubMed]
- Chen, G.C.; Lv, D.B.; Pang, Z.; Liu, Q.F. Red and processed meat consumption and risk of stroke: A meta-analysis of prospective cohort studies. Eur. J. Clin. Nutr. 2013, 67, 91–95. [Google Scholar] [CrossRef] [PubMed]
- Keszei, A.P.; Schouten, L.J.; Goldbohm, R.A.; van den Brandt, P.A. Red and processed meat consumption and the risk of esophageal and gastric cancer subtypes in The Netherlands Cohort Study. Ann. Oncol. 2012, 23, 2319–2326. [Google Scholar] [CrossRef] [PubMed]
- Qu, X.; Ben, Q.; Jiang, Y. Consumption of red and processed meat and risk for esophageal squamous cell carcinoma based on a meta-analysis. Ann. Epidemiol. 2013, 23, 762–770. [Google Scholar] [CrossRef]
- Kim, S.R.; Kim, K.; Lee, S.A.; Kwon, S.O.; Lee, J.K.; Keum, N.; Park, S.M. Effect of Red, Processed, and White Meat Consumption on the Risk of Gastric Cancer: An Overall and Dose–Response Meta-Analysis. Nutrients 2019, 11, 826. [Google Scholar] [CrossRef]
- Cross, A.J.; Leitzmann, M.F.; Gail, M.H.; Hollenbeck, A.R.; Schatzkin, A.; Sinha, R. A prospective study of red and processed meat intake in relation to cancer risk. PLoS Med. 2007, 4, e325. [Google Scholar] [CrossRef]
- Chan, D.S.; Lau, R.; Aune, D.; Vieira, R.; Greenwood, D.C.; Kampman, E.; Norat, T. Red and processed meat and colorectal cancer incidence: Meta-analysis of prospective studies. PLoS ONE 2011, 6, e20456. [Google Scholar] [CrossRef]
- International Agency for Research on Cancer (IARC). Estimates of the Cancer Incidence and Mortality in 2018, and Projections for the Next 20 Years; IARC Press: Lyon, France, 2018; Volume 263, Available online: https://www.iarc.who.int/wp-content/uploads/2018/07/pr240_E.pdf (accessed on 18 March 2023).
- Larsson, S.C.; Wolk, A. Red and processed meat consumption and risk of pancreatic cancer: Meta-analysis of prospective studies. Br. J. Cancer 2012, 106, 603–607. [Google Scholar] [CrossRef]
- Guo, J.; Wei, W.; Zhan, L. Red and processed meat intake and risk of breast cancer: A meta-analysis of prospective studies. Breast Cancer Res. Treat. 2015, 151, 191–198. [Google Scholar] [CrossRef]
- Inoue-Choi, M.; Sinha, R.; Gierach, G.L.; Ward, M.H. Red and processed meat, nitrite, and heme iron intakes and postmenopausal breast cancer risk in the NIH-AARP Diet and Health Study. Int. J. Cancer 2016, 138, 1609–1618. [Google Scholar] [CrossRef]
- Farvid, M.S.; Stern, M.C.; Norat, T.; Sasazuki, S.; Vineis, P.; Weijenberg, M.P.; Wolk, A.; Wu, K.; Stewart, B.W.; Cho, E. Consumption of red and processed meat and breast cancer incidence: A systematic review and meta-analysis of prospective studies. Int. J. Cancer 2018, 143, 2787–2799. [Google Scholar] [CrossRef]
- Anderson, J.J.; Darwis, N.D.M.; Mackay, D.F.; Celis-Morales, C.A.; Lyall, D.M.; Sattar, N.; Gill, J.M.R.; Pell, J.P. Red and processed meat consumption and breast cancer: UK Biobank cohort study and meta-analysis. Eur. J. Cancer 2018, 90, 73–82. [Google Scholar] [CrossRef] [PubMed]
- Larsson, S.C.; Orsini, N. Red meat and processed meat consumption and all-cause mortality: A meta-analysis. Am. J. Epidemiol. 2014, 179, 282–289. [Google Scholar] [CrossRef]
- Zhong, V.W.; Van Horn, L.; Greenland, P.; Carnethon, M.R.; Ning, H.; Wilkins, J.T.; Lloyd-Jones, D.M.; Allen, N.B. Associations of Processed Meat, Unprocessed Red Meat, Poultry, or Fish Intake With Incident Cardiovascular Disease and All-Cause Mortality. JAMA Intern. Med. 2020, 180, 503–512. [Google Scholar] [CrossRef] [PubMed]
- Wang, X.; Lin, X.; Ouyang, Y.Y.; Liu, J.; Zhao, G.; Pan, A.; Hu, F.B. Red and processed meat consumption and mortality: Dose-response meta-analysis of prospective cohort studies. Public Health Nutr. 2016, 19, 893–905. [Google Scholar] [CrossRef] [PubMed]
- Pan, A.; Sun, Q.; Bernstein, A.M.; Schulze, M.B.; Manson, J.E.; Stampfer, M.J.; Willett, W.C.; Hu, F.B. Red meat consumption and mortality: Results from 2 prospective cohort studies. Arch. Intern. Med. 2012, 172, 555–563. [Google Scholar]
- Rohrmann, S.; Overvad, K.; Bueno-de-Mesquita, H.B.; Jakobsen, M.U.; Egeberg, R.; Tjønneland, A.; Nailler, L.; Boutron-Ruault, M.C.; Clavel-Chapelon, F.; Krogh, V.; et al. Meat consumption and mortality—Results from the European Prospective Investigation into Cancer and Nutrition. BMC Med. 2013, 11, 63. [Google Scholar] [CrossRef]
- Stoś, K.; Rychlik, E.; Woźniak, A.; Ołtarzewski, M. Red and Processed Meat Consumption in Poland. Foods 2022, 11, 3283. [Google Scholar] [CrossRef]
- Micha, R.; Khatibzadeh, S.; Shi, P.; Andrews, K.G.; Engell, R.E.; Mozaffarian, D.; Global Burden of Diseases Nutrition and Chronic Diseases Expert Group (NutriCoDE). Global, regional and national consumption of major food groups in 1990 and 2010: A systematic analysis including 266 country-specific nutrition surveys worldwide. BMJ Open 2015, 5, e008705. [Google Scholar]
- World Health Organization. Salt Reduction. Available online: https://www.who.int/news-room/fact-sheets/detail/salt-reduction (accessed on 10 March 2023).
- Regulation (EC) No. 1169/2011 of the European Parliament and of the Council of 25 October 2011 on the provision of food information to consumers. Off. J. Eur. Union 2011, L304, 18–63.
- World Health Organization. Global Status Report on Noncommunicable Diseases 2014; World Health Organization: Geneva, Switzerland, 2014; pp. 1–302. [Google Scholar]
- World Health Organization. Report of the Commission on Ending Childhood Obesity; World Health Organization: Geneva, Switzerland, 2016; pp. 1–68. [Google Scholar]
- World Health Organization. Guiding Principles and Framework Manual for Front-of-Pack Labelling for Promoting Healthy Diet; World Health Organization: Geneva, Switzerland, 2018; pp. 1–46. [Google Scholar]
- World Health Organization. Technical Meeting on Nutrition Labelling for Promoting Healthy Diets; World Health Organization: Lisbon, Portugal, 2015; pp. 1–2. [Google Scholar]
- Kanter, R.; Vanderlee, L.; Vandevijvere, S. Front-of-package nutrition labelling policy: Global progress and future directions. Public Health Nutr. 2018, 21, 1399–1408. [Google Scholar] [CrossRef] [PubMed]
- Nutrinform Battery. Available online: https://www.nutrinformbattery.it/ (accessed on 18 March 2023).
- UK Government. Front-of-Pack (FoP) Nutrition Labelling: Guidance. Available online: https://assets.publishing.service.gov.uk/government/uploads/system/uploads/attachment_data/file/566251/FoP_Nutrition_labelling_UK_guidance.pdf (accessed on 18 March 2023).
- European Commission. Report from the Commission to the European Parliament and the Council Regarding the Use of Additional Forms of Expression and Presentation of the Nutrition Declaration. COM(2020) 207 Final; European Commission: Brussels, Belgium, 2020; pp. 1–27. [Google Scholar]
- Eurofins. Nutri-Score. Available online: https://www.eurofins.de/food-analysis/food-news/food-testing-news/nutri-score/ (accessed on 18 March 2023).
- Swiss Federal Food Safety and Veterinary Office. Nutri-Score. Available online: https://www.blv.admin.ch/nutri-score (accessed on 19 March 2023).
- Italian Competition Authority (AGCM). Bollettino 29/2022. Available online: https://www.agcm.it/pubblicazioni/bollettino-settimanale/2022/29/Bollettino-29-2022 (accessed on 19 March 2023).
- Food Compliance International. Italian Competition Authority (AGCM) Sanctions the Use of Nutri-Score Once Again. Available online: https://foodcomplianceinternational.com/industry-insight/scholarly-articles/3253-italian-competition-authority-agcm-sanctions-the-use-of-nutriscore-once-again (accessed on 19 March 2023).
- Food Navigator. Romania Prepares for Nutri-Score Ban: A Regrettable Decision for Some. Available online: https://www.foodnavigator.com/Article/2023/04/26/romania-prepares-for-nutri-score-ban-a-regrettable-decision-for-some (accessed on 29 April 2023).
- Regulation (EC) No. 853/2004 of the European Parliament and of the Council of 29 April 2004. Laying down specific hygiene rules for food of animal origin. Off. J. Eur. Union 2004, L139, 55–205.
- Ministry of Finance. Dane z Zeznań Podatkowych Podatników, o Których Mowa w art. 27b Ustawy z dnia 15 Lutego 1992 r. o Podatku Dochodowym od Osób Prawnych (Dz. U. z 2017 r. poz. 2343, ze zm.) oraz w Ustawie z 24 Listopada 2017 r. o Zmianie Ustawy o Podatku Dochodowym od Osób Prawnych (Dz. U. poz. 2369). Available online: https://gov.pl (accessed on 16 June 2019).
- Statistics Poland. Demographic Yearbook of Poland 2018. Available online: https://stat.gov.pl (accessed on 17 June 2019).
- Polska Norma PN-A-82007; Przetwory Mięsne—Wędliny. Polish Committee for Standardization: Warsaw, Poland, 1996; pp. 1–12.
- Public Health France. Nutri-Score Frequently Asked Question. Available online: https://www.santepubliquefrance.fr/media/files/02-determinants-de-sante/nutrition-et-activite-physique/nutri-score/qr-scientifique-technique-en (accessed on 18 May 2020).
- Scientific Committee of the Nutri-Score. Update of the Nutri-Score Algorithm. Available online: https://www.aesan.gob.es/AECOSAN/docs/documentos/Nutri_Score/2022_main_algorithm_report_update_FINAL.pdf (accessed on 24 February 2023).
- World Health Organization. Salt Reduction and Iodine Fortification Strategies in Public Health: Report of a Joint Technical Meeting Convened by the World Health Organization and the George Institute for Global Health in Collaboration with the International Council for the Control of Iodine Deficiency Disorders Global Network, Sydney, Australia, March 2013; World Health Organization: Geneva, Switzerland, 2014; pp. 1–36. [Google Scholar]
- Vyth, E.L.; Steenhuis, I.H.; Roodenburg, A.J.; Brug, J.; Seidell, J.C. Front-of-pack nutrition label stimulates healthier product development: A quantitative analysis. Int. J. Behav. Nutr. Phys. Act. 2010, 7, 65. [Google Scholar] [CrossRef] [PubMed]
- Narodowe Centrum Edukacji Żywieniowej. A Plate of Healthy Eating. Available online: https://ncez.pzh.gov.pl/abc-zywienia-/zasady-zdrowego-zywienia/talerz-zdrowego-zywienia/ (accessed on 13 March 2023).
- European Commission. Food-Based Dietary Guidelines for Europe. Available online: https://knowledge4policy.ec.europa.eu/health-promotion-knowledge-gateway/food-based-dietary-guidelines-europe-table-8_en (accessed on 18 March 2023).
- Dréano-Trécant, L.; Egnell, M.; Hercberg, S.; Galan, P.; Soudon, J.; Fialon, M.; Touvier, M.; Kesse-Guyot, E.; Julia, C. Performance of the Front-of-Pack Nutrition Label Nutri-Score to Discriminate the Nutritional Quality of Foods Products: A Comparative Study across 8 European Countries. Nutrients 2020, 12, 1303. [Google Scholar] [CrossRef] [PubMed]
- Szabo de Edelenyi, F.; Egnell, M.; Galan, P.; Druesne-Pecollo, N.; Hercberg, S.; Julia, C. Ability of the Nutri-Score front-of-pack nutrition label to discriminate the nutritional quality of foods in the German food market and consistency with nutritional recommendations. Arch. Public Health 2019, 77, 28. [Google Scholar] [CrossRef]
- Franco-Arellano, B.; Vanderlee, L.; Ahmed, M.; Oh, A.; L’Abbé, M. Influence of front-of-pack labelling and regulated nutrition claims on consumers’ perceptions of product healthfulness and purchase intentions: A randomized controlled trial. Appetite 2020, 149, 104629. [Google Scholar] [CrossRef]
- Egnell, M.; Talati, Z.; Hercberg, S.; Pettigrew, S.; Julia, C. Objective Understanding of Front-of-Package Nutrition Labels: An International Comparative Experimental Study across 12 Countries. Nutrients 2018, 10, 1542. [Google Scholar] [CrossRef]
- Hersey, J.C.; Wohlgenant, K.C.; Arsenault, J.E.; Kosa, K.M.; Muth, M.K. Effects of front-of-package and shelf nutrition labeling systems on consumers. Nutr Rev. 2013, 71, 1–14. [Google Scholar] [CrossRef]
- Grummon, A.H.; Musicus, A.A.; Moran, A.J.; Salvia, M.G.; Rimm, E.B. Consumer Reactions to Positive and Negative Front-of-Package Food Labels. Am. J. Prev. Med. 2023, 64, 86–95. [Google Scholar] [CrossRef]
- Egnell, M.; Talati, Z.; Gombaud, M.; Galan, P.; Hercberg, S.; Pettigrew, S.; Julia, C. Consumers’ Responses to Front-of-Pack Nutrition Labelling: Results from a Sample from The Netherlands. Nutrients 2019, 11, 1817. [Google Scholar] [CrossRef] [PubMed]
- Egnell, M.; Talati, Z.; Pettigrew, S.; Galan, P.; Hercberg, S.; Julia, C. Comparison of front-of-pack labels to help German consumers understand the nutritional quality of food products. Ernähr. Umsch. 2019, 66, 76–84. [Google Scholar]
- Goiana-da-Silva, F.; Cruz-E-Silva, D.; Nobre-da-Costa, C.; Nunes, A.M.; Fialon, M.; Egnell, M.; Galan, P.; Julia, C.; Talati, Z.; Pettigrew, S.; et al. Nutri-Score: The Most Efficient Front-of-Pack Nutrition Label to Inform Portuguese Consumers on the Nutritional Quality of Foods and Help Them Identify Healthier Options in Purchasing Situations. Nutrients 2021, 13, 4335. [Google Scholar] [CrossRef]
- Egnell, M.; Galan, P.; Farpour-Lambert, N.J.; Talati, Z.; Pettigrew, S.; Hercberg, S.; Julia, C. Compared to other front-of-pack nutrition labels, the Nutri-Score emerged as the most efficient to inform Swiss consumers on the nutritional quality of food products. PLoS ONE 2020, 15, e0228179. [Google Scholar] [CrossRef]
- Kontopoulou, L.; Karpetas, G.; Fradelos, Ε.C.; Papathanasiou, I.V.; Malli, F.; Papagiannis, D.; Mantzaris, D.; Fialon, M.; Julia, C.; Gourgoulianis, K.I. Online Consumer Survey Comparing Different Front-of-Pack Labels in Greece. Nutrients 2021, 14, 46. [Google Scholar] [CrossRef] [PubMed]
- Andreeva, V.A.; Egnell, M.; Stoś, K.; Przygoda, B.; Talati, Z.; Touvier, M.; Galan, P.; Hercberg, S.; Pettigrew, S.; Julia, C. Polish Consumers’ Understanding of Different Front-of-Package Food Labels: A Randomized Experiment. Foods 2022, 11, 134. [Google Scholar] [CrossRef] [PubMed]
- Vandevijvere, S.; Vermote, M.; Egnell, M.; Galan, P.; Talati, Z.; Pettigrew, S.; Hercberg, S.; Julia, C. Consumers’ food choices, understanding and perceptions in response to different front-of-pack nutrition labelling systems in Belgium: Results from an online experimental study. Arch. Public Health 2020, 78, 30. [Google Scholar] [CrossRef]
- Fialon, M.; Babio, N.; Salas-Salvadó, J.; Galan, P.; Kesse-Guyot, E.; Touvier, M.; Deschasaux-Tanguy, M.; Sarda, B.; Hercberg, S.; Khoury, N.; et al. Comparative understanding and preference of Nutri-Score and NutrInform Battery in a sample of Spanish consumers. Eur. J. Public Health 2023, 33, 293–298. [Google Scholar] [CrossRef]
- Ducrot, P.; Méjean, C.; Julia, C.; Kesse-Guyot, E.; Touvier, M.; Fezeu, L.K.; Hercberg, S.; Péneau, S. Objective Understanding of Front-of-Package Nutrition Labels among Nutritionally At-Risk Individuals. Nutrients 2015, 7, 7106–7125. [Google Scholar] [CrossRef] [PubMed]
- Egnell, M.; Crosetto, P.; d’Almeida, T.; Kesse-Guyot, E.; Touvier, M.; Ruffieux, B.; Hercberg, S.; Muller, L.; Julia, C. Modelling the impact of different front-of-package nutrition labels on mortality from non-communicable chronic disease. Int. J. Behav. Nutr. Phys. Act. 2019, 16, 56. [Google Scholar] [CrossRef] [PubMed]
- Egnell, M.; Boutron, I.; Péneau, S.; Ducrot, P.; Touvier, M.; Galan, P.; Fezeu, L.; Porcher, R.; Ravaud, P.; Hercberg, S.; et al. Impact of the Nutri-Score front-of-pack nutrition label on purchasing intentions of individuals with chronic diseases: Results of a randomised trial. BMJ Open 2022, 12, e058139. [Google Scholar] [CrossRef]
- Carruba, M.O.; Caretto, A.; De Lorenzo, A.; Fatati, G.; Ghiselli, A.; Lucchin, L.; Maffeis, C.; Malavazos, A.; Malfi, G.; Riva, E.; et al. Front-of-pack (FOP) labelling systems to improve the quality of nutrition information to prevent obesity: NutrInform Battery vs Nutri-Score. Eat Weight Disord. 2022, 27, 1575–1584. [Google Scholar] [CrossRef]
- Martini, D.; Marangoni, F.; Banterle, A.; Donini, L.M.; Riccardi, G.; Poli, A.; Pellegrini, N. Relationship between front-of-pack labeling and nutritional characteristics of food products: An attempt of an analytical approach. Front. Nutr. 2022, 9, 963592. [Google Scholar] [CrossRef] [PubMed]
- Włodarek, D.; Dobrowolski, H. Fantastic Foods and Where to Find Them-Advantages and Disadvantages of Nutri-Score in the Search for Healthier Food. Nutrients 2022, 14, 4843. [Google Scholar] [CrossRef]
- Egnell, M.; Seconda, L.; Neal, B.; Mhurchu, C.N.; Rayner, M.; Jones, A.; Touvier, M.; Kesse-Guyot, E.; Hercberg, S.; Julia, C. Prospective associations of the original Food Standards Agency nutrient profiling system and three variants with weight gain, overweight and obesity risk: Results from the French NutriNet-Santé cohort. Br. J. Nutr. 2021, 125, 902–914. [Google Scholar] [CrossRef]
- Julia, C.; Ducrot, P.; Lassale, C.; Fézeu, L.; Méjean, C.; Péneau, S.; Touvier, M.; Hercberg, S.; Kesse-Guyot, E. Prospective associations between a dietary index based on the British Food Standard Agency nutrient profiling system and 13-year weight gain in the SU.VI.MAX cohort. Prev. Med. 2015, 81, 189–194. [Google Scholar] [CrossRef]
- Hawley, K.L.; Roberto, C.A.; Bragg, M.A.; Liu, P.J.; Schwartz, M.B.; Brownell, K.D. The science on front-of-package food labels. Public Health Nutr. 2013, 16, 430–439. [Google Scholar] [CrossRef]
- Ning, S.X.; Mainvil, L.A.; Thomson, R.K.; McLean, R.M. Dietary sodium reduction in New Zealand: Influence of the Tick label. Asia Pac. J. Clin. Nutr. 2017, 26, 1133–1138. [Google Scholar]
- Young, L.; Swinburn, B. Impact of the Pick the Tick food information programme on the salt content of food in New Zealand. Health Promot. Int. 2002, 17, 13–19. [Google Scholar] [CrossRef]
- Williams, P.; McMahon, A.; Boustead, R. A case study of sodium reduction in breakfast cereals and the impact of the Pick the Tick food information program in Australia. Health Promot. Int. 2003, 18, 51–56. [Google Scholar] [CrossRef]
- Thomson, R.K.; McLean, R.M.; Ning, S.X.; Mainvil, L.A. Tick front-of-pack label has a positive nutritional impact on foods sold in New Zealand. Public Health Nutr. 2016, 19, 2949–2958. [Google Scholar] [CrossRef] [PubMed]
- Dummer, J. Sodium reduction in Canadian food products with the health check program. Can. J. Diet. Pract. Res. 2012, 73, 227–232. [Google Scholar] [CrossRef] [PubMed]
- Mhurchu, C.N.; Eyles, H.; Choi, Y.H. Effects of a Voluntary Front-of-Pack Nutrition Labelling System on Packaged Food Reformulation: The Health Star Rating System in New Zealand. Nutrients 2017, 9, 918. [Google Scholar] [CrossRef] [PubMed]
- Hendriksen, M.A.; van Raaij, J.M.; Geleijnse, J.M.; Breda, J.; Boshuizen, H.C. Health gain by salt reduction in europe: A modelling study. PLoS ONE 2015, 10, e0118873. [Google Scholar] [CrossRef]
- Verma, A.K.; Banerjee, R. Low-sodium meat products: Retaining salty taste for sweet health. Crit. Rev. Food Sci. Nutr. 2012, 52, 72–84. [Google Scholar] [CrossRef]
- Barcenilla, C.; Álvarez-Ordóñez, A.; López, M.; Alvseike, O.; Prieto, M. Microbiological Safety and Shelf-Life of Low-Salt Meat Products-A Review. Foods 2022, 11, 2331. [Google Scholar] [CrossRef] [PubMed]
- Rust, P.; Ekmekcioglu, C. Impact of Salt Intake on the Pathogenesis and Treatment of Hypertension. Adv. Exp. Med. Biol. 2017, 956, 61–84. [Google Scholar]
- Strazzullo, P.; D’Elia, L.; Kandala, N.B.; Cappuccio, F.P. Salt intake, stroke, and cardiovascular disease: Meta-analysis of prospective studies. Br. Med. J. 2009, 339, b4567. [Google Scholar] [CrossRef]
- Poggio, R.; Gutierrez, L.; Matta, M.G.; Elorriaga, N.; Irazola, V.; Rubinstein, A. Daily sodium consumption and CVD mortality in the general population: Systematic review and meta-analysis of prospective studies. Public Health Nutr. 2015, 18, 695–704. [Google Scholar] [CrossRef] [PubMed]
- Cook, N.R.; Appel, L.J.; Whelton, P.K. Sodium Intake and All-Cause Mortality Over 20 Years in the Trials of Hypertension Prevention. J. Am. Coll. Cardiol. 2016, 68, 1609–1617. [Google Scholar] [CrossRef] [PubMed]
- Ma, H.; Xue, Q.; Wang, X.; Li, X.; Franco, O.H.; Li, Y.; Heianza, Y.; Manson, J.E.; Qi, L. Adding salt to foods and hazard of premature mortality. Eur. Heart J. 2022, 43, 2878–2888. [Google Scholar] [CrossRef] [PubMed]
- O’Donnell, M.; Mente, A.; Yusuf, S. Sodium intake and cardiovascular health. Circ. Res. 2015, 116, 1046–1057. [Google Scholar] [CrossRef]
- Alderman, M.H.; Cohen, H.W. Dietary sodium intake and cardiovascular mortality: Controversy resolved? Curr. Hypertens. Rep. 2012, 14, 193–201. [Google Scholar] [CrossRef]
- O’Donnell, M.; Mente, A.; Yusuf, S. Evidence relating sodium intake to blood pressure and CVD. Curr. Cardiol. Rep. 2014, 16, 529. [Google Scholar] [CrossRef]
- Liem, D.G.; Miremadi, F.; Keast, R.S. Reducing sodium in foods: The effect on flavor. Nutrients 2011, 3, 694–711. [Google Scholar] [CrossRef]
- Ruusunen, M.; Puolanne, E. Sodium in Meat Products. In Proceedings of the 50th International Congress of Meat Science and Technology, Helsinki, Finland, 8–13 August 2004. [Google Scholar]
- Nurmilah, S.; Cahyana, Y.; Utama, G.L.; Aït-Kaddour, A. Strategies to Reduce Salt Content and Its Effect on Food Characteristics and Acceptance: A Review. Foods 2022, 11, 3120. [Google Scholar] [CrossRef]
- Sleator, R.D.; Hill, C. Food reformulations for improved health: A potential risk for microbial food safety? Med. Hypotheses 2007, 69, 1323–1324. [Google Scholar] [CrossRef]
- Fraqueza, M.J.; Laranjo, M.; Elias, M.; Patarata, L. Microbiological hazards associated with salt and nitrite reduction in cured meat products: Control strategies based on antimicrobial effect of natural ingredients and protective microbiota. Curr. Opin. Food Sci. 2021, 38, 32–39. [Google Scholar] [CrossRef]
- Muzayyanah, M.A.U.; Triatmojo, A.; Guntoro, B. The consumer preferences for processed meat products based on choice brand priorities. IOP Conf. Ser. Earth Environ. Sci. 2022, 1001, 012024. [Google Scholar] [CrossRef]
- Delgado-Pando, G.; Fischer, E.; Allen, P.; Kerry, J.P.; O’Sullivan, M.G.; Hamill, R.M. Salt content and minimum acceptable levels in whole-muscle cured meat products. Meat Sci. 2018, 139, 179–186. [Google Scholar] [CrossRef]
- Vidal, V.A.S.; Lorenzo, J.M.; Munekata, P.E.S.; Pollonio, M.A.R. Challenges to reduce or replace NaCl by chloride salts in meat products made from whole pieces—A review. Crit. Rev. Food Sci. Nutr. 2021, 61, 2194–2206. [Google Scholar] [CrossRef] [PubMed]
- Desmond, E. Reducing salt: A challenge for the meat industry. Meat Sci. 2006, 74, 188–196. [Google Scholar] [CrossRef] [PubMed]
- Aliño, M.; Grau, R.; Toldrá, F.; Blesa, E.; Pagán, M.J.; Barat, J.M. Influence of sodium replacement on physicochemical properties of dry-cured loin. Meat Sci. 2009, 83, 423–430. [Google Scholar] [CrossRef]
- Vidal, V.A.S.; Biachi, J.P.; Paglarini, C.S.; Pinton, M.B.; Campagnol, P.C.B.; Esmerino, E.A.; da Cruz, A.G.; Morgano, M.A.; Pollonio, M.A.R. Reducing 50% sodium chloride in healthier jerked beef: An efficient design to ensure suitable stability, technological and sensory properties. Meat Sci. 2019, 152, 49–57. [Google Scholar] [CrossRef]
- Nachtigall, F.M.; Vidal, V.A.S.; Pyarasani, R.D.; Domínguez, R.; Lorenzo, J.M.; Pollonio, M.A.R.; Santos, L.S. Substitution effects of NaCl by KCl and CaCl2 on Lipolysis of Salted Meat. Foods 2019, 8, 595. [Google Scholar] [CrossRef] [PubMed]
- Fellendorf, S.; Kerry, J.P.; Hamill, R.M.; O’Sullivan, M.G. Impact on the physicochemical and sensory properties of salt reduced corned beef formulated with and without the use of salt replacers. LWT 2018, 92, 584–592. [Google Scholar] [CrossRef]
- Domínguez, R.; Munekata, P.E.; Cittadini, A.; Lorenzo, J.M. Effect of the partial NaCl substitution by other chloride salts on the volatile profile during the ripening of dry-cured lacón. Grasas Aceites 2016, 67, e128. [Google Scholar]
- Devlieghere, F.; Vermeiren, L.; Bontenbal, E.; Lamers, P.P.; Debevere, J. Reducing salt intake from meat products by combined use of lactate and diacetate salts without affecting microbial stability. Int. J. Food Sci. Technol. 2009, 44, 337–341. [Google Scholar] [CrossRef]
- Kim, T.K.; Yong, H.I.; Jung, S.; Kim, H.W.; Choi, Y.S. Effect of reducing sodium chloride based on the sensory properties of meat products and the improvement strategies employed: A review. J. Anim. Sci. Technol. 2021, 63, 725–739. [Google Scholar] [CrossRef] [PubMed]
- Kloss, L.; Meyer, J.D.; Graeve, L.; Vetter, W. Sodium intake and its reduction by food reformulation in the European Union—A review. NFS J. 2015, 1, 9–19. [Google Scholar] [CrossRef]
- Vidal, V.A.S.; Santana, J.B.; Paglarini, C.S.; da Silva, M.A.A.P.; Freitas, M.Q.; Esmerino, E.A.; Cruz, A.G.; Pollonio, M.A.R. Adding lysine and yeast extract improves sensory properties of low sodium salted meat. Meat Sci. 2020, 159, 107911. [Google Scholar] [CrossRef]
- World Health Organization. Fat Intake. Available online: https://www.who.int/data/gho/indicator-metadata-registry/imr-details/3418 (accessed on 10 March 2023).
- Islam, M.A.; Amin, M.N.; Siddiqui, S.A.; Hossain, M.P.; Sultana, F.; Kabir, M.R. Trans fatty acids and lipid profile: A serious risk factor to cardiovascular disease, cancer and diabetes. Diabetes Metab. Syndr. 2019, 13, 1643–1647. [Google Scholar] [CrossRef]
- Sneyd, M.J.; Cox, B. Do low-fat foods alter risk of colorectal cancer from processed meat? Public Health 2020, 183, 138–145. [Google Scholar] [CrossRef] [PubMed]
- Pietrasik, Z.; Soladoye, O.P. Functionality and consumer acceptability of low-fat breakfast sausages processed with non-meat ingredients of pulse derivatives. J. Sci. Food Agric. 2021, 101, 4464–4472. [Google Scholar] [CrossRef]
- Ren, Y.; Huang, L.; Zhang, Y.; Li, H.; Zhao, D.; Cao, J.; Liu, X. Application of Emulsion Gels as Fat Substitutes in Meat Products. Foods 2022, 11, 1950. [Google Scholar] [CrossRef]
- Ducrot, P.; Méjean, C.; Julia, C.; Kess6e-Guyot, E.; Touvier, M.; Fezeu, L.; Hercberg, S.; Péneau, S. Effectiveness of Front-Of-Pack Nutrition Labels in French Adults: Results from the NutriNet-Santé Cohort Study. PLoS ONE 2015, 10, e0140898. [Google Scholar] [CrossRef]
- Julia, C.; Blanchet, O.; Méjean, C.; Péneau, S.; Ducrot, P.; Allès, B.; Fezeu, L.K.; Touvier, M.; Kesse-Guyot, E.; Singler, E.; et al. Impact of the front-of-pack 5-colour nutrition label (5-CNL) on the nutritional quality of purchases: An experimental study. Int. J. Behav. Nutr. Phys. Act. 2016, 13, 101. [Google Scholar] [CrossRef]
- Egnell, M.; Ducrot, P.; Touvier, M.; Allès, B.; Hercberg, S.; Kesse-Guyot, E.; Julia, C. Objective understanding of Nutri-Score Front-Of-Package nutrition label according to individual characteristics of subjects: Comparisons with other format labels. PLoS ONE 2018, 13, e0202095. [Google Scholar] [CrossRef]
- Egnell, M.; Galan, P.; Fialon, M.; Touvier, M.; Péneau, S.; Kesse-Guyot, E.; Hercberg, S.; Julia, C. The impact of the Nutri-Score front-of-pack nutrition label on purchasing intentions of unprocessed and processed foods: Post-hoc analyses from three randomized controlled trials. Int. J. Behav. Nutr. Phys. Act. 2021, 18, 38. [Google Scholar] [CrossRef] [PubMed]
- Ikonen, I.; Sotgiu, F.; Aydinli, A.; Verlegh, P.W.J. Consumer effects of front-of-package nutrition labeling: An interdisciplinary meta-analysis. J. Acad. Mark. Sci. 2020, 48, 360–383. [Google Scholar] [CrossRef]


| Points | N-Component | P-Component | ||||||
|---|---|---|---|---|---|---|---|---|
| Energy Density (kJ/100 g) | Sugar (g/100 g) | Saturated Fatty Acids (g/100 g) | Sodium (mg/100 g) | Fruits, Vegetables, Pulses, Nuts, and Rapeseed Walnut and Olive Oils (%) | Fibre (g/100 g) | Protein (g/100 g) | ||
| All Meat in the Original Algorithm and White Meat in the Refined Algorithm | Red Meat in the Refined Algorithm | |||||||
| 0 | ≤335 | ≤4.5 | ≤1 | ≤90 | ≤40 | ≤0.9 | ≤1.6 | ≤2.4 |
| 1 | >335 | >4.5 | >1 | >90 | >40 | >0.9 | >1.6 | >2.4 |
| 2 | >670 | >9 | >2 | >180 | >60 | >1.9 | >3.2 | >4.8 |
| 3 | >1005 | >13.5 | >3 | >270 | - | >2.8 | >4.8 | - |
| 4 | >1340 | >18 | >4 | >360 | - | >3.7 | >6.4 | - |
| 5 | >1675 | >22.5 | >5 | >450 | >80 | >4.7 | >8.0 | - |
| 6 | >2010 | >27 | >6 | >540 | - | - | - | - |
| 7 | >2345 | >31 | >7 | >630 | - | - | - | - |
| 8 | >2680 | >36 | >8 | >720 | - | - | - | - |
| 9 | >3015 | >40 | >9 | >810 | - | - | - | - |
| 10 | >3350 | >45 | >10 | >900 | - | - | - | - |
| Class | Algorithm | Meat Preparations | Smoked Poultry Meats | Smoked Red Meats | Poultry Meat Sausages | Red Meat Sausages | Offal Poultry Meat Products | Offal Red Meat Products | Other Poultry Meat Products | Other Red Meat Products | |
|---|---|---|---|---|---|---|---|---|---|---|---|
| Number of products (N) | A | original | 1 | 1 | 0 | 0 | 0 | 0 | 0 | 0 | 0 |
| refined | 1 | 1 | 0 | 0 | 0 | 0 | 0 | 0 | 0 | ||
| B | original | 0 | 1 | 5 | 0 | 0 | 0 | 0 | 1 | 0 | |
| refined | 0 | 1 | 0 | 0 | 0 | 0 | 0 | 1 | 0 | ||
| C | original | 1 | 23 | 73 | 5 | 6 | 5 | 16 | 33 | 11 | |
| refined | 1 | 23 | 78 | 5 | 6 | 5 | 16 | 33 | 11 | ||
| D | original | 18 | 31 | 277 | 105 | 215 | 19 | 87 | 29 | 36 | |
| refined | 18 | 31 | 277 | 105 | 215 | 19 | 87 | 29 | 36 | ||
| E | original | 7 | 2 | 121 | 5 | 530 | 6 | 22 | 0 | 8 | |
| refined | 7 | 2 | 121 | 5 | 530 | 6 | 22 | 0 | 8 | ||
| Mean score (SD) | original | 14.33 | 8.93 | 14.18 | 14.12 | 20.85 | 13.43 | 14.21 | 7.75 | 13.24 | |
| refined | 14.44 | 8.93 | 14.67 | 14.12 | 20.88 | 13.43 | 14.54 | 7.75 | 13.84 | ||
| Meat Preparations | Smoked Poultry Meats | Smoked Red Meats | Poultry Meat Sausages | Red Meat Sausages | Offal Poultry Meat Products | Offal Red Meat Products | Other Poultry Meat Products | Other Red Meat Products | ||||||||||
|---|---|---|---|---|---|---|---|---|---|---|---|---|---|---|---|---|---|---|
| N | 27 | 58 | 476 | 115 | 751 | 30 | 125 | 63 | 55 | |||||||||
| total score | 14.0 | (12.0, 17.5) | 11.0 | (5.0, 11.0) | 13.0 | (11.0, 19.0) | 14.0 | (13.0, 16.0) | 21.0 | (18.0, 25.0) | 13.0 | (11.0, 18.0) | 14.0 | (12.0, 17.0) | 5.0 | (4.0, 11.0) | 13.0 | (11.0, 17.0) |
| KJ | 806 | (430, 990) | 477 | (436, 625) | 718 | (501, 1041) | 810 | (718, 900) | 1256 | (1019, 1778) | 923 | (762, 1089) | 956 | (779, 1201) | 464 | (412, 632) | 714 | (436, 887) |
| energy score | 2.0 | (1.0, 2.0) | 1.0 | (1.0, 1.0) | 2.0 | (1.0, 3.0) | 2.0 | (2.0, 2.0) | 3.0 | (3.0, 5.0) | 3.0 | (2.0, 3.0) | 2.0 | (2.0, 3.0) | 1.0 | (1.0, 1.0) | 2.0 | (1.0, 2.0) |
| sugars | 0.5 | (0.5, 0.7) | 0.6 | (0.5, 0.7) | 0.5 | (0.5, 0.8) | 0.7 | (0.5, 1.1) | 0.7 | (0.5, 1.0) | 1.0 | (0.6, 2.0) | 0.7 | (0.5, 1.0) | 0.6 | (0.5, 0.8) | 0.7 | (0.5, 1.0) |
| sugar score | 0.0 | (0.0, 0.0) | 0.0 | (0.0, 0.0) | 0.0 | (0.0, 0.0) | 0.0 | (0.0, 0.0) | 0.0 | (0.0, 0.0) | 0.0 | (0.0, 0.0) | 0.0 | (0.0, 0.0) | 0.0 | (0.0, 0.0) | 0.0 | (0.0, 0.0) |
| SFA | 6.0 | (1.8, 8.6) | 1.0 | (0.6, 2.5) | 3.4 | (1.4, 6.5) | 4.6 | (3.5, 5.2) | 10.0 | (7.4, 14.0) | 4.7 | (3.4, 7.9) | 6.0 | (4.2, 9.0) | 1.2 | (0.7, 2.6) | 4.3 | (1.4, 6.4) |
| SFAs score | 5.0 | (1.0, 8.0) | 0.0 | (0.0, 2.0) | 3.0 | (1.0, 6.0) | 4.0 | (3.0, 5.0) | 9.0 | (7.0, 10.0) | 4.0 | (3.0, 7.0) | 5.0 | (4.0, 8.0) | 1.0 | (0.0, 2.0) | 4.0 | (1.0, 6.0) |
| sodium | 880 | (680, 940) | 840 | (800, 950) | 960 | (800, 1440) | 800 | (760, 880) | 1040 | (800, 1400) | 680 | (600, 750) | 680 | (600, 760) | 800 | (720, 840) | 880 | (760, 980) |
| sodium score | 9.0 | (7.0, 10.0) | 9.0 | (8.0, 10.0) | 10.0 | (8.0, 10.0) | 8.0 | (8.0, 9.0) | 10.0 | (8.0, 10.0) | 7.0 | (6.0, 8.0) | 7.0 | (6.0, 8.0) | 8.0 | (7.0, 9.0) | 9.0 | (8.0, 10.0) |
| protein | 15.6 | (14.7, 17.0) | 20.0 | (16.0, 22.0) | 20.0 | (16.0, 25.0) | 15.0 | (13.0, 17.7) | 20.0 | (15.0, 25.0) | 12.0 | (9.1, 15.0) | 13.0 | (9.4, 15.0) | 17.0 | (14.0, 19.0) | 14.0 | (11.6, 16.5) |
| protein score | 2.0 | (2.0, 2.0) | 5.0 | (5.0, 5.0) | 2.0 | (2.0, 2.0) | 5.0 | (5.0, 5.0) | 2.0 | (2.0, 2.0) | 5.0 | (5.0, 5.0) | 2.0 | (2.0, 2.0) | 5.0 | (5.0, 5.0) | 2.0 | (2.0, 2.0) |
| fibre | 0.5 | (0.5, 0.5) | 0.0 | (0.0, 0.0) | 0.0 | (0.0, 0.0) | 0.0 | (0.0, 0.1) | 0.0 | (0.0, 0.0) | 0.2 | (0.1, 0.4) | 0.2 | (0.1, 0.4) | 0.0 | (0.0, 0.0) | 0.0 | (0, 0) |
| fibre score | 0.0 | (0.0, 0.0) | 0.0 | (0.0, 0.0) | 0.0 | (0.0, 0.0) | 0.0 | (0.0, 0.0) | 0.0 | (0.0, 0.0) | 0.0 | (0.0, 0.0) | 0.0 | (0.0, 0.0) | 0.0 | (0.0, 0.0) | 0.0 | (0.0, 0.0) |
| Smoked Poultry Meats | Smoked Red Meats | |||||||||||||||||
| A | B | C | D | E | A | B | C | D | E | |||||||||
| N | 1 | 1 | 22 | 30 | 2 | 0 | 0 | 78 | 277 | 121 | ||||||||
| total score | −3.0 | 2.0 | 5.0 | (4.0, 5.0) | 11.0 | (11.0, 12.0) | 24.0 | (24.0, 24.0) | 8.0 | (7.0, 8.0) | 13.0 | (12.0, 15.0) | 22.0 | (20.0, 24.0) | ||||
| KJ | 346 | 481 | 438 | (404, 455) | 544 | (482, 658) | 1474 | 1460, 1487) | 478 | (435, 541) | 650 | (498, 875) | 1266 | (1145, 1539) | ||||
| energy score | 1.0 | 1.0 | 1.0 | (1.0,1.0) | 1.0 | (1.0, 1.5) | 4.0 | (4.0, 4.0) | 1.0 | (1.0, 1.0) | 1.0 | (1.0, 2.0) | 3.0 | (3.0, 4.0) | ||||
| sugars | 0.1 | 0.0 | 0.6 | (0.5, 0.7) | 0.5 | (0.5, 0.9) | 0.7 | (0.6, 0.7) | 0.6 | (0.5, 0.9) | 0.5 | (0.5, 0.9) | 0.5 | (0.5, 0.6) | ||||
| sugar score | 0.0 | 0.0 | 0.0 | (0.0, 0.0) | 0.0 | (0.0, 0.0) | 0.0 | (0.0, 0.0) | 0.0 | (0.0, 0.0) | 0.0 | (0.0, 0.0) | 0.0 | (0.0, 0.0) | ||||
| SFAs | 1.1 | 0.5 | 0.5 | (0.3, 0.8) | 2.1 | (0.9, 3.0) | 11.0 | (11.0, 11.0) | 1.1 | (0.8, 1.5) | 2.6 | (1.5, 4.4) | 11.0 | (8.3, 13.0) | ||||
| SFA score | 1.0 | 0.0 | 0.0 | (0, 0) | 2.0 | (0.0, 2.0) | 10.0 | (10.0, 10.0) | 1.0 | (0.0, 1.0) | 2.0 | (1.0, 4.0) | 10.0 | (8.0, 10.0) | ||||
| sodium | 80 | 600 | 800 | (780, 880) | 920 | (800, 1000) | 1580 | (1530, 1630) | 760 | (720, 800) | 1000 | (880, 1840) | 1040 | (880, 1840) | ||||
| sodium score | 0.0 | 6.0 | 8.0 | (8.0, 9.0) | 10.0 | (8.0, 10.0) | 10.0 | (10.0, 10.0) | 8.0 | (7.0,8.0) | 10.0 | (9.0, 10.0) | 10.0 | (9.0, 10.0) | ||||
| protein | 13.0 | 25.0 | 20.0 | (18.5, 22.0) | 17.0 | (15.0, 22.0) | 20.0 | (20.0, 20.0) | 20.0 | (18.0, 22.8) | 21.0 | (16.9, 26.0) | 17.0 | (13.0, 26.0) | ||||
| proteins score | 5.0 | 5.0 | 5.0 | (5.0, 5.0) | 5.0 | (5.0, 5.0) | 5.0 | (5.0, 5.0) | 2.0 | (2.0, 2.0) | 2.0 | (2.0, 2.0) | 2.0 | (2.0, 2.0) | ||||
| fibre | 0.0 | 0.0 | 0.0 | (0.0, 0.0) | 0.0 | (0.0, 0.0) | 0.0 | (0.0, 0.0) | 0.0 | (0.0, 0.0) | 0.0 | (0.0, 0.0) | 0.0 | (0.0, 0.0) | ||||
| fibre score | 0.0 | 0.0 | 0.0 | (0.0, 0.0) | 0.0 | (0.0, 0.0) | 0.0 | (0.0, 0.0) | 0.0 | (0.0, 0.0) | 0.0 | (0.0, 0.0) | 0.0 | (0.0, 0.0) | ||||
| Poultry Meat Sausages | Red Meat Sausages | |||||||||||||||||
| A | B | C | D | E | A | B | C | D | E | |||||||||
| N | 0 | 0 | 5 | 105 | 5 | 0 | 0 | 6 | 215 | 530 | ||||||||
| total score | 5.0 | (4.0, 5.0) | 14.0 | (13.0, 15.0) | 20.0 | (19.0, 25.0) | 8.0 | (7.0, 8.0) | 16.0 | (14.0, 18.0) | 24.0 | (21.0, 25.0) | ||||||
| KJ | 567 | (554, 591) | 810 | (725, 886) | 1152 | (1108, 1708) | 667 | (492, 624) | 944 | (816, 1012) | 1503 | (1200, 1894) | ||||||
| energy score | 1.0 | (1.0, 1.0) | 2.0 | (2.0, 2.0) | 3.0 | (3.0, 3.0) | 1.0 | (1.0, 1.0) | 2.0 | (2.0, 3.0) | 4.0 | (3.0, 5.0) | ||||||
| sugars | 0.5 | (0.5, 0.6) | 0.5 | (0.4, 0.7) | 0.7 | (0.7, 1.1) | 0.8 | (0.7, 1.0) | 0.5 | (0.5, 0.7) | 0.8 | (0.5, 1.4) | ||||||
| sugar score | 0.0 | (0.0, 0.0) | 0.0 | (0.0, 0.0) | 0.0 | (0.0, 0.0) | 0.0 | (0.0, 0.0) | 0.0 | (0.0, 0.0) | 0.0 | (0.0, 0.0) | ||||||
| SFAs | 1.5 | (0.8, 1.5) | 4.6 | (3.7, 5.2) | 8.6 | (7.7, 11.0) | 1.4 | (1.3, 1.6) | 6.0 | (4.1, 7.3) | 12.0 | (9.6, 15.0) | ||||||
| SFA score | 1.0 | (0.0, 1.0) | 4.0 | (3.0, 5.0) | 8.0 | (7.0, 10.0) | 1.0 | (1.0, 1.0) | 5.0 | (4.0, 7.0) | 10.0 | (9.0, 10.0) | ||||||
| sodium | 720 | (680, 800) | 800 | (760, 840) | 1080 | (920, 1120) | 706 | (603, 800) | 840 | (720, 980) | 1240 | (920, 1520) | ||||||
| sodium score | 7.0 | (7.0, 8.0) | 8.0 | (8.0, 9.0) | 10.0 | (10.0, 10.0) | 7.0 | (6.0, 8.0) | 9.0 | (7.0, 10.0) | 10.0 | (10.0, 10.0) | ||||||
| protein | 23.5 | (18.0, 26.0) | 15.0 | (13.0, 17.0) | 14.0 | (13.0,15.0) | 20.0 | (19.3, 20.8) | 17.0 | (14.0, 23.0) | 22.0 | (15.0, 25.0) | ||||||
| protein score | 5.0 | (5.0, 5.0) | 5.0 | (5.0, 5.0) | 5.0 | (5.0, 5.0) | 2.0 | (2.0, 2.0) | 2.0 | (2.0, 2.0) | 2.0 | (2.0, 2.0) | ||||||
| fibre | 0.0 | (0.0, 0.0) | 0.0 | (0.0, 0.1) | 0.0 | (0.0, 0.1) | 0.0 | (0.0, 0.0) | 0.0 | (0.0, 0.1) | 0.0 | (0.0, 0.1) | ||||||
| fibre score | 0.0 | (0.0, 0.0) | 0.0 | (0.0, 0.0) | 0.0 | (0.0, 0.0) | 0.0 | (0.0, 0.0) | 0.0 | (0.0, 0.0) | 0.0 | (0.0, 0.0) | ||||||
| Offal Poultry Meat Products | Offal Red Meat Products | |||||||||||||||||
| A | B | C | D | E | A | B | C | D | E | |||||||||
| N | 0 | 0 | 5 | 19 | 6 | 0 | 0 | 16 | 87 | 22 | ||||||||
| total score | 5.0 | (4.0, 5.0) | 14.0 | (13.0, 15.0) | 20.0 | (19.0, 25.0) | 7.0 | (7.0, 8.0) | 14.0 | (13.0, 16.0) | 21.0 | (20.0, 22.0) | ||||||
| KJ | 588 | (514, 760) | 920 | (769, 994) | 1218 | (1215, 1318) | 687 | (604, 740) | 914 | (786, 1109) | 1439 | (1293, 1587) | ||||||
| energy score | 1.0 | (1.0, 2.0) | 2.0 | (2.0, 3.0) | 3.0 | (3.0, 4.0) | 1.0 | (1.0, 1.0) | 2.0 | (2.0, 4.0) | 4.0 | (3.0, 4.0) | ||||||
| sugars | 0.7 | (0.6, 0.8) | 1.6 | (0.8, 2.1) | 0.7 | (0.4, 1.4) | 0.7 | (0.5, 1.2) | 0.7 | (0.5, 1.0) | 0.8 | (0.6, 1.0) | ||||||
| sugar score | 0.0 | (0.0, 0.0) | 0.0 | (0.0, 0.0) | 0.0 | (0.0, 0.0) | 0.0 | (0.0, 0.0) | 0.0 | (0.0, 0.0) | 0.0 | (0.0, 0.0) | ||||||
| SFAs | 2.9 | (1.9, 3.0) | 4.5 | (3.9, 6.0) | 8.7 | (8.5, 9.0) | 2.8 | (1.6, 3.3) | 5.9 | (4.5, 8.1) | 12.9 | (10.5, 14.0) | ||||||
| SFA score | 2.0 | (1.0, 2.0) | 4.0 | (3.0, 6.0) | 10.0 | (10.0, 10.0) | 2.0 | (1.0, 3.0) | 5.0 | (4.0, 8.0) | 10.0 | (10.0, 10.0) | ||||||
| sodium | 600 | (600, 720) | 680 | (620, 760) | 600 | (600, 720) | 580 | (430, 650) | 680 | (600, 732) | 760 | (680, 790) | ||||||
| sodium score | 6.0 | (6.0, 7.0) | 7.0 | (7.0, 8.0) | 6.0 | (6.0, 8.0) | 6.0 | (4.0, 7.0) | 7.0 | (6.0, 8.0) | 8.0 | (7.0, 8.0) | ||||||
| protein | 15.0 | (12.0, 15.0) | 14.0 | (11.5, 18.0) | 8.7 | (8.5, 9.0) | 10.8 | (8.8, 15.0) | 13.1 | (10.0, 15.0) | 12.0 | (8.7, 14.0) | ||||||
| protein score | 5.0 | (5.0, 5.0) | 5.0 | (5.0, 5.0) | 5.0 | (5.0, 5.0) | 2.0 | (2.0, 2.0) | 2.0 | (2.0, 2.0) | 2.0 | (2.0, 2.0) | ||||||
| fibre | 0.1 | (0.1, 0.2) | 0.4 | (0.2, 0.4) | 0.1 | (0.1, 0.1) | 0.2 | (0.1, 0.2) | 0.2 | (0.1, 0.5) | 0.2 | (0.1, 2.1) | ||||||
| fibre score | 0.0 | (0.0, 0.0) | 0.0 | (0.0, 0.0) | 0.0 | (0.0, 0.0) | 0.0 | (0.0, 0.0) | 0.0 | (0.0, 0.0) | 0.0 | (0.0, 0.2) | ||||||
| Other Poultry Meat Products | Other Red Meat Products | |||||||||||||||||
| A | B | C | D | E | A | B | C | D | E | |||||||||
| N | 0 | 1 | 33 | 29 | 0 | 0 | 11 | 36 | 8 | |||||||||
| total score | 2.0 | 4.0 | (4.0, 5.0) | 11.0 | (11.0, 13.0) | 8.0 | (7.0, 8.0) | 15.0 | (12.0, 17.0) | 22.0 | (20.0, 22.0) | |||||||
| KJ | 311 | 436 | (407, 467) | 585 | (481, 721) | 429 | (371, 472) | 744 | (455, 849) | 1458 | (1193, 1635) | |||||||
| energy score | 0.0 | 1.0 | (1.0, 1.0) | 1.0 | (1.0, 2.0) | 1.0 | (1.0, 1.0) | 2.0 | (1.0, 2.0) | 4.0 | (3.0, 4.0) | |||||||
| sugars | 0.8 | 0.7 | (0.5, 0.9) | 0.6 | (0.4, 0.7) | 0.7 | (0.7, 0.8) | 0.6 | (0.5, 0.9) | 0.9 | (0.4, 1.5) | |||||||
| sugar score | 0.0 | 0.0 | (0.0, 0.0) | 0.0 | (0.0, 0.0) | 0.0 | (0.0, 0.0) | 0.0 | (0.0, 0.0) | 0.0 | (0.0, 0.0) | |||||||
| SFAs | 1.4 | 0.8 | (0.6, 1.2) | 2.6 | (1.2, 3.6) | 1.3 | (1.0, 1.8) | 4.5 | (1.5, 6.0) | 8.7 | (7.7, 10.5) | |||||||
| SFA score | 1.0 | 0.0 | (0.0, 1.0) | 2.0 | (1.0, 3.0) | 1.0 | (0.0, 1.0) | 4.0 | (1.0, 5.0) | 8.0 | (7.0, 9.0) | |||||||
| sodium | 600 | 800 | (720, 800) | 840 | (720, 1000) | 800 | (740, 820) | 880 | (800, 1000) | 1020 | (758, 1760) | |||||||
| sodium score | 6.0 | 8.0 | (7.0, 8.0) | 9.0 | (7.0, 10.0) | 8.0 | (8.0, 9.0) | 9.0 | (8.0, 10.0) | 10.0 | (8.0, 10.0) | |||||||
| protein | 8.2 | 18.0 | (16.0, 19.0) | 17.0 | (13.0, 18.0) | 15.0 | (14.0, 16.5) | 13.5 | (11.0, 15.3) | 12.0 | (11.0, 39.5) | |||||||
| protein score | 5.0 | 5.0 | (5.0, 5.0) | 5.0 | (5.0, 5.0) | 2.0 | (2.0, 2.0) | 2.0 | (2.0, 2.0) | 2.0 | (2.0, 2.0) | |||||||
| fibre | 0.5 | 0.0 | (0.0, 0.0) | 0.0 | (0.0, 0.1) | 0.0 | (0.0, 0.0) | 0.0 | (0.0, 0.1) | 0.0 | (0.0, 0.1) | |||||||
| fibre score | 0.0 | 0.0 | (0.0, 0.0) | 0.0 | (0.0, 0.0) | 0.0 | (0.0, 0.0) | 0.0 | (0.0, 0.0) | 0.0 | (0.0, 0.0) | |||||||
| Assortments Group | Nutritional Information Class | ||||||||||||
|---|---|---|---|---|---|---|---|---|---|---|---|---|---|
| A | B | C | D | E | |||||||||
| N | % | N | % | N | % | N | % | N | % | ||||
| Baseline | meat preparations | 1 | 3.70 | 0 | 0.00 | 1 | 3.70 | 18 | 66.67 | 7 | 25.93 | ||
| meat products | 1 | 0.06 | 2 | 0.12 | 177 | 10.58 | 799 | 47.76 | 694 | 41.48 | |||
| smoked meats | 1 | 0.19 | 1 | 0.19 | 101 | 18.91 | 308 | 57.68 | 123 | 23.03 | |||
| smoked poultry meats | 1 | 1.72 | 1 | 1.72 | 23 | 39.66 | 31 | 53.45 | 2 | 3.45 | |||
| smoked red meats | 0 | 0.00 | 0 | 0.00 | 78 | 16.39 | 277 | 58.19 | 121 | 25.42 | |||
| sausages | 0 | 0.00 | 0 | 0.00 | 11 | 1.27 | 320 | 36.95 | 535 | 61.78 | |||
| poultry meat sausages | 0 | 0.00 | 0 | 0.00 | 5 | 4.35 | 105 | 91.30 | 5 | 4.35 | |||
| red meat sausages | 0 | 0.00 | 0 | 0.00 | 6 | 0.80 | 215 | 28.63 | 530 | 70.57 | |||
| offal meats | 0 | 0.00 | 0 | 0.00 | 21 | 13.55 | 106 | 68.39 | 28 | 18.06 | |||
| offal poultry meat products | 0 | 0.00 | 0 | 0.00 | 5 | 16.67 | 19 | 63.33 | 6 | 20.00 | |||
| offal red meat products | 0 | 0.00 | 0 | 0.00 | 16 | 12.80 | 87 | 69.60 | 22 | 17.60 | |||
| other meat products | 0 | 0.00 | 1 | 0.85 | 44 | 37.29 | 65 | 55.08 | 8 | 6.78 | |||
| other poultry meat products | 0 | 0.00 | 1 | 1.59 | 33 | 52.38 | 29 | 46.03 | 0 | 0.00 | |||
| other red meat products | 0 | 0.00 | 0 | 0.00 | 11 | 20.00 | 36 | 65.45 | 8 | 14.55 | |||
| Minus 30% sodium | meat preparations | 1 | 3.70 | 0 | 0.00 | 9 | 33.33 | 13 | 48.15 | 4 | 14.81 | ||
| meat products | 1 | 0.06 | 53 | 3.17 | 392 | 23.43 | 710 | 42.44 | 517 | 30.90 | |||
| smoked meats | 1 | 0.19 | 21 | 3.93 | 230 | 43.07 | 178 | 33.33 | 104 | 19.48 | |||
| smoked poultry meats | 1 | 1.72 | 20 | 34.48 | 29 | 50.00 | 6 | 10.34 | 2 | 3.45 | |||
| smoked red meats | 0 | 0.00 | 1 | 0.21 | 201 | 42.23 | 172 | 36.13 | 102 | 21.43 | |||
| sausages | 0 | 0.00 | 3 | 0.35 | 57 | 6.58 | 409 | 47.23 | 397 | 45.84 | |||
| poultry meat sausages | 0 | 0.00 | 3 | 2.61 | 25 | 21.74 | 85 | 73.91 | 2 | 1.74 | |||
| red meat sausages | 0 | 0.00 | 0 | 0.00 | 32 | 4.26 | 324 | 43.14 | 395 | 52.60 | |||
| offal meats | 0 | 0.00 | 2 | 1.29 | 51 | 32.90 | 91 | 58.71 | 11 | 7.10 | |||
| offal poultry meat products | 0 | 0.00 | 2 | 6.67 | 12 | 40.00 | 15 | 50.00 | 1 | 3.33 | |||
| offal red meat products | 0 | 0.00 | 0 | 0.00 | 39 | 31.20 | 76 | 60.80 | 10 | 8.00 | |||
| other meat products | 0 | 0.00 | 27 | 22.88 | 54 | 45.76 | 32 | 27.12 | 5 | 4.24 | |||
| other poultry meat products | 0 | 0.00 | 27 | 42.86 | 27 | 42.86 | 9 | 14.29 | 0 | 0.00 | |||
| other red meat products | 0 | 0.00 | 0 | 0.00 | 27 | 49.09 | 23 | 41.82 | 5 | 9.09 | |||
| Minus 10% SFAs | meat preparations | 1 | 3.70 | 0 | 0.00 | 1 | 3.70 | 19 | 70.37 | 6 | 22.22 | ||
| meat products | 1 | 0.06 | 2 | 0.12 | 192 | 11.48 | 844 | 50.45 | 634 | 37.90 | |||
| smoked meats | 1 | 0.19 | 1 | 0.19 | 107 | 20.04 | 315 | 58.99 | 110 | 20.60 | |||
| smoked poultry meats | 1 | 1.72 | 1 | 1.72 | 25 | 43.10 | 29 | 50.00 | 2 | 3.45 | |||
| smoked red meats | 0 | 0.00 | 0 | 0.00 | 82 | 17.23 | 286 | 60.08 | 108 | 22.69 | |||
| sausages | 0 | 0.00 | 0 | 0.00 | 13 | 1.50 | 357 | 41.22 | 496 | 57.27 | |||
| poultry meat sausages | 0 | 0.00 | 0 | 0.00 | 7 | 6.09 | 104 | 90.43 | 4 | 3.48 | |||
| red meat sausages | 0 | 0.00 | 0 | 0.00 | 6 | 0.80 | 253 | 33.69 | 492 | 65.51 | |||
| offal meats | 0 | 0.00 | 0 | 0.00 | 23 | 14.84 | 111 | 71.61 | 21 | 13.55 | |||
| offal poultry meat products | 0 | 0.00 | 0 | 0.00 | 6 | 20.00 | 22 | 73.33 | 2 | 6.67 | |||
| offal red meat products | 0 | 0.00 | 0 | 0.00 | 17 | 13.60 | 89 | 71.20 | 19 | 15.20 | |||
| other meat products | 0 | 0.00 | 1 | 0.85 | 49 | 41.53 | 61 | 51.69 | 7 | 5.93 | |||
| other poultry meat products | 0 | 0.00 | 1 | 1.59 | 38 | 60.32 | 24 | 38.10 | 0 | 0.00 | |||
| other red meat products | 0 | 0.00 | 0 | 0.00 | 11 | 20.00 | 37 | 67.27 | 7 | 12.73 | |||
| Minus 30% sodium and 10% SFAs | meat preparations | 1 | 3.70 | 0 | 0.00 | 9 | 33.33 | 14 | 51.85 | 3 | 11.11 | ||
| meat products | 1 | 0.06 | 57 | 3.41 | 421 | 25.16 | 734 | 43.87 | 460 | 27.50 | |||
| smoked meats | 1 | 0.19 | 21 | 3.93 | 239 | 44.76 | 191 | 35.77 | 82 | 15.36 | |||
| smoked poultry meats | 1 | 1.72 | 20 | 34.48 | 31 | 53.45 | 4 | 6.90 | 2 | 3.45 | |||
| smoked red meats | 0 | 0.00 | 1 | 0.21 | 208 | 43.70 | 187 | 39.29 | 80 | 16.81 | |||
| sausages | 0 | 0.00 | 3 | 0.35 | 72 | 8.31 | 427 | 49.31 | 364 | 42.03 | |||
| poultry meat sausages | 0 | 0.00 | 3 | 2.61 | 33 | 28.70 | 77 | 66.96 | 2 | 1.74 | |||
| red meat sausages | 0 | 0.00 | 0 | 0.00 | 39 | 5.19 | 350 | 46.60 | 362 | 48.20 | |||
| offal meats | 0 | 0.00 | 3 | 1.94 | 57 | 36.77 | 86 | 55.48 | 9 | 5.81 | |||
| offal poultry meat products | 0 | 0.00 | 3 | 10.00 | 12 | 40.00 | 14 | 46.67 | 1 | 3.33 | |||
| offal red meat products | 0 | 0.00 | 0 | 0.00 | 45 | 36.00 | 72 | 57.60 | 8 | 6.40 | |||
| other meat products | 0 | 0.00 | 30 | 25.42 | 53 | 44.92 | 30 | 25.42 | 5 | 4.24 | |||
| other poultry meat products | 0 | 0.00 | 30 | 47.62 | 25 | 39.68 | 8 | 12.70 | 0 | 0.00 | |||
| other red meat products | 0 | 0.00 | 0 | 0.00 | 28 | 50.91 | 22 | 40.00 | 5 | 9.09 | |||
Disclaimer/Publisher’s Note: The statements, opinions and data contained in all publications are solely those of the individual author(s) and contributor(s) and not of MDPI and/or the editor(s). MDPI and/or the editor(s) disclaim responsibility for any injury to people or property resulting from any ideas, methods, instructions or products referred to in the content. |
© 2024 by the authors. Licensee MDPI, Basel, Switzerland. This article is an open access article distributed under the terms and conditions of the Creative Commons Attribution (CC BY) license (https://creativecommons.org/licenses/by/4.0/).
Share and Cite
Czech-Załubska, K.; Didkowska, A.; Klich, D.; Jackowska-Tracz, A.; Zarzyńska, J.; Anusz, K. The Nutri-Score Scale—A Tool for Assessing the Nutritional Quality of Processed Meat Products Available on the Polish Market. Nutrients 2024, 16, 827. https://doi.org/10.3390/nu16060827
Czech-Załubska K, Didkowska A, Klich D, Jackowska-Tracz A, Zarzyńska J, Anusz K. The Nutri-Score Scale—A Tool for Assessing the Nutritional Quality of Processed Meat Products Available on the Polish Market. Nutrients. 2024; 16(6):827. https://doi.org/10.3390/nu16060827
Chicago/Turabian StyleCzech-Załubska, Katarzyna, Anna Didkowska, Daniel Klich, Agnieszka Jackowska-Tracz, Joanna Zarzyńska, and Krzysztof Anusz. 2024. "The Nutri-Score Scale—A Tool for Assessing the Nutritional Quality of Processed Meat Products Available on the Polish Market" Nutrients 16, no. 6: 827. https://doi.org/10.3390/nu16060827
APA StyleCzech-Załubska, K., Didkowska, A., Klich, D., Jackowska-Tracz, A., Zarzyńska, J., & Anusz, K. (2024). The Nutri-Score Scale—A Tool for Assessing the Nutritional Quality of Processed Meat Products Available on the Polish Market. Nutrients, 16(6), 827. https://doi.org/10.3390/nu16060827