Abstract
Background: Both genetics and vitamin D deficiency are associated with childhood obesity. However, the role of vitamin D status between polygenic and childhood obesity has been unknown. The current study aimed to determine the relation between genetic factors, vitamin D status, and BMI-for-age z score (zBMI) in Chinese preschool children. Methods: A total of 1046 participants aged 3.7 to 6.6 years old from the Long-term Health Effects Assessment Project of Infants and Toddlers Nutritional Pack (LHEAPITNP) were included in this study. The polygenic risk score (PRS) was established based on 55 BMI-related single nucleotide polymorphisms (SNPs) derived from a published genome-wide association study (GWAS) for BMI. Serum 25(OH)D was used as an index of vitamin D status and measured with liquid chromatography-tandem mass spectrometry (LC/MS-MS) assay. The Wilcoxon test or Kruskal–Wallis test was used to compare the differences of variables between different groups and Spearman correlation analysis was used for analyzing the correlations between the PRS, 25(OH)D levels, and zBMI. Results: The PRS showed a positive relation to zBMI (rs = 0.0953, p = 0.0022) and 25(OH)D showed a negative relation to zBMI (rs = −0.1082, p = 0.0005) in the full-adjustment model. In addition, the differences in zBMI at different vitamin D statuses in the low-risk PRS group and the intermediate-risk PRS group were both statistically significant (plow = 0.0308, pintermediate = 0.0121), the median zBMI was both higher at vitamin D insufficiency status. And the difference in zBMI between different genetic risk groups was also statistically significant at vitamin D sufficiency status (p = 0.0077). Furthermore, genetic risk showed a positive relation to zBMI at vitamin D sufficiency status, and the p for trend was 0.0028. Conclusions: Our findings suggested that vitamin D was related to zBMI negatively in Chinese preschoolers and maintaining adequate vitamin D levels may only contribute to lower the zBMI in preschoolers with low and intermediate genetic susceptibility.
1. Introduction
The growing of childhood obesity has become a global public health problem. According to the report of the World Health Organization (WHO), an estimated 38.2 million children under the age of 5 years were overweight or obese in 2019 [1]. In China, the prevalence of overweight and obesity among children under 6 was 6.5% and 2.7% in 2002, while both increased to 6.8% and 3.6%, respectively according to the latest national prevalence estimates for 2015-19 [2]. Being overweight and obese not only affects the current physical and mental health of children but may also be a risk factor for adulthood obesity and chronic diseases such as fatty liver disease, cardiovascular disease, and type 2 diabetes [3,4].
Genetics play an important role in developing obesity. Around 40–70% of the variability in body mass index (BMI) has been attributed to genetic factors [5]. Based on genetic studies, obesity has usually been classified into two broad categories, monogenic obesity and polygenic obesity. Monogenic obesity is a rare and severe form of obesity that follows the Mendelian pattern of inheritance, whereas polygenic obesity, also known as common obesity, is influenced by a large number of polymorphisms, each having only a small effect [6]. Since the publication of the two genome-wide association studies (GWASs) on obesity in 2007 [7,8], which identified a cluster of single nucleotide polymorphisms (SNPs) associated with BMI in the first intron of the FTO locus, approximately 60 GWASs studies have been conducted and more than 1100 loci associated with a range of obesity traits have been identified [6]. Although most GWASs have been conducted in European populations, in recent years a growing number of GWASs have been performed in East Asian populations [9]. For example, a GWAS for BMI was performed on nearly 170,000 Japanese people and identified 51 novel loci associated with BMI [10]. Furthermore, most of the GWAS loci for obesity which were identified in adults first were also associated with obesity or BMI in children and adolescents [11,12,13].
However, most of these GWAS loci have a small effect and typically correspond to a small fraction of truly associated variants [14]. The polygenic risk score (PRS) method, which is also named genetic risk score (GRS), could aggregate the effects of variants across the genome and can be used to test for gene × environment and gene × gene interactions [15,16]. For example, Yoon et al. [17] developed a BMI-related PRS for predicting susceptibility to obesity and related traits in the Korean population. Additionally, obesity-related PRS/GRS have also been established to explore the associations between the genetic risk of obesity and environmental factors, such as lifestyle, dietary pattern, and neighborhood environment [18,19,20].
Vitamin D deficiency has also been increased globally and is associated with a series of adverse health outcomes, including obesity [21,22]. Some studies have explored vitamin D status concerning obesity and found an inverse relationship between vitamin D levels and BMI [23,24,25]. A recent meta-analysis suggested that vitamin D deficiency was associated with impaired lipid profiles among adults with overweight or obesity [26]. The study in children and adolescents showed similar results [27]. Genetic association analysis between 25-hydroxyvitamin D (25 [OH]D)-related genes and obesity has been conducted to explore genetic factors linked to vitamin D and obesity [28]. It has been reported that vitamin D receptor (VDR) gene polymorphisms were associated with childhood obesity and its adverse consequences [29].
However, research on the relationship between vitamin D status and the effect of obesity-related genes on obesity is limited. Additionally, most of the previous studies focused on European adults, with less research on children. And BMI for age is used to identify potentially wasted, overweight or obese children aged two years and older [30]. Our study therefore aimed to establish a BMI-related PRS and determine the relation between the BMI-related PRS, vitamin D status, and BMI-for-age z score (zBMI) in Chinese preschool children.
2. Materials and Methods
2.1. Study Participants
The Ministry of Health and the All-China Women’s Federation have jointly implemented the Nutrition Improvement Project on Children in Poor Areas of China (NIPCPAC) since 2012, providing a free pack of Ying Yang Bao (YYB), which contains a variety of essential nutrients and serves as home fortification for complementary feeding, for infants and young children (IYC) aged 6 to 24 months daily in poverty-stricken counties in China, to better the nutritional status of IYC [31]. Then, the Long-term Health Effects Assessment Project of Infants and Toddlers Nutritional Pack (LHEAPITNP), a prospective study, was launched in 2018 aiming to evaluate the short and long-term effects of YYB intervention in early life. It should be noted that children involved in this project have discontinued the intake of YYB.
In the four detailed monitoring locations of the LHEAPITNP, a total of 1104 children were invited to take part in the survey of 2022. The four detailed monitoring locations included Fuquan and Guiding in Guizhou Province, and Ruyang and Song County in Henan Province, China. As shown in Figure 1, 1046 participants aged 3.7 to 6.6 years old with valid data were included in the present study after quality control. The exclusion criteria included failure of DNA extraction, information missing, duplicate submissions, failure of genotyping, and outliers defined by outside mean ± 4 SD.
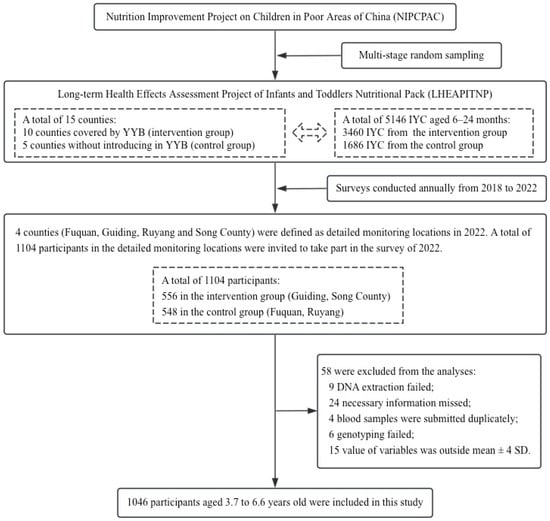
Figure 1.
Process of including eligible participants in the present study.
The LHEAPITNP was reviewed and approved by the Ethics Committee of the Institute of Nutrition and Health of the Chinese Center for Disease Control and Prevention (No. 2018-017). All the caregivers provided written informed consent.
2.2. BMI-for-Age z Score
After accurate measurement of participants’ height and weight with standardized equipment (the minimum scale for height measuring device was 0.1 cm and the minimum scale for electronic weight scales was 0.05 kg), BMI-for-age z score (zBMI) was calculated using WHO Anthro software (version 1.0.4) for children under 5 years and WHO Anthro Plus software (version 1.0.4) for children over 5 years, respectively.
2.3. Vitamin D Status
Serum 25(OH)D is the biomarker usually used as an index of vitamin D status [32]. In our study, serum 25(OH)D (D2+D3) was measured with liquid chromatography tandem mass spectrometry (LC/MS-MS) assay (LCMS-8060, SHIMADZU, Kyoto, Japan), which could measure 25(OH)D2 and 25(OH)D3, respectively. Serum samples obtained from centrifugation of blood samples were stored at −80 °C until measurement. Before LC-MS/MS analysis, all serum samples were pre-treated and mixed isotopic internal standard solutions and working solutions were prepared. The working solutions were diluted serially for preparation of calibration curves and quality control (QC) samples. To all serum samples, calibration samples and QC samples (200 μL, respectively), 20 μL internal standard solutions were added (100 ng/mL), and 400 μL methanol and acetonitrile mixture solutions (1:1) were also added to promote protein precipitation. Hexane (1.2 mL) was then added after 30 s of vortexing and shaking, followed by a further 5 min of vortexing and shaking. The resulting mixture was then centrifuged at 12,000× g for 5 min. Next, hexane was added, and the resulting mixture was centrifuged again. After the upper layer was transferred into the new tube, we dried it under a gentle stream of nitrogen at room temperature and re-dissolved it with 100 μL of mobile phase. It should be added that when the LC-MS/MS analysis was conducted the column temperature was 40 °C, the flow rate was set at 0.30 mL/min, and an Electrospray Ionization (ESI) source was used.
According to the Endocrine Society Clinician Vitamin D Guideline [33], vitamin D status was defined as insufficient (25(OH)D ≤ 30 ng/mL) and sufficient (25(OH)D > 30 ng/mL) in our analyses.
2.4. Genotyping and Single-Nucleotide Polymorphism (SNP) Selection
Genomic DNA was extracted using the magnetic beads method from blood clots, which were placed in the inert separator gel coagulation tubes and refrigerated at −80 °C after serum separation. Target single nucleotide polymorphisms (SNPs) were genotyped by Kompetitive Allele Specific PCR (KASPTM, LGC Genomics, Teddington, Middlesex, UK) [34]. Finally, genotyping data of all target SNPs were visualized with SNP Viewer software (version 2.0, Hoddesdon, UK).
A total of 85 SNPs that reached genome-wide significance (p < 5.0 × 10⁻⁸) were chosen from a GWAS of BMI in Japanese people (n = 173,430) [10]. Eight SNPs (rs10208649, rs183975233, rs148546399, rs4366055, rs10795945, rs12617004, rs11602339, rs7305242) were excluded from the score due to minor allele frequencies (MAFs) less than 0.01, thirteen SNPs (rs2076463, rs7020996, rs75766425, rs1379871, rs6529684, rs3121672, rs1190736, rs6433857, rs4357030, rs11030100, rs2540034, rs7903146, rs77511173) due to not being in Hardy–Weinberg Equilibrium (p < 1.0 × 10⁻⁶) and another nine SNPs (rs4308481, rs143665886, rs1832886, rs180950758, rs5945324, rs6913361, rs1846974, rs35560038, rs111612372) which were unavailable were also excluded. Finally, 55 SNPs were selected for the PRS. The sequences of the primers and detailed information for these 55 SNPs are available in the Supplementary Materials.
2.5. Polygenic Risk Score
A total of 55 SNPs with an MAF ≥ 1% and missing rate ≤ 5% were selected to calculate BMI-related PRS. Every SNP was recorded as 0, 1, or 2 according to the number of effective alleles (alternative alleles) and weighted by its relative effect size (-coefficient) obtained from the previously published GWAS [10]. The BMI-related PRS of each subject was calculated with the following equation: PRS = (1 × SNP1 + 2 × SNP2 + … + n × SNPn) × (n/sum of the coefficients), where is the effect size of each SNP, n is the number of each subject’s available SNPs, and sum of the is the sum of the coefficients of each subject’s available SNPs [18]. Further information of the effective allele of each SNP was available in Supplementary Table S2. Finally, the PRS was classified into low (bottom 10%)-risk, intermediate (10–90%)-risk, and high (top 10%)-risk groups in our analyses.
2.6. Covariates
Covariates were used for characteristic descriptions of participants and potential confounding adjustment of Spearman correlation analysis and were as follows: sex (Male/Female), age (months), birth length (cm), birth weight (g), premature birth (Yes/No), delivery (Unknown/Vaginal/Caesarean), only child (Yes/No), breastfeeding (Yes/No), vitamin D supplement (Yes/No), Ying Yang Bao (Yes/No), parental care (Yes/No), education of caregiver (Primary school or below/Junior middle school/High school or above) and socio-economic status (SES). Three points should be added: (1) “Vitamin D supplement” indicated whether participants had taken a vitamin D supplement in the week before the survey; (2) “Ying Yang Bao” indicated whether participants were from the YYB intervention group; and (3) SES was calculated based on the education and occupation of parents and was used to reflect economic status of participant’s family [35].
2.7. Statistical Analysis
Continuous variables were described using the median and 25th and 75th percentile in our study because of abnormal distribution and were compared by Wilcoxon test or Kruskal–Wallis test between different groups. To conduct multiple comparisons between different genetic risk groups, the KC_WC macro program (for SAS) was applied based on Dunn’s test for unequal sample sizes between different comparing groups [36]. Descriptive statistics of categorical variables were analyzed using the amount and related proportion (%), and comparisons among different groups were analyzed using the chi-square test. Spearman correlation analysis was used for analyzing the correlations between the PRS, 25(OH)D levels, and the zBMI. Model I was a crude model without adjustment for any covariates, model II was adjusted for sex, age, birth height, and birth weight, and model III was further adjusted for the remaining covariates.
To measure the associations between the PRS, 25(OH)D levels and the zBMI, we compared the median of zBMI at different vitamin statuses among different genetic risk groups. Similarly, we compared the median of zBMI at different genetic risk groups among different vitamin statuses. All analyses were performed by SAS version 9.4 (SAS Institute, Cary, NC, USA) and R (version 3.2), statistical significance was defined as a two-sided p-value less than 0.05.
3. Results
3.1. Demographic Characteristics of the Participants According to Genetic Risk
General characteristics of the 1046 participants were shown in Table 1. The median of zBMI was −0.45 among 528 boys and 518 girls aged 3.7 to 6.6 years old. The mean birth length was 50.1 cm, and the median birth weight was 3245 g. And of all children, 3.7% were born prematurely and 60.4% were born vaginally. A total of 13.3% were the only child in their family and 71.8% were raised primarily by their parents. In addition, more than half of caregivers had the highest level of junior middle school or above. And the median of SES was 47.8. Moreover, 89.6% of children were breastfed early in life. Regarding nutritional supplements, 49.8% of children were from the YYB intervention group and 3.4% had taken vitamin D supplements in the week before the survey. Finally, the median of the PRS and 25(OH)D levels were −19.25 and 33.63 ng/mL, respectively. After grouping participants according to their PRS, there were 104 individuals in the low-risk PRS group, 838 in the intermediate-risk PRS group, and 104 in the high-risk PRS group. As shown in Table 1, the PRS and zBMI were both statistically significantly different across genetic risk groups, while other variables were not.

Table 1.
Comparisons of the low-, intermediate-, and high-risk PRS groups for the characteristics.
3.2. Correlations between Polygenic Risk Score, 25(OH)D Levels, and zBMI
As shown in Table 2, in the full-adjustment model, the PRS established in our study showed a positive relation to zBMI (rs = 0.0953, p = 0.0022). 25(OH)D showed a negative relation to zBMI (rs = −0.1082, p = 0.0005) in the full-adjustment model. The correlations described above were in line with the results obtained in model I and model II.
Table 2.
Correlations between the polygenic risk score, 25(OH)D levels, and zBMI.
3.3. Differences in zBMI at Different Genetic Risk Groups and Different Vitamin D Statuses
These results are shown in Table 3. Differences in zBMI at different genetic risk groups were statistically significant (p = 0.0029). There were statistical differences also found in the multiple comparisons. In comparison with the low-risk PRS group, the median zBMI was higher in the high-risk group. Additionally, statistical differences in zBMI were also found between the intermediate-risk group and the high-risk group. And difference in zBMI at different vitamin D statuses was also statistically significant (p = 0.0017). The median zBMI was higher at vitamin D insufficiency status.
Table 3.
Difference in zBMI at different genetic risk groups and different vitamin D statuses.
3.4. Comparisons of zBMI across Different Subgroups
As shown in Table 4, the differences in zBMI at different vitamin D status in the low-risk PRS group and the intermediate-risk PRS group were both statistically significant (plow = 0.0308, pintermediate = 0.0121), while there was no statistical difference in zBMI at different vitamin D status found in the high-risk PRS group. Among all risk groups, the median zBMI was higher at vitamin D insufficiency status. In addition, the difference in zBMI between different genetic risk groups was statistically significant (p = 0.0077) at vitamin D sufficiency status. There were statistical differences also found in the multiple comparisons. Furthermore, at vitamin D sufficiency status, genetic risk showed a positive relation to zBMI, and the p for trend was 0.0028. Compared with the low-risk PRS group, the median zBMI was higher in the high-risk PRS group. And the median zBMI in the high-risk PRS group was also higher than it in the intermediate-risk PRS group. However, no interactive effects were found between genetic risk and vitamin D status on zBMI (p for interaction = 0.3912).
Table 4.
Differences in zBMI at different vitamin D status across different genetic risk groups and differences in zBMI between different genetic risk groups at different vitamin D statuses.
4. Discussion
We established a polygenic risk score consisting of 55 SNPs associated with BMI and it was related to the zBMI of preschoolers in our study. A negative relation between 25(OH)D levels and zBMI was also found. And when we explored the interplay between vitamin D status and the PRS, the findings suggested that maintaining adequate vitamin D levels may help lower zBMI for preschoolers with low and intermediate genetic susceptibility. Additionally, for children with adequate vitamin D levels, the PRS showed a significantly positive relation to zBMI, and a linear trend existed.
While we established a PRS to aggregate the effects of variants associated with BMI, to further explore the interactions between genetic risk and other environmental factors, our study was not the first to do this. Tyrrell et al. [18] established a BMI-related GRS (consisting of 69 SNPs) based on the genetic study of Locke et al. [5] and conducted gene–obesogenic environment interactions using more than 120,000 adults from the UK Biobank study. Then, they found that an obesogenic environment, especially relative social deprivation, could higher the risk of obesity for adults with genetic susceptibility. Mason et al. [37] also established the GRS (consisting of 91 SNPs) according to the study of Locke et al. [5] and found that adults with a higher genetic risk of obesity may be more vulnerable to fast-food accessibility. A similar study was also conducted on children: Fang et al. [38] selected 11 SNPs to establish the PRS from a study [12] which joined 20 GWASs, and the results suggested that adherence to a healthy lifestyle during childhood may lower the genetic susceptibility to obesity. However, the PRS established by Fang et al. was derived from individuals of European ancestry but was used to examine the genetic risk of obesity for Chinese children, which ignored the complexities of trans-ancestry. Cumulative evidence has indicated that PRS models trained with European individuals were less accurate when applied to other ethnic populations compared to the European populations [39]. Moreover, some studies have demonstrated that the genetics of obesity are relatively constant over the course of a lifetime [11,12,13]. Therefore, we established our PRS based on individuals of East Asian ancestry [10] and applied it to Chinese preschoolers. And the PRS showed a positive relation to zBMI of children in our study.
Additionally, an inverse relationship between 25(OH)D levels and zBMI was shown in our findings, and it was consistent with previous studies. Saneei et al. [23] conducted a meta-analysis involving 34 cross-sectional studies and found a significant inverse weak correlation between 25(OH)D levels and BMI in adults. A meta-analysis including a total of 55 observational studies demonstrated that vitamin D levels were negatively associated with BMI both in diabetic and non-diabetic subjects, while a more significant correlation was seen in the diabetic subject population [25]. Furthermore, several studies suggested that increasing vitamin D levels could help improve the lipid profile of adolescents or children, and vitamin D deficiency may impair the lipid profile of adults [26,27]. While multiple studies have found a negative correlation between vitamin D levels and obesity, the direction of this relationship has remained a subject of controversy. [40]. A bi-directional Mendelian randomization analysis of multiple cohorts [24] was conducted and suggested that increased BMI may lead to low 25(OH)D, but lower 25(OH)D levels had minimal effect on BMI increase. Mallard et al. [41] conducted a meta-analysis including randomized and nonrandomized controlled trials and found a significant weak association between weight loss and higher 25(OH)D. However, no significant changes in 25(OH)D of subjects were found after bariatric surgery [42,43]. Equally, there is still no convincing evidence to support the effect of vitamin D supplementation on body weight. Unfortunately, our results only showed an inverse relationship between 25(OH)D levels and zBMI in preschool children and did not provide further evidence on the influence of vitamin D status on obesity or whether obesity leads to vitamin D deficiency, so more intervention trials are needed in the future to answer this question.
To further explore the molecular mechanism of vitamin D in obesity, genetic studies of the association between vitamin D deficiency and obesity have been conducted in recent years, focusing mainly on the relationship between vitamin D-related genes and obesity [28]. A genetic association analysis [44] investigated the contribution of the vitamin D receptor (VDR) genetic variants (TaqI, BsmI and FokI) to several obesity-related traits and found that VDR genetic variants were not significantly associated with obesity-related phenotypes in Caucasian young adults. And Wang et al. [45] also studied the association of VDR gene with metabolic syndrome and found that VDR gene polymorphisms may be correlated with obesity or metabolic syndrome in Chinese children. Furthermore, the related molecular mechanism of the relationship between VDR gene polymorphisms and obesity is available in the review of Akter et al. [29].
However, few studies have focused on whether obesity-related genes influence vitamin D levels and the interaction between obesity-related polymorphisms and vitamin D status on childhood obesity. Therefore, we also conducted correlation analysis on PRS and 25(OH)D levels and explored the interplay between genetic risk and vitamin D status on the zBMI of children. Eventually, no significant relation between the PRS and 25(OH)D levels was found in our study. And the results showed that within each group of genetic risk, zBMI was lower in participants with sufficient vitamin D. But significant difference in zBMI between different vitamin D statuses was only seen in the low-risk PRS group and the intermediate-risk PRS group, which indicated that maintaining sufficient vitamin D may only help lower the zBMI in preschoolers with low and intermediate genetic risk, and not in those with high genetic risk.
To our knowledge, this is the first study to determine the relationship between the BMI-related PRS, vitamin D levels, and zBMI in Chinese preschoolers. We not only aggregated the effects of many variants for the following analyses but also avoided the trans-ancestry problem. Furthermore, both Han and non-Han children were included in the study, so that the study covered a wider population. However, there are not without limitations to our study. First, no causal inferences could be drawn from this study as it was based on cross-sectional data. Second, our study was limited to preschoolers aged 3.7 to 6.6 years from China rural areas, and the generalizability of our findings should be tested in other demographic populations. Third, some unavailable variables that may influence results were not included in the analysis, such as the BMI of the mother and sun exposure of subjects. Moreover, p < 5.0 × 10⁻⁸ was chosen as the selection threshold directly, the PRS were therefore not calculated over a range of thresholds, which may result in poor PRS with high standard error. Finally, the explaining variation of zBMI by the PRS reached only 1.0%, which was calculated based on the linear regression by the ranks of zBMI and the PRS among current participants. In the study of Locke et al. [5], the 97 SNPs associated with BMI explained 2.7% of the variance in BMI, which compared to a relatively small percentage of variance in zBMI explained by our established PRS.
5. Conclusions
Our results provide new evidence for association studies between genetics, vitamin D levels, and zBMI in preschoolers. An inverse relationship between 25(OH)D levels and zBMI was found in Chinese preschoolers. Our results indicated that maintaining adequate vitamin D levels may only contribute to lower the zBMI in preschoolers with low and intermediate genetic susceptibility and not in those with high genetic risk. Further studies therefore should be performed to further determine the interaction between vitamin D status and genetic risk of childhood obesity and provide effective prevention and treatment strategies.
Supplementary Materials
The following supporting information can be downloaded at: https://www.mdpi.com/article/10.3390/nu16060792/s1, Table S1: Primer sequences of 55 loci included in the polygenic risk score; Table S2: Detailed information of 55 loci included in the polygenic risk score.
Author Contributions
Conceptualization, L.P. and Y.L.; formal analysis, L.P.; software, L.P.; Resources, T.L., L.S. and C.C.; investigation, L.P., T.L., C.H., J.Z. and M.W.; data curation, L.P., J.F. and Z.G.; project administration, J.H. and Z.G.; writing—original draft preparation, L.P.; writing—review and editing, Q.Z. and Y.L. All authors have read and agreed to the published version of the manuscript.
Funding
This research was funded by Study of Diet and Nutrition Assessment and Intervention Technology (No. 2020YFC2006301) from Active Health and Aging Technologic Solutions Major Project of National Key R&D Program; Long-term Health Effects Assessment Project of Infants and Toddlers Nutritional Pack (No. 131031107000200001).
Institutional Review Board Statement
The study was conducted in accordance with the Declaration of Helsinki and approved by the Ethics Committee of the Institute of Nutrition and Health of the Chinese Center for Disease Control and Prevention on 20 July 2018 (No. 2018-017).
Informed Consent Statement
Caregivers of all participating children were fully informed and signed informed consent forms.
Data Availability Statement
The datasets generated and analyzed during the current study are not publicly available but are available from the corresponding author on reasonable request.
Acknowledgments
We would like to acknowledge all the participants and the staff working at the Maternity and Child Healthcare Hospital for their help with the project implementation.
Conflicts of Interest
The authors declare no conflict of interest.
References
- World Health Organization. Facts and Figures on Childhood Obesity. 2020. Available online: https://www.who.int/news-room/fact-sheets/detail/obesity-and-overweight (accessed on 20 December 2023).
- Pan, X.F.; Wang, L.; Pan, A. Epidemiology and determinants of obesity in China. Lancet Diabetes Endocrinol. 2021, 9, 373–392. [Google Scholar] [CrossRef]
- Verduci, E.; Di Profio, E.; Fiore, G.; Zuccotti, G. Integrated Approaches to Combatting Childhood Obesity. Ann. Nutr. Metab. 2022, 78 (Suppl. S2), 8–19. [Google Scholar] [CrossRef]
- Liu, D.; Hao, Y.X.; Zhao, T.Z.; Song, P.K.; Zhai, Y.; Pang, S.J.; Zhao, Y.F.; Zhang, M.; Wang, Z.Q.; Mi, S.Q.; et al. Childhood BMI and Adult Obesity in a Chinese Sample: A 13-Year Follow-up Study. Biomed. Environ. Sci. 2019, 32, 162–168. [Google Scholar] [CrossRef] [PubMed]
- Locke, A.E.; Kahali, B.; Berndt, S.I.; Justice, A.E.; Pers, T.H.; Day, F.R.; Powell, C.; Vedantam, S.; Buchkovich, M.L.; Yang, J.; et al. Genetic studies of body mass index yield new insights for obesity biology. Nature 2015, 518, 197–206. [Google Scholar] [CrossRef] [PubMed]
- Loos, R.J.F.; Yeo, G.S.H. The genetics of obesity: From discovery to biology. Nat. Rev. Genet. 2022, 23, 120–133. [Google Scholar] [CrossRef] [PubMed]
- Frayling, T.M.; Timpson, N.J.; Weedon, M.N.; Zeggini, E.; Freathy, R.M.; Lindgren, C.M.; Perry, J.R.; Elliott, K.S.; Lango, H.; Rayner, N.W.; et al. A common variant in the FTO gene is associated with body mass index and predisposes to childhood and adult obesity. Science 2007, 316, 889–894. [Google Scholar] [CrossRef]
- Scuteri, A.; Sanna, S.; Chen, W.M.; Uda, M.; Albai, G.; Strait, J.; Najjar, S.; Nagaraja, R.; Orrú, M.; Usala, G.; et al. Genome-wide association scan shows genetic variants in the FTO gene are associated with obesity-related traits. PLoS Genet. 2007, 3, e115. [Google Scholar] [CrossRef]
- Sun, C.; Kovacs, P.; Guiu-Jurado, E. Genetics of Obesity in East Asians. Front. Genet. 2020, 11, 575049. [Google Scholar] [CrossRef]
- Akiyama, M.; Okada, Y.; Kanai, M.; Takahashi, A.; Momozawa, Y.; Ikeda, M.; Iwata, N.; Ikegawa, S.; Hirata, M.; Matsuda, K.; et al. Genome-wide association study identifies 112 new loci for body mass index in the Japanese population. Nat. Genet. 2017, 49, 1458–1467. [Google Scholar] [CrossRef] [PubMed]
- Bradfield, J.P.; Vogelezang, S.; Felix, J.F.; Chesi, A.; Helgeland, Ø.; Horikoshi, M.; Karhunen, V.; Lowry, E.; Cousminer, D.L.; Ahluwalia, T.S.; et al. A trans-ancestral meta-analysis of genome-wide association studies reveals loci associated with childhood obesity. Hum. Mol. Genet. 2019, 28, 3327–3338. [Google Scholar] [CrossRef]
- Felix, J.F.; Bradfield, J.P.; Monnereau, C.; van der Valk, R.J.; Stergiakouli, E.; Chesi, A.; Gaillard, R.; Feenstra, B.; Thiering, E.; Kreiner-Møller, E.; et al. Genome-wide association analysis identifies three new susceptibility loci for childhood body mass index. Hum. Mol. Genet. 2016, 25, 389–403. [Google Scholar] [CrossRef]
- Vogelezang, S.; Bradfield, J.P.; Ahluwalia, T.S.; Curtin, J.A.; Lakka, T.A.; Grarup, N.; Scholz, M.; van der Most, P.J.; Monnereau, C.; Stergiakouli, E.; et al. Novel loci for childhood body mass index and shared heritability with adult cardiometabolic traits. PLoS Genet. 2020, 16, e1008718. [Google Scholar] [CrossRef]
- Yang, J.; Benyamin, B.; McEvoy, B.P.; Gordon, S.; Henders, A.K.; Nyholt, D.R.; Madden, P.A.; Heath, A.C.; Martin, N.G.; Montgomery, G.W.; et al. Common SNPs explain a large proportion of the heritability for human height. Nat. Genet. 2010, 42, 565–569. [Google Scholar] [CrossRef]
- Choi, S.W.; Mak, T.S.; O’Reilly, P.F. Tutorial: A guide to performing polygenic risk score analyses. Nat. Protoc. 2020, 15, 2759–2772. [Google Scholar] [CrossRef]
- Hang, D.; Shen, H.B. Application of polygenic risk scores in risk prediction and precision prevention of complex diseases: Opportunities and challenges. Zhonghua Liu Xing Bing Xue Za Zhi 2019, 40, 1027–1030. [Google Scholar] [CrossRef]
- Yoon, N.; Cho, Y.S. Development of a Polygenic Risk Score for BMI to Assess the Genetic Susceptibility to Obesity and Related Diseases in the Korean Population. Int. J. Mol. Sci. 2023, 24, 11560. [Google Scholar] [CrossRef]
- Tyrrell, J.; Wood, A.R.; Ames, R.M.; Yaghootkar, H.; Beaumont, R.N.; Jones, S.E.; Tuke, M.A.; Ruth, K.S.; Freathy, R.M.; Davey Smith, G.; et al. Gene-obesogenic environment interactions in the UK Biobank study. Int. J. Epidemiol. 2017, 46, 559–575. [Google Scholar] [CrossRef] [PubMed]
- Park, S.; Yang, H.J.; Kim, M.J.; Hur, H.J.; Kim, S.H.; Kim, M.S. Interactions between Polygenic Risk Scores, Dietary Pattern, and Menarche Age with the Obesity Risk in a Large Hospital-Based Cohort. Nutrients 2021, 13, 3772. [Google Scholar] [CrossRef]
- Dashti, H.S.; Miranda, N.; Cade, B.E.; Huang, T.; Redline, S.; Karlson, E.W.; Saxena, R. Interaction of obesity polygenic score with lifestyle risk factors in an electronic health record biobank. BMC Med. 2022, 20, 5. [Google Scholar] [CrossRef] [PubMed]
- van Schoor, N.; Lips, P. Global Overview of Vitamin D Status. Endocrinol. Metab. Clin. N. Am. 2017, 46, 845–870. [Google Scholar] [CrossRef] [PubMed]
- Pereira-Santos, M.; Costa, P.R.; Assis, A.M.; Santos, C.A.; Santos, D.B. Obesity and vitamin D deficiency: A systematic review and meta-analysis. Obes. Rev. 2015, 16, 341–349. [Google Scholar] [CrossRef] [PubMed]
- Saneei, P.; Salehi-Abargouei, A.; Esmaillzadeh, A. Serum 25-hydroxy vitamin D levels in relation to body mass index: A systematic review and meta-analysis. Obes. Rev. 2013, 14, 393–404. [Google Scholar] [CrossRef] [PubMed]
- Vimaleswaran, K.S.; Berry, D.J.; Lu, C.; Tikkanen, E.; Pilz, S.; Hiraki, L.T.; Cooper, J.D.; Dastani, Z.; Li, R.; Houston, D.K.; et al. Causal relationship between obesity and vitamin D status: Bi-directional Mendelian randomization analysis of multiple cohorts. PLoS Med. 2013, 10, e1001383. [Google Scholar] [CrossRef] [PubMed]
- Rafiq, S.; Jeppesen, P.B. Body Mass Index, Vitamin D, and Type 2 Diabetes: A Systematic Review and Meta-Analysis. Nutrients 2018, 10, 1182. [Google Scholar] [CrossRef]
- Huang, X.; Yang, Y.; Jiang, Y.; Zhou, Z.; Zhang, J. Association between vitamin D deficiency and lipid profiles in overweight and obese adults: A systematic review and meta-analysis. BMC Public Health 2023, 23, 1653. [Google Scholar] [CrossRef] [PubMed]
- Kelishadi, R.; Farajzadegan, Z.; Bahreynian, M. Association between vitamin D status and lipid profile in children and adolescents: A systematic review and meta-analysis. Int. J. Food Sci. Nutr. 2014, 65, 404–410. [Google Scholar] [CrossRef]
- Ruiz-Ojeda, F.J.; Anguita-Ruiz, A.; Leis, R.; Aguilera, C.M. Genetic Factors and Molecular Mechanisms of Vitamin D and Obesity Relationship. Ann. Nutr. Metab. 2018, 73, 89–99. [Google Scholar] [CrossRef]
- Akter, R.; Afrose, A.; Sharmin, S.; Rezwan, R.; Rahman, M.R.; Neelotpol, S. A comprehensive look into the association of vitamin D levels and vitamin D receptor gene polymorphism with obesity in children. Biomed. Pharmacother. 2022, 153, 113285. [Google Scholar] [CrossRef]
- A health professional’s guide for using the new WHO growth charts. Paediatr. Child Health 2010, 15, 84–98. [CrossRef]
- Feng, J.; Wang, Y.; Liu, T.; Huo, J.; Zhuo, Q.; Gong, Z. Effects of the Duration of Ying Yang Bao Consumption on Hemoglobin Concentration in Infants and Young Children in Less Developed Areas of China. Nutrients 2022, 14, 4539. [Google Scholar] [CrossRef]
- Cashman, K.D.; van den Heuvel, E.G.; Schoemaker, R.J.; Prévéraud, D.P.; Macdonald, H.M.; Arcot, J. 25-Hydroxyvitamin D as a Biomarker of Vitamin D Status and Its Modeling to Inform Strategies for Prevention of Vitamin D Deficiency within the Population. Adv. Nutr. 2017, 8, 947–957. [Google Scholar] [CrossRef]
- Holick, M.F.; Binkley, N.C.; Bischoff-Ferrari, H.A.; Gordon, C.M.; Hanley, D.A.; Heaney, R.P.; Murad, M.H.; Weaver, C.M. Evaluation, treatment, and prevention of vitamin D deficiency: An Endocrine Society clinical practice guideline. J. Clin. Endocrinol. Metab. 2011, 96, 1911–1930. [Google Scholar] [CrossRef]
- He, C.; Holme, J.; Anthony, J. SNP genotyping: The KASP assay. Methods Mol. Biol. 2014, 1145, 75–86. [Google Scholar] [CrossRef] [PubMed]
- Luo, X.; Liu, L.; Gu, H.; Hou, F.; Xie, X.; Li, X.; Meng, H.; Zhang, J.; Xu, S.; Song, R. Pathways linking socioeconomic status to small-for-gestational-age (SGA) infants among primiparae: A birth cohort study in China. BMJ Open 2018, 8, e020694. [Google Scholar] [CrossRef] [PubMed]
- Elliott, A.C.; Hynan, L.S. A SAS® macro implementation of a multiple comparison post hoc test for a Kruskal-Wallis analysis. Comput. Methods Programs Biomed. 2011, 102, 75–80. [Google Scholar] [CrossRef] [PubMed]
- Mason, K.E.; Palla, L.; Pearce, N.; Phelan, J.; Cummins, S. Genetic risk of obesity as a modifier of associations between neighbourhood environment and body mass index: An observational study of 335 046 UK Biobank participants. BMJ Nutr. Prev. Health 2020, 3, 247–255. [Google Scholar] [CrossRef] [PubMed]
- Fang, J.; Gong, C.; Wan, Y.; Xu, Y.; Tao, F.; Sun, Y. Polygenic risk, adherence to a healthy lifestyle, and childhood obesity. Pediatr. Obes. 2019, 14, e12489. [Google Scholar] [CrossRef]
- Duncan, L.; Shen, H.; Gelaye, B.; Meijsen, J.; Ressler, K.; Feldman, M.; Peterson, R.; Domingue, B. Analysis of polygenic risk score usage and performance in diverse human populations. Nat. Commun. 2019, 10, 3328. [Google Scholar] [CrossRef]
- Karampela, I.; Sakelliou, A.; Vallianou, N.; Christodoulatos, G.S.; Magkos, F.; Dalamaga, M. Vitamin D and Obesity: Current Evidence and Controversies. Curr. Obes. Rep. 2021, 10, 162–180. [Google Scholar] [CrossRef]
- Mallard, S.R.; Howe, A.S.; Houghton, L.A. Vitamin D status and weight loss: A systematic review and meta-analysis of randomized and nonrandomized controlled weight-loss trials. Am. J. Clin. Nutr. 2016, 104, 1151–1159. [Google Scholar] [CrossRef]
- Liu, C.; Wu, D.; Zhang, J.F.; Xu, D.; Xu, W.F.; Chen, Y.; Liu, B.Y.; Li, P.; Li, L. Changes in Bone Metabolism in Morbidly Obese Patients After Bariatric Surgery: A Meta-Analysis. Obes. Surg. 2016, 26, 91–97. [Google Scholar] [CrossRef] [PubMed]
- Kalani, A.; Bami, H.; Tiboni, M.; Jaeschke, R.; Adachi, J.D.; Lau, A.N. The effect of bariatric surgery on serum 25-OH vitamin D levels: A systematic review and meta-analysis. Obes. Sci. Pract. 2017, 3, 319–332. [Google Scholar] [CrossRef] [PubMed]
- Correa-Rodríguez, M.; Carrillo-Ávila, J.A.; Schmidt-RioValle, J.; González-Jiménez, E.; Vargas, S.; Martín, J.; Rueda-Medina, B. Genetic association analysis of vitamin D receptor gene polymorphisms and obesity-related phenotypes. Gene 2018, 640, 51–56. [Google Scholar] [CrossRef] [PubMed]
- Wang, D.; Su, K.; Ding, Z.; Zhang, Z.; Wang, C. Association of Vitamin D Receptor Gene Polymorphisms with Metabolic Syndrome in Chinese Children. Int. J. Gen. Med. 2021, 14, 57–66. [Google Scholar] [CrossRef]
Disclaimer/Publisher’s Note: The statements, opinions and data contained in all publications are solely those of the individual author(s) and contributor(s) and not of MDPI and/or the editor(s). MDPI and/or the editor(s) disclaim responsibility for any injury to people or property resulting from any ideas, methods, instructions or products referred to in the content. |
© 2024 by the authors. Licensee MDPI, Basel, Switzerland. This article is an open access article distributed under the terms and conditions of the Creative Commons Attribution (CC BY) license (https://creativecommons.org/licenses/by/4.0/).