
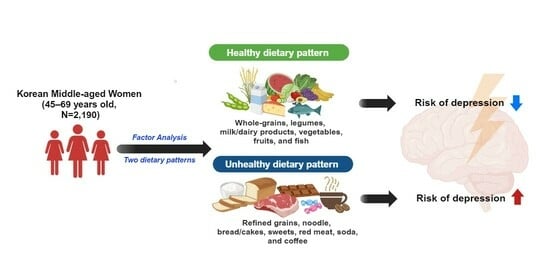
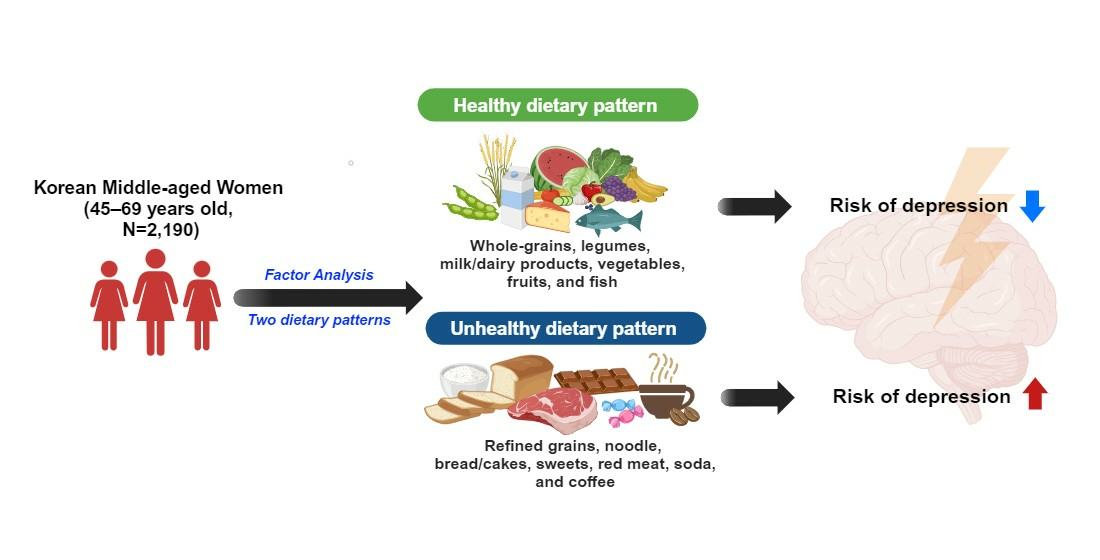
Healthy and Unhealthy Dietary Patterns of Depressive Symptoms in Middle-Aged Women


Abstract
1. Introduction
2. Materials and Methods
2.1. Participants
2.2. Methods
2.2.1. Screening for Depressive Symptoms
2.2.2. Covariates
2.2.3. Dietary Assessment
2.2.4. Statistical Analysis
3. Results
4. Discussion
5. Conclusions
Author Contributions
Funding
Institutional Review Board Statement
Informed Consent Statement
Data Availability Statement
Acknowledgments
Conflicts of Interest
References
- Albert, P.R. Why is depression more prevalent in women? J. Psychiatry Neurosci. 2015, 40, 219–221. [Google Scholar] [CrossRef] [PubMed]
- Baker, F.C.; de Zambotti, M.; Colrain, I.M.; Bei, B. Sleep problems during the menopausal transition: Prevalence, impact, and management challenges. Nat. Sci. Sleep 2018, 10, 73–95. [Google Scholar] [CrossRef]
- Llaneza, P.; Garcia-Portilla, M.P.; Llaneza-Suarez, D.; Armott, B.; Perez-Lopez, F.R. Depressive disorders and the menopause transition. Maturitas 2012, 71, 120–130. [Google Scholar] [CrossRef]
- Korea Health Insurance Review and Assessment Service. Available online: https://opendata.hira.or.kr/home.do (accessed on 22 August 2023).
- Parry, B.L. Estradiol fluctuations and depressive history as risk factors for menopausal depression. Menopause 2021, 28, 234–236. [Google Scholar] [CrossRef]
- Sohn, J.N. Factors Influencing Depression in Middle Aged Women: Focused on Quality of life on Menopause. J. Health Inform. Stat. 2018, 43, 148–157. [Google Scholar] [CrossRef]
- Chang, H.-K.; Cha, B.-K. Influencing Factors of Climacteric Women´s Depression. J. Korean Acad. Nurs. 2003, 33, 972–980. [Google Scholar] [CrossRef]
- Cohen, L.S.; Soares, C.N.; Vitonis, A.F.; Otto, M.W.; Harlow, B.L. Risk for new onset of depression during the menopausal transition: The Harvard study of moods and cycles. Arch. Gen. Psychiatry 2006, 63, 385–390. [Google Scholar] [CrossRef]
- Ruhé, H.G.; Mason, N.S.; Schene, A.H. Mood is indirectly related to serotonin, norepinephrine and dopamine levels in humans:: A meta-analysis of monoamine depletion studies. Mol. Psychiatry 2007, 12, 331–359. [Google Scholar] [CrossRef]
- Liang, S.; Wu, X.L.; Hu, X.; Wang, T.; Jin, F. Recognizing Depression from the Microbiota-Gut-Brain Axis. Int. J. Mol. Sci. 2018, 19, 1592. [Google Scholar] [CrossRef]
- Lotrich, F.E. Inflammatory cytokine-associated depression. Brain Res. 2015, 1617, 113–125. [Google Scholar] [CrossRef]
- Oriach, C.S.; Robertson, R.C.; Stanton, C.; Cryan, J.F.; Dinan, T.G. Food for thought: The role of nutrition in the microbiota-gut–brain axis. Clin. Nutr. Exp. 2016, 6, 25–38. [Google Scholar] [CrossRef]
- Merra, G.; Noce, A.; Marrone, G.; Cintoni, M.; Tarsitano, M.G.; Capacci, A.; De Lorenzo, A. Influence of Mediterranean Diet on Human Gut Microbiota. Nutrients 2021, 13, 7. [Google Scholar] [CrossRef]
- Shabbir, F.; Patel, A.; Mattison, C.; Bose, S.; Krishnamohan, R.; Sweeney, E.; Sandhu, S.; Nel, W.; Rais, A.; Sandhu, R.; et al. Effect of diet on serotonergic neurotransmission in depression. Neurochem. Int. 2013, 62, 324–329. [Google Scholar] [CrossRef]
- Giugliano, D.; Ceriello, A.; Esposito, K. The effects of diet on inflammation—Emphasis on the metabolic syndrome. J. Am. Coll. Cardiol. 2006, 48, 677–685. [Google Scholar] [CrossRef]
- Dawson, S.L.; Dash, S.R.; Jacka, F.N. The Importance of Diet and Gut Health to the Treatment and Prevention of Mental Disorders. Int. Rev. Neurobiol. 2016, 131, 325–346. [Google Scholar] [CrossRef]
- Kim, W.K.; Shin, D.; Song, W.O. Are Dietary Patterns Associated with Depression in U.S. Adults? J. Med. Food 2016, 19, 1074–1084. [Google Scholar] [CrossRef]
- Park, S.J.; Kim, M.S.; Lee, H.J. The association between dietary pattern and depression in middle-aged Korean adults. Nutr. Res. Pract. 2019, 13, 316–322. [Google Scholar] [CrossRef]
- Saeidlou, S.N.; Kiani, A.; Ayremlou, P. Association between Dietary Patterns and Major Depression in Adult Females: A Case-Control Study. J. Res. Health Sci. 2021, 21, e00506. [Google Scholar] [CrossRef]
- Rienks, J.; Dobson, A.J.; Mishra, G.D. Mediterranean dietary pattern and prevalence and incidence of depressive symptoms in mid-aged women: Results from a large community-based prospective study. Eur. J. Clin. Nutr. 2013, 67, 75–82. [Google Scholar] [CrossRef]
- Huang, Q.Y.; Liu, H.; Suzuki, K.; Ma, S.H.; Liu, C.H. Linking What We Eat to Our Mood: A Review of Diet, Dietary Antioxidants, and Depression. Antioxidants 2019, 8, 376. [Google Scholar] [CrossRef]
- Wang, C.J.; Yang, T.F.; Wang, G.S.; Zhao, Y.Y.; Yang, L.J.; Bi, B.N. Association between dietary patterns and depressive symptoms among middle-aged adults in China in 2016–2017. Psychiatry Res. 2018, 260, 123–129. [Google Scholar] [CrossRef] [PubMed]
- Tsai, H.J. Dietary patterns and depressive symptoms in a T aiwanese population aged 53 years and over: Results from the T aiwan L ongitudinal S tudy of A ging. Geriatr. Gerontol. Int. 2016, 16, 1289–1295. [Google Scholar] [CrossRef] [PubMed]
- Hart, M.J.; Milte, C.M.; Torres, S.J.; Thorpe, M.G.; McNaughton, S.A. Dietary patterns are associated with depressive symptoms in older Australian women but not men. Br. J. Nutr. 2019, 122, 1424–1431. [Google Scholar] [CrossRef]
- Willett, W. Nutritional Epidemiology; Oxford University Press: Oxford, UK, 1998. [Google Scholar]
- Beck, A.T.; Steer, R.A.; Brown, G.K. Manual for the Beck Depression Inventory-II; Psychological Corporation: San Antonio, TX, USA, 1996. [Google Scholar]
- Korean Society of Sleep Medicine. Available online: https://www.sleepmed.or.kr/content/info/sleeptime.html (accessed on 27 April 2023).
- Lee, H.-J.; Park, S.-J.; Kim, J.-H.; Kim, C.-I.; Chang, K.-J.; Yim, K.-S.; Kim, K.-W.; Choi, H.-M. Development and validation of a computerized semi-quantitative food frequency questionnaire program for evaluating the nutritional status of the Korean elderly. Korean J. Community Nutr. 2002, 7, 277–285. [Google Scholar]
- National Rural Living Science Institute. Food Composition Table, 6th ed.; Rural Development Administration: Suwon, Republic of Korea, 2006. [Google Scholar]
- Zhao, J.; Li, Z.; Gao, Q.; Zhao, H.; Chen, S.; Huang, L.; Wang, W.; Wang, T. A review of statistical methods for dietary pattern analysis. Nutr. J. 2021, 20, 37. [Google Scholar] [CrossRef]
- Mohammadifard, N.; Sarrafzadegan, N.; Nouri, F.; Sajjadi, F.; Alikhasi, H.; Maghroun, M.; Kelishadi, R.; Iraji, F.; Rahmati, M. Using factor analysis to identify dietary patterns in Iranian adults: Isfahan healthy heart program. Int. J. Public Health 2012, 57, 235–241. [Google Scholar] [CrossRef]
- Le Port, A.; Gueguen, A.; Kesse-Guyot, E.; Melchior, M.; Lemogne, C.; Nabi, H.; Goldberg, M.; Zins, M.; Czernichow, S. Association between Dietary Patterns and Depressive Symptoms Over Time: A 10-Year Follow-Up Study of the GAZEL Cohort. PLoS ONE 2012, 7, e51593. [Google Scholar] [CrossRef]
- Sánchez-Villegas, A.; Delgado-Rodríguez, M.; Alonso, A.; Schlatter, J.; Lahortiga, F.; Majem, L.S.; Martínez-González, M.A. Association of the Mediterranean dietary pattern with the incidence of depression: The Seguimiento Universidad de Navarra/University of Navarra follow-up (SUN) cohort. Arch. Gen. Psychiatry 2009, 66, 1090–1098. [Google Scholar] [CrossRef]
- Firth, J.; Marx, W.; Dash, S.; Carney, R.; Teasdale, S.B.; Solmi, M.; Stubbs, B.; Schuch, F.B.; Carvalho, A.F.; Jacka, F.; et al. The Effects of Dietary Improvement on Symptoms of Depression and Anxiety: A Meta-Analysis of Randomized Controlled Trials. Psychosom. Med. 2019, 81, 265–280. [Google Scholar] [CrossRef]
- Li, Y.; Lv, M.R.; Wei, Y.J.; Sun, L.; Zhang, J.X.; Zhang, H.G.; Li, B. Dietary patterns and depression risk: A meta-analysis. Psychiatry Res. 2017, 253, 373–382. [Google Scholar] [CrossRef]
- Felger, J.C.; Lotrich, F.E. Inflammatory cytokines in depression: Neurobiological mechanisms and therapeutic implications. Neuroscience 2013, 246, 199–229. [Google Scholar] [CrossRef]
- Miller, A.H.; Maletic, V.; Raison, C.L. Inflammation and its discontents: The role of cytokines in the pathophysiology of major depression. Biol. Psychiatry 2009, 65, 732–741. [Google Scholar] [CrossRef]
- Inserra, A.; Rogers, G.B.; Licinio, J.; Wong, M.L. The microbiota-inflammasome hypothesis of major depression. Bioessays 2018, 40, 1800027. [Google Scholar] [CrossRef] [PubMed]
- Trzeciak, P.; Herbet, M. Role of the Intestinal Microbiome, Intestinal Barrier and Psychobiotics in Depression. Nutrients 2021, 13, 927. [Google Scholar] [CrossRef]
- Dash, S.; Clarke, G.; Berk, M.; Jacka, F.N. The gut microbiome and diet in psychiatry: Focus on depression. Curr. Opin. Psychiatry 2015, 28, 1–6. [Google Scholar] [CrossRef]
- Ribeiro, G.; Ferri, A.; Clarke, G.; Cryan, J.F. Diet and the microbiota–gut–brain-axis: A primer for clinical nutrition. Curr. Opin. Clin. Nutr. Metab. Care 2022, 25, 443. [Google Scholar] [CrossRef] [PubMed]
- Swann, O.G.; Kilpatrick, M.; Breslin, M.; Oddy, W.H. Dietary fiber and its associations with depression and inflammation. Nutr. Rev. 2020, 78, 394–411. [Google Scholar] [CrossRef]
- Lim, S.Y.; Kim, E.J.; Kim, A.; Lee, H.J.; Choi, H.J.; Yang, S.J. Nutritional factors affecting mental health. Clin. Nutr. Res. 2016, 5, 143–152. [Google Scholar] [CrossRef] [PubMed]
- Mendivil, C.O. Dietary fish, fish nutrients, and immune function: A review. Front. Nutr. 2021, 7, 617652. [Google Scholar] [CrossRef]
- Singh, R. Role of tryptophan in health and disease: Systematic review of the anti-oxidant, anti-inflammation, and nutritional aspects of tryptophan and its metabolites. World Heart J. 2019, 11, 161–178. [Google Scholar]
- Tengeler, A.C.; Kozicz, T.; Kiliaan, A.J. Relationship between diet, the gut microbiota, and brain function. Nutr. Rev. 2018, 76, 603–617. [Google Scholar] [CrossRef] [PubMed]
- Sabia, S.; Fournier, A.; Mesrine, S.; Boutron-Ruault, M.C.; Clavel-Chapelon, F. Risk factors for onset of menopausal symptoms—Results from a large cohort study. Maturitas 2008, 60, 108–121. [Google Scholar] [CrossRef] [PubMed]
- Reis, D.J.; Ilardi, S.S.; Namekata, M.S.; Wing, E.K.; Fowler, C.H. The depressogenic potential of added dietary sugars. Med. Hypotheses 2020, 134, 109421. [Google Scholar] [CrossRef] [PubMed]

| Food Groups | Foods Included in the Food Group |
|---|---|
| Rice, rice flour, porridge, scorched rice, rice cakes | Well-milled cooked rice, Porridge, Mixed grain powder, Rice cakes |
| Whole-grain rice | Cooked rice with soybean, Cooked rice with black rice, Cooked rice with other cereals |
| Noodles and dumplings | Noodle, Udon, Kalguksu, Jajangmyeon, Jambbong, Cold noodles, Buckwheat noodles, Dumpling, Dumpling with soup |
| Bread and Cakes | White bread, Bread with red bean, Cream bread, Castella, Cake |
| Snacks, candies, and chocolate | Candy, Chocolate, Snacks, Cookies |
| Potato and sweet potato | Potato, Sweet potato, Corn, Starch jelly (acorn jelly, mung bean jelly), Starch vermicelli (Japchae) |
| Soybean, tofu, bean paste, and soy milk | Soybean milk, Tofu and tofu dishes, Soybean paste and soup/stew with soybean paste, Legumes |
| Peanut, almond, and pine nut | Peanuts, Walnuts, Pine nuts, Almonds |
| Kimchi | Cabbage kimchi, Kimchi stew, Stir-fried kimchi, Radish kimchi, Green onion kimchi, Leek kimchi, Leaf mustard kimchi, Other kimchi |
| Green and yellow vegetables | Lettuce, Sesame, Green pepper, Carrots, Spinach, Dried radish leaves, Green pumpkin, Cucumber, Pumpkin |
| Light-colored vegetables | Garlic, Onions, Cabbage, Bean sprout, Deoduck and Doraji (kinds of white root) |
| Pickles, salted fish | Korean-style pickles, salt-fermented fish |
| Mushrooms | Mushroom and mushroom dishes |
| Fruits | Apple, Tomato, Cherry tomato, Banana, Kiwi, Strawberry, Melon, Korean melon, Watermelon, Peach, Grape, Pear/pear juice, Persimmon/hard persimmon/dried persimmon, Tangerine, Orange, Orange juice, Tomato juice, grape juice |
| Meat | Pork and pork dishes (grilled pork belly, stir-fried pork, stew, ham/sausage), Beef and beef dishes (beef-bone soup, bulgogi, rib), Edible viscera, Fried chicken and chicken stew |
| Egg | Fried egg, Steamed egg, Boiled egg |
| White fish | Alaska pollack, Yellow croaker, Sea bream, Flat fish |
| Blue-backed fish | Mackerel, Pacific saury, Spanish mackerel, Canned tuna |
| Anchovy | Dried anchovy, Stir-fried anchovies, Dried sliced whitefish |
| Squid and small octopus | Seafood (crab, squid, small octopus, shellfish, shrimp) and seafood stew |
| Fish cake and imitation crab meat | Fish cake, Imitation crab meat |
| Laver, brown kelp, and sea mustard | Sea mustard and sea mustard dishes, Kelp, Dried green laver |
| Milk, yogurt, ice cream, and cheese | Milk, Yogurt, Cheese |
| Soda | Carbonated drinks |
| Coffee | Black coffee, Coffee premix |
| Tea | Green tea, Black tea, Citron tea, Other teas |
| Alcoholic drink | Soju, Beer, Rice wine (Makgeolli), Fruit wine |
| Non-Depressive Symptoms (n = 1703) | Depressive Symptoms (n = 487) | p-Value 1 | |||
|---|---|---|---|---|---|
| Mean (SE) | |||||
| Age (years) | 58.2 | (0.1) | 57.8 | (0.3) | 0.1669 |
| Height | 156.2 | (0.1) | 156.7 | (0.2) | 0.0527 |
| Weight | 59.0 | (0.2) | 58.9 | (0.4) | 0.7452 |
| BMI | 24.2 | (0.1) | 24.0 | (0.2) | 0.2894 |
| BDI-II Score | 5.6 | (0.1) | 21.0 | (0.3) | <0.0001 |
| Intake of energy | 1352.2 | (9.1) | 1315.8 | (16.9) | 0.0586 |
| N (%) | |||||
| Marital status | 0.0049 | ||||
| Married | 1401 | (82.3) | 373 | (76.6) | |
| Other | 302 | (17.7) | 114 | (23.4) | |
| Type of household | 0.0357 | ||||
| Alone | 160 | (9.4) | 61 | (12.5) | |
| With family | 1507 | (88.5) | 410 | (84.2) | |
| Other | 36 | (2.1) | 16 | (3.3) | |
| Household income | <0.0001 | ||||
| <1,000,000 | 123 | (7.2) | 61 | (12.5) | |
| 1,000,000 ≤~< 2,000,000 | 324 | (19.0) | 126 | (25.9) | |
| 2,000,000 ≤~< 4,000,000 | 635 | (37.3) | 166 | (34.1) | |
| ≥4,000,000 | 621 | (36.5) | 134 | (27.5) | |
| Education | 0.1795 | ||||
| Elementary school | 237 | (13.9) | 85 | (17.5) | |
| Middle school | 448 | (26.3) | 121 | (24.9) | |
| High school | 751 | (44.1) | 216 | (44.4) | |
| College and higher | 267 | (15.7) | 65 | (13.4) | |
| Job | 0.3293 | ||||
| White collar | 141 | (8.3) | 28 | (5.8) | |
| Service worker | 383 | (22.5) | 114 | (23.4) | |
| Blue collar | 158 | (9.3) | 47 | (9.7) | |
| Other | 1021 | (60.0) | 298 | (61.2) | |
| Sleep duration | 0.0414 | ||||
| <6 h/day | 281 | (16.5) | 104 | (21.4) | |
| 6–8 h/day | 1122 | (65.9) | 298 | (61.2) | |
| ≥8 h/day | 300 | (17.6) | 85 | (17.5) | |
| Alcohol frequency (last 1 year) | 0.0148 | ||||
| No | 1210 | (71.1) | 347 | (71.3) | |
| ≤1/week | 376 | (22.1) | 93 | (19.1) | |
| 2~3/week | 106 | (6.2) | 37 | (7.6) | |
| ≥4/week | 11 | (0.7) | 10 | (2.1) | |
| Smoking status | |||||
| Non smoker | 1661 | (97.5) | 458 | (94.1) | |
| Ex-smoker | 12 | (0.7) | 6 | (1.2) | |
| Current smoker | 30 | (1.8) | 23 | (4.7) | |
| Physical activity | <0.0001 | ||||
| Low | 223 | (13.1) | 121 | (24.9) | |
| Median | 1059 | (62.2) | 283 | (58.1) | |
| High | 421 | (24.7) | 83 | (17.0) | |
| Stress | <0.0001 | ||||
| Rarely | 514 | (30.2) | 35 | (7.2) | |
| A little | 909 | (53.4) | 179 | (36.8) | |
| A lot | 269 | (15.8) | 251 | (51.5) | |
| Very much | 11 | (0.7) | 22 | (4.5) | |
| Chronic disease 2 | 0.0227 | ||||
| No | 956 | (56.1) | 245 | (50.3) | |
| Yes | 747 | (43.9) | 242 | (49.7) | |
| Family history of depression | 0.0012 | ||||
| No | 1681 | (98.7) | 470 | (96.5) | |
| Yes | 22 | (1.3) | 17 | (3.5) | |
| Menopausal status | 0.8091 | ||||
| No | 192 | (11.3) | 53 | (10.9) | |
| Yes | 1511 | (88.7) | 434 | (89.1) | |
| Food Group 1 | Healthy | Unhealthy |
|---|---|---|
| Rice, rice flour, porridge, scorched rice, rice cakes | −0.21 2 | 0.68 |
| Whole-grain rice | 0.27 | −0.68 |
| noodles and dumplings | 0.52 | |
| Bread and Cakes | 0.31 | |
| Snacks, candies, and chocolate | 0.40 | |
| Potato and sweet potato | 0.40 | |
| Soybean, tofu, bean paste, and soy milk | 0.67 | |
| Peanut, almond, and pine nut | 0.43 | |
| Kimchi | 0.34 | |
| Green and yellow vegetables | 0.71 | |
| Light colored vegetables | 0.62 | |
| Pickles, salted fish | ||
| Mushrooms | 0.48 | |
| Fruits | 0.58 | |
| Meat | 0.37 | 0.43 |
| Egg | 0.38 | |
| White fish | 0.53 | 0.20 |
| Blue-backed fish | 0.53 | |
| Anchovy | 0.40 | |
| Squid and small octopus | 0.38 | 0.31 |
| Fish cake and imitation crab meat | 0.28 | 0.37 |
| Laver, brown kelp, and sea mustard | 0.46 | |
| Milk, yogurt, ice cream, and cheese | 0.44 | |
| Soda | 0.38 | |
| Coffee | 0.38 | |
| Tea | 0.20 | |
| Alcoholic drink | 0.21 |
| Q1 (Lowest) (n = 547) | Q2 (n = 548) | Q3 (n = 548) | Q4 (Highest) (n = 547) | p-Trend | |||||
|---|---|---|---|---|---|---|---|---|---|
| Nutrient intake 1,2 | |||||||||
| Energy (kcal/d) | 1066.7 | ± 12.7 d | 1220.4 | ± 12.7 c | 1406.6 | ± 12.7 b | 1682.9 | ± 12.7 a | <0.0001 |
| Protein (g/d) | 39.9 | ± 0.3 d | 43.2 | ± 0.2 c | 45.7 | ± 0.2 b | 53.2 | ± 0.3 a | <0.0001 |
| Fat (g/d) | 24.1 | ± 0.3 d | 27.5 | ± 0.3 c | 29.8 | ± 0.3 b | 36.6 | ± 0.4 a | <0.0001 |
| Carbohydrate (g/d) | 230.8 | ± 1.0 a | 223.8 | ± 0.9 b | 218.7 | ± 0.9 c | 199.7 | ± 1.0 d | <0.0001 |
| Fiber (g/d) | 4.3 | ± 0.1 d | 4.9 | ± 0.1 c | 5.6 | ± 0.1 b | 6.6 | ± 0.1 a | <0.0001 |
| Calcium (mg/d) | 297.0 | ± 5.3 d | 366.9 | ± 4.9 c | 409.4 | ± 4.8 b | 513.8 | ± 5.5 a | <0.0001 |
| Phosphorous (mg/d) | 645.2 | ± 5.0 d | 727.0 | ± 4.6 c | 783.0 | ± 4.5 b | 928.9 | ± 5.2 a | <0.0001 |
| Fe (mg/d) | 9.0 | ± 0.1 d | 9.9 | ± 0.1 c | 10.9 | ± 0.1 b | 13.0 | ± 0.1 a | <0.0001 |
| Sodium (mg/d) | 2255.3 | ± 38.4 | 2613.8 | ± 35.5 c | 2957.9 | ± 34.9 b | 3756.2 | ± 40.0 a | <0.0001 |
| K (mg/d) | 1646.5 | ± 15.2 d | 1910.5 | ± 14.1 c | 2155.1 | ± 13.8 b | 2641.2 | ± 15.9 a | <0.0001 |
| Vitamin A (RE/d) | 349.4 | ± 7.8 d | 431.3 | ± 7.2 c | 514.4 | ± 7.1 b | 721.8 | ± 8.2 a | <0.0001 |
| Carotene (μg/d) | 1643.0 | ± 44.9 d | 2041.4 | ± 41.5 c | 2498.2 | ± 40.8 b | 3587.2 | ± 46.8 a | <0.0001 |
| Retinol (μg/d) | 65.7 | ± 2.5 d | 78.9 | ± 2.3 c | 84.6 | ± 2.3 b | 106.4 | ± 2.6 a | <0.0001 |
| Vitamin B1 (mg/d) | 1.2 | ± 0.0 d | 1.2 | ± 0.0 c | 1.3 | ± 0.0 b | 1.5 | ± 0.0 a | <0.0001 |
| Vitamin B2 (mg/d) | 0.7 | ± 0.0 d | 0.8 | ± 0.0 c | 0.9 | ± 0.0 b | 1.2 | ± 0.0 a | <0.0001 |
| Niacin (mg/d) | 8.4 | ± 0.1 d | 9.0 | ± 0.1 c | 9.8 | ± 0.1 b | 11.5 | ± 0.1 a | <0.0001 |
| Vitamin C (mg/d) | 40.1 | ± 1.3 d | 53.5 | ± 1.2 c | 68.2 | ± 1.2 b | 89.2 | ± 1.4 a | <0.0001 |
| saturated fatty acid (mg/d) | 7.3 | ± 0.1 d | 8.1 | ± 0.1 c | 8.4 | ± 0.1 b | 9.8 | ± 0.1 a | <0.0001 |
| monounsaturated fatty acid (mg/d) | 7.7 | ± 0.1 d | 8.7 | ± 0.1 c | 9.5 | ± 0.1 b | 11.6 | ± 0.1 a | <0.0001 |
| polyunsaturated fatty acid (mg/d) | 5.9 | ± 0.1 d | 7.0 | ± 0.1 c | 8.0 | ± 0.1 b | 10.5 | ± 0.1 a | <0.0001 |
| Food group intake 1,2 (times/week) | |||||||||
| Rice, rice flour, porridge, scorched rice, rice cakes | 9.8 | ± 0.3 a | 5.8 | ± 0.3 b | 4.0 | ± 0.3 c | 1.4 | ± 0.3 d | <0.0001 |
| Boiled rice and cereals | 10.3 | ± 0.4 d | 14.3 | ± 0.3 c | 15.7 | ± 0.3 b | 17.0 | ± 0.4 a | <0.0001 |
| noodles and dumplings | 1.2 | ± 0.1 a | 1.1 | ± 0.0 ab | 1.0 | ± 0.0 bc | 0.8 | ± 0.1 c | <0.0001 |
| Bread and Cakes | 1.0 | ± 0.1 a | 0.8 | ± 0.1 ab | 0.7 | ± 0.1 b | 0.4 | ± 0.1 c | <0.0001 |
| Snacks, candies, and chocolate | 1.8 | ± 0.1 a | 1.5 | ± 0.1 ab | 1.3 | ± 0.1 bc | 0.8 | ± 0.1 c | <0.0001 |
| Potato and sweet potato | 1.4 | ± 0.1 d | 1.7 | ± 0.1 c | 2.0 | ± 0.1 b | 2.7 | ± 0.1 a | <0.0001 |
| Soybean, tofu, bean paste, and soy milk | 3.5 | ± 0.2 d | 4.9 | ± 0.2 c | 6.1 | ± 0.2 b | 9.7 | ± 0.2 a | <0.0001 |
| Peanut, almond, and pine nut | 0.9 | ± 0.1 d | 2.0 | ± 0.1 c | 3.0 | ± 0.1 b | 4.2 | ± 0.1 a | <0.0001 |
| Kimchi | 14.8 | ± 0.5 c | 17.6 | ± 0.4 b | 19.1 | ± 0.4 b | 21.1 | ± 0.5 a | <0.0001 |
| Green and yellow vegetables | 4.2 | ± 0.2 d | 6.2 | ± 0.2 c | 7.8 | ± 0.2 b | 12.3 | ± 0.2 a | <0.0001 |
| Light colored vegetables | 2.7 | ± 0.1 d | 4.1 | ± 0.1 c | 5.0 | ± 0.1 b | 7.8 | ± 0.2 a | <0.0001 |
| Pickles, salted fish | 0.4 | ± 0.1 c | 0.6 | ± 0.1 bc | 0.9 | ± 0.1 ab | 1.2 | ± 0.1 a | <0.0001 |
| Mushrooms | 0.6 | ± 0.1 d | 0.8 | ± 0.1 c | 1.3 | ± 0.1 b | 2.2 | ± 0.1 a | <0.0001 |
| Fruits | 4.8 | ± 0.2 d | 6.7 | ± 0.2 c | 9.5 | ± 0.2 b | 13.2 | ± 0.3 a | <0.0001 |
| Meat | 2.5 | ± 0.1 ab | 2.4 | ± 0.1 b | 2.4 | ± 0.1 b | 2.8 | ± 0.1 a | 0.0088 |
| Egg | 2.4 | ± 0.1 c | 2.9 | ± 0.1 c | 3.5 | ± 0.1 b | 4.5 | ± 0.2 a | <0.0001 |
| White fish | 0.6 | ± 0.1 c | 0.8 | ± 0.1 c | 1.0 | ± 0.1 b | 1.9 | ± 0.1 a | <0.0001 |
| Blue-backed fish | 0.4 | ± 0.0 d | 0.6 | ± 0.0 c | 0.8 | ± 0.0 b | 1.5 | ± 0.0 a | <0.0001 |
| Anchovy | 0.9 | ± 0.1 d | 1.8 | ± 0.1 c | 2.7 | ± 0.1 b | 3.9 | ± 0.2 a | <0.0001 |
| Squid and small octopus | 0.3 | ± 0.0 c | 0.4 | ± 0.0 c | 0.5 | ± 0.0 b | 0.7 | ± 0.0 a | <0.0001 |
| Fish cake and imitation crab meat | 0.2 | ± 0.0 b | 0.3 | ± 0.0 b | 0.3 | ± 0.0 b | 0.5 | ± 0.0 a | <0.0001 |
| Laver, brown kelp, and sea mustard | 1.8 | ± 0.2 d | 2.5 | ± 0.1 c | 3.6 | ± 0.1 b | 5.1 | ± 0.2 a | <0.0001 |
| Milk, yogurt, ice cream, and cheese | 4.0 | ± 0.3 c | 5.8 | ± 0.2 b | 6.4 | ± 0.2 b | 8.4 | ± 0.3 a | <0.0001 |
| Soda | 0.3 | ± 0.0 a | 0.2 | ± 0.0 ab | 0.1 | ± 0.0 b | 0.1 | ± 0.0 b | 0.0012 |
| Coffee | 10.0 | ± 0.3 a | 9.3 | ± 0.3 ab | 8.1 | ± 0.3 bc | 7.8 | ± 0.4 c | <0.0001 |
| Tea | 0.5 | ± 0.1 c | 0.8 | ± 0.1 c | 1.6 | ± 0.1 b | 2.2 | ± 0.1 a | <0.0001 |
| Alcoholic drink | 1.3 | ± 0.1 a | 0.7 | ± 0.1 b | 0.5 | ± 0.1 bc | 0.3 | ± 0.1 c | <0.0001 |
| Q1 (Lowest) (n = 547) | Q2 (n = 548) | Q3 (n = 548) | Q4 (Highest) (n = 547) | p-Trend | |||||
|---|---|---|---|---|---|---|---|---|---|
| Nutrient intake 1,2 | |||||||||
| Energy (kcal/d) | 1259.6 | ± 15.7 cd | 1287.9 | ± 15.7 c | 1362.5 | ± 15.7 b | 1466.6 | ± 15.7 a | <0.0001 |
| Protein (g/d) | 45.5 | ± 0.3 ab | 45.7 | ± 0.3 ab | 46.0 | ± 0.3 a | 44.8 | ± 0.3 b | 0.0234 |
| Fat (g/d) | 28.5 | ± 0.3 b | 28.8 | ± 0.3 b | 30.4 | ± 0.3 a | 30.4 | ± 0.3 a | <0.0001 |
| Carbohydrate (g/d) | 222.9 | ± 1.0 a | 220.5 | ± 1.0 a | 214.8 | ± 1.0 b | 214.8 | ± 1.0 b | <0.0001 |
| Fiber (g/d) | 5.6 | ± 0.1 a | 5.6 | ± 0.1 a | 5.3 | ± 0.1 b | 5.0 | ± 0.1 c | <0.0001 |
| Calcium (mg/d) | 426.7 | ± 5.4 a | 399.2 | ± 5.4 b | 396.7 | ± 5.4 b | 364.6 | ± 5.5 c | <0.0001 |
| Phosphorous (mg/d) | 808.4 | ± 5.6 a | 782.9 | ± 5.6 b | 774.9 | ± 5.5 b | 717.9 | ± 5.6 c | <0.0001 |
| Fe (mg/d) | 10.9 | ± 0.1 ab | 11.0 | ± 0.1 a | 10.6 | ± 0.1 bc | 10.3 | ± 0.1 c | <0.0001 |
| Sodium (mg/d) | 2780.8 | ± 39.7 b | 2900.3 | ± 39.5 ab | 2915.3 | ± 39.4 ab | 2986.3 | ± 40.0 a | 0.0037 |
| K (mg/d) | 2196.6 | ± 18.2 a | 2135.1 | ± 18.1 ab | 2081.1 | ± 18.1 b | 1940.1 | ± 18.4 c | <0.0001 |
| Vitamin A (RE/d) | 522.2 | ± 8.6 | 506.1 | ± 8.5 | 499.9 | ± 8.5 | 488.7 | ± 8.6 | 0.0512 |
| Carotene (μg/d) | 2503.9 | ± 47.9 | 2458.5 | ± 47.6 | 2407.8 | ± 47.5 | 2398.9 | ± 48.2 | 0.3853 |
| Retinol (μg/d) | 89.9 | ± 2.3 a | 83.3 | ± 2.3 ab | 85.4 | ± 2.3 ab | 77.1 | ± 2.3 b | 0.0016 |
| Vitamin B1 (mg/d) | 1.3 | ± 0.0 a | 1.3 | ± 0.0 a | 1.3 | ± 0.0 ab | 1.3 | ± 0.0 b | 0.0005 |
| Vitamin B2 (mg/d) | 0.9 | ± 0.0 | 0.9 | ± 0.0 | 0.9 | ± 0.0 | 0.9 | ± 0.0 | 0.1772 |
| Niacin (mg/d) | 9.5 | ± 0.1 | 9.7 | ± 0.1 | 9.7 | ± 0.1 | 9.7 | ± 0.1 | 0.4375 |
| Vitamin C (mg/d) | 71.0 | ± 1.3 a | 65.0 | ± 1.3 b | 62.2 | ± 1.3 b | 52.9 | ± 1.3 c | <0.0001 |
| saturated fatty acid (mg/d) | 8.0 | ± 0.1 b | 8.1 | ± 0.1 b | 8.8 | ± 0.1 a | 8.8 | ± 0.1 a | <0.0001 |
| monounsaturated fatty acid (mg/d) | 9.0 | ± 0.1 b | 9.1 | ± 0.1 b | 9.7 | ± 0.1 a | 9.7 | ± 0.1 a | <0.0001 |
| polyunsaturated fatty acid (mg/d) | 8.0 | ± 0.1 | 7.8 | ± 0.1 | 7.9 | ± 0.1 | 7.7 | ± 0.1 | 0.1213 |
| Food group intake 1,2 (times/week) | |||||||||
| Rice, rice flour, porridge, scorched rice, rice cakes | 0.6 | ± 0.2 d | 1.7 | ± 0.2 c | 4.8 | ± 0.2 b | 13.9 | ± 0.2 a | <0.0001 |
| Boiled rice and cereals | 20.4 | ± 0.2 a | 18.3 | ± 0.2 b | 13.7 | ± 0.2 c | 4.9 | ± 0.2 d | <0.0001 |
| noodles and dumplings | 0.4 | ± 0.0 d | 0.9 | ± 0.0 c | 1.1 | ± 0.0 b | 1.6 | ± 0.0 a | <0.0001 |
| Bread and Cakes | 0.3 | ± 0.1 c | 0.6 | ± 0.1 b | 0.8 | ± 0.1 b | 1.2 | ± 0.1 a | <0.0001 |
| Snacks, candies, and chocolate | 0.5 | ± 0.1 c | 0.9 | ± 0.1 c | 1.4 | ± 0.1 b | 2.6 | ± 0.1 a | <0.0001 |
| Potato and sweet potato | 1.7 | ± 0.1 b | 2.0 | ± 0.1 ab | 2.0 | ± 0.1 ab | 2.1 | ± 0.1 a | 0.0094 |
| Soybean, tofu, bean paste, and soy milk | 6.3 | ± 0.2 | 6.2 | ± 0.2 | 5.9 | ± 0.2 | 5.8 | ± 0.2 | 0.1591 |
| Peanut, almond, and pine nut | 3.8 | ± 0.1 a | 2.5 | ± 0.1 b | 2.3 | ± 0.1 b | 1.5 | ± 0.1 c | <0.0001 |
| Kimchi | 19.9 | ± 0.4 a | 19.1 | ± 0.4 a | 17.2 | ± 0.4 b | 16.3 | ± 0.4 b | <0.0001 |
| Green and yellow vegetables | 7.8 | ± 0.2 | 8.0 | ± 0.2 | 7.3 | ± 0.2 | 7.3 | ± 0.2 | 0.0452 |
| Light colored vegetables | 5.3 | ± 0.1 | 4.9 | ± 0.1 | 4.8 | ± 0.1 | 4.8 | ± 0.2 | 0.087 |
| Pickles, salted fish | 0.5 | ± 0.1 c | 0.7 | ± 0.1 bc | 0.9 | ± 0.1 ab | 1.1 | ± 0.1 a | <0.0001 |
| Mushrooms | 1.5 | ± 0.1 a | 1.2 | ± 0.1 b | 1.2 | ± 0.1 b | 1.1 | ± 0.1 b | 0.0002 |
| Fruits | 10.3 | ± 0.2 a | 8.9 | ± 0.2 b | 8.4 | ± 0.2 b | 6.7 | ± 0.2 c | <0.0001 |
| Meat | 1.7 | ± 0.1 d | 2.3 | ± 0.1 c | 2.8 | ± 0.1 b | 3.4 | ± 0.1 a | <0.0001 |
| Egg | 3.7 | ± 0.1 a | 3.4 | ± 0.1 ab | 3.1 | ± 0.1 b | 3.0 | ± 0.1 b | 0.001 |
| White fish | 0.9 | ± 0.1 b | 1.0 | ± 0.1 ab | 1.2 | ± 0.1 a | 1.2 | ± 0.1 a | <0.0001 |
| Blue-backed fish | 0.9 | ± 0.0 | 0.8 | ± 0.0 | 0.9 | ± 0.0 | 0.9 | ± 0.0 | 0.6289 |
| Anchovy | 3.2 | ± 0.1 a | 2.3 | ± 0.1 b | 2.1 | ± 0.1 b | 1.7 | ± 0.1 b | <0.0001 |
| Squid and small octopus | 0.3 | ± 0.0 c | 0.4 | ± 0.0 b | 0.5 | ± 0.0 b | 0.6 | ± 0.0 a | <0.0001 |
| Fish cake and imitation crab meat | 0.1 | ± 0.0 c | 0.2 | ± 0.0 b | 0.3 | ± 0.0 b | 0.6 | ± 0.0 a | <0.0001 |
| Laver, brown kelp, and sea mustard | 3.4 | ± 0.1 | 3.2 | ± 0.1 | 3.2 | ± 0.1 | 3.2 | ± 0.1 | 0.8284 |
| Milk, yogurt, ice cream, and cheese | 7.2 | ± 0.2 a | 6.1 | ± 0.2 b | 6.4 | ± 0.2 ab | 4.8 | ± 0.2 c | <0.0001 |
| Soda | 0.0 | ± 0.0 b | 0.1 | ± 0.0 b | 0.1 | ± 0.0 b | 0.4 | ± 0.0 a | <0.0001 |
| Coffee | 4.7 | ± 0.3 d | 8.3 | ± 0.3 c | 10.1 | ± 0.3 b | 12.2 | ± 0.3 a | <0.0001 |
| Tea | 1.5 | ± 0.1 | 1.2 | ± 0.1 | 1.2 | ± 0.1 | 1.2 | ± 0.1 | 0.4125 |
| Alcoholic drink | 0.2 | ± 0.1 b | 0.5 | ± 0.1 b | 1.0 | ± 0.1 a | 1.1 | ± 0.1 a | <0.0001 |
| All (n = 2190) | Case (n = 487) | Model 1 OR (95% CI) | Model 2 OR (95% CI) | Model 3 OR (95% CI) | Model 4 OR (95% CI) | |
|---|---|---|---|---|---|---|
| Healthy dietary pattern | ||||||
| Q1 | 547 | 166 | 1.00 (Reference) | 1.00 (Reference) | 1.00 (Reference) | 1.00 (Reference) |
| Q2 | 548 | 121 | 0.65 (0.50–0.86) | 0.64 (0.48–0.84) | 0.67 (0.51–0.88) | 0.73 (0.53–1.01) |
| Q3 | 548 | 106 | 0.56 (0.42–0.74) | 0.55 (0.42–0.73) | 0.59 (0.44–0.79) | 0.64 (0.45–0.90) |
| Q4 | 547 | 94 | 0.48 (0.36–0.64) | 0.48 (0.36–0.65) | 0.54 (0.40–0.73) | 0.56 (0.37–0.84) |
| p for trend | <0.0001 | <0.0001 | <0.0001 | 0.006 | ||
| Unhealthy dietary pattern | ||||||
| Q1 | 547 | 90 | 1.00 (Reference) | 1.00 (Reference) | 1.00 (Reference) | 1.00 (Reference) |
| Q2 | 548 | 123 | 1.47 (1.08–1.99) | 1.48 (1.09–2.01) | 1.50 (1.10–2.05) | 1.43 (1.02–2.01) |
| Q3 | 548 | 117 | 1.38 (1.01–1.88) | 1.41 (1.03–1.93) | 1.47 (1.07–2.03) | 1.55 (1.09–2.20) |
| Q4 | 547 | 157 | 2.04 (1.50–2.76) | 2.08 (1.54–2.83) | 2.14 (1.56–2.92) | 1.85 (1.30–2.63) |
| p for trend | <0.0001 | <0.0001 | <0.0001 | 0.002 | ||
Disclaimer/Publisher’s Note: The statements, opinions and data contained in all publications are solely those of the individual author(s) and contributor(s) and not of MDPI and/or the editor(s). MDPI and/or the editor(s) disclaim responsibility for any injury to people or property resulting from any ideas, methods, instructions or products referred to in the content. |
© 2024 by the authors. Licensee MDPI, Basel, Switzerland. This article is an open access article distributed under the terms and conditions of the Creative Commons Attribution (CC BY) license (https://creativecommons.org/licenses/by/4.0/).
Share and Cite
Choi, J.-Y.; Park, S.-J.; Lee, H.-J. Healthy and Unhealthy Dietary Patterns of Depressive Symptoms in Middle-Aged Women. Nutrients 2024, 16, 776. https://doi.org/10.3390/nu16060776
Choi J-Y, Park S-J, Lee H-J. Healthy and Unhealthy Dietary Patterns of Depressive Symptoms in Middle-Aged Women. Nutrients. 2024; 16(6):776. https://doi.org/10.3390/nu16060776
Chicago/Turabian StyleChoi, Ji-Young, Seon-Joo Park, and Hae-Jeung Lee. 2024. "Healthy and Unhealthy Dietary Patterns of Depressive Symptoms in Middle-Aged Women" Nutrients 16, no. 6: 776. https://doi.org/10.3390/nu16060776
APA StyleChoi, J.-Y., Park, S.-J., & Lee, H.-J. (2024). Healthy and Unhealthy Dietary Patterns of Depressive Symptoms in Middle-Aged Women. Nutrients, 16(6), 776. https://doi.org/10.3390/nu16060776