Article

Relationships between Habitual Polyphenol Consumption and Gut Microbiota in the INCLD Health Cohort

1
Helfgott Research Institute, National University of Natural Medicine, Portland, OR 97201, USA
2
Department of Food Science and Human Nutrition, Colorado State University, Fort Collins, CO 80523, USA
3
School of Health and Rehabilitation Sciences, Ohio State University, Columbus, OH 43210, USA
4
Pacific Northwest National Laboratory, Biological Sciences Division, Richland, WA 99352, USA
5
Herbert Wertheim School of Public Health, University of California, San Diego, CA 92037, USA
*
Author to whom correspondence should be addressed.
Nutrients 2024, 16(6), 773; https://doi.org/10.3390/nu16060773
Submission received: 23 January 2024 / Revised: 1 March 2024 / Accepted: 5 March 2024 / Published: 8 March 2024

Abstract

:
While polyphenol consumption is often associated with an increased abundance of beneficial microbes and decreased opportunistic pathogens, these relationships are not completely described for polyphenols consumed via habitual diet, including culinary herb and spice consumption. This analysis of the International Cohort on Lifestyle Determinants of Health (INCLD Health) cohort uses a dietary questionnaire and 16s microbiome data to examine relationships between habitual polyphenol consumption and gut microbiota in healthy adults (n = 96). In this exploratory analysis, microbial taxa, but not diversity measures, differed by levels of dietary polyphenol consumption. Taxa identified as exploratory biomarkers of daily polyphenol consumption (mg/day) included Lactobacillus, Bacteroides, Enterococcus, Eubacterium ventriosum group, Ruminococcus torques group, and Sutterella. Taxa identified as exploratory biomarkers of the frequency of polyphenol-weighted herb and spice use included Lachnospiraceae UCG-001, Lachnospiraceae UCG-004, Methanobrevibacter, Lachnoclostridium, and Lachnotalea. Several of the differentiating taxa carry out activities important for human health, although out of these taxa, those with previously described pro-inflammatory qualities in certain contexts displayed inverse relationships with polyphenol consumption. Our results suggest that higher quantities of habitual polyphenol consumption may support an intestinal environment where opportunistic and pro-inflammatory bacteria are represented in a lower relative abundance compared to those with less potentially virulent qualities.

1. Introduction

Polyphenols are phytochemicals present in various fruits, vegetables, nuts, beverages, and culinary herbs and spices in the diet [1], and evidence suggests that certain diet-derived phytochemicals (i.e., secondary plant metabolites), such as polyphenols, may beneficially modulate gut microbiota and mediate other clinically relevant biological outcomes through both microbiota-independent and microbiota-dependent mechanisms [2] Independent of interactions with microbiota, polyphenols exert direct effects through cell signaling, free-radical scavenging, and modulating gene expression and molecule production, thus altering cellular activity [3,4,5,6]. Polyphenol bioactivity is also mediated, at least in part, through interactions with gut microbiota [7,8]. Microbial metabolism of polyphenols results in bioactive metabolites that exert physiological effects both systemically and locally at the intestinal mucosa [9,10]. Taken together, evidence suggests these mechanisms beneficially impact microbial community structure [11,12,13,14], intestinal permeability [15,16], oxidative stress [4,9,17], and inflammatory [9,18,19,20], neurological [21,22,23], and cardiometabolic [24,25] processes.
While polyphenol consumption is suggested to be associated with an increased abundance of beneficial bacteria and a decrease in opportunistic and pro-inflammatory bacteria in certain contexts [13,14], evidence regarding the impact of polyphenol consumption on the abundance of specific taxa, microbial diversity, and functional communities is not consistent. It is worth noting that variability in an individual’s cardiometabolic health, substance use (e.g., smoking and alcohol use), exercise habits, healthy history, and several other factors may be reflected in variable gut microbial communities [26,27,28,29,30] and subsequent interactions with dietary polyphenols. Moreover, although the impacts of specific polyphenol-based interventions have been described in some detail, the impacts are not well described for polyphenols consumed via regular dietary habits, and consideration for the consumption of herbs and spices used in culinary settings is even more limited. Further investigating these relationships in the context of regular dietary habits in a cohort of generally healthy adults will provide insight into how habitual polyphenol consumption may support a gut microbial environment that facilitates health maintenance and, subsequently, disease prevention.
In our previous research exploring associations between culinary herb and spice use and gut microbial taxa and diversity, we identified that the frequency of culinary herb and spice use was associated with microbial taxa at the phylum level, particularly regarding herbs and spices high in polyphenol content [31]. The current study aims to build on these previous findings by using data from the same cohort to (1) explore relationships between habitual dietary polyphenol consumption from food and beverage sources and microbial taxa and diversity, and (2) further explore relationships between the frequency of polyphenol-weighted herb and spice use and microbial taxa and diversity in healthy adults. To achieve this, we first explored potential microbial biomarkers of polyphenol exposure and then used these identified biomarkers in more targeted statistical comparisons. The findings of this research further inform our understanding of the relationship between habitual dietary patterns on microbiota and may inform future guidance on dietary intake of polyphenols via diet.

2. Materials and Methods

2.1. Study Design and Participants

This study is a secondary analysis of the International Cohort on Lifestyle Determinants of Health (INCLD Health) cohort data, the methods of which have been previously described [32]. While the INCLD Health longitudinal cohort study collected data on various aspects of health and wellness, diet, and the gut microbiome over several time points at 6-month intervals, this secondary analysis only includes data from the baseline visit analyzed in a cross-sectional manner. From the original sample, a subsample (n = 96) was selected for this secondary analysis based on specific criteria. Inclusion criteria consisted of the full completion of all survey questions and data collection methods utilized for this secondary analysis, including data from the Demographic Questionnaire, Health History Questionnaire, Herb and Spice Frequency Questionnaire, VioScreen dietary analysis tool [33,34], and 16s rRNA microbiota analysis. Exclusion criteria consisted of past or current inflammatory bowel syndrome, inflammatory bowel disease (ulcerative colitis or Crohn’s disease), or celiac disease; past or current autoimmune disease; and current antibiotic use.

2.2. 16S rRNA Gene Sequencing and Processing

All 16sRNA gene sequencing and processing was performed by the Pacific Northwest National Laboratory (Richland, WA, USA). The Quick-DNA Fecal/Soil Microbe Microprep Kit (Zymo, Irvine, CA, USA) was used to extract microbial DNA from participant fecal samples. An Illumina MiSeq was used to sequence the hypervariable V4 region of the 16S rRNA gene using the 515F-806R primer set. The resulting 16S rRNA amplicon dataset was processed using QIIME2 (v2021.4) [35]. The DADA2 (q2-dada2) [36] pipeline within QIIME2 was used to denoise and cluster amplicon sequence variants (ASVs), which were then taxonomically classified (q2-feature-classifer) using the SILVA database (v138) [37]. Processed data were exported from QIIME2 and converted into a comma-delimited file.

2.3. Microbiome Data Filtering and Normalization

The data exported from QIIME2 were filtered and normalized in the MicrobiomeAnalyst online platform [38]. To remove features that may be a result of sequencing error or low-level contamination, a Low Count Filter removed reads with less than 4 counts and read that were present in less than 20% of the samples. To remove features that are close to constant throughout the experimental conditions and thus are not likely to be associated with the study conditions, a Low Variance Filter was applied to remove reads with less than 10% variance across samples, determined based on the interquartile range (IQR). Data were rarefied to minimum counts due to the large range in library sizes and data was scaled using total sum scaling. No data transformation was performed.

2.4. Polyphenol Estimations from Vioscreen Dietary Data

To quantitate polyphenol intake from the VioScreen food frequency questionnaire (FFQ) output [33,34], an Excel spreadsheet was developed to catalog all foods in which participants identified in the FFQ. All mixed dishes were deconstructed to obtain individual foods by using the Food Commodity Intake Database (FCID, https://fcid.foodrisk.org/recipes/, accessed on 7 July 2023). All deconstructed recipes were reviewed by a team of research dietitians. All foods presumed to have minimal polyphenol content were removed from analysis. When foods were grouped together on the FFQ, individual foods comprising the group were weighted using 2005–2018 National Health and Nutrition Examination Survey (NHANES) data. The remaining foods were then matched to foods and beverages in the Phenol-Explorer database (PED) version 3.6 [1,39]. The PED contains data related to 501 individual polyphenols, which are further categorized into 18 sub-classes within the following 5 major classes: flavonoids, phenolic acids, lignans, stilbenes, and “other”. The flavonoids group contains 279 polyphenols; the phenolic acids group contains 108 polyphenols; the stilbenes group contains 10 polyphenols; the lignans group contains 29 polyphenols; and the “other” group contains 80 polyphenols. Content values in the PED were chosen based on the appropriate method for the food matrix and/or polyphenol subclass following previously published methods [40,41,42]. Retention factors were not applied.

2.5. Exposure Variables

There are two main exposure variables: estimated dietary polyphenol consumption and frequency of polyphenol-weighted herb and spice use.
The estimated dietary polyphenol consumption variable is used both continuously and categorically. As a continuous variable, it is defined as the total estimated milligrams of polyphenols consumed per day (mg/day) from dietary food and beverage sources other than herbs and spices. As a categorical variable, participants are stratified into low-, medium-, or high-consumer groups based on the tertile distributions of the total estimated polyphenols consumed per day (mg/day). These tertile distributions are determined by the mg/day value of polyphenols consumed.
Since the Vioscreen dietary analysis tool does not account for the consumption of individual herbs and spices, which may be high in polyphenols, the frequency of polyphenol-weighted herb and spice use categorical variable allows us to explore relationships that these polyphenol-rich sources may have with gut microbiota. To create this polyphenol-weighted frequency variable, the frequency of use of each herb and spice was first reported by participants and scored as follows: never (Score 0), once per month (Score 1), two-to-three times per month (Score 2), once per week (Score 3), two-to-three times per week (Score 4), three-to-four times per week (Score 5), five-to-six times per week (Score 6), or daily (Score 7). Then, we stratified participants into groups of low-, medium-, and high-frequency users of polyphenol-weighted herbs and spices based on the tertile distributions of calculated polyphenol-weighted frequency scores. These tertile distributions are determined by the value of frequency scores.
To calculate polyphenol-weighted frequency scores, we used the Phenol Explorer Database [1,39] to categorize herbs and spices into one of four groups based on their total polyphenol contents in milligrams of total polyphenols per kilogram dry weight of the herb/spice (mg/kg DW; Figure 1), as follows: >1000 mg/kg DW (Group 1); 1000–1999 mg/kg DW (Group 2); 2000–2999 mg/kg DW (Group 3); and ≥3000 mg/kg DW (Group 4). We calculated a weighted frequency score for each of these four groups by summing the frequency scores of herbs within each group and then multiplying that summed score by the group number.
For example, Group 4 contains herbs with a polyphenol content of ≥3000 mg/kg DW according to the PED), and includes cinnamon, clove, and allspice; if a participant’s frequency score for each herb is 4, 0, and 7, respectively, a summed frequency score for Group 4 is created by 4 + 0 + 7 = 11. Then, a final weighted frequency score is created by multiplying 11 (the summed score) by the group number: 11 × 4 = 44.
As the survey does not assess the actual quantity of herbs and spices consumed, only the frequency of use, the weighted frequency score accounts for the fact that certain herbs and spices may contribute more polyphenols per instance of consumption than others.

2.6. Statistical Analysis

The three gut microbial outcomes for this study include measures of alpha diversity (Shannon Index), beta diversity (Bray–Curtis dissimilarity), and microbial taxa abundance [38]. Differences in the alpha diversity (Shannon Index) between low-, medium-, and high-exposure groups were assessed by Kruskal–Wallis test with a post-hoc Wilcoxon Rank Sum test. A Principal Coordinate Analysis (PCoA) based on Bray–Curtis dissimilarity metrics was used to observe differences in bacterial communities between low-, medium-, and high-exposure groups. Differences in Bray–Curtis distances were statistically analyzed using a permutational analysis of variance (PERMANOVA) with alpha = 0.05.
Then, relationships between microbial taxa abundance and polyphenol consumption were explored in a two-step approach. First, potential microbial biomarkers of polyphenol intake were identified by using a linear discriminate analysis (LDA) effect size (LEfSe). This LEfSe analysis assessed differences in bacterial taxa abundance between low-, medium-, and high-exposure groups and the effect size of those differences with a threshold LDA score of >2. As the purpose of this study was to explore microbial taxa that may be related to differing quantities of polyphenol consumption, which could be used in the subsequent targeted analysis, alpha = 0.01 for the LEfSe. Then, the microbial biomarkers identified via LEfSe were used in a Spearman’s rank correlation and a heatmap of correlation coefficients to explore relationships between microbial taxa abundance and the mg/day consumption of total polyphenols, as well as the mg/day consumption of the specific major polyphenol classes (e.g., flavonoids, phenolic acids, lignans, stilbenes, other).
The diversity and LeFSe analyses were performed in the MicrobiomeAnalyst online platform [33], while the Spearman’s Rank analyses were performed in GraphPad Prism 10 for macOS (Version 10.0.2).

3. Results

3.1. Characteristics of Study Participants

Participant demographics, cardiometabolic measures, and substance use history (e.g., smoking history, frequency of alcohol use) are reported in Table 1. The majority of participants were white (~78%), non-Hispanic (86.5%), and female (84.4%). Cardiometabolic measures for participants were, on average, within normal physiological ranges. Additionally, the majority of participants were non-smokers (88.5%); out of the 11 participants who reported being smokers, nine reported smoking 1–3 times per month and only two reported smoking daily. Finally, around 60% of participants reported consuming alcoholic beverages from never to three times per month, with only about 6% reporting use from five times per week to daily. The distribution of these measures across the low-, medium-, and high-polyphenol consumer groups are described in Supplementary Materials (Table S1).

3.1.1. Dietary Polyphenol Consumption

The average estimated dietary polyphenol consumption is reported in Table 2. Values for these exposure variables are reported for the entire sample in addition to being stratified by low-, medium-, and high-consumer categories based on tertile distributions. The largest major class of polyphenols consumed by all participants on average were flavonoids, followed by phenolic acids, lignans, “other”, and stilbenes (Table 2). Flavonoids on average comprised about half of the participants’ total polyphenol consumption.

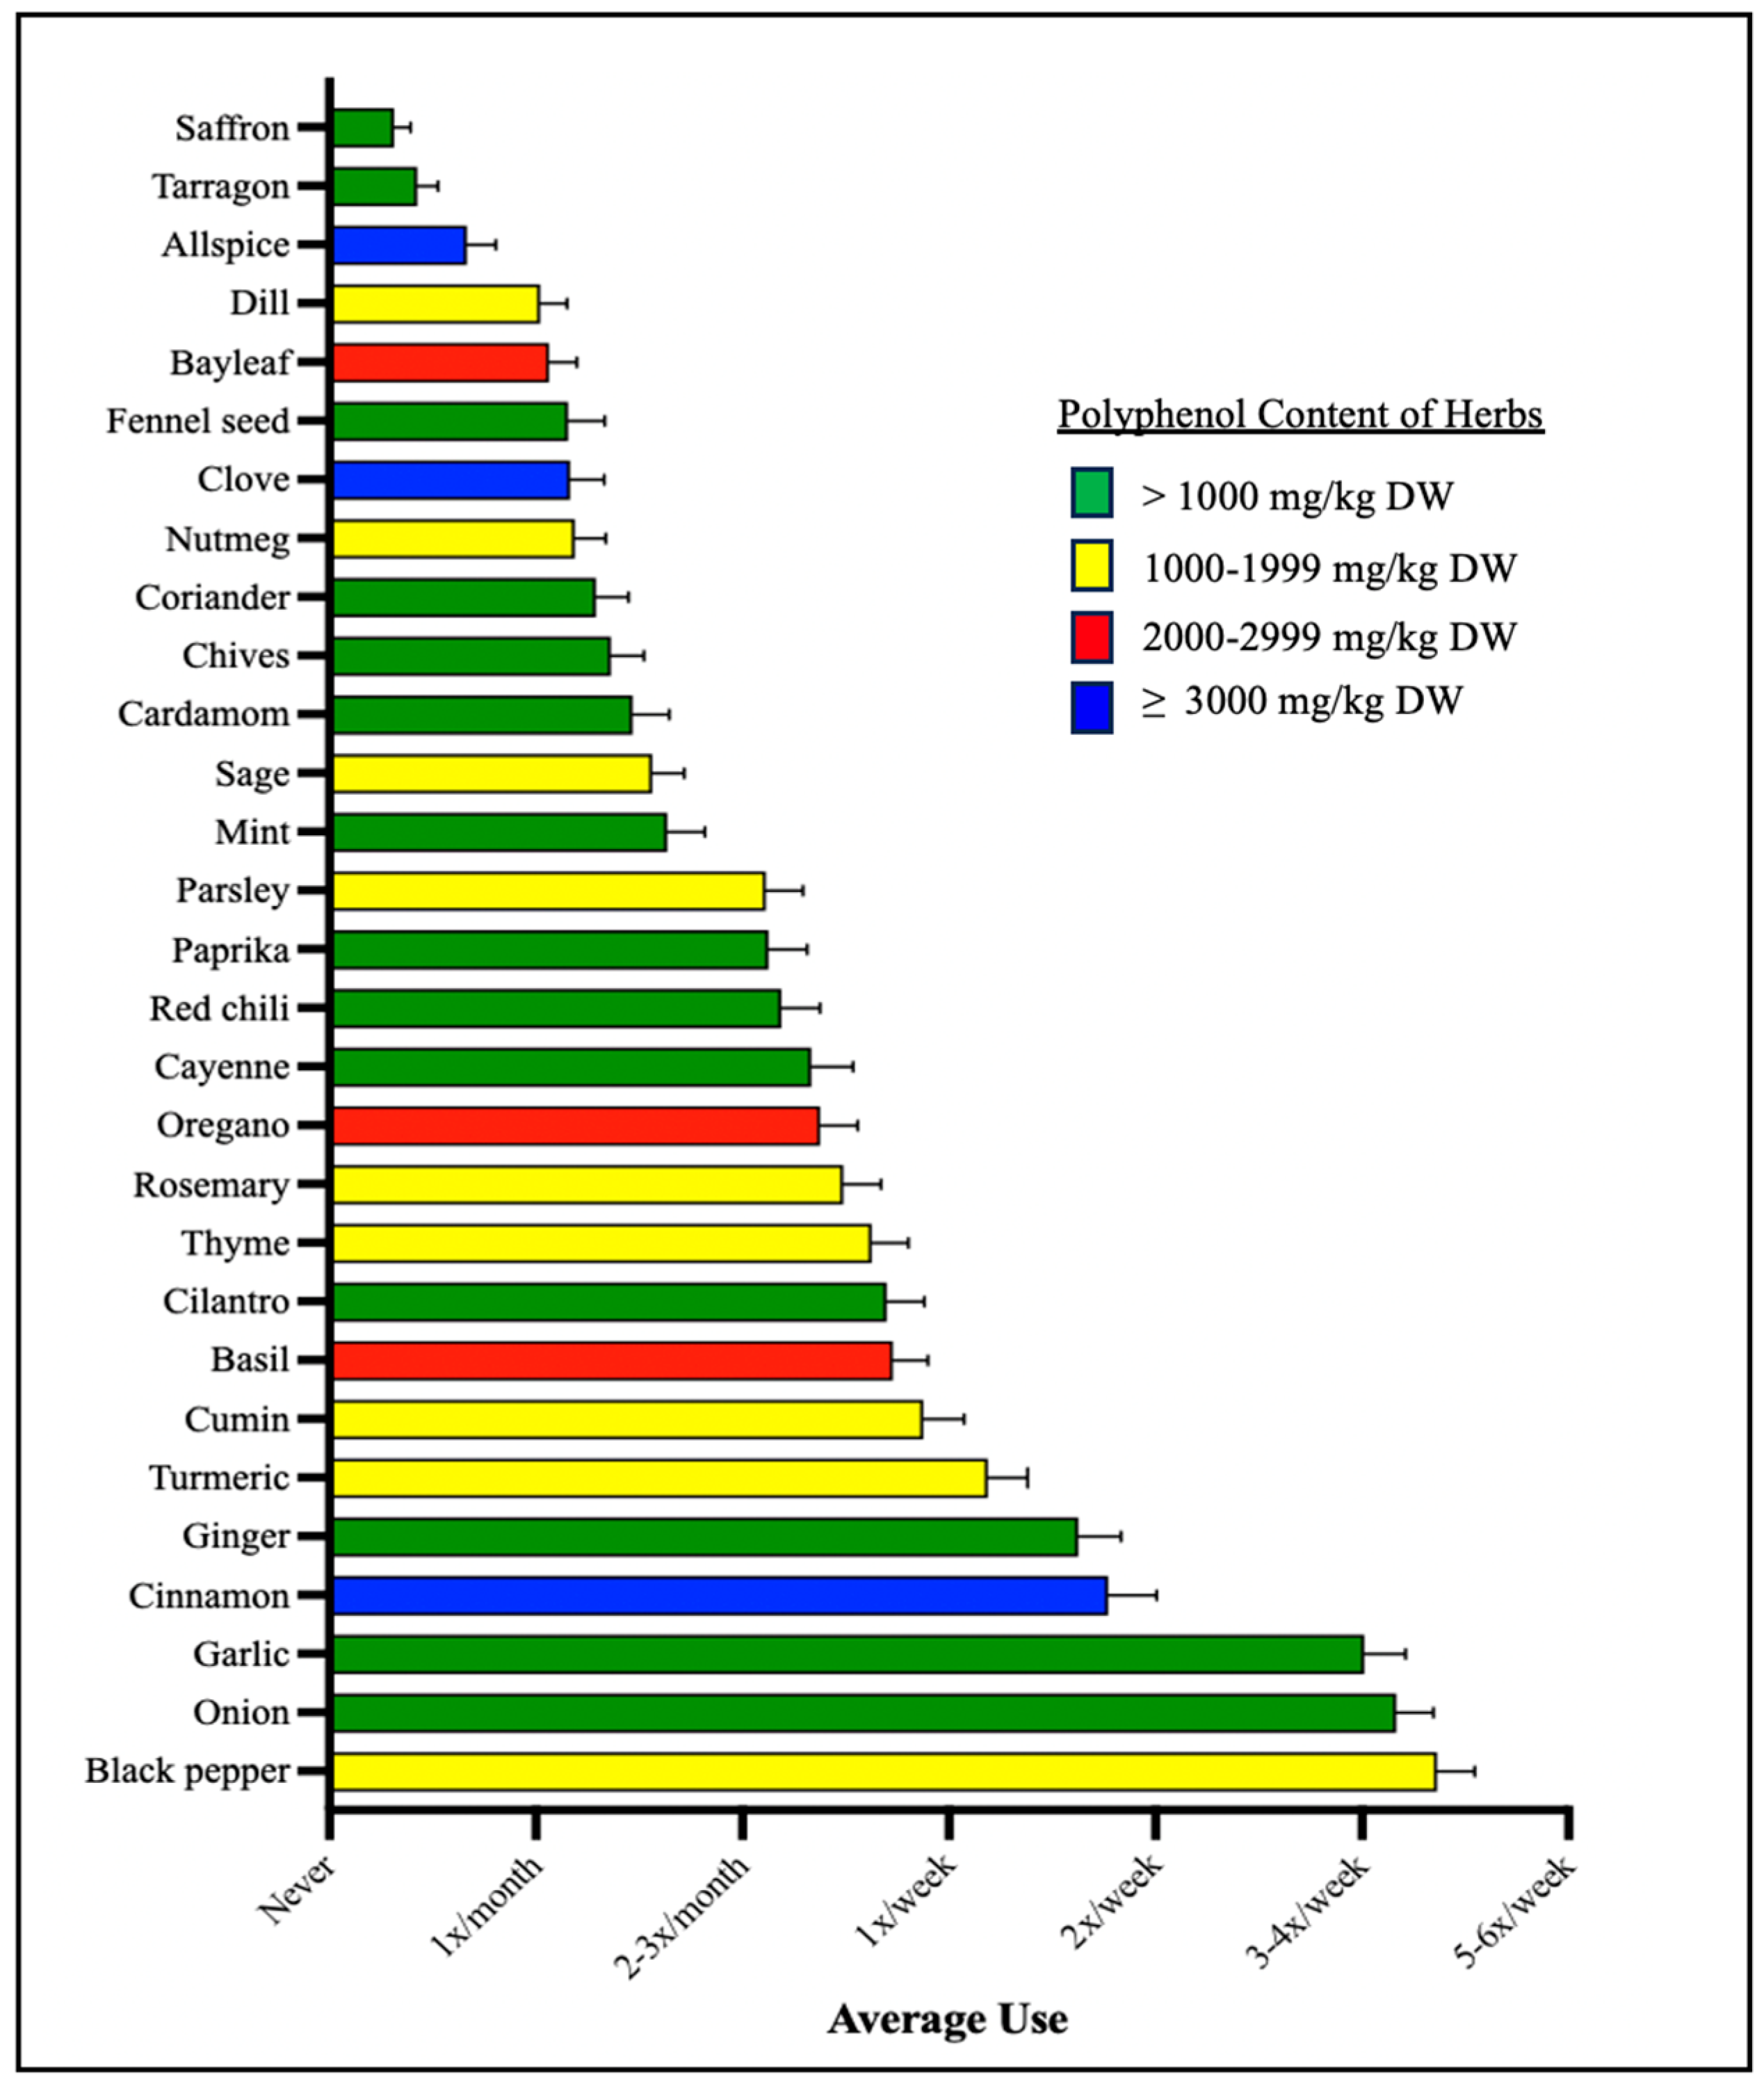
3.1.2. Herb and Spice Use

Out of the 29 herbs measured, only six herbs and spices were, on average, consumed at least once per week including black pepper, onion, garlic, cinnamon, ginger, and turmeric (Figure 1). Three out of these six herbs fell into the >1000 mg/kg DW category, as listed in the Phenol Explorer Database (PED): onion, garlic, and ginger. Black pepper, the most frequently used herb, and turmeric both fell into the 1000–1999 mg/kg DW category. Only one of these six herbs, cinnamon, fell into ≥3000 mg/kg DW category. In total, 14 of the herbs and spices used fell into the >1000 mg/kg DW category, with 9 herbs and spices in the 1000–1999 mg/kg DW category, 3 herbs and spices in the 2000–2999 mg/kg DW category, and 3 herbs and spices in the ≥3000 mg/kg DW category.

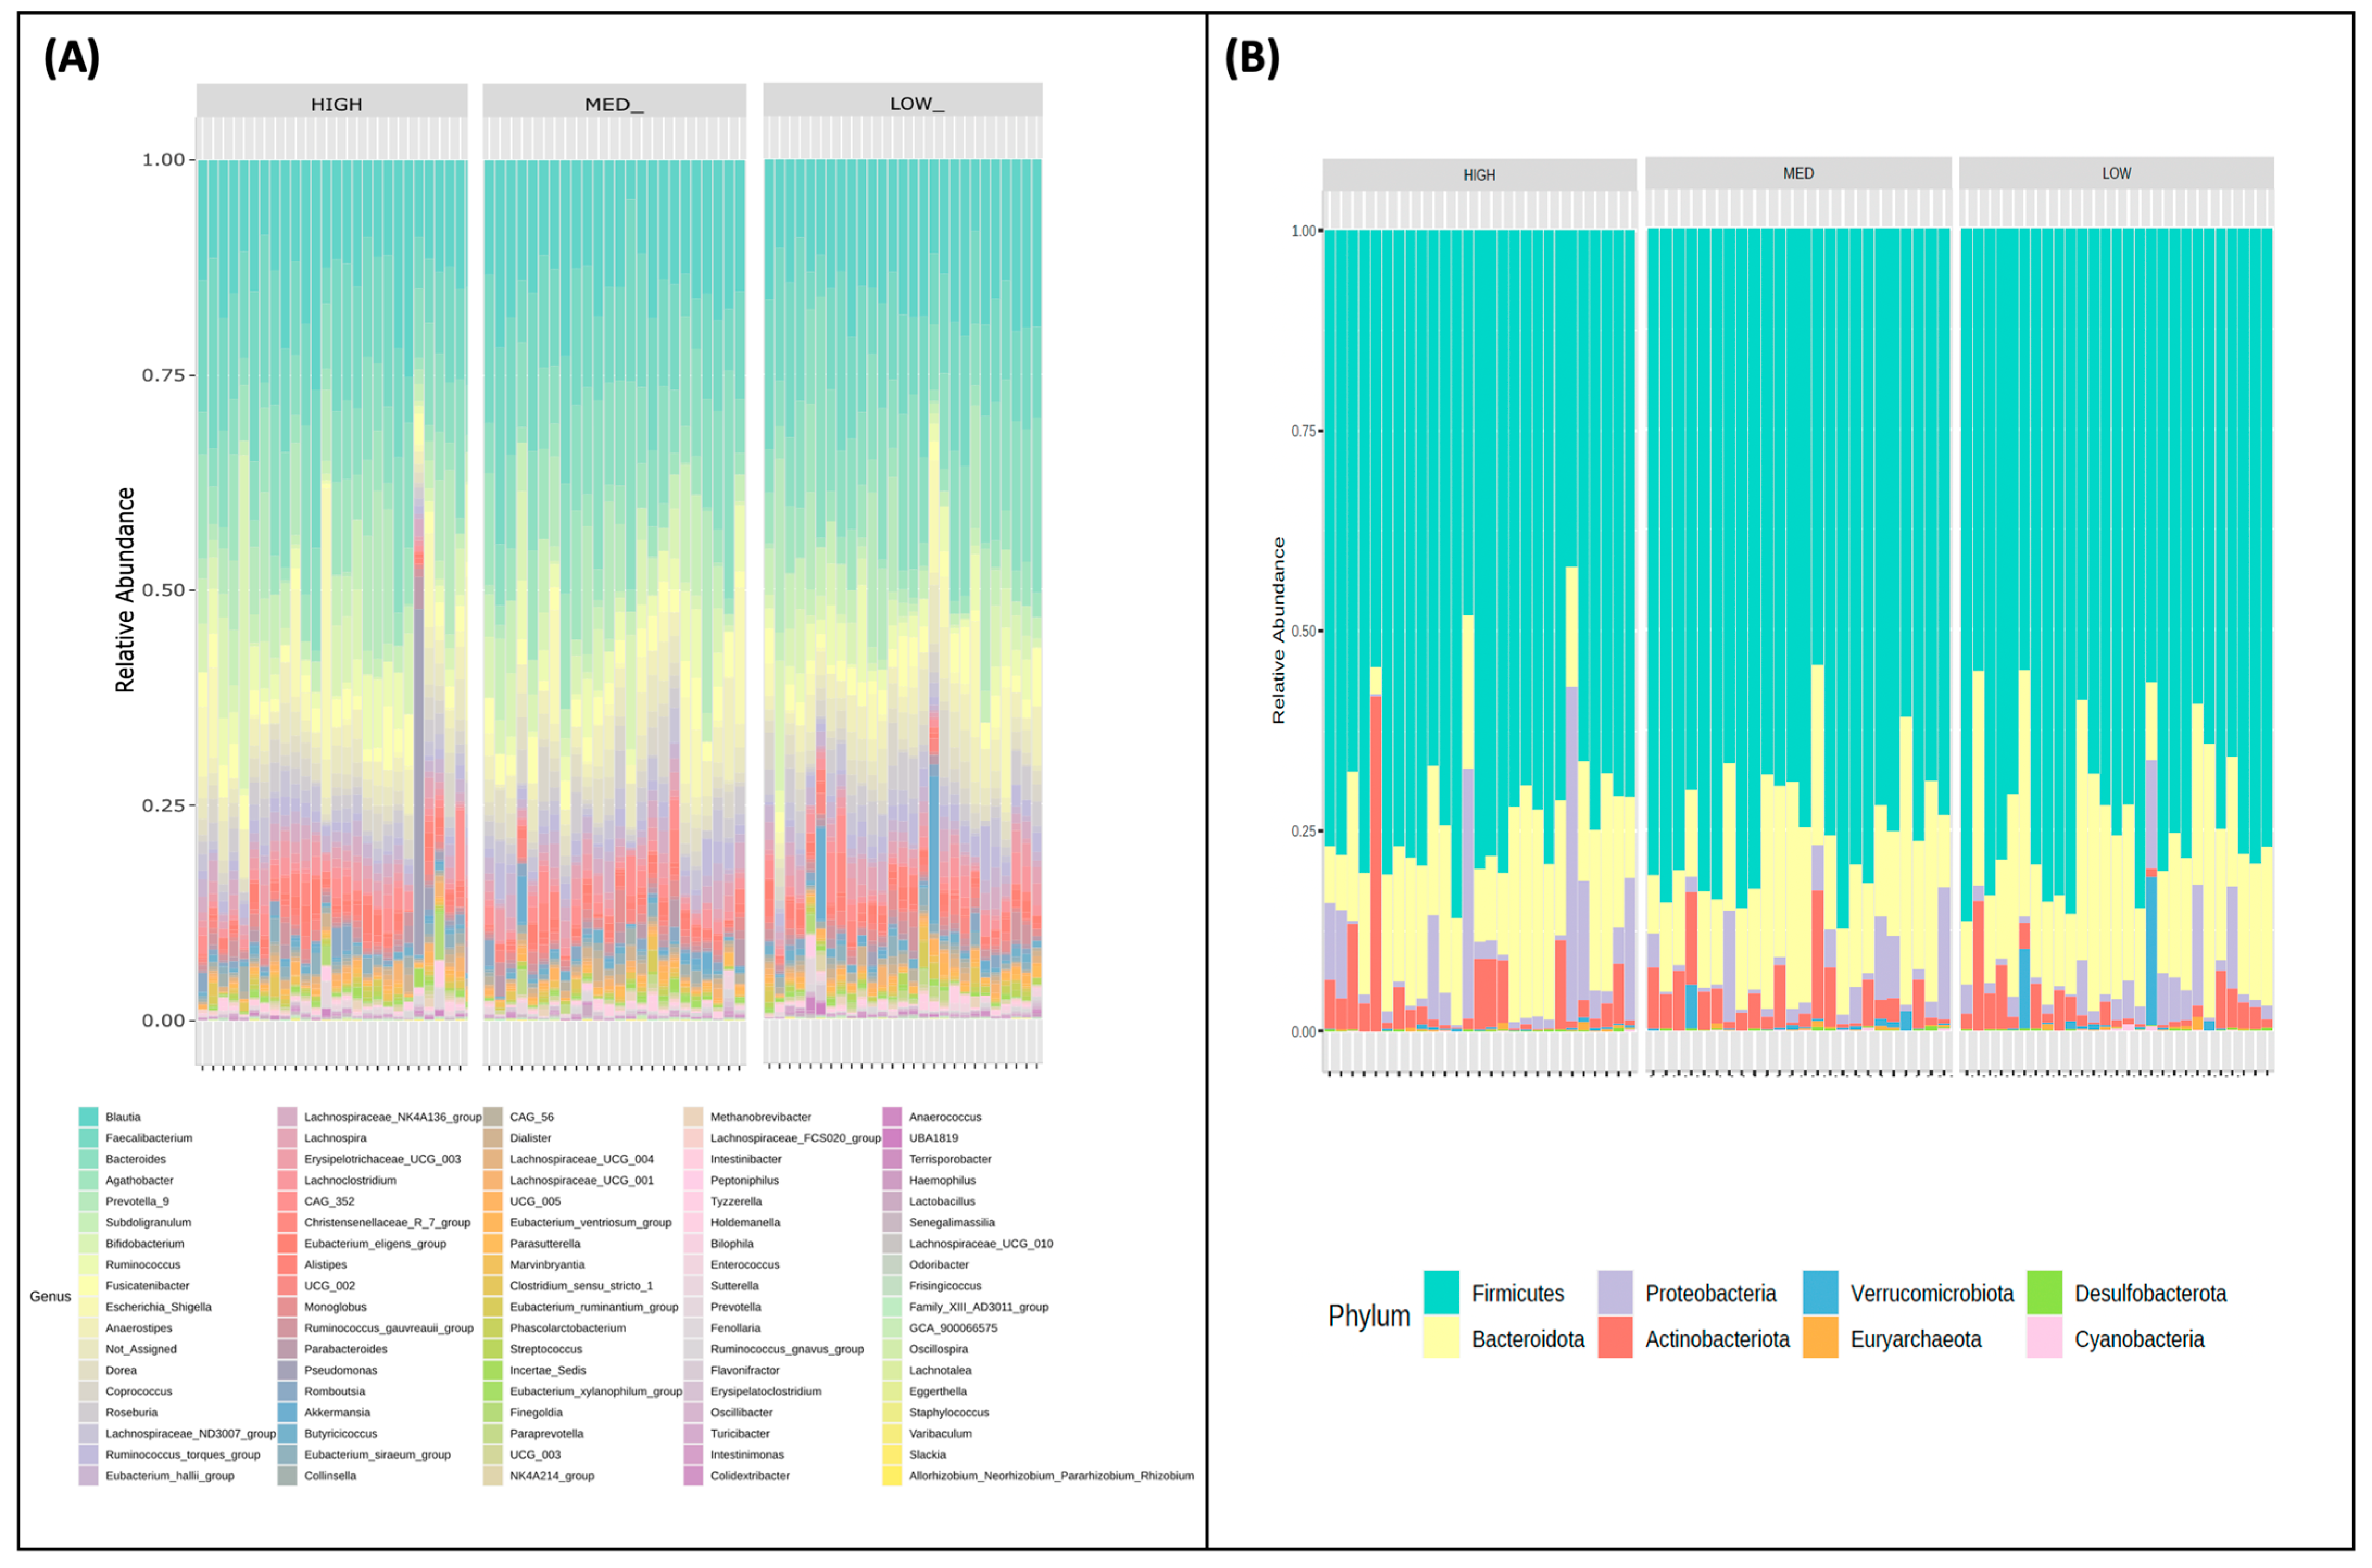
3.2. Microbial Community Profiling Stratified by Estimated Dietary Polyphenol Consumption Categories

Relative genus (Figure 2A) and phylum-level (Figure 2B) abundance for each participant is described and stratified by exposure categories. All groups were characterized by the Firmicutes being the dominant phyla, followed by Bacteroidota, Actinobacteria, and Proteobacteria with no significant differences between groups. There also appear to be two outliers in the high group with respect to Proteobacteria abundance.

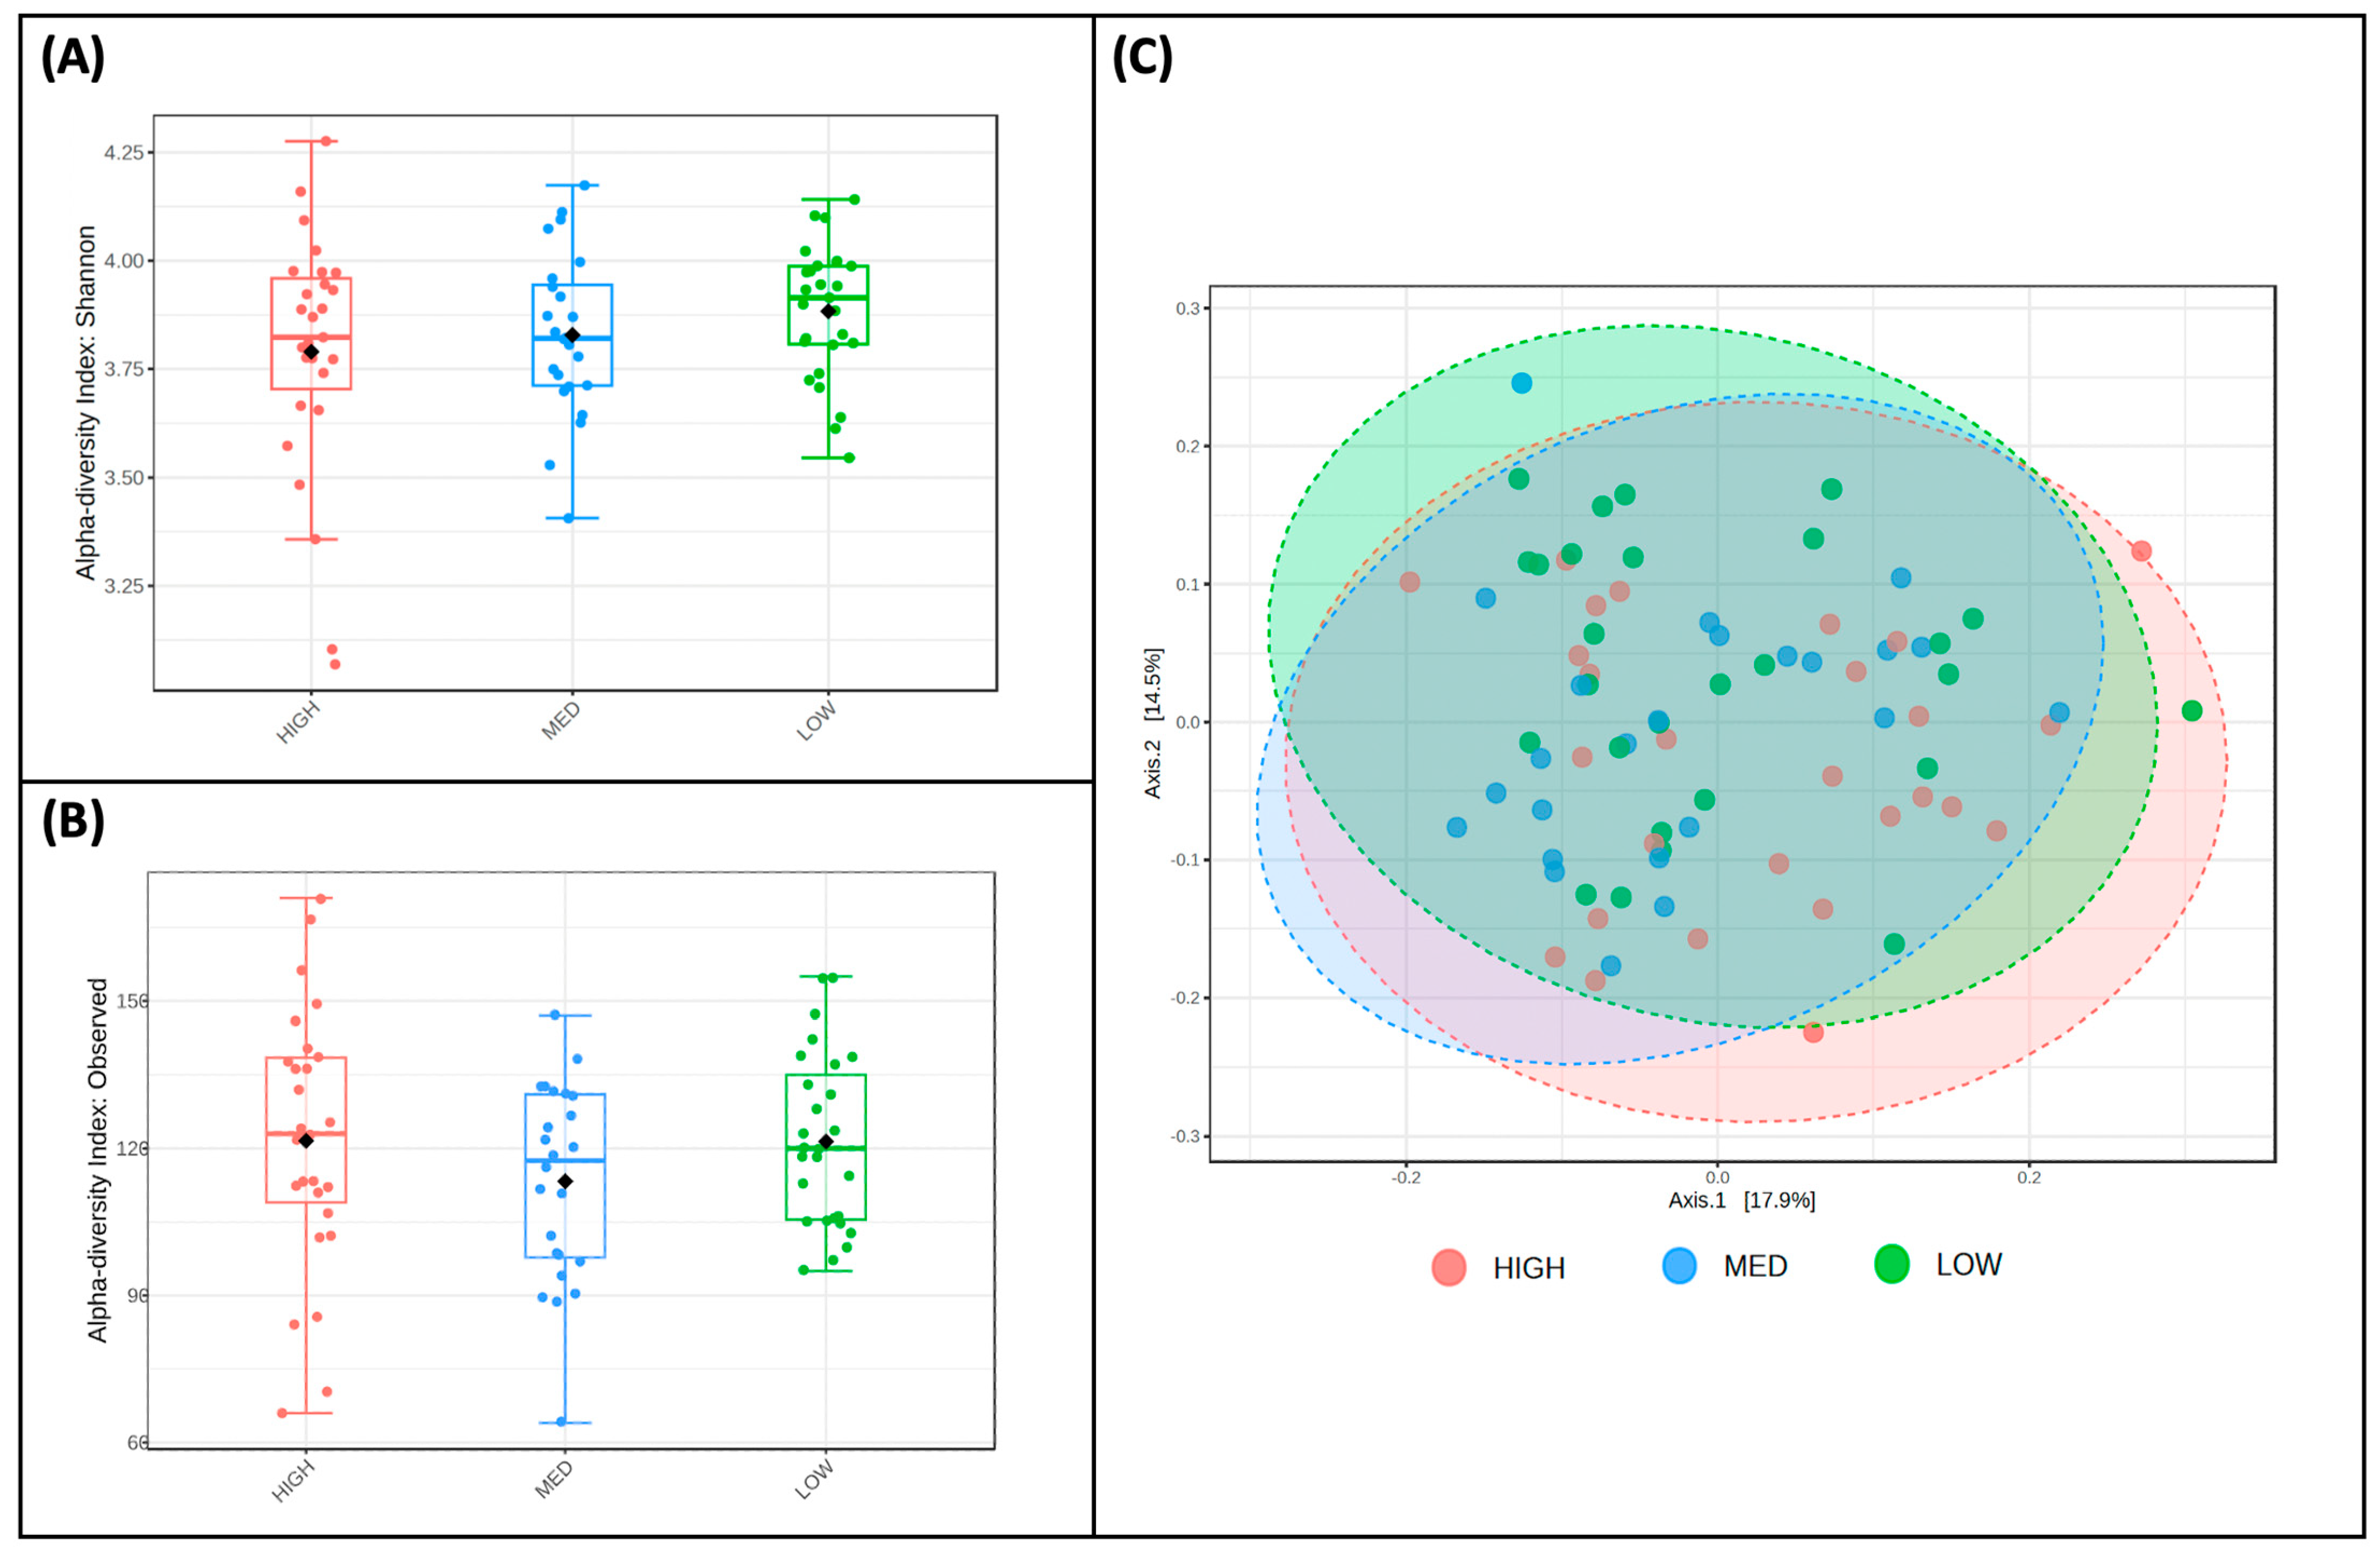
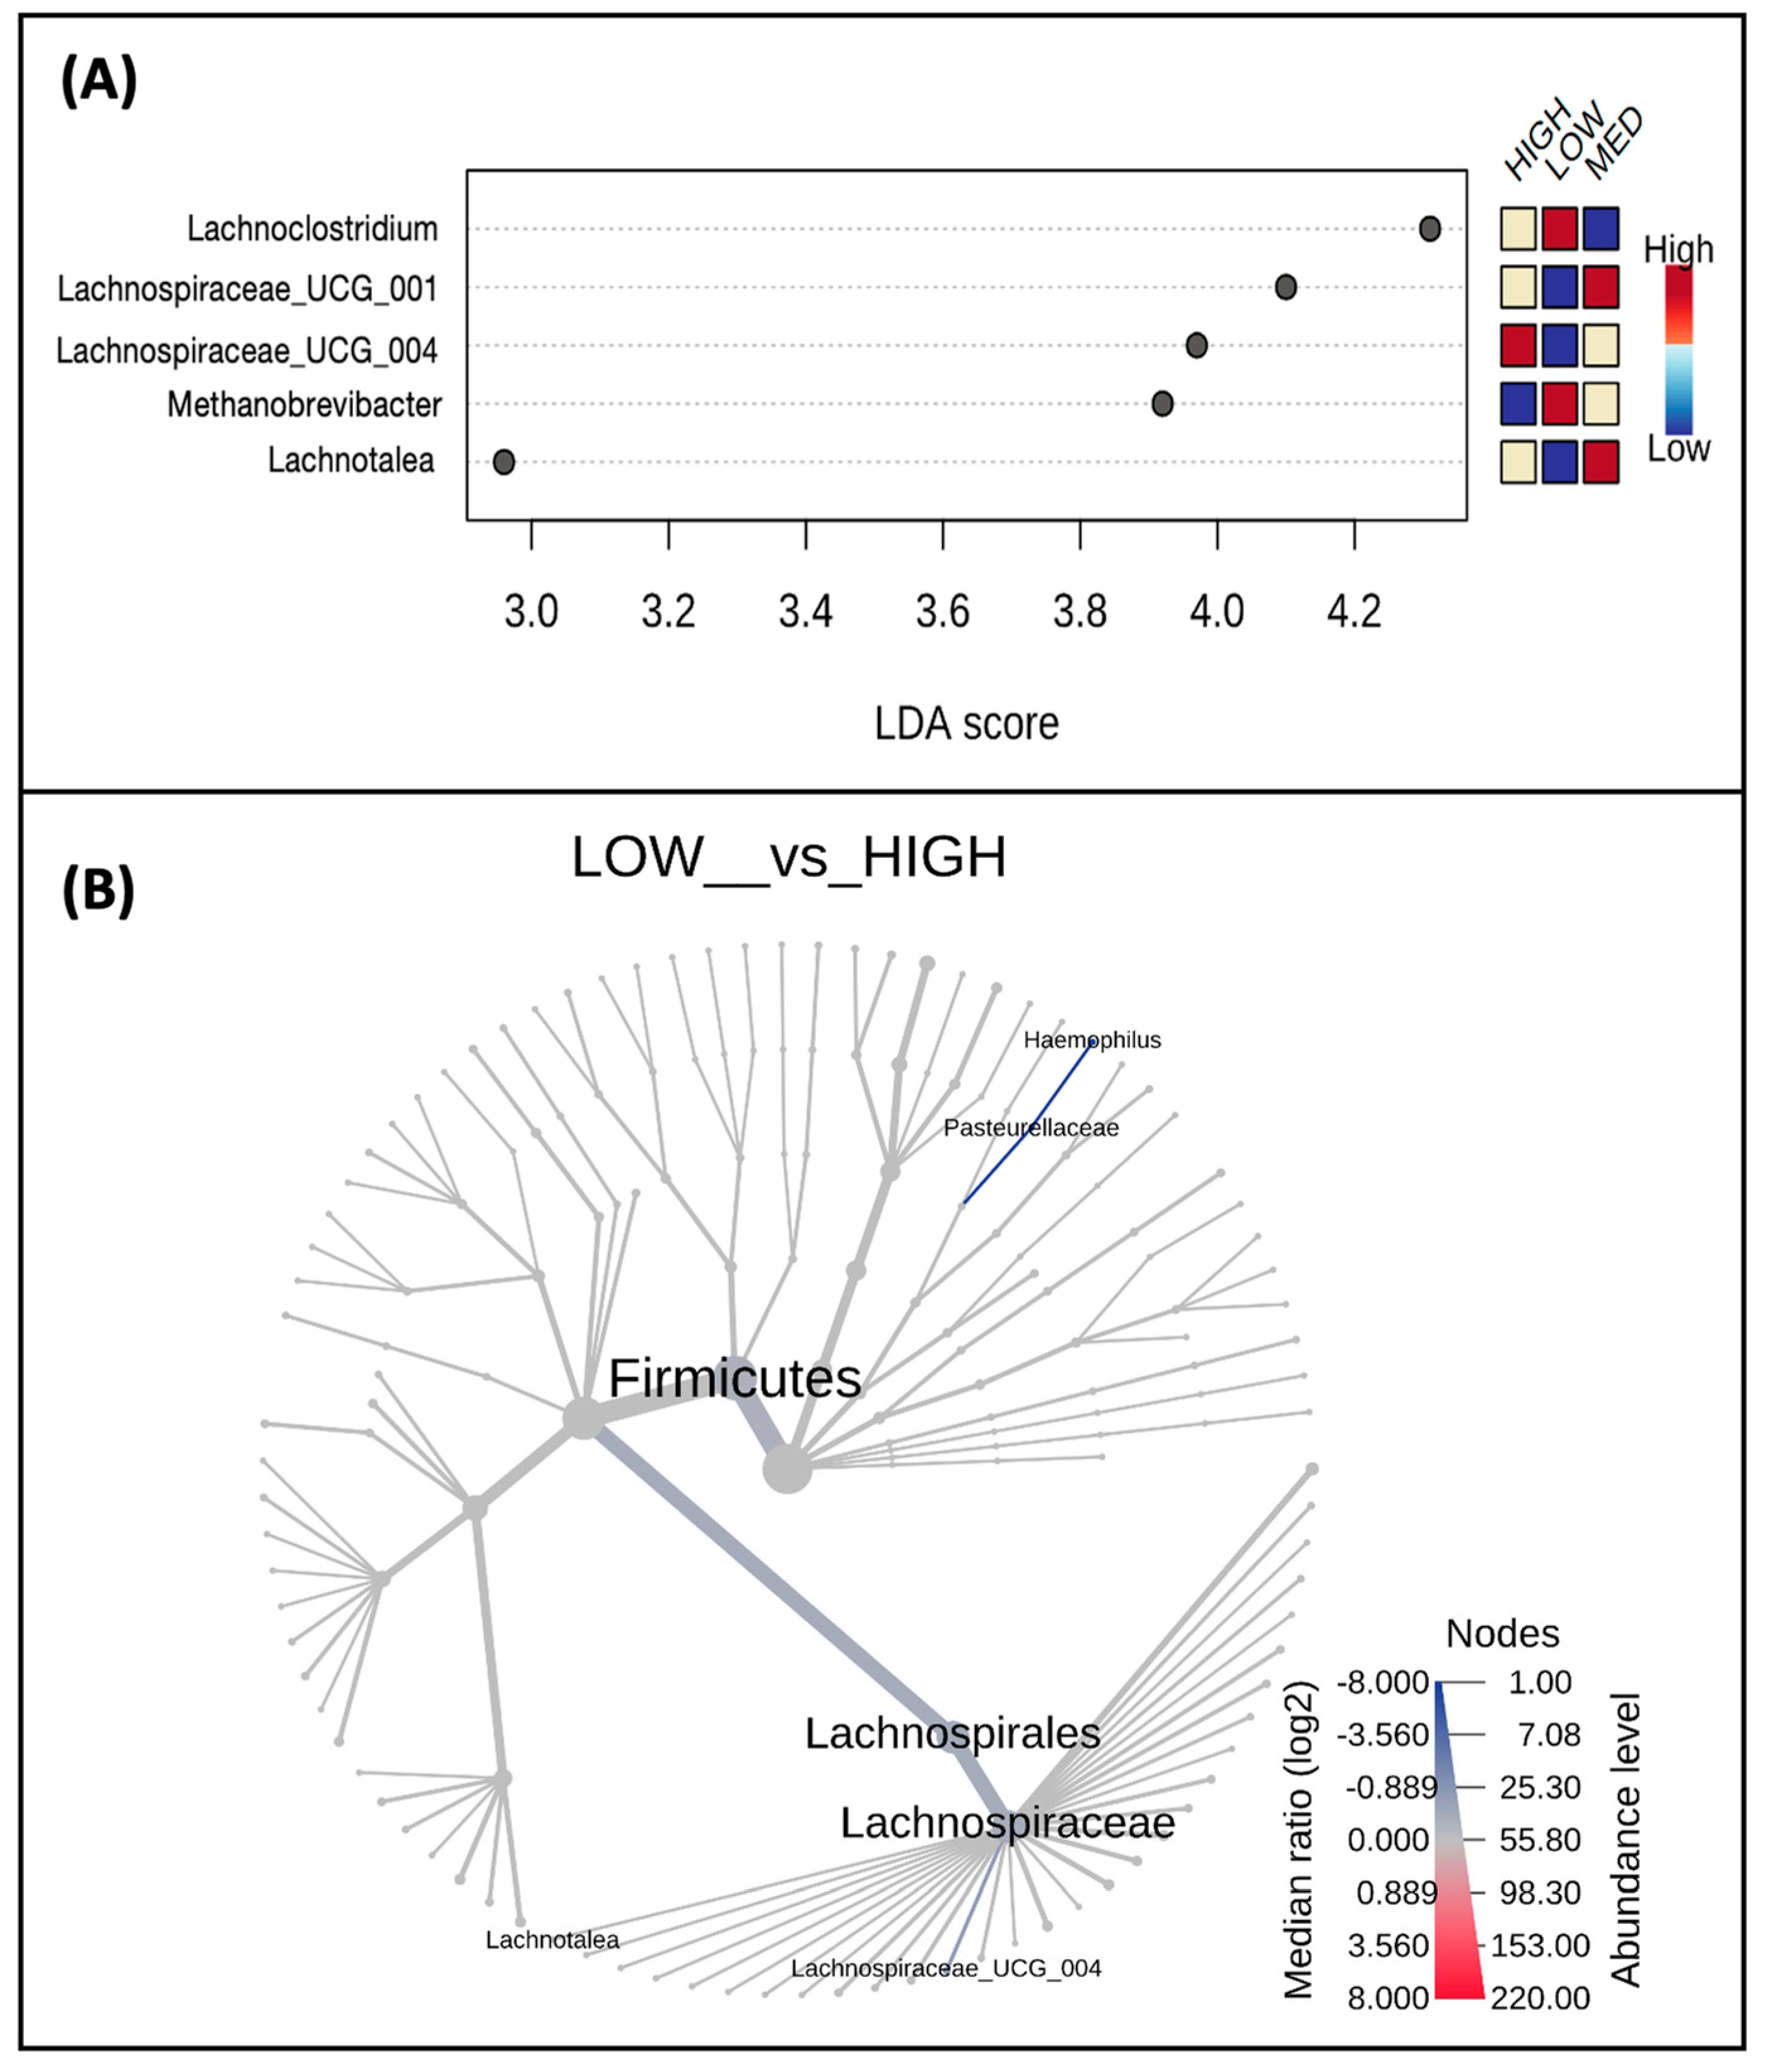
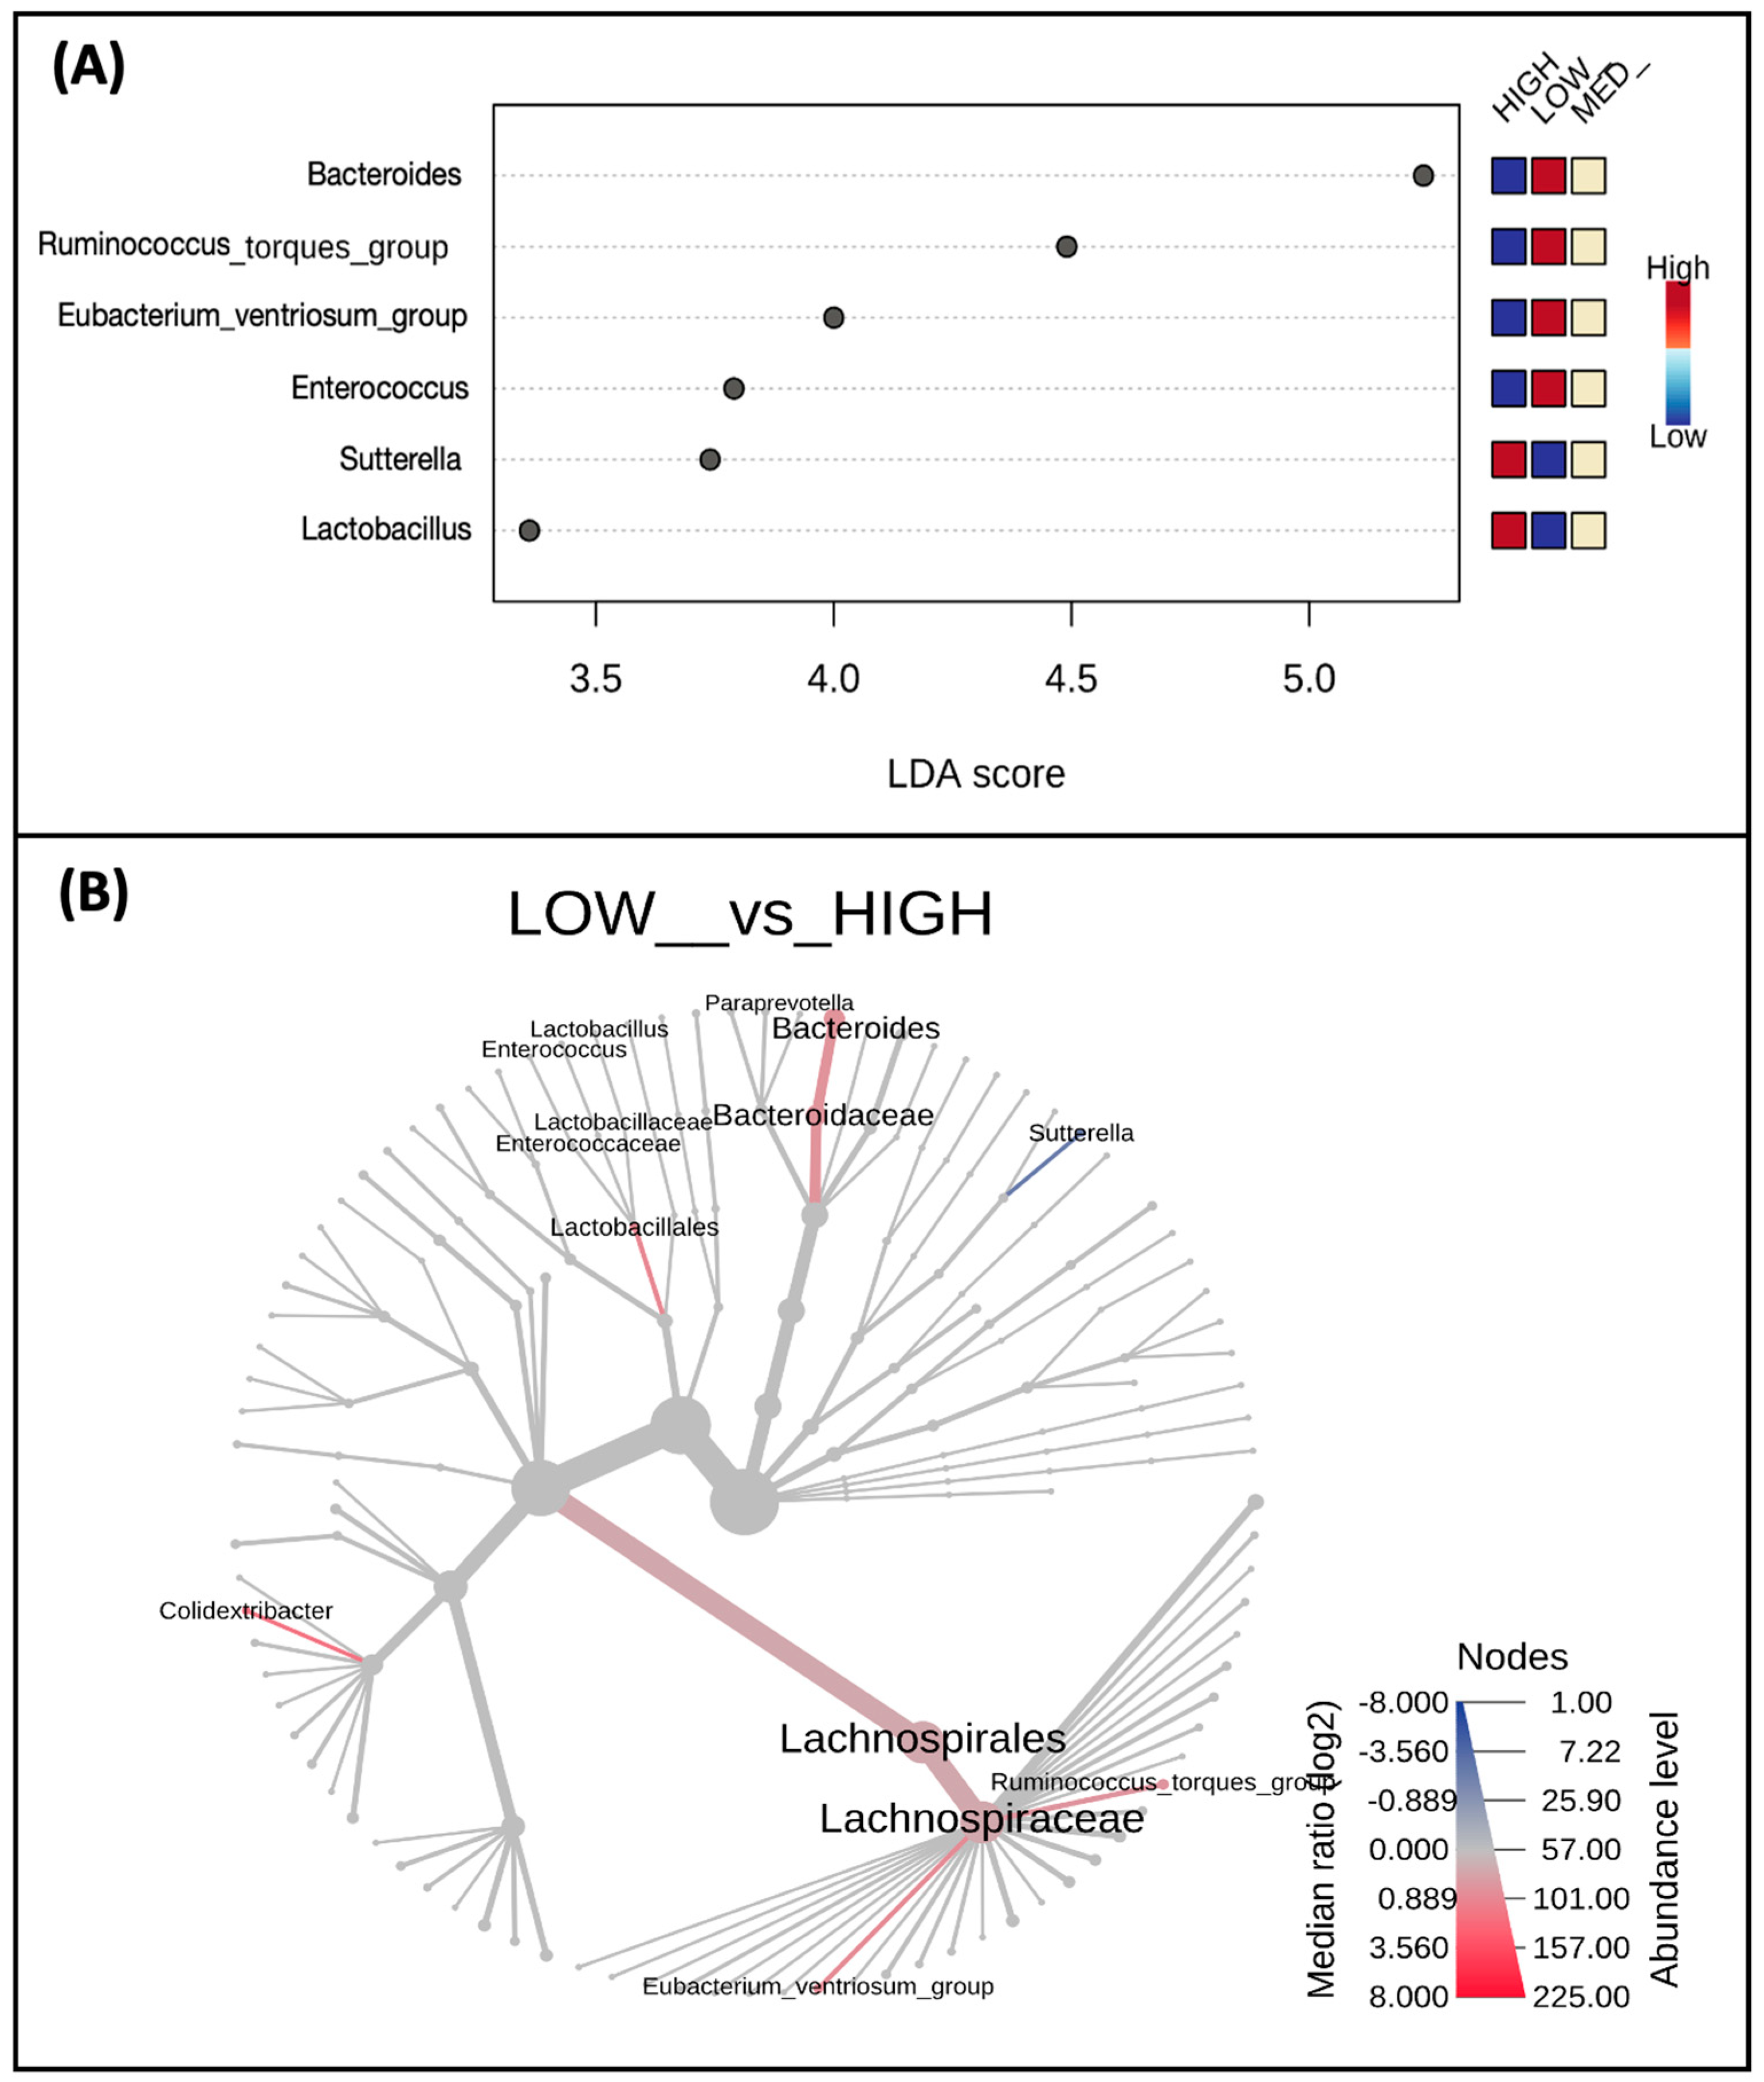
3.3. Microbial Taxa Abundance, but Not Diversity, Differs by Estimated Dietary Polyphenol Consumption Categories

Alpha (Figure 3A,B) and beta diversity (Figure 3C) measures were described for participants and stratified by exposure categories. The Shannon Index values, a measure of alpha diversity, did not differ between low (M = 3.88, SD = 0.15), medium (M = 3.82, SD = 0.19), and high (M = 3.79, SD = 0.28) consumers of dietary polyphenols in this sample (Figure 3A). Observed richness, another measure of alpha diversity, also did not differ between low (M = 121.41, SD = 17.54), medium (M = 113.29, SD = 20.09), and high (M = 121.56, SD = 26.56) consumers of dietary polyphenols in this sample (Figure 3B). Bray–Curtis dissimilarity distances were plotted using Principal Coordinate Analysis (PCoA) plotted Bray–Curtis dissimilarity metrics of low, medium, and high consumers of dietary polyphenols (Figure 3C); PERMANOVA using these metrics revealed no differences in the beta diversity of microbial communities between these groups.
When examining differences in taxa abundance at the genus level between low, medium, and high consumers of dietary polyphenols (Figure 4A), the abundance of Lactobacillus (p-value = 0.007) and Sutterella (p-value = 0.064) was highest in the high-consumer group and lowest in the low-consumer group. Conversely, the abundance of Eubacterium ventriosum group (p-value = 0.014), Ruminococcus torques group (p-value = 0.038), Bacteroides (p-value = 0.052), and Enterococcus (p-value = 0.057) in the low-consumer group and lowest in the high-consumer group (Figure 4A). A phylogenetic heat tree comparing abundances between the low versus high consumer groups, including differential abundances analyzed by Wilcoxon Rank Sum, are also represented (Figure 4B).

3.4. Microbial Taxa Abundance, but Not Diversity, Differs by the Frequency of Polyphenol-Weighted Culinary Herb and Spice Use

Alpha and beta diversity measures were for participants and stratified by exposure categories. The Shannon Index values, a measure of alpha diversity, did not differ between low-frequency (M = 3.79, SD = 0.26), medium-frequency (M = 3.82, SD = 0.22), and high-frequency (M = 3.86, SD = 0.20) users of polyphenol-containing herbs and spices (Figure 5A). Observed richness, another measure of alpha diversity, also did not differ between low (M = 118.04, SD = 23.32), medium (M = 118.57, SD = 20.54), and high (M = 116.11, SD = 19.98) consumers of dietary polyphenols in this sample (Figure 5B). Principal Coordinate Analysis (PCoA) plotted Bray–Curtis dissimilarity metrics of low-, medium-, and high-frequency users of polyphenol-containing herbs and spices (Figure 5C); PERMANOVA using these metrics revealed no differences in the beta diversity of microbial communities between these groups.
When exploring differences in taxa abundance at the genus level between low-, medium-, and high-frequency users of polyphenol-weighted herbs and spices (Figure 6A), Lachnospiraceae UCG 004 (p-value = 0.006), Lachnotalea (p-value = 0.037), and Lachnospiraceae UCG 001 (p-value = 0.085) had the lowest abundance in the low-frequency group. While Lachnospiraceae UCG 004 had the highest abundance in the high-frequency group, both Lachnotalea and Lachnospiraceae UCG 001 had the highest abundance in the medium-frequency group. Conversely, the abundance of Lachnoclostridium (p-value = 0.025) and Methanobrevibacter (p-value = 0.092) were highest in the low-frequency group; the abundance of these genera decreased as the frequency of use increased. A phylogenetic heat tree comparing abundances between the low- and high-frequency users, whose differential abundances were analyzed by Wilcoxon Rank Sum, is also represented (Figure 6B).

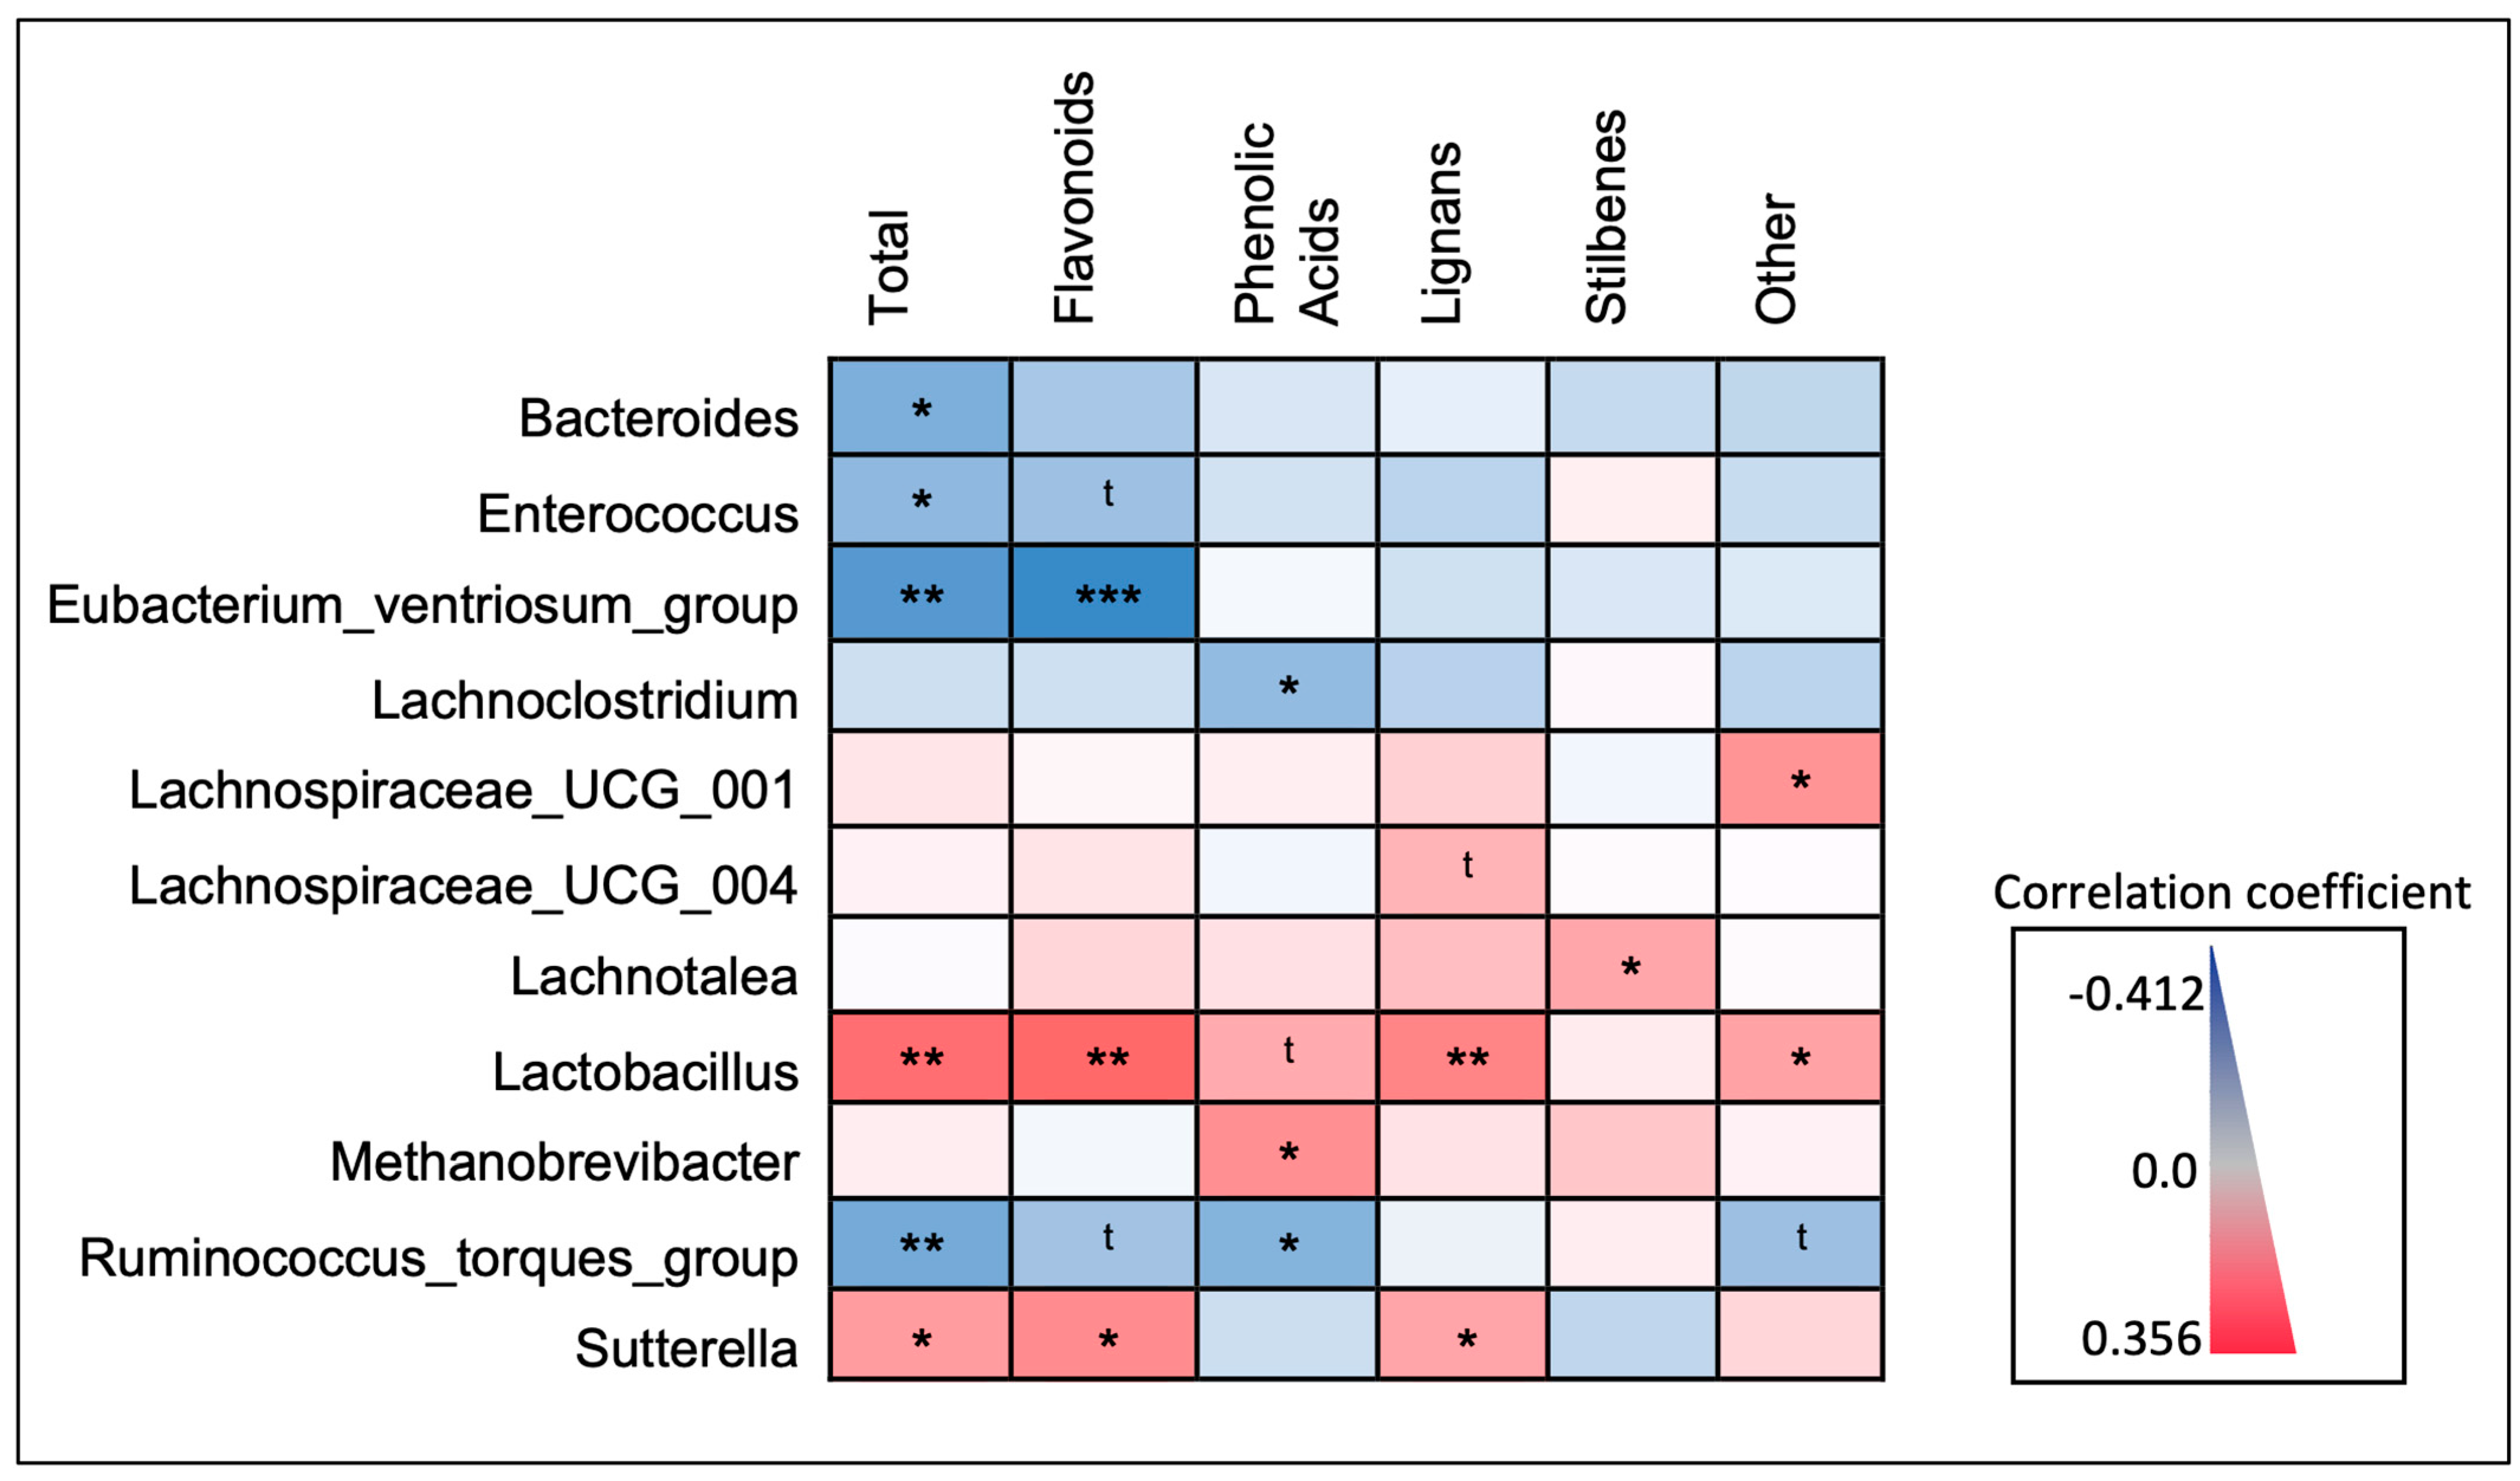
3.5. Correlations between Microbiota and Different Polyphenol Classes

Relationships between microbial taxa and dietary polyphenols were further explored with Spearman’s rank correlations between relative abundance and the estimated daily consumption (mg/day) of the major classes of polyphenols (Figure 7). The directionality of relationships identified in the LEfSe model of participants stratified by total polyphenol consumption (Figure 4A) was mirrored with continuous total polyphenol consumption (mg/day), in addition to several of the major polyphenol classes (Figure 5). Both Lactobacillus (p-value = 0.002) and Sutterella (p-value = 0.031) abundance were significantly and positively correlated with estimated total daily polyphenol consumption. When looking at specific polyphenol classes, Lactobacillus abundance was significantly and positively correlated with daily consumption of flavonoids (p-value = 0.001) and lignans (p-value = 0.008). Similarly, the Sutterella abundance was also significantly and positively correlated with the estimated daily consumption of flavonoids (p-value = 0.013) and lignans (p-value = 0.046).
The abundance of Eubacterium ventriosum (p-value = 0.001), the Ruminococcus torques group (p-value = 0.009), Bacteroides (p-value = 0.014), and Enterococcus (p-value = 0.037) were all inversely correlated with total polyphenol consumption. In addition, the Eubacterium ventriosum group was also significantly and inversely correlated with the daily consumption of flavonoids (p-value = <0.001), and the abundance of the Ruminococcus torques group was significantly and inversely correlated with the daily consumption of phenolic acids (p-value = 0.024). Both Bacteroides and Enterococcus abundance did not display any significant correlations with specific polyphenol classes, although Enterococcus abundance displayed an inverse trending relationship (p-value < 0.1) with estimated daily flavonoid consumption.
Regarding taxa previously identified as significant in the LEfSe models of participants stratified by frequency of polyphenol-weighted herb and spice consumption (Figure 6A), some but not all relationships indicated in the LEfSe models were mirrored with consumption of the major polyphenol classes (Figure 7); none were significantly correlated with total polyphenol consumption. The abundance of Lachnospiraceae UCG-004, Lachnospiraceae UCG-001, and Lachnotalea was highest in either the high- or medium-frequency consumer categories. Lachnospiraceae UCG-001 was significantly and positively correlated with the estimated daily consumption of “other” polyphenols (p-value = 0.020) and Lachnotalea was significantly and positively correlated with the estimated daily consumption of stilbenes (p-value = 0.049). Lachnospiraceae UCG-004 displayed a positive trending relationship (p-value < 0.1) with estimated daily lignan consumption. The abundance of Lachnoclostridium and Methanobrevibacter was highest in the low-frequency consumer categories. While both Lachnoclostridium (p-value = 0.049) and Methanobrevibacter (p-value = 0.015) abundance was significantly correlated with phenolic acid consumption, Lachnoclostridium displayed a negative correlation while Methanobrevibacter displayed a positive correlation. A full correlation matrix with correlation coefficients, 95% CI’s, and p-values is available in Supplementary Materials (Table S2).

4. Discussion

This study aimed to explore relationships between gut microbial measures and habitual dietary polyphenol consumption in a sample of healthy adults. Although primarily examining estimated dietary polyphenol consumption in the context of food and beverage sources, we secondarily sought to explore relationships between the frequency of polyphenol-weighted herb and spice consumption and gut microbial measures as well. In the case of both exposures, differential trends in microbial taxa abundance but not alpha or beta diversity measures were observed between low-, medium-, and high-exposure groups, while the literature regarding the effect of dietary polyphenol consumption on gut microbial diversity is conflicting and may be polyphenol and/or metabolite specific [43,44,45].

4.1. Microbiota Observed to Be Positively Correlated with Dietary Polyphenols

Previous studies examining changes in microbial taxa abundance in response to polyphenol-based interventions are not consistent, and an increase or decrease in abundance of specific taxa appears to differ with dietary source and/or dose of polyphenol, as well as pathophysiological state (e.g., healthy vs. specific disease state). However, the relationship between estimated dietary polyphenol consumption and the abundance of several microbial taxa observed in this study reflects the findings of some existing literature. For example, we observed that individuals with higher estimated total polyphenol, flavonoid, and lignan consumption also had a higher abundance of Lactobacillus and Sutterella. This trend was previously described for both taxa in response to a flavonoid-enriched apple intervention in healthy adults [46]; for Sutterella abundance in response to lignan-rich interventions (e.g., flaxseed meal [47,48] and psyllium husk [49]; and for Lactobacillus abundance in response to other flavonoid-rich interventions [14,50]. There is previous evidence that flavonoids promote Lactobacillus growth [51], and several Lactobacillus spp., are capable of metabolizing both flavonoids and lignans [52,53]. It is important to note that other studies observed either no change in Lactobacillus abundance [54] or a decrease in Sutterella abundance [55].
The microbial taxa Lachnospiraceae UCG-004, Lachnospiraceae UCG-001, and Lachnotalea were identified as possible biomarkers of polyphenol-weighted herb and spice use, displaying the highest abundance in either the high- or medium-frequency user group. However, only Lachnospiraceae UCG-001 and Lachnotalea displayed a weak positive correlation with consumption of the other polyphenols and stilbenes, respectively. Little has been described regarding the effects of polyphenol intake on Lachnospiraceae UCG-001 and Lachnospiraceae UCG-004, except some in vitro and in vivo research [56,57], although polyphenol-based interventions in clinical trials have noted increases in other Lachnospiraceae [54,55,56]. Likewise, there is very limited research noting changes in Lachnotalea abundance [58,59] and Methanobrevibacter abundance [60,61] in response to polyphenol and/or herb and spice interventions.
Regarding their relevance in health and disease, little is known about the role of Lachnotalea, and while specific beneficial effects have not been widely described for Sutterella, its role as a commensal versus pathogenic bacteria may be species specific [62]. However, several of these other taxa are known to facilitate the regulation of immune, cardiometabolic, and intestinal barrier function-related processes through multiple mechanisms. Methanobrevibacter [63] may play a role in cardiovascular health through the depletion of trimethylamine (TMA), a precursor to the cardiovascular risk factor trimethylamine oxide (TMAO), for methanogenesis [64], and was inversely associated with obesity and BMI [65,66,67] and, separately, with serum TMAO levels [68].
Lactobacillus and Lachnospiraceae are producers of short-chain fatty acids (SCFA; [69,70]) and are involved in the transformation of bile acids [70,71], both of which are important immunoregulatory [72,73] and cardiometabolic signaling molecules [74,75]. These molecules regulate immune responses locally (i.e., at the intestinal mucosa) and systemically, subsequently supporting barrier integrity and anti-inflammatory activities [76,77], in addition to modulating both glucose [78,79] and lipid metabolism [76,80]. Lactobacillus also play a key role in maintaining intestinal health through several other mechanisms [81,82,83,84,85,86,87,88]. While Lactobacillus and Lachnospiraceae promote beneficial regulatory processes under homeostatic conditions, their overabundance has also been noted in certain systemic autoimmune diseases (e.g., rheumatoid arthritis, systemic lupus erythematosus, Primary Sjogren’s Syndrome [89,90,91]). Additionally, there are conflicting results regarding Lactobacillus overgrowth or depletion in cardiometabolic [92,93,94] and gastrointestinal conditions [92,95], which also may be disease specific.

4.2. Microbiota Observed to Be Inversely Correlated with Dietary Polyphenols

Some microbial taxa in this study displayed an inverse relationship with total estimated polyphenol consumption, including Eubacterium ventriosum group, Ruminococcus torques group, Bacteroides, and Enterococcus, and several previous studies corroborate these inverse relationships.
A dietary intervention using varying concentrations of fruit- and vegetable-derived flavonoids demonstrated an inverse relationship between flavonoid intake and Bacteroides abundance [96] and, separately, the use of other polyphenol-based interventions (e.g., red wine polyphenol [14], cranberry [12]) also noted decreases in Bacteroides abundance. Red wine is rich in flavonoids [1,39], and interestingly, the study that observed a decrease in Bacteroides abundance in response to a red wine polyphenol intervention also noted increases in Lactobacillus [14]; this trend was also observed in our own study. However, Bacteroides abundance was also observed to increase in response to certain polyphenol-based interventions [97,98]. Additionally, while several in vivo and in vitro studies using mixed [99] or flavonoid-rich [50] interventions noted decreases in Enterococcus [100,101,102], studies in human populations observed increases in Enterococcus abundance in conjunction with increases in Lactobacillus. These differences may be influenced by the type of polyphenol used, as some Bacteroides spp. and Enterococcus spp. are capable of metabolizing certain types of flavonoids [103].
Both Ruminococcus torques and Eubacterium ventriosum groups were not only inversely correlated with estimated total polyphenols, but also phenolic acid consumption and flavonoid consumption, respectively. For the Ruminococcus torques group, the inverse relationship with phenolic acid consumption and inverse trend with the consumption of flavonoids and “other” polyphenols are reflected in clinical and in vivo studies that use flavonoid-based [104,105], phenolic acid-based [106], and fermented vegetable juice [107] interventions. While some Eubacterium spp. are capable of metabolizing certain flavonoids [103], it is unclear if this extends to the Eubacterium ventriosum group specifically. Finally, Lachnoclostridium, was inversely correlated with phenolic acid consumption. While we did not identify phenolic acid-specific responses in the existing literature, inverse relationships were observed between Lachnoclostridium and other polyphenols in vitro [51] and in vivo [108].
Many of these bacteria are involved in the production of clinically relevant immunoregulatory molecules, such as short-chain fatty acids (e.g., Lachnoclostridum, [69,109], Bacteroides [110], Eubacterium ventriosum [111]) and bile acids (e.g., BacteroidesEnterococcus [70,112]), and can play an important role in host nutrition availability [113]. However, several are also well-known opportunistic pathogens (e.g., Enterococcus spp. [114,115], Bacteroides spp. [116]) and/or contain qualities, such as the mucolytic activity of Ruminococcus torques group [117], which may have implications for gastrointestinal health and inflammation [118]. Additionally, several of these taxa (e.g., Ruminococcus torques group, Lachnoclostridium, Eubacterium ventriosum) have been implicated in the presence of cardiovascular disease risk factors for obesity [119], obesity [120], and associated anthropometrics (e.g., visceral fat, BMI [121,122]), with evidence also highlighting a role for Lachnoclostridum in the biosynthesis of trimethylamine (TMA), a precursor to the cardiovascular disease biomarker trimethylamine oxide (TMAO) [122]. There also appears to be a common thread with some of these taxa being abundant in various nephropathies, either being correlated with disease outcomes (e.g., Lachnoclostridium, Bacteroides and Ruminococcus torques group [123]) or their increased abundance observed in diseased individuals (e.g., Enterococcus, Eubacterium ventriosum group, and Lachnoclostridium [124]).

4.3. Strengths and Limitations

One notable strength is that, unlike many other studies that have investigated the response of microbiota to polyphenol-based interventions, the present research investigated these relationships in habitual diet and incorporated habitual culinary herb and spice consumption. As these data were from a sample of generally healthy adults absent of certain physiological factors (e.g., cardiometabolic risk factors) that may be associated with shifts in gut microbiota, these relationships between microbiota and polyphenol consumption may be generalizable to the wider healthy US population. Additionally, this study also supports the validity of an innovative algorithm for calculating the estimated polyphenol consumption from VioScreen dietary analysis data. As many of the relationships observed in our Spearman’s rank correlations between microbial taxa and individual classes mirror findings from previous interventional and/or mechanistic studies, we can be confident in the estimations provided. It is worth noting that the observed mean polyphenol consumption in this sample also reflects average values of US adults (n = 9773), as reported in NHANES data from five surveys spanning 2007–2016 [125]. These observations support the sample’s dietary polyphenol consumption as being representative of the general population.
There are also several limitations of this study. This study is somewhat limited in addressing the contribution of polyphenols from culinary herb and spice sources, as the herb and spice questionnaire only provided data on the frequency of use, not on the quantity consumed. It is also important to note that certain factors that may be associated with gut microbiota (e.g., supplement usage, medication usage, smoking, alcohol consumption, biological sex) were not included in statistical analyses, as the subgroups of these factors were of vastly unequal sample sizes. Moreover, these data are from a relatively small sample of healthy adults in a specific geographical location. While the relationships observed in our Spearman’s rank correlations between microbial taxa and individual classes indicate that these results are may be generalizable to the larger population of healthy adults (i.e., several relationships mirror findings from previous interventional and/or mechanistic studies), growing this study to include a larger sample size and multiple geographical locations would aid in its generalizability and translatability.

5. Conclusions

  • In this study, we observed that microbial taxa, but not microbial diversity measures, differed by levels of daily polyphenol consumption from dietary and herb and spice sources in generally healthy US adults.
  • Our results suggest that higher quantities of habitual polyphenol consumption may support an intestinal environment where opportunistic and pathogenic bacteria are represented in a lower relative abundance compared to those with less potentially virulent qualities.
  • These findings, particularly correlations between microbiota and daily consumptions of specific polyphenol classes, may have implications for the development of precision polyphenolic interventions for microbiota targets, as well as dietary guidelines for polyphenolic intake.
  • Future directions of implementing this investigation on a larger scale across different geographical regions would help build a larger reference base for microbial biomarkers of polyphenol exposure in healthy US adults. This framework could be used to investigate the relationships between habitual polyphenol consumption and gut microbiota in specific disease populations to examine how these microbial biomarkers of polyphenol exposure may differ in individuals already experiencing specific pathologies or dysbiosis.

Supplementary Materials

The following supporting information can be downloaded at: https://www.mdpi.com/article/10.3390/nu16060773/s1, Table S1: Distribution of substance use history, cardiometabolic measures, age, and sex across all participants (All), as well as those stratified into Low, Medium (Med), and High polyphenol consumer groups; (n = population; % = percentage of n; M = mean; SD = standard deviation). Table S2: Full data for correlations between microbiota and polyphenol classes. Shown here are the Spearman’s rho (r) correlation coefficients, p-values, and 95% confidence intervals (CI) for correlations between microbiota and daily con-sumption (mg/kg dry weight) of total polyphenols and the major polyphenol classes.

Author Contributions

Conceptualization, A.A.V.; methodology, A.A.V., T.L.W., K.M.R. and Y.F.; software, A.A.V., K.M.R., Y.F. and A.G.; validation, R.B. and H.Z.; formal analysis, A.A.V., T.L.W. and K.M.R.; investigation, A.A.V., Y.F. and A.G.; resources, R.B. and A.G.; data curation, A.A.V., T.L.W., K.M.R. and A.G.; writing—original draft preparation, A.A.V.; writing—review and editing, A.A.V., R.B., H.Z., T.L.W. and K.M.R.; visualization, A.A.V.; supervision, T.L.W., R.B. and H.Z.; project administration, T.L.W., H.Z. and R.B.; funding acquisition, R.B. All authors have read and agreed to the published version of the manuscript.

Funding

This research was supported by the National Center for Complementary and Integrative Health (NCCIH) of the National Institutes of Health via grants 5R90AT008924 and 1K24AT011568.

Institutional Review Board Statement

The study was conducted in accordance with the Declaration of Helsinki and approved by the Institutional Review Board of the National University of Natural Medicine (IRB #: RB091218l). The approval date is 13 September 2018.

Informed Consent Statement

Informed consent was obtained from all subjects involved in the study.

Data Availability Statement

The data presented in this study are available within this article.

Acknowledgments

All research investigators who were involved in facilitating the INCLD Health cohort study.

Conflicts of Interest

The authors declare no conflicts of interest. The funders had no role in the design of the study; in the collection, analyses, or interpretation of data; in the writing of the manuscript; or in the decision to publish the results.

References

  1. Neveu, V.; Perez-Jiménez, J.; Vos, F.; Crespy, V.; du Chaffaut, L.; Mennen, L.; Knox, C.; Eisner, R.; Cruz, J.; Wishart, D.; et al. Phenol-Explorer: An Online Comprehensive Database on Polyphenol Contents in Foods. Database 2010, 2010, bap024. [Google Scholar] [CrossRef]
  2. Fraga, C.G.; Croft, K.D.; Kennedy, D.O.; Tomás-Barberán, F.A. The Effects of Polyphenols and Other Bioactives on Human Health. Food Funct. 2019, 10, 514–528. [Google Scholar] [CrossRef]
  3. Kim, H.-S.; Quon, M.J.; Kim, J. New Insights into the Mechanisms of Polyphenols beyond Antioxidant Properties; Lessons from the Green Tea Polyphenol, Epigallocatechin 3-Gallate. Redox Biol. 2014, 2, 187–195. [Google Scholar] [CrossRef]
  4. Fraga, C.G.; Oteiza, P.I.; Galleano, M. Plant Bioactives and Redox Signaling: (–)-Epicatechin as a Paradigm. Mol. Asp. Med. 2018, 61, 31–40. [Google Scholar] [CrossRef]
  5. Oteiza, P.I.; Fraga, C.G.; Mills, D.A.; Taft, D.H. Flavonoids and the Gastrointestinal Tract: Local and Systemic Effects. Mol. Asp. Med. 2018, 61, 41–49. [Google Scholar] [CrossRef]
  6. Yang, G.; Bibi, S.; Du, M.; Suzuki, T.; Zhu, M.-J. Regulation of the Intestinal Tight Junction by Natural Polyphenols: A Mechanistic Perspective. Crit. Rev. Food Sci. Nutr. 2017, 57, 3830–3839. [Google Scholar] [CrossRef]
  7. Catalkaya, G.; Venema, K.; Lucini, L.; Rocchetti, G.; Delmas, D.; Daglia, M.; De Filippis, A.; Xiao, H.; Quiles, J.L.; Xiao, J.; et al. Interaction of Dietary Polyphenols and Gut Microbiota: Microbial Metabolism of Polyphenols, Influence on the Gut Microbiota, and Implications on Host Health. Food Front. 2020, 1, 109–133. [Google Scholar] [CrossRef]
  8. Cheng, H.; Zhang, D.; Wu, J.; Liu, J.; Zhou, Y.; Tan, Y.; Feng, W.; Peng, C. Interactions between Gut Microbiota and Polyphenols: A Mechanistic and Metabolomic Review. Phytomedicine 2023, 119, 154979. [Google Scholar] [CrossRef]
  9. González-Sarrías, A.; Espín, J.C.; Tomás-Barberán, F.A. Non-Extractable Polyphenols Produce Gut Microbiota Metabolites That Persist in Circulation and Show Anti-Inflammatory and Free Radical-Scavenging Effects. Trends Food Sci. Technol. 2017, 69, 281–288. [Google Scholar] [CrossRef]
  10. Luca, S.V.; Macovei, I.; Bujor, A.; Miron, A.; Skalicka-Woźniak, K.; Aprotosoaie, A.C.; Trifan, A. Bioactivity of Dietary Polyphenols: The Role of Metabolites. Crit. Rev. Food Sci. Nutr. 2020, 60, 626–659. [Google Scholar] [CrossRef] [PubMed]
  11. Cardona, F.; Andrés-Lacueva, C.; Tulipani, S.; Tinahones, F.J.; Queipo-Ortuño, M.I. Benefits of Polyphenols on Gut Microbiota and Implications in Human Health. J. Nutr. Biochem. 2013, 24, 1415–1422. [Google Scholar] [CrossRef]
  12. Rodríguez-Morató, J.; Matthan, N.R.; Liu, J.; de la Torre, R.; Chen, C.-Y.O. Cranberries Attenuate Animal-Based Diet-Induced Changes in Microbiota Composition and Functionality: A Randomized Crossover Controlled Feeding Trial. J. Nutr. Biochem. 2018, 62, 76–86. [Google Scholar] [CrossRef]
  13. Peron, G.; Gargari, G.; Meroño, T.; Miñarro, A.; Lozano, E.V.; Escuder, P.C.; González-Domínguez, R.; Hidalgo-Liberona, N.; Del Bo, C.; Bernardi, S.; et al. Crosstalk among Intestinal Barrier, Gut Microbiota and Serum Metabolome after a Polyphenol-Rich Diet in Older Subjects with “Leaky Gut”: The MaPLE Trial. Clin. Nutr. 2021, 40, 5288–5297. [Google Scholar] [CrossRef] [PubMed]
  14. Moreno-Indias, I.; Sánchez-Alcoholado, L.; Pérez-Martínez, P.; Andrés-Lacueva, C.; Cardona, F.; Tinahones, F.; Queipo-Ortuño, M.I. Red Wine Polyphenols Modulate Fecal Microbiota and Reduce Markers of the Metabolic Syndrome in Obese Patients. Food Funct. 2016, 7, 1775–1787. [Google Scholar] [CrossRef]
  15. Bernardi, S.; Del Bo’, C.; Marino, M.; Gargari, G.; Cherubini, A.; Andrés-Lacueva, C.; Hidalgo-Liberona, N.; Peron, G.; González-Dominguez, R.; Kroon, P.; et al. Polyphenols and Intestinal Permeability: Rationale and Future Perspectives. J. Agric. Food Chem. 2020, 68, 1816–1829. [Google Scholar] [CrossRef] [PubMed]
  16. Del Bo’, C.; Bernardi, S.; Cherubini, A.; Porrini, M.; Gargari, G.; Hidalgo-Liberona, N.; González-Domínguez, R.; Zamora-Ros, R.; Peron, G.; Marino, M.; et al. A Polyphenol-Rich Dietary Pattern Improves Intestinal Permeability, Evaluated as Serum Zonulin Levels, in Older Subjects: The MaPLE Randomised Controlled Trial. Clin. Nutr. 2021, 40, 3006–3018. [Google Scholar] [CrossRef] [PubMed]
  17. Fraga, C.G.; Actis-Goretta, L.; Ottaviani, J.I.; Carrasquedo, F.; Lotito, S.B.; Lazarus, S.; Schmitz, H.H.; Keen, C.L. Regular Consumption of a Flavanol-Rich Chocolate Can Improve Oxidant Stress in Young Soccer Players. Clin. Dev. Immunol. 2005, 12, 11–17. [Google Scholar] [CrossRef]
  18. Bettaieb, A.; Cremonini, E.; Kang, H.; Kang, J.; Haj, F.G.; Oteiza, P.I. Anti-Inflammatory Actions of (−)-Epicatechin in the Adipose Tissue of Obese Mice. Int. J. Biochem. Cell Biol. 2016, 81, 383–392. [Google Scholar] [CrossRef]
  19. Allam, G.; Mahdi, E.A.; Alzahrani, A.M.; Abuelsaad, A.S. Ellagic Acid Alleviates Adjuvant Induced Arthritis by Modulation of Pro- and Anti-Inflammatory Cytokines. Cent. Eur. J. Immunol. 2016, 4, 339–349. [Google Scholar] [CrossRef]
  20. Hodges, J.K.; Zhu, J.; Yu, Z.; Vodovotz, Y.; Brock, G.; Sasaki, G.Y.; Dey, P.; Bruno, R.S. Intestinal-Level Anti-Inflammatory Bioactivities of Catechin-Rich Green Tea: Rationale, Design, and Methods of a Double-Blind, Randomized, Placebo-Controlled Crossover Trial in Metabolic Syndrome and Healthy Adults. Contemp. Clin. Trials Commun. 2020, 17, 100495. [Google Scholar] [CrossRef]
  21. Mastroiacovo, D.; Kwik-Uribe, C.; Grassi, D.; Necozione, S.; Raffaele, A.; Pistacchio, L.; Righetti, R.; Bocale, R.; Lechiara, M.C.; Marini, C.; et al. Cocoa Flavanol Consumption Improves Cognitive Function, Blood Pressure Control, and Metabolic Profile in Elderly Subjects: The Cocoa, Cognition, and Aging (CoCoA) Study—A Randomized Controlled Trial. Am. J. Clin. Nutr. 2015, 101, 538–548. [Google Scholar] [CrossRef] [PubMed]
  22. Kesse-Guyot, E.; Fezeu, L.; Andreeva, V.A.; Touvier, M.; Scalbert, A.; Hercberg, S.; Galan, P. Total and Specific Polyphenol Intakes in Midlife Are Associated with Cognitive Function Measured 13 Years Later3. J. Nutr. 2012, 142, 76–83. [Google Scholar] [CrossRef] [PubMed]
  23. Kennedy, D.O.; Wightman, E.L.; Reay, J.L.; Lietz, G.; Okello, E.J.; Wilde, A.; Haskell, C.F. Effects of Resveratrol on Cerebral Blood Flow Variables and Cognitive Performance in Humans: A Double-Blind, Placebo-Controlled, Crossover Investigation. Am. J. Clin. Nutr. 2010, 91, 1590–1597. [Google Scholar] [CrossRef]
  24. Huang, H.; Chen, G.; Liao, D.; Zhu, Y.; Xue, X. Effects of Berries Consumption on Cardiovascular Risk Factors: A Meta-Analysis with Trial Sequential Analysis of Randomized Controlled Trials. Sci. Rep. 2016, 6, 23625. [Google Scholar] [CrossRef] [PubMed]
  25. Lin, X.; Zhang, I.; Li, A.; Manson, J.E.; Sesso, H.D.; Wang, L.; Liu, S. Cocoa Flavanol Intake and Biomarkers for Cardiometabolic Health: A Systematic Review and Meta-Analysis of Randomized Controlled Trials. J. Nutr. 2016, 146, 2325–2333. [Google Scholar] [CrossRef] [PubMed]
  26. Antinozzi, M.; Giffi, M.; Sini, N.; Gallè, F.; Valeriani, F.; De Vito, C.; Liguori, G.; Romano Spica, V.; Cattaruzza, M.S. Cigarette Smoking and Human Gut Microbiota in Healthy Adults: A Systematic Review. Biomedicines 2022, 10, 510. [Google Scholar] [CrossRef] [PubMed]
  27. Bjørkhaug, S.T.; Aanes, H.; Neupane, S.P.; Bramness, J.G.; Malvik, S.; Henriksen, C.; Skar, V.; Medhus, A.W.; Valeur, J. Characterization of Gut Microbiota Composition and Functions in Patients with Chronic Alcohol Overconsumption. Gut Microbes 2019, 10, 663–675. [Google Scholar] [CrossRef]
  28. Nesci, A.; Carnuccio, C.; Ruggieri, V.; D’Alessandro, A.; Di Giorgio, A.; Santoro, L.; Gasbarrini, A.; Santoliquido, A.; Ponziani, F.R. Gut Microbiota and Cardiovascular Disease: Evidence on the Metabolic and Inflammatory Background of a Complex Relationship. Int. J. Mol. Sci. 2023, 24, 9087. [Google Scholar] [CrossRef]
  29. Tang, W.H.W.; Kitai, T.; Hazen, S.L. Gut Microbiota in Cardiovascular Health and Disease. Circ. Res. 2017, 120, 1183–1196. [Google Scholar] [CrossRef]
  30. Wegierska, A.E.; Charitos, I.A.; Topi, S.; Potenza, M.A.; Montagnani, M.; Santacroce, L. The Connection between Physical Exercise and Gut Microbiota: Implications for Competitive Sports Athletes. Sports Med. 2022, 52, 2355–2369. [Google Scholar] [CrossRef]
  31. Vita, A.A.; McClure, R.; Farris, Y.; Danczak, R.; Gundersen, A.; Zwickey, H.; Bradley, R. Associations between Frequency of Culinary Herb Use and Gut Microbiota. Nutrients 2022, 14, 1981. [Google Scholar] [CrossRef]
  32. Bradley, R.; Pickworth, C.K.; Wexler, R.S.; Sadowski, A.; Buttolph, L.; Sarrar, H.; Moehle, J.; Torrens, M.T.; Harnett, J.; McIntyre, E.; et al. Protocol for the International Cohort on Lifestyle Determinants of Health Study: A Longitudinal Investigation of Complementary and Integrative Health Utilization in Postsecondary Education Students. J. Altern. Complement. Med. 2021, 27, 184–191. [Google Scholar] [CrossRef]
  33. Weiss, R. VioScreen: A Web-Based Self-Administered Dietary Habits Questionnaire That Provides an Efficient and Thorough Assessment of Critical Dietary Information about a Patient or Research Subject. J. Obes. Weight. Loss Ther. 2013, s2. [Google Scholar] [CrossRef]
  34. Kristal, A.R.; Kolar, A.S.; Fisher, J.L.; Plascak, J.J.; Stumbo, P.J.; Weiss, R.; Paskett, E.D. Evaluation of Web-Based, Self-Administered, Graphical Food Frequency Questionnaire. J. Acad. Nutr. Diet. 2014, 114, 613–621. [Google Scholar] [CrossRef]
  35. Bolyen, E.; Rideout, J.R.; Dillon, M.R.; Bokulich, N.A.; Abnet, C.C.; Al-Ghalith, G.A.; Alexander, H.; Alm, E.J.; Arumugam, M.; Asnicar, F.; et al. Reproducible, Interactive, Scalable and Extensible Microbiome Data Science Using QIIME 2. Nat. Biotechnol. 2019, 37, 852–857. [Google Scholar] [CrossRef]
  36. Callahan, B.J.; McMurdie, P.J.; Rosen, M.J.; Han, A.W.; Johnson, A.J.A.; Holmes, S.P. DADA2: High-Resolution Sample Inference from Illumina Amplicon Data. Nat. Methods 2016, 13, 581–583. [Google Scholar] [CrossRef]
  37. Quast, C.; Pruesse, E.; Yilmaz, P.; Gerken, J.; Schweer, T.; Yarza, P.; Peplies, J.; Glöckner, F.O. The SILVA Ribosomal RNA Gene Database Project: Improved Data Processing and Web-Based Tools. Nucleic Acids Res. 2013, 41, D590–D596. [Google Scholar] [CrossRef]
  38. Dhariwal, A.; Chong, J.; Habib, S.; King, I.L.; Agellon, L.B.; Xia, J. MicrobiomeAnalyst: A Web-Based Tool for Comprehensive Statistical, Visual and Meta-Analysis of Microbiome Data. Nucleic Acids Res. 2017, 45, W180–W188. [Google Scholar] [CrossRef] [PubMed]
  39. Rothwell, J.A.; Perez-Jimenez, J.; Neveu, V.; Medina-Remón, A.; M’Hiri, N.; García-Lobato, P.; Manach, C.; Knox, C.; Eisner, R.; Wishart, D.S.; et al. Phenol-Explorer 3.0: A Major Update of the Phenol-Explorer Database to Incorporate Data on the Effects of Food Processing on Polyphenol Content. Database 2013, 2013, bat070. [Google Scholar] [CrossRef] [PubMed]
  40. Pérez-Jiménez, J.; Fezeu, L.; Touvier, M.; Arnault, N.; Manach, C.; Hercberg, S.; Galan, P.; Scalbert, A. Dietary Intake of 337 Polyphenols in French Adults. Am. J. Clin. Nutr. 2011, 93, 1220–1228. [Google Scholar] [CrossRef] [PubMed]
  41. Knaze, V.; Rothwell, J.A.; Zamora-Ros, R.; Moskal, A.; Kyrø, C.; Jakszyn, P.; Skeie, G.; Weiderpass, E.; Santucci de Magistris, M.; Agnoli, C.; et al. A New Food-Composition Database for 437 Polyphenols in 19,899 Raw and Prepared Foods Used to Estimate Polyphenol Intakes in Adults from 10 European Countries. Am. J. Clin. Nutr. 2018, 108, 517–524. [Google Scholar] [CrossRef] [PubMed]
  42. Zamora-Ros, R.; Knaze, V.; Rothwell, J.A.; Hémon, B.; Moskal, A.; Overvad, K.; Tjønneland, A.; Kyrø, C.; Fagherazzi, G.; Boutron-Ruault, M.-C.; et al. Dietary Polyphenol Intake in Europe: The European Prospective Investigation into Cancer and Nutrition (EPIC) Study. Eur. J. Nutr. 2016, 55, 1359–1375. [Google Scholar] [CrossRef] [PubMed]
  43. Mompeo, O.; Spector, T.D.; Matey Hernandez, M.; Le Roy, C.; Istas, G.; Le Sayec, M.; Mangino, M.; Jennings, A.; Rodriguez-Mateos, A.; Valdes, A.M.; et al. Consumption of Stilbenes and Flavonoids Is Linked to Reduced Risk of Obesity Independently of Fiber Intake. Nutrients 2020, 12, 1871. [Google Scholar] [CrossRef] [PubMed]
  44. Sweeney, M.; Burns, G.; Sturgeon, N.; Mears, K.; Stote, K.; Blanton, C. The Effects of Berry Polyphenols on the Gut Microbiota and Blood Pressure: A Systematic Review of Randomized Clinical Trials in Humans. Nutrients 2022, 14, 2263. [Google Scholar] [CrossRef] [PubMed]
  45. Li, Y.; Xu, Y.; Le Roy, C.; Hu, J.; Steves, C.J.; Bell, J.T.; Spector, T.D.; Gibson, R.; Menni, C.; Rodriguez-Mateos, A. Interplay between the (Poly)Phenol Metabolome, Gut Microbiome, and Cardiovascular Health in Women: A Cross-Sectional Study from the TwinsUK Cohort. Nutrients 2023, 15, 1900. [Google Scholar] [CrossRef] [PubMed]
  46. Barnett, M.P.G.; Young, W.; Armstrong, K.; Brewster, D.; Cooney, J.M.; Ellett, S.; Espley, R.V.; Laing, W.; Maclean, P.; McGhie, T.; et al. A Polyphenol Enriched Variety of Apple Alters Circulating Immune Cell Gene Expression and Faecal Microbiota Composition in Healthy Adults: A Randomized Controlled Trial. Nutrients 2021, 13, 1092. [Google Scholar] [CrossRef] [PubMed]
  47. Power, K.A.; Lepp, D.; Zarepoor, L.; Monk, J.M.; Wu, W.; Tsao, R.; Liu, R. Dietary Flaxseed Modulates the Colonic Microenvironment in Healthy C57Bl/6 Male Mice Which May Alter Susceptibility to Gut-Associated Diseases. J. Nutr. Biochem. 2016, 28, 61–69. [Google Scholar] [CrossRef]
  48. Almeida, K.V.; Resende, T.L.; Silva, L.H.P.; Dorich, C.D.; Pereira, A.B.D.; Soder, K.J.; Brito, A.F. Feeding Incremental Amounts of Ground Flaxseed: Effects on Diversity and Relative Abundance of Ruminal Microbiota and Enteric Methane Emissions in Lactating Dairy Cows. Transl. Anim. Sci. 2023, 7, txad050. [Google Scholar] [CrossRef]
  49. Jalanka, J.; Major, G.; Murray, K.; Singh, G.; Nowak, A.; Kurtz, C.; Silos-Santiago, I.; Johnston, J.; de Vos, W.; Spiller, R. The Effect of Psyllium Husk on Intestinal Microbiota in Constipated Patients and Healthy Controls. Int. J. Mol. Sci. 2019, 20, 433. [Google Scholar] [CrossRef]
  50. Clavel, T.; Fallani, M.; Lepage, P.; Levenez, F.; Mathey, J.; Rochet, V.; Sérézat, M.; Sutren, M.; Henderson, G.; Bennetau-Pelissero, C.; et al. Isoflavones and Functional Foods Alter the Dominant Intestinal Microbiota in Postmenopausal Women. J. Nutr. 2005, 135, 2786–2792. [Google Scholar] [CrossRef]
  51. Pan, L.; Ye, H.; Pi, X.; Liu, W.; Wang, Z.; Zhang, Y.; Zheng, J. Effects of Several Flavonoids on Human Gut Microbiota and Its Metabolism by in Vitro Simulated Fermentation. Front. Microbiol. 2023, 14, 1092729. [Google Scholar] [CrossRef]
  52. Ruiz de la Bastida, A.; Peirotén, Á.; Langa, S.; Álvarez, I.; Arqués, J.L.; Landete, J.M. Metabolism of Flavonoids and Lignans by Lactobacilli and Bifidobacteria Strains Improves the Nutritional Properties of Flaxseed-Enriched Beverages. Food Res. Int. 2021, 147, 110488. [Google Scholar] [CrossRef]
  53. Bravo, D.; Peirotén, Á.; Álvarez, I.; Landete, J.M. Phytoestrogen Metabolism by Lactic Acid Bacteria: Enterolignan Production by Lactobacillus Salivarius and Lactobacillus Gasseri Strains. J. Funct. Foods 2017, 37, 373–378. [Google Scholar] [CrossRef]
  54. Vetrani, C.; Maukonen, J.; Bozzetto, L.; Della Pepa, G.; Vitale, M.; Costabile, G.; Riccardi, G.; Rivellese, A.A.; Saarela, M.; Annuzzi, G. Diets Naturally Rich in Polyphenols and/or Long-Chain n-3 Polyunsaturated Fatty Acids Differently Affect Microbiota Composition in High-Cardiometabolic-Risk Individuals. Acta Diabetol. 2020, 57, 853–860. [Google Scholar] [CrossRef] [PubMed]
  55. Ezzat-Zadeh, Z.; Henning, S.M.; Yang, J.; Woo, S.L.; Lee, R.-P.; Huang, J.; Thames, G.; Gilbuena, I.; Tseng, C.-H.; Heber, D.; et al. California Strawberry Consumption Increased the Abundance of Gut Microorganisms Related to Lean Body Weight, Health and Longevity in Healthy Subjects. Nutr. Res. 2021, 85, 60–70. [Google Scholar] [CrossRef]
  56. Liu, Z.; Deng, N.; Luo, S.; Liu, C.; Hu, X. Fermentation of Resistant Starch from the Starch-Ferulic Acid Inclusion Complex Compared with High-Amylose Corn Starch. Int. J. Biol. Macromol. 2023, 246, 125647. [Google Scholar] [CrossRef]
  57. Koh, Y.; Lee, P.; Kuo, Y.; Nagabhushanam, K.; Ho, C.; Pan, M. Dietary Pterostilbene and Resveratrol Modulate the Gut Microbiota Influenced by Circadian Rhythm Dysregulation. Mol. Nutr. Food Res. 2021, 65, 2100434. [Google Scholar] [CrossRef]
  58. Peterson, C.T.; Rodionov, D.A.; Iablokov, S.N.; Pung, M.A.; Chopra, D.; Mills, P.J.; Peterson, S.N. Prebiotic Potential of Culinary Spices Used to Support Digestion and Bioabsorption. Evid.-Based Complement. Altern. Med. 2019, 2019, 8973704. [Google Scholar] [CrossRef]
  59. Lu, Y.; Gao, X.; Mohammed, S.A.D.; Wang, T.; Fu, J.; Wang, Y.; Nan, Y.; Lu, F.; Liu, S. Efficacy and Mechanism Study of Baichanting Compound, a Combination of Acanthopanax Senticosus (Rupr. and Maxim.) Harms, Paeonia Lactiflora Pall and Uncaria Rhynchophylla (Miq.) Miq. Ex Havil, on Parkinson’s Disease Based on Metagenomics and Metabolomics. J. Ethnopharmacol. 2024, 319, 117182. [Google Scholar] [CrossRef] [PubMed]
  60. Ma, T.; Wu, W.; Tu, Y.; Zhang, N.; Diao, Q. Resveratrol Affects In Vitro Rumen Fermentation, Methane Production and Prokaryotic Community Composition in a Time- and Diet-specific Manner. Microb. Biotechnol. 2020, 13, 1118–1131. [Google Scholar] [CrossRef] [PubMed]
  61. González-Sarrías, A.; Romo-Vaquero, M.; García-Villalba, R.; Cortés-Martín, A.; Selma, M.V.; Espín, J.C. The Endotoxemia Marker Lipopolysaccharide-Binding Protein Is Reduced in Overweight-Obese Subjects Consuming Pomegranate Extract by Modulating the Gut Microbiota: A Randomized Clinical Trial. Mol. Nutr. Food Res. 2018, 62, e1800160. [Google Scholar] [CrossRef] [PubMed]
  62. Hiippala, K.; Kainulainen, V.; Kalliomäki, M.; Arkkila, P.; Satokari, R. Mucosal Prevalence and Interactions with the Epithelium Indicate Commensalism of Sutterella spp. Front. Microbiol. 2016, 7, 1706. [Google Scholar] [CrossRef] [PubMed]
  63. Camara, A.; Konate, S.; Tidjani Alou, M.; Kodio, A.; Togo, A.H.; Cortaredona, S.; Henrissat, B.; Thera, M.A.; Doumbo, O.K.; Raoult, D.; et al. Clinical Evidence of the Role of Methanobrevibacter Smithii in Severe Acute Malnutrition. Sci. Rep. 2021, 11, 5426. [Google Scholar] [CrossRef] [PubMed]
  64. Brugère, J.-F.; Borrel, G.; Gaci, N.; Tottey, W.; O’Toole, P.W.; Malpuech-Brugère, C. Archaebiotics. Gut Microbes 2014, 5, 5–10. [Google Scholar] [CrossRef] [PubMed]
  65. Million, M.; Angelakis, E.; Maraninchi, M.; Henry, M.; Giorgi, R.; Valero, R.; Vialettes, B.; Raoult, D. Correlation between Body Mass Index and Gut Concentrations of Lactobacillus reuteri, Bifidobacterium animalis, Methanobrevibacter smithii and Escherichia coli. Int. J. Obes. 2013, 37, 1460–1466. [Google Scholar] [CrossRef] [PubMed]
  66. Million, M.; Maraninchi, M.; Henry, M.; Armougom, F.; Richet, H.; Carrieri, P.; Valero, R.; Raccah, D.; Vialettes, B.; Raoult, D. Obesity-Associated Gut Microbiota Is Enriched in Lactobacillus reuteri and Depleted in Bifidobacterium animalis and Methanobrevibacter smithii. Int. J. Obes. 2012, 36, 817–825. [Google Scholar] [CrossRef]
  67. Crovesy, L.; Masterson, D.; Rosado, E.L. Profile of the Gut Microbiota of Adults with Obesity: A Systematic Review. Eur. J. Clin. Nutr. 2020, 74, 1251–1262. [Google Scholar] [CrossRef] [PubMed]
  68. Fu, B.C.; Hullar, M.A.; Randolph, T.W.; Franke, A.A.; Monroe, K.R.; Cheng, I.; Wilkens, L.R.; Shepherd, J.A.; Madeleine, M.M.; Le Marchand, L.; et al. Associations of Plasma Trimethylamine N-Oxide, Choline, Carnitine, and Betaine with Inflammatory and Cardiometabolic Risk Biomarkers and the Fecal Microbiome in the Multiethnic Cohort Adiposity Phenotype Study. Am. J. Clin. Nutr. 2020, 111, 1226–1234. [Google Scholar] [CrossRef]
  69. Verhoeven, J.; Keller, D.; Verbruggen, S.; Abboud, K.Y.; Venema, K. A Blend of 3 Mushrooms Dose-Dependently Increases Butyrate Production by the Gut Microbiota. Benef. Microbes 2021, 12, 601–612. [Google Scholar] [CrossRef]
  70. Song, Z.; Cai, Y.; Lao, X.; Wang, X.; Lin, X.; Cui, Y.; Kalavagunta, P.K.; Liao, J.; Jin, L.; Shang, J.; et al. Taxonomic Profiling and Populational Patterns of Bacterial Bile Salt Hydrolase (BSH) Genes Based on Worldwide Human Gut Microbiome. Microbiome 2019, 7, 9. [Google Scholar] [CrossRef]
  71. Lin, L.; Lai, Z.; Yang, H.; Zhang, J.; Qi, W.; Xie, F.; Mao, S. Genome-Centric Investigation of Bile Acid Metabolizing Microbiota of Dairy Cows and Associated Diet-Induced Functional Implications. ISME J. 2023, 17, 172–184. [Google Scholar] [CrossRef]
  72. Godlewska, U.; Bulanda, E.; Wypych, T.P. Bile Acids in Immunity: Bidirectional Mediators between the Host and the Microbiota. Front. Immunol. 2022, 13, 949033. [Google Scholar] [CrossRef]
  73. Li, M.; van Esch, B.C.A.M.; Wagenaar, G.T.M.; Garssen, J.; Folkerts, G.; Henricks, P.A.J. Pro- and Anti-Inflammatory Effects of Short Chain Fatty Acids on Immune and Endothelial Cells. Eur. J. Pharmacol. 2018, 831, 52–59. [Google Scholar] [CrossRef] [PubMed]
  74. Lymperopoulos, A.; Suster, M.S.; Borges, J.I. Short-Chain Fatty Acid Receptors and Cardiovascular Function. Int. J. Mol. Sci. 2022, 23, 3303. [Google Scholar] [CrossRef]
  75. Zhang, S.; Zhou, J.; Wu, W.; Zhu, Y.; Liu, X. The Role of Bile Acids in Cardiovascular Diseases: From Mechanisms to Clinical Implications. Aging Dis. 2022, 14, 261–282. [Google Scholar] [CrossRef] [PubMed]
  76. Choudhuri, S.; Klaassen, C.D. Molecular Regulation of Bile Acid Homeostasis. Drug Metab. Dispos. 2022, 50, 425–455. [Google Scholar] [CrossRef]
  77. Parada Venegas, D.; De la Fuente, M.K.; Landskron, G.; González, M.J.; Quera, R.; Dijkstra, G.; Harmsen, H.J.M.; Faber, K.N.; Hermoso, M.A. Short Chain Fatty Acids (SCFAs)-Mediated Gut Epithelial and Immune Regulation and Its Relevance for Inflammatory Bowel Diseases. Front. Immunol. 2019, 10, 277. [Google Scholar] [CrossRef] [PubMed]
  78. Shapiro, H.; Kolodziejczyk, A.A.; Halstuch, D.; Elinav, E. Bile Acids in Glucose Metabolism in Health and Disease. J. Exp. Med. 2018, 215, 383–396. [Google Scholar] [CrossRef] [PubMed]
  79. Oteng, A.-B.; Liu, L. GPCR-Mediated Effects of Fatty Acids and Bile Acids on Glucose Homeostasis. Front. Endocrinol. 2023, 14, 277. [Google Scholar] [CrossRef] [PubMed]
  80. He, J.; Zhang, P.; Shen, L.; Niu, L.; Tan, Y.; Chen, L.; Zhao, Y.; Bai, L.; Hao, X.; Li, X.; et al. Short-Chain Fatty Acids and Their Association with Signalling Pathways in Inflammation, Glucose and Lipid Metabolism. Int. J. Mol. Sci. 2020, 21, 6356. [Google Scholar] [CrossRef]
  81. Kikuchi, Y.; Kunitoh-Asari, A.; Hayakawa, K.; Imai, S.; Kasuya, K.; Abe, K.; Adachi, Y.; Fukudome, S.; Takahashi, Y.; Hachimura, S. Oral Administration of Lactobacillus Plantarum Strain AYA Enhances IgA Secretion and Provides Survival Protection against Influenza Virus Infection in Mice. PLoS ONE 2014, 9, e86416. [Google Scholar] [CrossRef]
  82. Sakai, F.; Hosoya, T.; Ono-Ohmachi, A.; Ukibe, K.; Ogawa, A.; Moriya, T.; Kadooka, Y.; Shiozaki, T.; Nakagawa, H.; Nakayama, Y.; et al. Lactobacillus Gasseri SBT2055 Induces TGF-β Expression in Dendritic Cells and Activates TLR2 Signal to Produce IgA in the Small Intestine. PLoS ONE 2014, 9, e105370. [Google Scholar] [CrossRef]
  83. Martín, R.; Chamignon, C.; Mhedbi-Hajri, N.; Chain, F.; Derrien, M.; Escribano-Vázquez, U.; Garault, P.; Cotillard, A.; Pham, H.P.; Chervaux, C.; et al. The Potential Probiotic Lactobacillus Rhamnosus CNCM I-3690 Strain Protects the Intestinal Barrier by Stimulating Both Mucus Production and Cytoprotective Response. Sci. Rep. 2019, 9, 5398. [Google Scholar] [CrossRef]
  84. Ahl, D.; Liu, H.; Schreiber, O.; Roos, S.; Phillipson, M.; Holm, L. Lactobacillus reuteri Increases Mucus Thickness and Ameliorates Dextran Sulphate Sodium-induced Colitis in Mice. Acta Physiol. 2016, 217, 300–310. [Google Scholar] [CrossRef]
  85. Schlee, M.; Harder, J.; Köten, B.; Stange, E.F.; Wehkamp, J.; Fellermann, K. Probiotic Lactobacilli and VSL#3 Induce Enterocyte β-Defensin 2. Clin. Exp. Immunol. 2008, 151, 528–535. [Google Scholar] [CrossRef]
  86. Tytgat, H.L.P.; Douillard, F.P.; Reunanen, J.; Rasinkangas, P.; Hendrickx, A.P.A.; Laine, P.K.; Paulin, L.; Satokari, R.; de Vos, W.M. Lactobacillus Rhamnosus GG Outcompetes Enterococcus Faecium via Mucus-Binding Pili: Evidence for a Novel and Heterospecific Probiotic Mechanism. Appl. Environ. Microbiol. 2016, 82, 5756–5762. [Google Scholar] [CrossRef]
  87. Prado Acosta, M.; Geoghegan, E.M.; Lepenies, B.; Ruzal, S.; Kielian, M.; Martinez, M.G. Surface (S) Layer Proteins of Lactobacillus Acidophilus Block Virus Infection via DC-SIGN Interaction. Front. Microbiol. 2019, 10, 810. [Google Scholar] [CrossRef] [PubMed]
  88. Sherman, P.M.; Johnson-Henry, K.C.; Yeung, H.P.; Ngo, P.S.C.; Goulet, J.; Tompkins, T.A. Probiotics Reduce Enterohemorrhagic Escherichia coli O157:H7- and Enteropathogenic E. coli O127:H6-Induced Changes in Polarized T84 Epithelial Cell Monolayers by Reducing Bacterial Adhesion and Cytoskeletal Rearrangements. Infect. Immun. 2005, 73, 5183–5188. [Google Scholar] [CrossRef] [PubMed]
  89. Wang, X.; Wang, J.; Guo, W.; Zhou, Y.; Sun, C.; Li, Z.; Chen, L.; Pan, X. Characteristics of Intestinal Flora in Patients with Primary Sjögren Syndrome. J. South. Med. Univ. 2020, 40, 949–957. [Google Scholar] [CrossRef]
  90. Zhang, X.; Zhang, D.; Jia, H.; Feng, Q.; Wang, D.; Liang, D.; Wu, X.; Li, J.; Tang, L.; Li, Y.; et al. The Oral and Gut Microbiomes Are Perturbed in Rheumatoid Arthritis and Partly Normalized after Treatment. Nat. Med. 2015, 21, 895–905. [Google Scholar] [CrossRef] [PubMed]
  91. Fine, R.L.; Mubiru, D.L.; Kriegel, M.A. Friend or Foe? Lactobacillus in the Context of Autoimmune Disease. In Advances in Immunology; Elsevier: Amsterdam, The Netherlands, 2020; pp. 29–56. [Google Scholar]
  92. Heeney, D.D.; Gareau, M.G.; Marco, M.L. Intestinal Lactobacillus in Health and Disease, a Driver or Just along for the Ride? Curr. Opin. Biotechnol. 2018, 49, 140–147. [Google Scholar] [CrossRef]
  93. Gao, J.; Wang, J.; Zhao, L.-L.; Yao, T.-T.; Chen, Y.; Ma, J.; Zhang, X.; Wang, J.-X.; Wang, Y.; Cui, Z.; et al. Gut Lactobacillus Level Is a Predictive Marker for Coronary Atherosclerotic Lesions Progress and Prognosis in Patients with Acute Coronary Syndrome. Front. Cell Infect. Microbiol. 2021, 11, 687827. [Google Scholar] [CrossRef] [PubMed]
  94. Lim, M.Y.; You, H.J.; Yoon, H.S.; Kwon, B.; Lee, J.Y.; Lee, S.; Song, Y.-M.; Lee, K.; Sung, J.; Ko, G. The Effect of Heritability and Host Genetics on the Gut Microbiota and Metabolic Syndrome. Gut 2017, 66, 1031–1038. [Google Scholar] [CrossRef] [PubMed]
  95. Wang, W.; Chen, L.; Zhou, R.; Wang, X.; Song, L.; Huang, S.; Wang, G.; Xia, B. Increased Proportions of Bifidobacterium and the Lactobacillus Group and Loss of Butyrate-Producing Bacteria in Inflammatory Bowel Disease. J. Clin. Microbiol. 2014, 52, 398–406. [Google Scholar] [CrossRef] [PubMed]
  96. Klinder, A.; Shen, Q.; Heppel, S.; Lovegrove, J.A.; Rowland, I.; Tuohy, K.M. Impact of Increasing Fruit and Vegetables and Flavonoid Intake on the Human Gut Microbiota. Food Funct. 2016, 7, 1788–1796. [Google Scholar] [CrossRef] [PubMed]
  97. Li, A.; Kou, R.; Liu, H.; Chen, M.; Wang, J.; Liu, Q.; Xing, X.; Zhang, B.; Dong, L.; Wang, S. Multi-Omics Analyses Reveal Relationships among Polyphenol-Rich Oolong Tea Consumption, Gut Microbiota, and Metabolic Profile: A Pilot Study. Food Chem. 2023, 426, 136653. [Google Scholar] [CrossRef]
  98. Istas, G.; Wood, E.; Le Sayec, M.; Rawlings, C.; Yoon, J.; Dandavate, V.; Cera, D.; Rampelli, S.; Costabile, A.; Fromentin, E.; et al. Effects of Aronia Berry (Poly)Phenols on Vascular Function and Gut Microbiota: A Double-Blind Randomized Controlled Trial in Adult Men. Am. J. Clin. Nutr. 2019, 110, 316–329. [Google Scholar] [CrossRef]
  99. Ramnani, P.; Gaudier, E.; Bingham, M.; van Bruggen, P.; Tuohy, K.M.; Gibson, G.R. Prebiotic Effect of Fruit and Vegetable Shots Containing Jerusalem Artichoke Inulin: A Human Intervention Study. Br. J. Nutr. 2010, 104, 233–240. [Google Scholar] [CrossRef]
  100. Salem, M.A.; Salama, M.M.; Ezzat, S.M.; Hashem, Y.A. Comparative Metabolite Profiling of Four Polyphenol Rich Morus Leaves Extracts in Relation to Their Antibiofilm Activity against Enterococcus faecalis. Sci. Rep. 2022, 12, 20168. [Google Scholar] [CrossRef] [PubMed]
  101. Zhang, S.; Xu, M.; Sun, X.; Liu, X.; Choueiry, F.; Xu, R.; Shi, H.; Zhu, J. Black Raspberry Extract Shifted Gut Microbe Diversity and Their Metabolic Landscape in a Human Colonic Model. J. Chromatogr. B 2022, 1188, 123027. [Google Scholar] [CrossRef] [PubMed]
  102. Tan, J.; Hu, R.; Gong, J.; Fang, C.; Li, Y.; Liu, M.; He, Z.; Hou, D.-X.; Zhang, H.; He, J.; et al. Protection against Metabolic Associated Fatty Liver Disease by Protocatechuic Acid. Gut Microbes 2023, 15, 2238959. [Google Scholar] [CrossRef]
  103. Xiong, H.-H.; Lin, S.-Y.; Chen, L.-L.; Ouyang, K.-H.; Wang, W.-J. The Interaction between Flavonoids and Intestinal Microbes: A Review. Foods 2023, 12, 320. [Google Scholar] [CrossRef]
  104. Chen, K.; Wei, X.; Kortesniemi, M.; Pariyani, R.; Zhang, Y.; Yang, B. Effects of Acylated and Nonacylated Anthocyanins Extracts on Gut Metabolites and Microbiota in Diabetic Zucker Rats: A Metabolomic and Metagenomic Study. Food Res. Int. 2022, 153, 110978. [Google Scholar] [CrossRef] [PubMed]
  105. Zhao, Y.; Yu, S.; Li, L.; Zhao, H.; Li, Y.; Jiang, L.; Liu, M. Feeding Citrus Flavonoid Extracts Decreases Bacterial Endotoxin and Systemic Inflammation and Improves Immunometabolic Status by Modulating Hindgut Microbiome and Metabolome in Lactating Dairy Cows. Anim. Nutr. 2023, 13, 386–400. [Google Scholar] [CrossRef] [PubMed]
  106. Hu, R.; He, Z.; Liu, M.; Tan, J.; Zhang, H.; Hou, D.-X.; He, J.; Wu, S. Dietary Protocatechuic Acid Ameliorates Inflammation and Up-Regulates Intestinal Tight Junction Proteins by Modulating Gut Microbiota in LPS-Challenged Piglets. J. Anim. Sci. Biotechnol. 2020, 11, 92. [Google Scholar] [CrossRef] [PubMed]
  107. Galena, A.E.; Chai, J.; Zhang, J.; Bednarzyk, M.; Perez, D.; Ochrietor, J.D.; Jahan-Mihan, A.; Arikawa, A.Y. The Effects of Fermented Vegetable Consumption on the Composition of the Intestinal Microbiota and Levels of Inflammatory Markers in Women: A Pilot and Feasibility Study. PLoS ONE 2022, 17, e0275275. [Google Scholar] [CrossRef] [PubMed]
  108. Zhao, L.; Zhang, Q.; Ma, W.; Tian, F.; Shen, H.; Zhou, M. A Combination of Quercetin and Resveratrol Reduces Obesity in High-Fat Diet-Fed Rats by Modulation of Gut Microbiota. Food Funct. 2017, 8, 4644–4656. [Google Scholar] [CrossRef] [PubMed]
  109. Shrode, R.L.; Knobbe, J.E.; Cady, N.; Yadav, M.; Hoang, J.; Cherwin, C.; Curry, M.; Garje, R.; Vikas, P.; Sugg, S.; et al. Breast Cancer Patients from the Midwest Region of the United States Have Reduced Levels of Short-Chain Fatty Acid-Producing Gut Bacteria. Sci. Rep. 2023, 13, 526. [Google Scholar] [CrossRef] [PubMed]
  110. Jia, B.; Zou, Y.; Han, X.; Bae, J.-W.; Jeon, C.O. Gut Microbiome-Mediated Mechanisms for Reducing Cholesterol Levels: Implications for Ameliorating Cardiovascular Disease. Trends Microbiol. 2023, 31, 76–91. [Google Scholar] [CrossRef] [PubMed]
  111. Vital, M.; Howe, A.C.; Tiedje, J.M. Revealing the Bacterial Butyrate Synthesis Pathways by Analyzing (Meta)Genomic Data. mBio 2014, 5, e00889-14. [Google Scholar] [CrossRef]
  112. Bourgin, M.; Kriaa, A.; Mkaouar, H.; Mariaule, V.; Jablaoui, A.; Maguin, E.; Rhimi, M. Bile Salt Hydrolases: At the Crossroads of Microbiota and Human Health. Microorganisms 2021, 9, 1122. [Google Scholar] [CrossRef]
  113. Zafar, H.; Saier, M.H. Gut Bacteroides Species in Health and Disease. Gut Microbes 2021, 13, 1848158. [Google Scholar] [CrossRef]
  114. Selleck, E.M.; Van Tyne, D.; Gilmore, M.S. Pathogenicity of Enterococci. Microbiol. Spectr. 2019, 7. [Google Scholar] [CrossRef]
  115. Gao, W.; Howden, B.P.; Stinear, T.P. Evolution of Virulence in Enterococcus Faecium, a Hospital-Adapted Opportunistic Pathogen. Curr. Opin. Microbiol. 2018, 41, 76–82. [Google Scholar] [CrossRef]
  116. Groman, R.P. Gram-Negative Infections. In Small Animal Critical Care Medicine; Elsevier: Amsterdam, The Netherlands, 2009; pp. 469–473. [Google Scholar]
  117. Png, C.W.; Lindén, S.K.; Gilshenan, K.S.; Zoetendal, E.G.; McSweeney, C.S.; Sly, L.I.; McGuckin, M.A.; Florin, T.H.J. Mucolytic Bacteria with Increased Prevalence in IBD Mucosa Augment In Vitro Utilization of Mucin by Other Bacteria. Am. J. Gastroenterol. 2010, 105, 2420–2428. [Google Scholar] [CrossRef]
  118. Joossens, M.; Huys, G.; Cnockaert, M.; De Preter, V.; Verbeke, K.; Rutgeerts, P.; Vandamme, P.; Vermeire, S. Dysbiosis of the Faecal Microbiota in Patients with Crohn’s Disease and Their Unaffected Relatives. Gut 2011, 60, 631–637. [Google Scholar] [CrossRef] [PubMed]
  119. Hintikka, J.E.; Munukka, E.; Valtonen, M.; Luoto, R.; Ihalainen, J.K.; Kallonen, T.; Waris, M.; Heinonen, O.J.; Ruuskanen, O.; Pekkala, S. Gut Microbiota and Serum Metabolome in Elite Cross-Country Skiers: A Controlled Study. Metabolites 2022, 12, 335. [Google Scholar] [CrossRef]
  120. Kasai, C.; Sugimoto, K.; Moritani, I.; Tanaka, J.; Oya, Y.; Inoue, H.; Tameda, M.; Shiraki, K.; Ito, M.; Takei, Y.; et al. Comparison of the Gut Microbiota Composition between Obese and Non-Obese Individuals in a Japanese Population, as Analyzed by Terminal Restriction Fragment Length Polymorphism and next-Generation Sequencing. BMC Gastroenterol. 2015, 15, 100. [Google Scholar] [CrossRef]
  121. Tims, S.; Derom, C.; Jonkers, D.M.; Vlietinck, R.; Saris, W.H.; Kleerebezem, M.; de Vos, W.M.; Zoetendal, E.G. Microbiota Conservation and BMI Signatures in Adult Monozygotic Twins. ISME J. 2013, 7, 707–717. [Google Scholar] [CrossRef] [PubMed]
  122. Nogal, A.; Louca, P.; Zhang, X.; Wells, P.M.; Steves, C.J.; Spector, T.D.; Falchi, M.; Valdes, A.M.; Menni, C. Circulating Levels of the Short-Chain Fatty Acid Acetate Mediate the Effect of the Gut Microbiome on Visceral Fat. Front. Microbiol. 2021, 12, 711359. [Google Scholar] [CrossRef]
  123. Chen, W.; Zhang, M.; Guo, Y.; Wang, Z.; Liu, Q.; Yan, R.; Wang, Y.; Wu, Q.; Yuan, K.; Sun, W. The Profile and Function of Gut Microbiota in Diabetic Nephropathy. Diabetes Metab. Syndr. Obes. 2021, 14, 4283–4296. [Google Scholar] [CrossRef] [PubMed]
  124. He, H.; Lin, M.; You, L.; Chen, T.; Liang, Z.; Li, D.; Xie, C.; Xiao, G.; Ye, P.; Kong, Y.; et al. Gut Microbiota Profile in Adult Patients with Idiopathic Nephrotic Syndrome. Biomed. Res. Int. 2021, 2021, 8854969. [Google Scholar] [CrossRef] [PubMed]
  125. Huang, Q.; Braffett, B.H.; Simmens, S.J.; Young, H.A.; Ogden, C.L. Dietary Polyphenol Intake in US Adults and 10-Year Trends: 2007–2016. J. Acad. Nutr. Diet. 2020, 120, 1821–1833. [Google Scholar] [CrossRef] [PubMed]
Figure 1. Average herb and spice use. Shown here are the average frequencies with which each herb and spice was used by study participants. Each herb and spice are color labeled by the category of its total polyphenol contents in milligrams (mg) of total polyphenols per kilogram (kg) dry weight of the herb/spice (mg/kg DW).
Nutrients 16 00773 g001
Figure 2. Community profiling by polyphenol consumption categories. The relative abundances of participants’ (A) phyla and (B) genera are stratified by low, medium, and high consumers of dietary polyphenols.
Nutrients 16 00773 g002
Figure 3. Diversity does not differ by estimated polyphenol consumption. Two measures of alpha diversity, Shannon Index (A) and observed richness (B), are stratified by low, medium, and high consumers of dietary polyphenols; no significant features were detected. Bray—Curtis dissimilarity metrics (C), a measure of beta diversity, are plotted between low, medium, and high consumers of dietary polyphenols; PERMANOVA revealed that no significant features were detected.
Nutrients 16 00773 g003
Figure 4. Taxa abundance differs by estimated polyphenol consumption. Shown are taxa at the genus level (A) which were identified as biomarkers of polyphenol consumption and differ by low, medium, and high consumers; only taxa with p < 0.1 are displayed. A phylogenetic heat tree (B) displaying a differential abundance of genera (p-value < 0.1) was detected by Wilcoxon Rank Sum comparing the low and high consumers.
Nutrients 16 00773 g004
Figure 5. Diversity does not differ by frequency of polyphenol-weighted herb and spice use. Two measures of alpha diversity, Shannon Index (A) and observed richness (B), are stratified by low-, medium-, and high-frequency use of polyphenol-weighted herbs and spices; no significant features were detected. Bray–Curtis dissimilarity metrics (C), a measure of beta diversity, are plotted between low-, medium-, and high-frequency use of polyphenol-weighted herbs and spices; PERMANOVA revealed that no significant features were detected.
Nutrients 16 00773 g005
Figure 6. Taxa abundance differs by frequency of polyphenol-weighted herb and spice use. Shown are taxa at the genus level (A) which were identified as biomarkers of polyphenol-weighted herb and spice use and differ by low-, medium-, and high-frequency users; only taxa with p < 0.1 are displayed. A phylogenetic heat tree (B) displaying a differential abundance of genera (p-value < 0.1) was detected by Wilcoxon Rank Sum comparing the low- and high-frequency users.
Nutrients 16 00773 g006
Figure 7. Spearman’s rank correlations between taxa abundance and estimated daily consumption of major polyphenol classes. Microbial taxa identified as biomarkers of polyphenol exposure were further explored by correlating the relative abundance of each with estimated daily polyphenol consumption (“Total”; mg/day), and the five major polyphenol classes. Shown is a heat map displaying the directionality (e.g., positive or inverse) and significance of the correlation coefficients. * p < 0.05; ** p < 0.01; *** p < 0.001; t < 0.1.
Nutrients 16 00773 g007
Table 1. Characteristics of study participants (n = 96).
VariablesValue
AgeM(SD)
29.3 (6.1)
Sex Assigned at Birthn (%)
  Male14 (14.6)
  Female81 (84.4)
  Intersex1 (>1)
Racen (%)
  White/Caucasian75 (78.1)
  Asian5 (5.2)
  African American2 (2)
  Middle Eastern2 (2)
  Native Hawaiian/Pacific Islander1 (1)
  American/Alaska Native1 (1)
  Mixed6 (6.3)
  Other/Unknown4 (4.2)
Ethnicityn (%)
  Hispanic/LatinX 9 (9.4)
  Non-Hispanic/LatinX 83 (86.5)
  Unknown4 (4.2)
Cardiometabolic MeasuresM(SD)
  BMI (kg/m2)23.7 (4.3)
  Triglycerides (mg/dl)88.5 (47.0)
  Total cholesterol (mg/dl)170 (29.1)
  LDL (mg/dl)73.4 (33.8)
  HDL (mg/dl) 62.2 (21.4)
  Systolic blood pressure (mmHg)113.6 (12.2)
  Diastolic blood pressure (mmHg)65.2 (9.1)
  Hemoglobin A1c (%)4.3 (0.6)
Smoking Historyn (%)
  Smoker11 (11.5)
  Non-smoker85 (88.5%)
Alcohol Use Frequencyn (%)
  Never21 (21.9)
  1-3x/month37 (38.5)
  1-2x/week19 (19.8)
  3-4x/week13 (13.5)
  5-6x/week4 (4.2)
  Daily2 (2.1)
Characteristics of study participants. Shown are demographic, cardiometabolic, and substance use history of study participants (n = 96). M = mean; SD = standard deviation; n = count; % = percent of sample. BMI = body mass index; LDL = low-density lipoprotein; HDL = high-density lipoprotein.
Table 2. Estimated dietary polyphenol exposure of study participants (n=96).
Estimated Dietary Polyphenol Intake (mg/day)
Consumer CategoryAllLowMedHigh
  Total Polyphenols1224.11 (661.67)557.64 (198.68)
(n = 34)
1131.27 (169.97)
(n = 32)
1986.42 (467.70)
(n = 30)
  Flavonoids590.23 (343.00)270.86 (80.89)
(n = 34)
504.37 (77.61)
(n = 32)
998.24 (258.16)
(n = 30)
  Phenolic Acids487.54 (445.01)117.16 (53.24)
(n = 34)
363.62 (105.28)
(n = 32)
985.83 (430.02)
(n = 30)
  Lignans105.86 (80.79)36.19 (12.66)
(n = 34)
85.16 (15.43)
(n = 32)
196.12 (77.21)
(n = 30)
  Stilbenes0.90 (1.47)0.03 (0.04)
(n = 34)
0.38 (0.14)
(n = 32)
2.31 (1.89)
(n = 30)
  Other23.16 (15.65)9.60 (3.79)
(n = 35)
20.08 (2.97)
(n = 30)
40.45 (14.78)
(n = 31)
Weighted Frequency Score
Frequency CategoryAllLowMedHigh
Average Frequency Score102.93 (19.27)59.75 (19.99)
(n = 33)
96.81 (8.19)
(n = 28)
153.14 (29.61)
(n = 35)
Estimated dietary polyphenol exposure of study participants. Shown here are the mean estimated dietary polyphenol intake values (mg/day) for study participants. The mean value (M) and standard deviation (SD) are shown for all participants (All), as well as those stratified into low-, medium- (Med), and high-exposure groups (n = population).
Disclaimer/Publisher’s Note: The statements, opinions and data contained in all publications are solely those of the individual author(s) and contributor(s) and not of MDPI and/or the editor(s). MDPI and/or the editor(s) disclaim responsibility for any injury to people or property resulting from any ideas, methods, instructions or products referred to in the content.

