Article

Opposing Effects of Nutritional Supply on Bone Health at Different Ages: Based on the National Health and Nutrition Examination Survey Database

Department of Nutrition Science and Food Hygiene, Xiangya School of Public Health, Central South University, Changsha 410008, China
*
Author to whom correspondence should be addressed.
These authors contributed equally to this work.
Nutrients 2024, 16(6), 758; https://doi.org/10.3390/nu16060758
Submission received: 3 February 2024 / Revised: 3 March 2024 / Accepted: 5 March 2024 / Published: 7 March 2024

Abstract

:
(1) Background: Nutrients play an essential role in bone health, whether in achieving peak bone mineral density (BMD) or maintaining bone health. This study explores the relationship between nutrient supply and femoral bone health at different ages. (2) Methods: A total of 5603 participants meeting the inclusion and exclusion criteria were included in this study using the National Health and Nutrition Examination Survey (NHANES) database from 2005 to 2010, 2013 to 2014, and 2017 to 2018. Femoral bone mineral density and bone status were dependent variables, and dietary nutrient intake and nutrient intake status were independent variables. The relationship between dietary nutrient intake and bone mineral density was explored, and the importance of nutrients affecting bone status was analyzed through a neural network model. At the same time, we investigated the relationship between nutrient intake and bone status. (3) Results: The peak of age and femoral bone mineral density appeared at 20 years old in our study. After grouping by age, logistic regression analysis showed that before 20 years old, without adjusting other variables, high-fat diet was more likely to have normal bone mass than appropriate fat diet (OR: 4.173, 95%CI: 1.007–17.289). After adjusting for all demographic factors, niacin intake (OR: 1.062, 95%CI: 1.019–1.108) was beneficial for normal bone mass, while vitamin B6 intake (OR: 0.627, 95%CI: 0.408–0.965) was not. After 20 years old, after adjusting for carbohydrate, protein, vitamin B6, niacin, dietary fat, vitamin B2, and vitamin B12, vitamin B2 intake (OR: 1.153, 95%CI: 1.04–1.278) was beneficial for normal bone mass, while vitamin B6 intake (OR: 0.842, 95%CI: 0.726–0.976) was not. After adjusting for all confounding factors, vitamin B2 intake (OR: 1.288, 95%CI: 1.102–1.506) was beneficial for normal bone mass. In addition, we found that even if there was no statistical significance, the effects of high-fat diet on bone mass were different at different ages. (4) Conclusions: By conducting an in-depth analysis of the NHANES database, this study reveals that dietary factors exert divergent effects on bone health across different age groups, implying the necessity of implementing tailored dietary strategies to maintain optimal bone health at distinct life stages.

1. Introduction

Osteoporosis (OP) is a metabolic bone disease characterized by reduced bone mass and the deterioration of bone tissue microstructure, leading to increased susceptibility to fractures due to compromised bone strength [1]. Due to its asymptomatic nature, it is often referred to as a “silent disease” [2,3]. Moreover, osteoporotic fractures are frequently comminuted fractures that exhibit poor stability in internal fixation treatment, thereby predisposing individuals to delayed or non-union of fractures. Consequently, there is an urgent need for the exploration of more effective preventive and therapeutic measures. Current research has identified that OP progression primarily correlates with peak bone mineral density and the subsequent continuous loss of bone mass [4,5], emphasizing the significance of maximizing peak bone mass and delaying the onset of age-related decline in skeletal health for OP prevention and treatment [6]. Given that long bone fractures, particularly femoral fractures, contribute significantly to the disease burden associated with osteoporosis, identifying factors influencing femoral peak bone mineral density and implementing appropriate interventions are crucial for effective OP prevention and management.
The formation of peak bone mass is influenced by genetics, environment, and nutrition. Among these factors, genetics and environment are immutable and account for 44–88% of bone mineral density formation. Conversely, the remaining variability in bone mineral density is closely associated with behavioral factors such as nutrition [7,8]. Previous studies on nutritional factors have primarily focused on the relationship between individual nutrient characteristics and bone mineral density [9]. However, research attention has been limited to adults rather than children and adolescents who undergo significant growth and development [6]. Considering that their nutritional needs differ greatly from those of adults [6], it is crucial to identify which dietary factors are most beneficial for improving bone health across different age groups. In analyzing complex high-dimensional data, machine learning techniques like artificial neural networks offer distinct advantages over traditional statistical methods as they can better identify key features and facilitate data analysis.
Inspired by the artificial model of biological neurons [8], artificial neural networks have garnered significant attention from researchers as a nonlinear approach for investigating the relationship between input and output information [10]. Serving as an effective method for general classification, clustering, and prediction, the advantage of utilizing neural networks lies in their ability to adapt to diverse datasets without making any assumptions about the underlying model structure [11,12]. In recent years, neural networks have been applied in various domains related to bone health, including detecting and classifying bone lesions [13] and assessing bone age [11]. However, there is currently limited utilization of neural network models in exploring factors influencing bone health.
Therefore, the objective of this study is to investigate the impact of dietary factors on bone mineral density and bone mass across different age groups within a large population using neural network analysis and correlation analysis based on the NHANES database. The utilization of a neural network model enables the assessment of the significance of dietary factors at various life stages in relation to bone health, while also examining specific dietary nutrients that exert the greatest influence on bone status. These findings aim to provide innovative theoretical foundations for regulating and preventing issues pertaining to bone health.

2. Materials and Methods
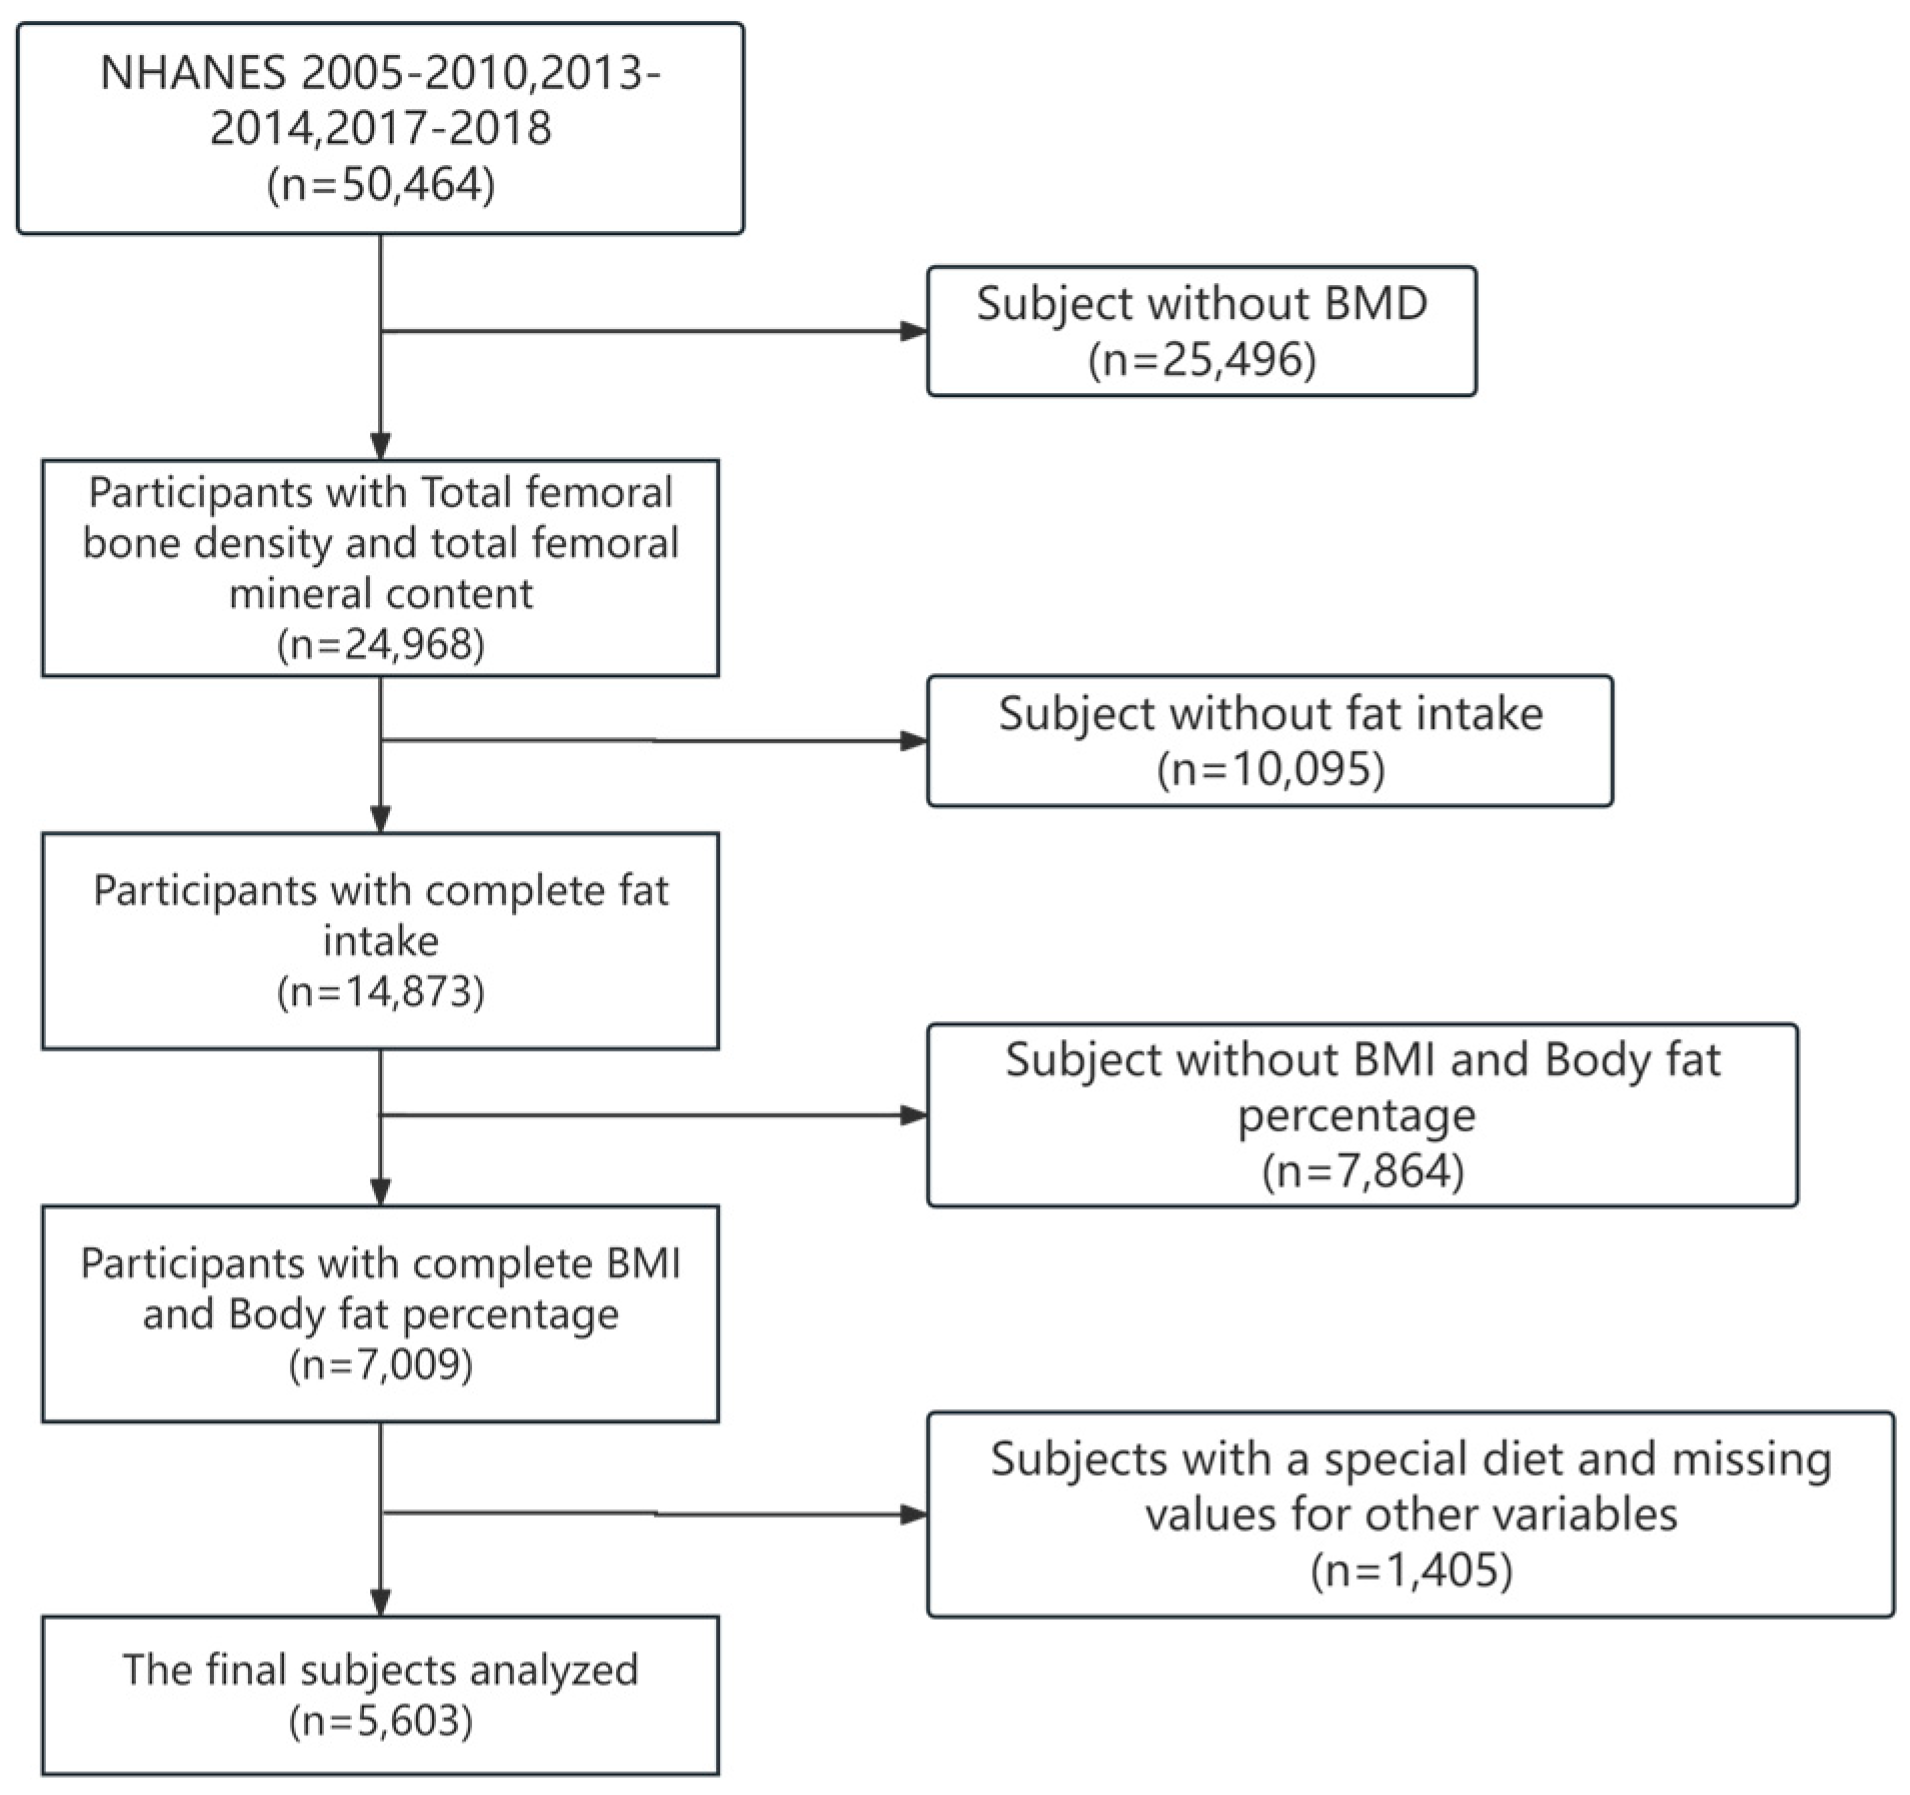
2.1. Data Sources

The National Health and Nutrition Examination Survey (NHANES) is a cross-sectional population survey administered by the US Centers for Disease Control and Prevention (CDC) to assess the health and nutritional status of adults and children in the United States. This study has been approved by the National Center for Health Statistics (NCHS) Institutional Review Board, and informed consent was obtained from all participants (https://www.cdc.gov/nchs/nhanes/index.htm, accessed on 6 March 2024). Since 1999, the National Health and Nutrition Examination Survey (NHANES) has conducted biennial surveys with a nationally representative sample, consisting mainly of interviews and physical examinations. The interviews include demographic, socioeconomic, and diet- and health-related questions, while the physical examination includes physiological measurements and laboratory tests.
Demographic data from three portions (2015–2010; 2013–2014; and 2017–2018) were combined with dietary survey data for analysis. During the periods of 2015–2010, 2013–2014, and 2017–2018, there were 50,464 participants in the NHANES. We excluded participants who did not complete the survey or had total femoral BMD values, dietary data were missing or unreliable, and had special diets. Then, we matched the participants’ demographic and sociological information with the dietary survey data according to each participant’s code. Finally, we included 5603 participants (3005 males and 2598 females) in the analysis (Figure 1).

2.2. Evaluation of Dietary Data

Nutrient and food data were obtained from the total nutrition profiles, which contained the total nutrients of all the foods and beverages consumed by individuals provided in the diet recall. The intake status of protein, carbohydrate, and total fat was calculated based on nutrient intake, nutrient capacity coefficient, and total energy (National Center for Health Statistics). According to the WHO recommendations for the supply ratio of the three major capacity nutrients, the percentage of carbohydrate supply in total energy was defined as low-carbohydrate diet, higher than 75% as high-carbohydrate diet, and between 55% and 75% as appropriate carbohydrate diet; the recommended supply ratio of protein was 10–15%, which was defined as low-protein diet, appropriate protein diet, and high-protein diet; and the supply ratio of fat was defined as appropriate fat diet at less than 30%, and higher than 30% was defined as high-fat diet.

2.3. Assessment of Bone Mineral Density

We selected femoral BMD as the dependent variable in the analysis. Qualified survey participants aged 8 years and older underwent DXA scans to obtain femoral BMD, which can be obtained from the DXXFEM dataset. Femoral BMD was measured by dual energy X-ray absorptiometry (DXA) using a Hologic densitometer (Hologic, Inc., Bedford, MA, USA) and software Apex 3.2. Femoral BMD values were collected and standardized by professionals.

2.4. Covariates

The CAPI system was used to obtain demographic characteristics. These included gender, age, race (Mexican American, other Hispanic, non-Hispanic white, non-Hispanic black, and other races), education level (below 9th grade, 9–11th grade, high school graduation/GED or equivalent, college or above), marital status (widowed, divorced or separated, unmarried, and cohabiting), number of family members, and annual household income.

2.5. Statistical Analysis

Continuous variables with normal distribution, such as bone mineral density and dietary nutrient data, were expressed as mean ± SD, and demographic data were expressed as categorical variables with n (%). A t-test was used to evaluate the difference between normal and reduced bone mass subjects. In addition, the chi-square test was used to assess categorical demographic differences. Multivariate logistic regression was used to analyze the association between dietary factors and bone status while controlling for other covariates. The odds ratio (OR) and 95% confidence interval (95%CI) were used to reflect the direct relationship between dietary factors and femoral bone status. The restricted cubic spline model was used to analyze the relationship between age and femoral bone mineral density. Then, a two-piecewise linear regression model was constructed to calculate the turning point. The neural network model was used to analyze the reasons for the early peak age of femoral bone mineral density. Firstly, we preprocessed and prepared the dietary data and femoral bone mineral density in the NHANES database. In order to better build the evaluation model, we converted the bone mineral density data into bone status according to age, race, and gender using the following calculation formula: T-value = (patient’s bone mineral density value − the average bone mineral density of non-patient adults) ÷ the standard deviation of normal adult bone mineral density. Since our T-value conversion is only based on the data of this study and cannot absolutely define osteoporosis, we divided the bone status into normal bone mass and reduced bone mass, with T-value ≥ −1 for normal bone mass and T-value < −1 for reduced bone mass, which were used as dependent variables. We used the neural net package of R to construct an artificial neural network model, with various nutrient intake as the input variable and bone mass status as the output variable. We set the number of nodes and layers of the hidden layer and set appropriate activation and loss functions. To ensure the accuracy of the model, we used 70% of the dataset as the training set and 30% as the test set and used the prediction accuracy of the test set to evaluate the fitting effect of the model. The weight and deviation parameters of the model were used to explain the degree of influence of different factors on bone mineral density. Through the output results of the neural network model, we can quantitatively evaluate the degree of influence of each variable on bone status. Statistical correlation analysis was conducted using SPSS 25.0, and the construction of an artificial neural network model and data visualization were conducted using R 4.3.0. The OR (odds ratio) value represents the influence of the independent variables on the dependent variables; p < 0.05 was considered statistically significant.

3. Results

3.1. Characteristics of Subjects

The characteristics of the subjects of different ages are shown in Table 1, including the sociodemographic data, physical examination data, and dietary data of the participants selected from the NHANES (2005–2010, 2013–2014, and 2017–2018). In this study, we finally included 5603 subjects, with 2105 (37.57%) aged less than or equal to 20 years old and 3498 (62.43%) aged older than 20 years old. Among the subjects aged less than or equal to 20 years old, there were 1100 males and 1005 females. Among the subjects aged older than 20 years old, there were 1905 males and 1593 females. Except for gender (p = 0.109), there were statistically significant differences in sociodemographic data between the ≤20 years old and >20 years old groups (p < 0.001). The total femoral bone mineral density of the ≤20 years old group was 0.91 ± 0.18 g/cm2, while that of the >20 years old group was 0.96 ± 0.15 g/cm2. At the same time, the BMI of the ≤20 years old group was 21.59 ± 4.68 kg/m2, while that of the >20 years old group was 26.97 ± 5.20 kg/m2. There were significant differences in bone mineral density and body mass index between the different age groups (p < 0.05).
With the exception of energy intake (p = 0.198), thiamine (p = 0.448), vitamin C (p = 0.268), iron (p = 0.093), zinc (p = 0.683), and sodium (p = 0.957), there were no statistically significant differences observed in the majority of macronutrient and micronutrient intake across different age groups, as indicated by p-values greater than 0.05 (Table 2).

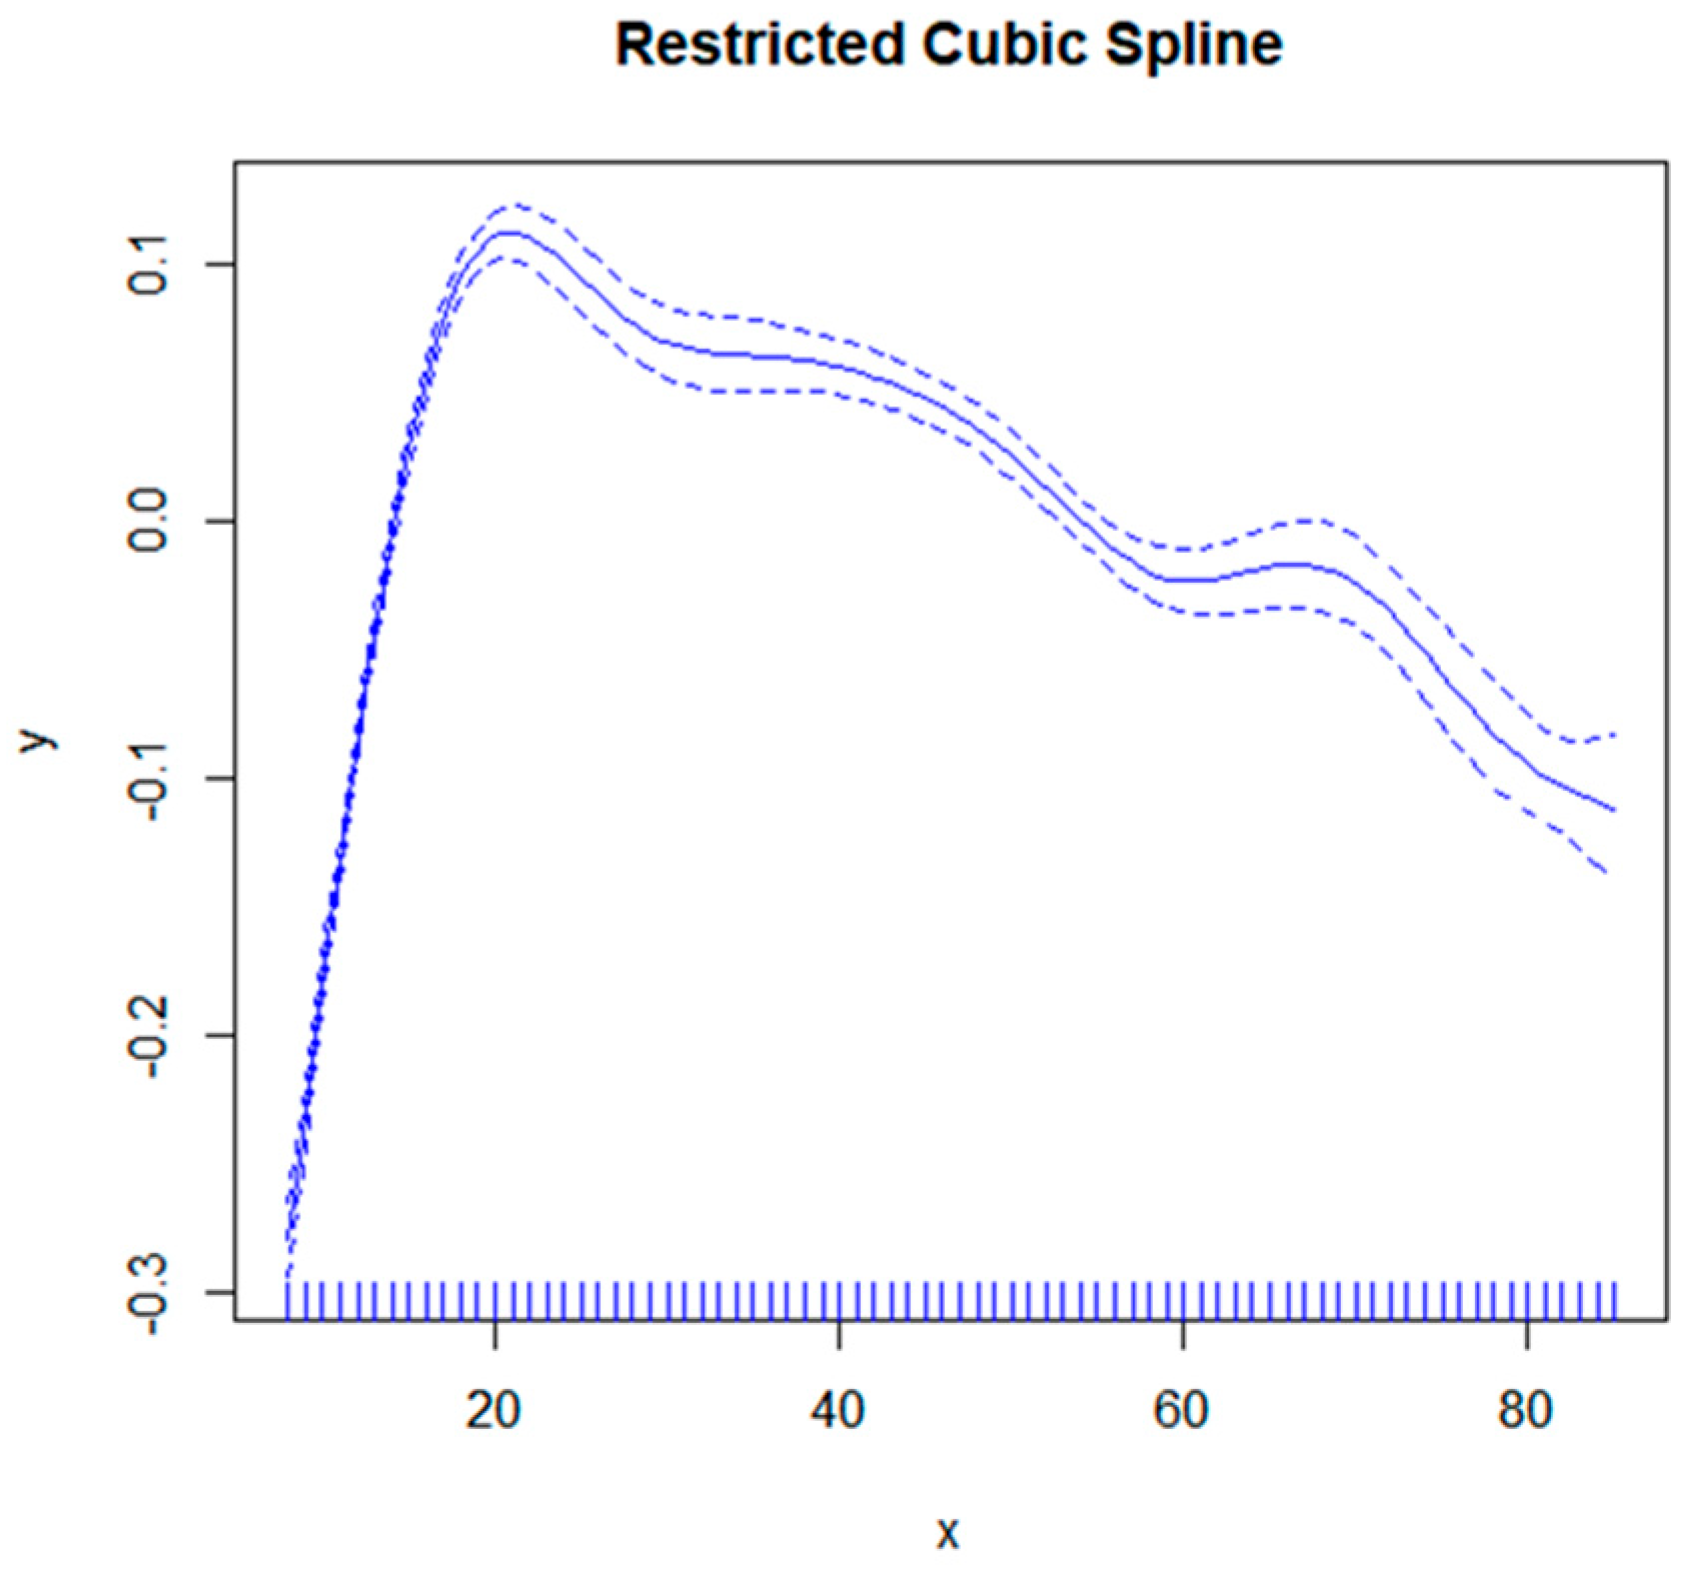
3.2. Correlation between Age and Bone Mineral Density

The correlation between age and total femoral bone mineral density (Figure 2) exhibits a nonlinear pattern, with an inverse relationship observed before and after the peak at 20.16 years old. Specifically, there is a positive association between age and femoral bone mineral density when ≤20 years old, while a negative association is evident beyond the age of 20 (Table 3).

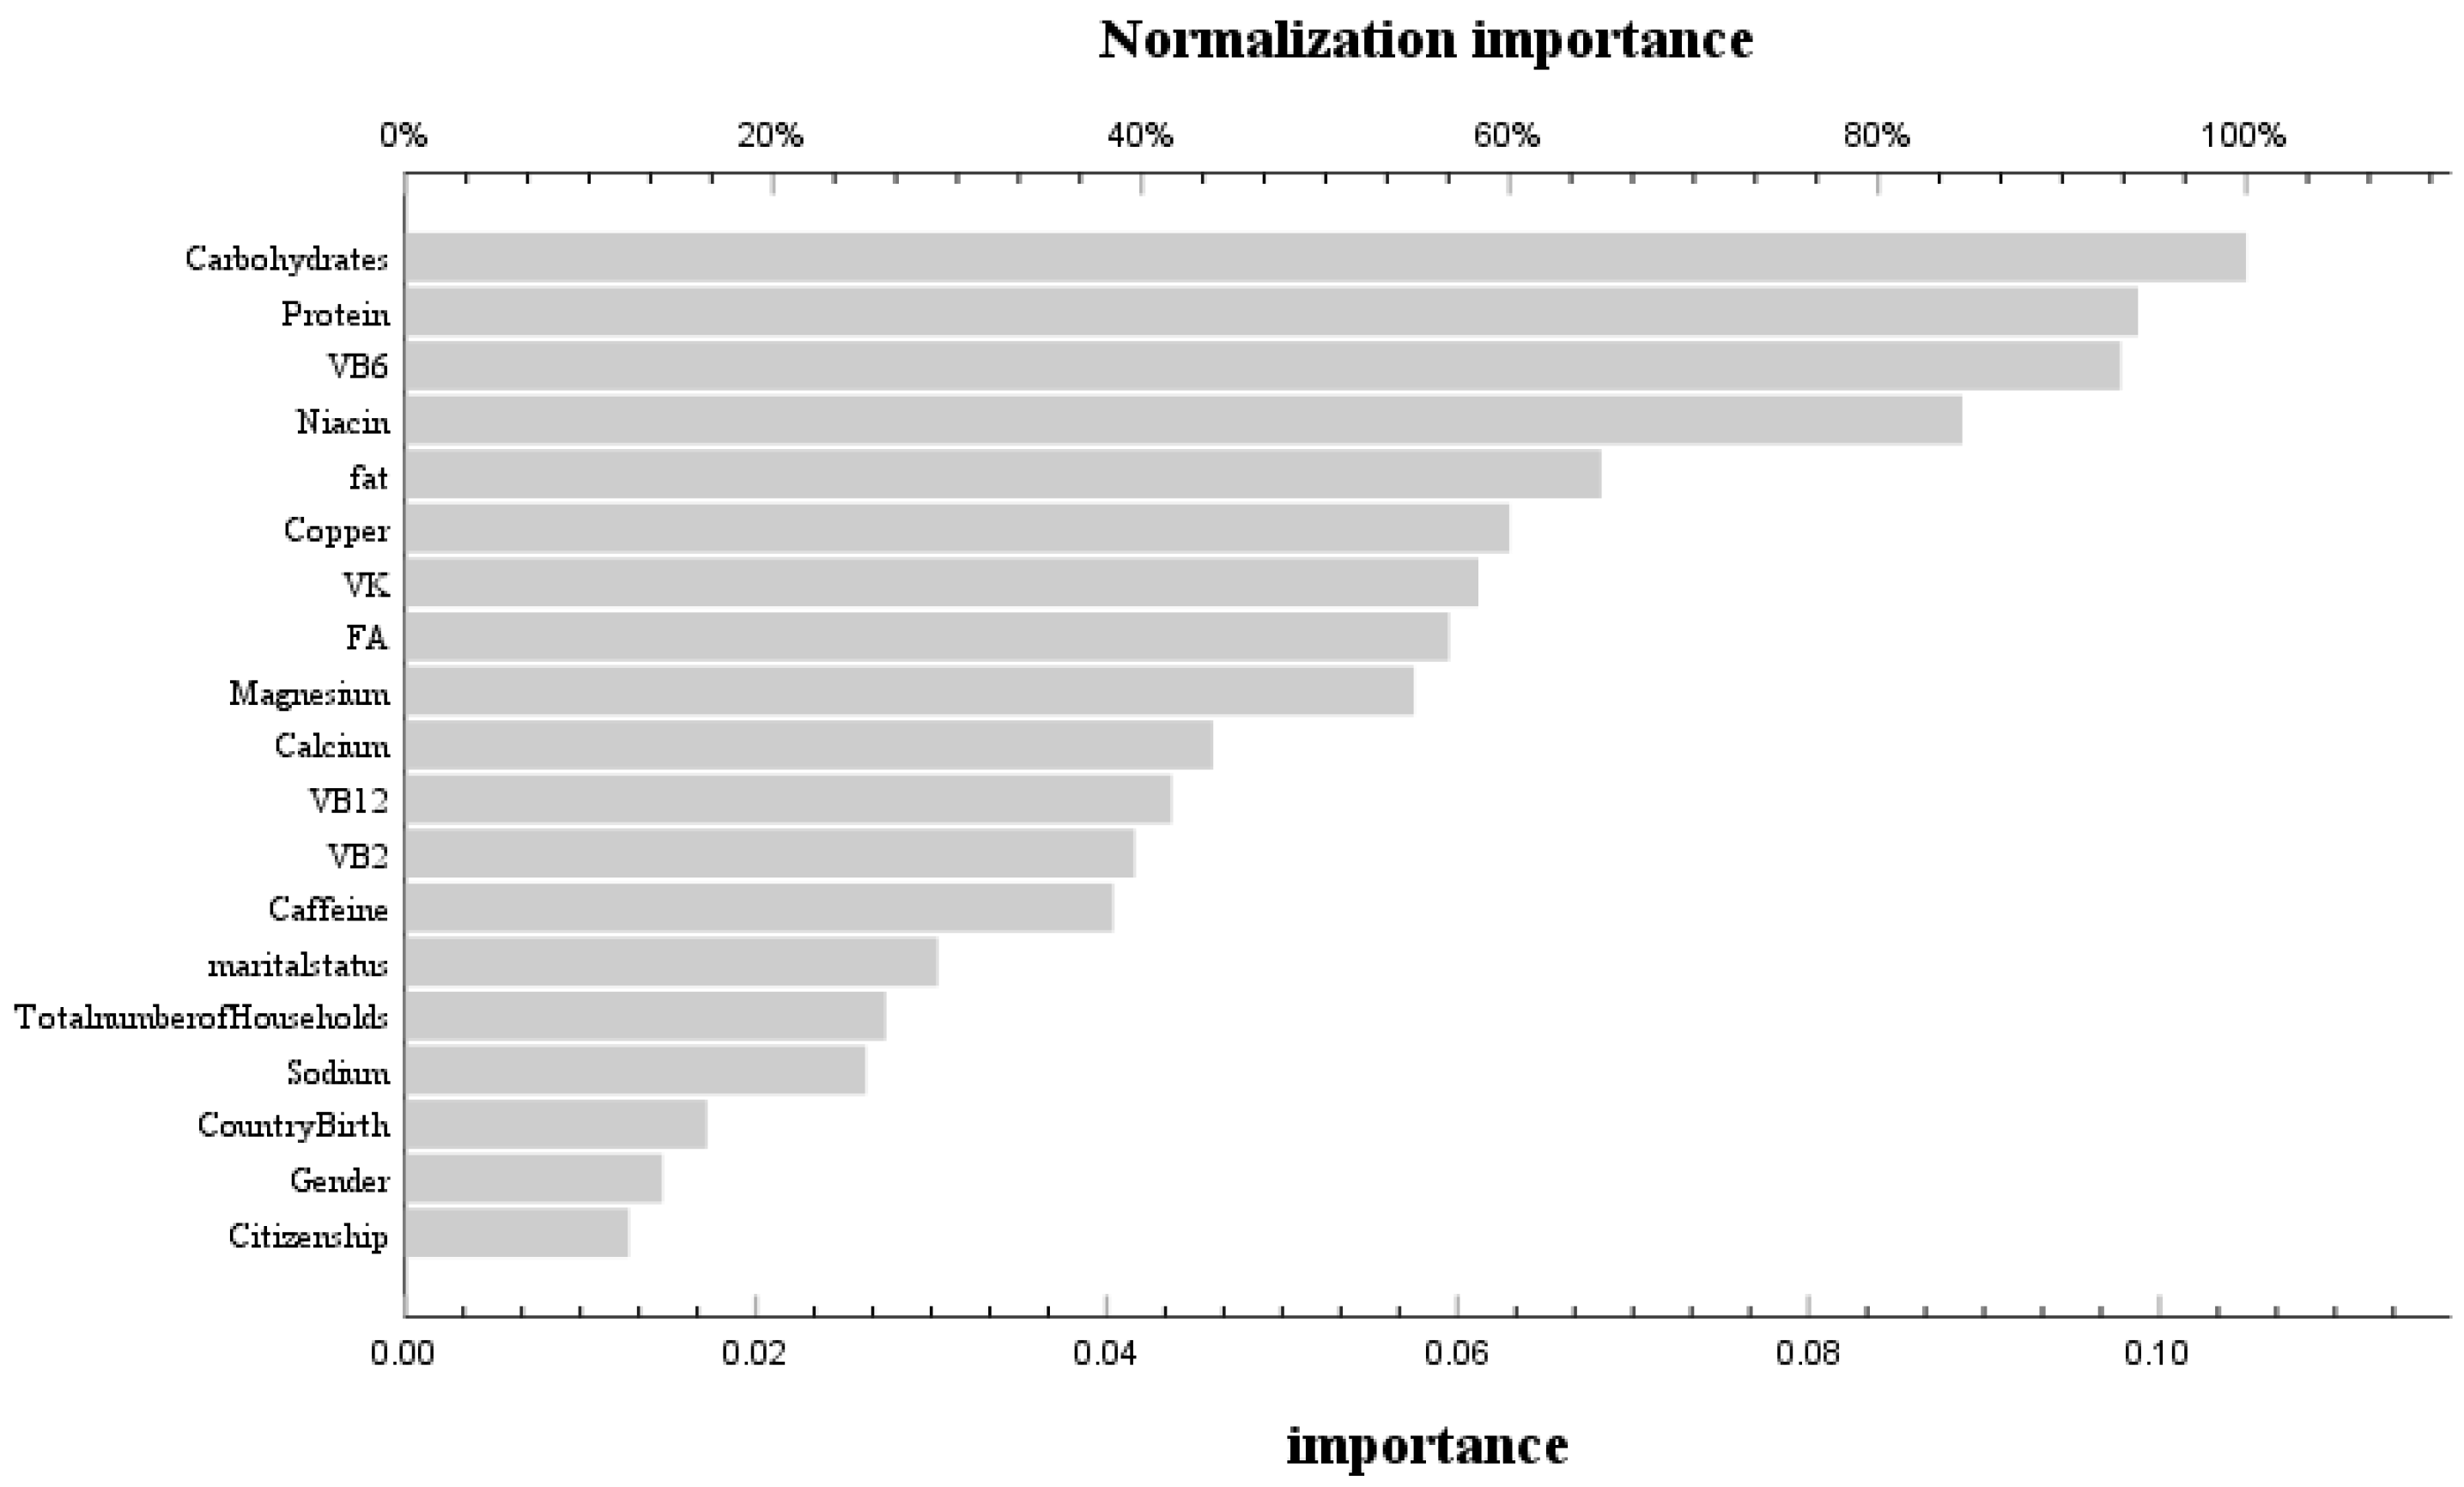
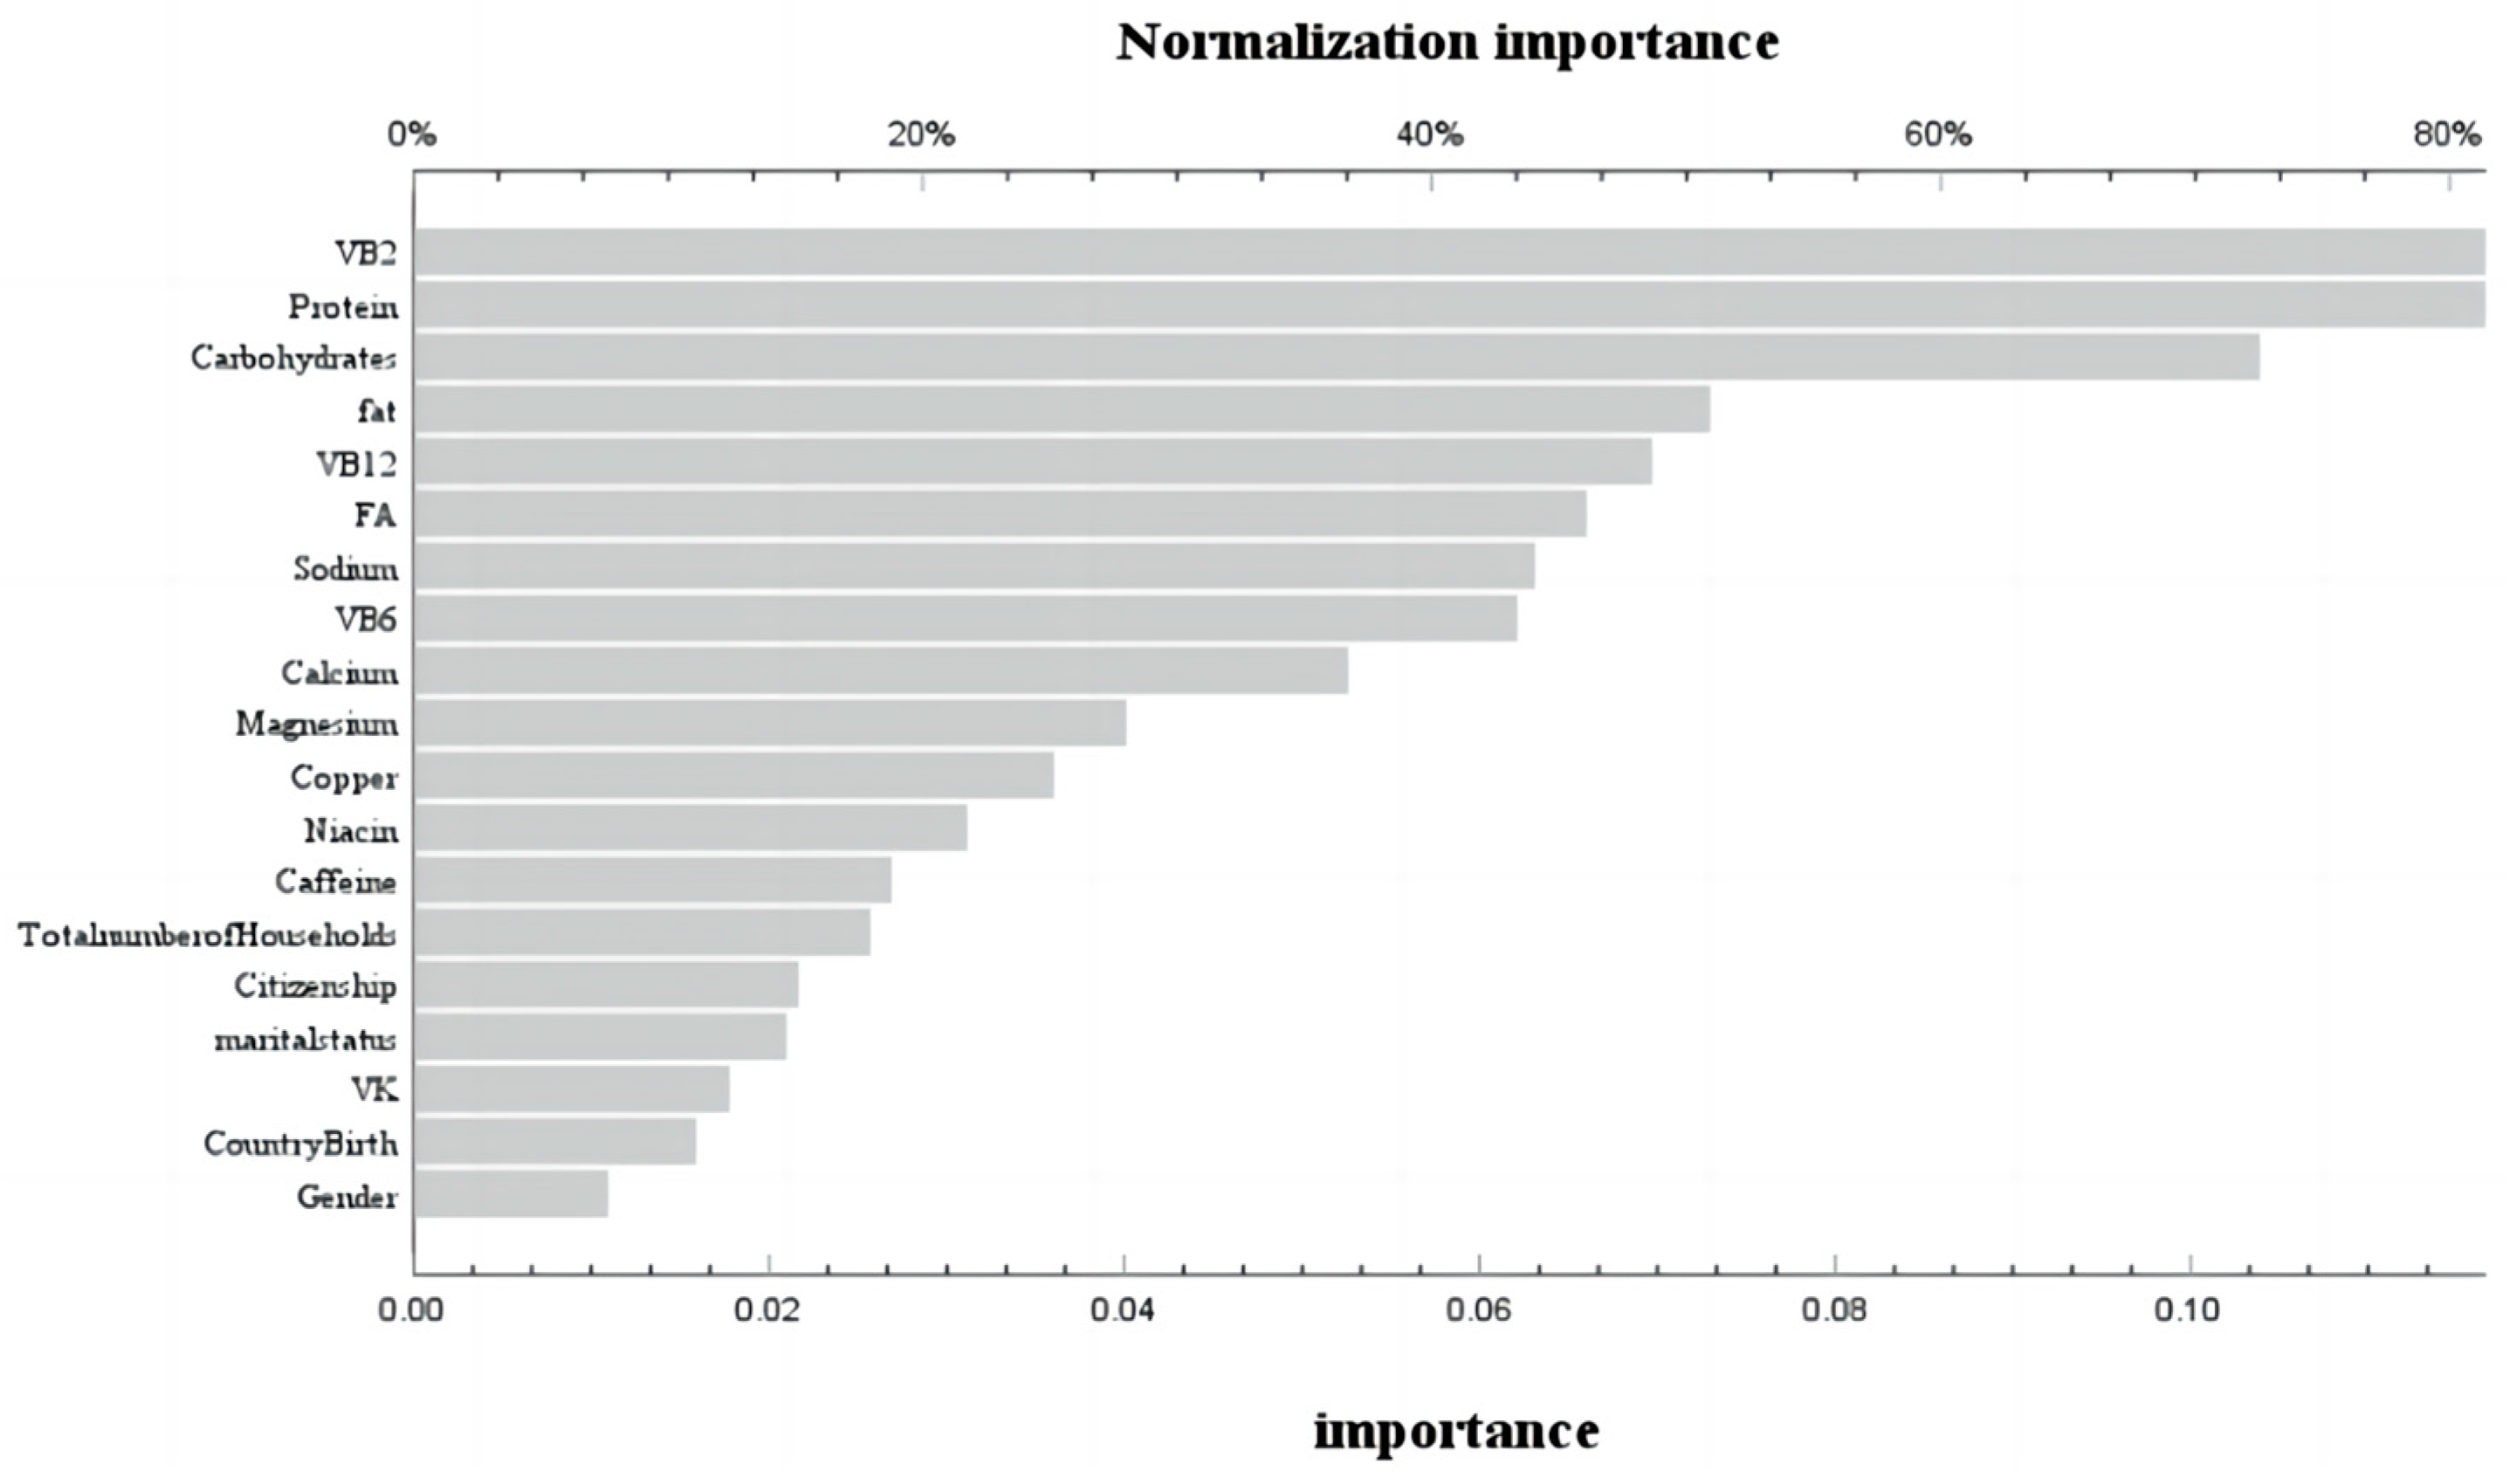
3.3. Machine Learning Using Neural Network Models

During the phase of model development and validation, we employed machine learning techniques and artificial neural network models to ascertain the relative significance of dietary variables associated with bone mass status at different stages of life. These variables encompassed macronutrients (carbohydrates, protein, fat, and cholesterol) as well as micronutrients (vitamin A, vitamin E, total folate, vitamin B12, vitamin C, vitamin K, calcium, phosphorus, magnesium, selenium, caffeine, thiamine, niacin, and vitamin B6). The receiver operating characteristic (ROC) curves for the neural network models across various age groups are depicted in Figure S1. The corresponding area under the curve (AUC) values were found to be 0.601 and 0.571, respectively, indicating a satisfactory fit of the models. In the age group ≤ 20 years, the training set achieved a prediction accuracy of 85%, while the prediction set achieved an accuracy of 86.1%. For the age group > 20 years, the training set had a prediction accuracy of 84.5%, and the prediction set had an accuracy of 85.2%. By assessing the contribution of variables in our neural network model, we identified that before reaching 20 years old, carbohydrates, protein, VB6, niacin, and dietary fat were found to be the five most influential factors affecting femoral bone mineral density (Figure 3). Conversely, after surpassing 20 years old, VB2, dietary protein, carbohydrates, dietary fat, and VB12 emerged as the five most significant variables influencing femoral bone mineral density (Figure 4).
After age-based grouping, logistic regression analysis was conducted to examine the association between the aforementioned dietary factors and femoral bone mineral density. The results indicated that individuals in the high-fat diet group were more likely to have normal bone mineral density before 20 years old (OR: 4.173, 95%CI: 1.007–17.289) without adjusting for other variables. However, after adjusting for all demographic factors, it was found that niacin intake had a beneficial effect on normal bone mineral density (OR: 1.062, 95%CI: 1.019–1.108), while vitamin B6 intake did not show any significant benefit (OR: 0.627, 95%CI: 0.408–0.965) (Table 4 and Table S2). After the age of 20, following adjustments for carbohydrate, protein, vitamin B6, niacin, dietary fat, vitamin B2, and vitamin B12 intake levels, it was observed that higher vitamin B2 intake (OR: 1.153; 95%CI: 1.04–1.278) had a positive association with normal bone mineral density. Conversely, no significant benefit on normal bone mineral density was found for vitamin B6 intake (OR: 0.842; 95%CI: 0.726–0.976). Furthermore, after accounting for all confounding factors in the analysis model, increased vitamin B2 intake remained significantly beneficial for maintaining normal bone mineral density (OR: 1.288; 95%CI: 1.102–1.506) (Table 4, Tables S1 and S2). Additionally, although not statistically significant across different age groups, the impact of a high-fat diet on bone mineral density varied.

4. Discussion

In our cross-sectional study, we identified that the age of 20 serves as a turning point in the relationship between age and femoral bone density. Before 20 years old, femoral bone mineral density showed a significant positive correlation with age, while after 20 years old, it showed a negative correlation. The peak of femoral bone mineral density was reached at 20 years old. At the same time, we found through an artificial neural network model for machine learning that in dietary factors, carbohydrates, protein, vitamin B6, niacin, and dietary fat were the five most important variables affecting femoral bone mineral density before 20 years old. In contrast, after 20 years old, it was vitamin B2, dietary protein, carbohydrates, dietary fat, and vitamin B12. In the case of no adjustment for other variables, a high-fat diet was a protective factor for normal bone before 20 years old. After adjusting carbohydrates, protein, vitamin B6, niacin, dietary fat, vitamin B2, and vitamin B12, it was found that vitamin B2 was a protective factor for normal bone after 20 years old, while vitamin B6 was a risk factor for normal bone. After adjusting for all confounding factors, we found that vitamin B6 was a risk factor for normal bone mass before the age of 20, while niacin was a protective factor. After passing the age of 20, vitamin B2 was a protective factor for normal bone mass. Furthermore, we found that the effects of a high-fat diet on femoral bone mineral density showed opposite trends in different age groups. Compared with a normal diet, a high-fat diet was beneficial for bone mineral density before the age of 20, but it became a risk factor for bone mineral density after the age of 20. This result suggests that a high-fat diet has different effects in different age groups.
Previous studies investigating the changes in femur bone mineral density have focused more on adults or postmenopausal women [14,15]. In our study, all adolescents and adults before the age of 18 were included in the analysis to observe the changes in femoral bone mineral density throughout the life cycle. Our results showed that peak bone mineral density was reached in our population at the age of 20, which is consistent with the results of a longitudinal study on bone mineral density conducted by Claudie Berger in Canada [16]. The results showed that the peak bone mineral density of the femoral neck was designated at the ages of 16 to 19 years old in women and the age of 17 years old in men. The bone mineral density of the femoral neck began to decline after 19 years old, which is consistent with most studies conducted in Western countries. In any case, a cross-sectional study conducted in South Korea to evaluate the relationship between hypogonadism and bone mineral density found that the bone mineral density of patients with isolated hypogonadotropic hypogonadism decreased as early as 25 years old, which is significantly earlier than the control group [17]. A population study conducted in Taiyuan found that the peak bone mineral density of the femoral neck occurred at the ages of 31–35 years old in women and at about 25 years old in men [18]. Based on the above studies, the peak bone mass age of Eastern populations is later than that of Western populations. Previous studies have found that the factors impacting the peak bone mass of both groups include genetic variation, environmental factors, and dietary nutrition factors. Among them, genetic and environmental factors, as unchangeable factors, can explain 44% to 88% of BMD [19,20]. But as controllable and variable factors, behavioral factors such as nutrition have the greatest impact on the residual variability of bone mass [21].
Existing studies on the impact of dietary patterns on bone mass have found that the consumption of fruits and vegetables is a protective factor for high bone mineral density. The precise mechanisms underlying this phenomenon remain elusive; however, the high concentration of vitamins and minerals found in fruits and vegetables is proposed as a potential explanatory factor [22]. For nutrients traditionally associated with bone health, such as vitamin D and calcium, studies have found that although bones need them to maintain stability, consuming more vitamin D and calcium is not beneficial for bone health in all cases [23]. In addition to the above two factors, the effects of other nutrients on bone mineral density are still inconclusive, and the extent to which each factor affects bone mineral density is unknown.
We constructed an artificial neural network model with socio-economic factors and dietary nutrient intake as independent variables and bone status as dependent variables. Further analysis of the independent variables revealed that carbohydrates, dietary protein, VB6, niacin, and dietary fat were the five most important variables affecting femoral bone mineral density before the age of 20, while VB2, dietary protein, carbohydrates, dietary fat, and VB12 were the five most important variables affecting femoral bone mineral density after the age of 20 [24]. Correlation analysis found that VB6 was a risk factor for normal bone before 20 years old, while niacin was a protective factor. After 20 years of age, VB2 was a protective factor for normal bone. We found that vitamin B2 was a protective factor for normal bone after 20 years of age, which is consistent with the results of Abrahamsen et al. Adult women with the lowest vitamin B2 intake had the lowest femoral neck bone mineral density and the highest risk of fracture [25]. In vitro, experiments have shown that B2 and its photoproducts can reduce the RANKL (receptor activator of nuclear factor-κB ligand)/OPG (osteoprotegerin) ratio by enhancing the expression of OPG in pre-osteoblast MC3T3-E1 cells [26]. At the same time, we found that VB6 before 20 years old is a risk factor for normal bone, while most current studies on adults have found that lower B6 levels are associated with higher risks of bone loss and hip fractures [27]. Conversely, some studies have shown that the effect of vitamin B6 on bone health may change due to age, gender, and disease status, which may be the reason for different results [27]. Niacin after 20 years old is a protective factor, but most studies have found that niacin intake in the diet of premenopausal women is significantly positively correlated with BMD. So far, few studies have explored the effect of niacin on bone health before the age of 20 years. Two early studies from the same laboratory found that when young [28] and old [29] chickens were supplemented with different doses of niacin, there was no significant difference in bone mineral content in chickens, which requires further research. At the same time, although there was no statistical difference, we found a negative correlation between vitamin B12 and bone status before the age of 20. This is similar to the findings of Ann et al., in that vitamin B12 deficiency was associated with low BMD, increased risk of fractures, and osteoporosis. This may be related to the risk of vitamin B12 deficiency [30], which leads to the increased stimulation of osteoclastogenesis and the inhibition of osteoblasts.
Our study found that according to the classification and correlation analysis of the three major nutrient function ratios, low-carbohydrate diet and high-protein diet were risk factors for bone status after 20 years old. This is consistent with the research results that low-carbohydrate diet is more beneficial to prevent bone loss, and high-carbohydrate intake is associated with a decrease in distal radial BMD [31]. Researchers believe that this may be closely related to the form of carbohydrates. Current evidence suggests that diets high in refined sugar may affect bone growth and strength, with sucrose-fed rats having lower femur strength [32], while high-glucose interventions are detrimental to osteoblast proliferation and differentiation [33], and high-fructose diets also reduce calcium ion transport in animals [34]. While most studies have found that cellulose can increase bone mass, Kim found that calcium ion absorption increased in adults and menopausal women after using inulin interventions [35]. Only one prospective study has shown a negative correlation between dietary protein and bone [36]. This is consistent with our findings, where the researchers suggested that this negative correlation may be due to low calcium intake in children. This was supported by the report by Vatanparast et al., where the positive effect of dietary protein on bone mass was most significant in those who consumed sufficient calcium (>1000 mg/d) [37]. More studies have shown that long-term protein intake positively predicts whole-body BMC. Most prospective and cross-sectional studies support evidence of a positive correlation between protein intake and bone [38,39]. In studies on the effects of three major energy nutrients on bone mineral density, researchers have differing views on the effects of fat intake, or high-fat diet (HFD), on bone mineral density [40,41]. HFD has a complex effect on bone health. Early studies have treated weight gain as a protective factor for bone health, while HFD causes weight gain [42]. A cohort study of bone mineral density and body weight in elderly men and women conducted at Framingham found that body weight and weight change had a strong effect on bone mineral density, which was often beneficial [43].
On the other hand, most recent studies have found that short-term HFD can induce bone loss [44,45], while long-term HFD-exposed mice had reduced bone mass, which may be mainly due to the increase in adipocytes by affecting the bone marrow microenvironment [46]. Although healthy weight gain can benefit bone health by increasing the load-bearing capacity, these benefits may be lost in the case of HFD-induced weight gain [47]. A survey of a population’s bone mineral density and lifestyle habits showed that fatty diets were the most important risk factor for early bone loss in women, except for genetics. Most studies support the idea that an HFD can regulate the differentiation of bone marrow mesenchymal stem cells and affect bone health. Compared with the osteogenic differentiation of bone marrow mesenchymal stem cells, consuming a high amount of fat leads to the differentiation of bone marrow mesenchymal stem cells into adipocytes, which accumulate in the bone marrow cavity and form bone marrow adipose tissue (BMAT) [48]. Studies have found that a decrease in bone mass is often accompanied by an increase in bone marrow adipose tissue. Bone marrow obesity caused by an HFD will expand adipose tissue and lead to chronic low-grade systemic inflammation [45]. The accumulation of ectopic adipocytes in the bone marrow cavity may damage bone regeneration and lead to bone fat imbalance, leading to osteoporosis [46]. In contrast, our study found that a high-fat diet has opposite effects in different age groups. It is a protective factor before 20 years of age, but it becomes a harmful factor after 20 years of age. We believe that this may be the reason why the peak of bone mineral density in Western populations occurs earlier than that in Eastern populations. High-fat diet has a similar effect to “credit card” on bone mineral density, which overdraws bone mineral density at an earlier age. Although there was no statistical difference, we found that vitamin B12 was negatively correlated with bone status before the age of 20. This trend of a negative impact of nutrient intake due to age may provide a basis for better dietary recommendations to improve bone health in the future.
Though it is important to note that other factors should also be considered in the use of the neural network model, the accuracy and stability of the model should be further verified and adjusted [47]. Firstly, age is an important variable that is usually closely related to bone health. In the neural network model we built, although we used age as a stratification factor, we used 20 years old as the dividing line, which focused more on the factors of bone loss in youth. Similarly, gender is also an important variable that may affect bone status. However, we found no statistical correlation between gender and bone status in the preliminary correlation analysis results, which goes against most people’s research [20,48]. It is generally believed that women have a lower peak bone mass than men throughout their lives, and their bone loss rate after menopause is faster than men’s. Studies have shown that women have a higher prevalence of osteoporotic fractures than men. At the same time, women may be more susceptible to the adverse effects of high-fat diets, leading to a decline in bone status. Through further research and validation, we can gain a deeper understanding of the contribution of each variable to bone status.
Compared to previously published articles, this study possesses several advantages. Firstly, the utilization of NHANES data ensures high-quality data through meticulous and continuous quality control measures. Our study employed a substantial sample size of 5403 participants and determined that the peak age for population bone mineral density occurs at 20 years old. Secondly, we applied machine learning techniques utilizing artificial neural network algorithms to assess the contribution of each dietary variable to bone mineral density in different age groups, thereby investigating the factors influencing early peak bone mineral density.
However, our study has certain limitations. Firstly, the demographic and dietary data were self-reported, which may introduce measurement errors and recall bias. Secondly, our study design was cross-sectional in nature, necessitating prospective studies to elucidate the potential associations between dietary factors, age, and bone mineral density. Additionally, due to the unavailability of recorded vitamin D intake in the National Health and Nutrition Examination Survey (NHANES), it could not be included in our analysis.

5. Conclusions

By conducting an in-depth analysis of the NHANES database, this study reveals that dietary factors exert divergent effects on bone health across different age groups, implying the necessity of implementing tailored dietary strategies to maintain optimal bone health at distinct life stages.

Supplementary Materials

The following supporting information can be downloaded at: https://www.mdpi.com/article/10.3390/nu16060758/s1, Figure S1: ROC curves of neural network models at different age stages; Table S1: Logistic regression analysis of bone status in research subjects of different age groups (model 2); Table S2: Logistic regression analysis of bone status in research subjects of different age groups (model 3).

Author Contributions

This study was conceived, designed, analyzed, and written by J.W. and Y.Z.; M.L., Y.Y. and B.Z. assisted in the literature search and data analysis. J.C. directed statistical analysis and participated in questionnaire design and review editing. J.C. reviewed and commented on the manuscript and contributed to the finalization of the manuscript. All authors have read and agreed to the published version of the manuscript.

Funding

This study was supported by Natural Science Foundation of Hunan Province (2022JJ30771), the Natural Science Foundation of Changsha (No. kq2202130), the Graduate Scientific Research Innovation Project of Hunan Province (No. CX20230321), and the Graduate Scientific Research Innovation Project of Central South University (No. 1053320221388; No. 1053320221883).

Institutional Review Board Statement

The study was conducted in accordance with the Declaration of Helsinki and was approved by the Institutional Review Board of the National Centre for Health Statistics.

Informed Consent Statement

All participants provided informed consent before enrollment.

Data Availability Statement

All NHANES data for this study are publicly available and can be found here: https://wwwn.cdc.gov/nchs/nhanes (accessed on 15 January 2024).

Acknowledgments

We thank the staff at the National Center for Health Statistics of the Centers for Disease Control for designing, collecting, and collating the NHANES data and creating the public database.

Conflicts of Interest

The authors declare no conflicts of interest.

References

  1. Ensrud, K.E.; Crandall, C.J. Osteoporosis. Ann. Intern. Med. 2017, 167, ITC17–ITC32. [Google Scholar] [CrossRef] [PubMed]
  2. Brown, C. Osteoporosis: Staying strong. Nature 2017, 550, S15–S17. [Google Scholar] [CrossRef] [PubMed]
  3. Legrand, M.A.; Chapurlat, R. Imminent fracture risk. Jt. Bone Spine 2021, 88, 105105. [Google Scholar] [CrossRef] [PubMed]
  4. Lane, N.E. Epidemiology, etiology, and diagnosis of osteoporosis. Am. J. Obstet. Gynecol. 2006, 194, S3–S11. [Google Scholar] [CrossRef]
  5. Mundy, G.R. Osteoporosis: Pathophysiology and non-pharmacological management. Best Pract. Res. Clin. Rheumatol. 2001, 15, 727–745. [Google Scholar] [CrossRef] [PubMed]
  6. Weaver, C.M.; Gordon, C.M.; Janz, K.F.; Kalkwarf, H.J.; Lappe, J.M.; Lewis, R.; O’Karma, M.; Wallace, T.C.; Zemel, B.S. Erratum to: The National Osteoporosis Foundation’s position statement on peak bone mass development and lifestyle factors: A systematic review and implementation recommendations. Osteoporos. Int. 2016, 27, 1387. [Google Scholar] [CrossRef]
  7. Rubio-Gutierrez, J.C.; Mendez-Hernandez, P.; Gueguen, Y.; Galichon, P.; Tamayo-Ortiz, M.; Haupt, K.; Medeiros, M.; Barbier, O.C. Overview of Traditional and Environmental Factors Related to Bone Health. Environ. Sci. Pollut. Res. 2022, 29, 31042–31058. [Google Scholar] [CrossRef] [PubMed]
  8. Li, T.; Xie, Y.; Wang, L.; Huang, G.; Cheng, Y.; Hou, D.; Liu, W.; Zhang, T.; Liu, J. The Association between Lead Exposure and Bone Mineral Density in Childhood and Adolescence: Results from NHANES 1999–2006 and 2011–2018. Nutrients 2022, 14, 1523. [Google Scholar] [CrossRef]
  9. Ho, S.C.; Chan, S.G.; Yi, Q.; Wong, E.; Leung, P.C. Soy intake and the maintenance of peak bone mass in Hong Kong Chinese women. J. Bone Miner. Res. 2001, 16, 1363–1369. [Google Scholar] [CrossRef]
  10. Savegnago, R.P.; Nunes, B.N.; Caetano, S.L.; Ferraudo, A.S.; Schmidt, G.S.; Ledur, M.C.; Munari, D.P. Comparison of logistic and neural network models to fit to the egg production curve of White Leghorn hens. Poult. Sci. 2011, 90, 705–711. [Google Scholar] [CrossRef]
  11. Warin, K.; Limprasert, W.; Suebnukarn, S.; Paipongna, T.; Jantana, P.; Vicharueang, S. Maxillofacial fracture detection and classification in computed tomography images using convolutional neural network-based models. Sci. Rep. 2023, 13, 3434. [Google Scholar] [CrossRef]
  12. Alanazi, R. Identification and Prediction of Chronic Diseases Using Machine Learning Approach. J. Healthc. Eng. 2022, 2022, 2826127. [Google Scholar] [CrossRef] [PubMed]
  13. Deng, Y.; Chen, Y.; He, Q.; Wang, X.; Liao, Y.; Liu, J.; Liu, Z.; Huang, J.; Song, T. Bone age assessment from articular surface and epiphysis using deep neural networks. Math. Biosci. Eng. 2023, 20, 13133–13148. [Google Scholar] [CrossRef] [PubMed]
  14. Gallagher, C.M.; Moonga, B.S.; Kovach, J.S. Cadmium, follicle-stimulating hormone, and effects on bone in women age 42–60 years, NHANES III. Environ. Res. 2010, 110, 105–111. [Google Scholar] [CrossRef] [PubMed]
  15. Chen, W.; Melamed, M.L.; Abramowitz, M.K. Serum bicarbonate and bone mineral density in US adults. Am. J. Kidney Dis. 2015, 65, 240–248. [Google Scholar] [CrossRef] [PubMed]
  16. Hassanabadi, N.; Berger, C.; Papaioannou, A.; Cheung, A.M.; Rahme, E.; Leslie, W.D.; Goltzman, D.; Morin, S.N. Variation in bone mineral density and fractures over 20 years among Canadians: A comparison of the Canadian Multicenter Osteoporosis Study and the Canadian Longitudinal Study on Aging. Osteoporos. Int. 2023, 34, 357–367. [Google Scholar] [CrossRef] [PubMed]
  17. Cheng, X.; Zhao, K.; Zha, X.; Du, X.; Li, Y.; Chen, S.; Wu, Y.; Li, S.; Lu, Y.; Zhang, Y.; et al. Opportunistic Screening Using Low-Dose CT and the Prevalence of Osteoporosis in China: A Nationwide, Multicenter Study. J. Bone Miner. Res. 2021, 36, 427–435. [Google Scholar] [CrossRef] [PubMed]
  18. Elhakeem, A.; Heron, J.; Tobias, J.H.; Lawlor, D.A. Physical Activity Throughout Adolescence and Peak Hip Strength in Young Adults. Jama Netw. Open 2020, 3, e2013463. [Google Scholar] [CrossRef] [PubMed]
  19. Seeman, E. Growth in bone mass and size--are racial and gender differences in bone mineral density more apparent than real? J. Clin. Endocrinol. Metab. 1998, 83, 1414–1419. [Google Scholar]
  20. Prynne, C.J.; Mishra, G.D.; O’Connell, M.A.; Muniz, G.; Laskey, M.A.; Yan, L.; Prentice, A.; Ginty, F. Fruit and vegetable intakes and bone mineral status: A cross sectional study in 5 age and sex cohorts. Am. J. Clin. Nutr. 2006, 83, 1420–1428. [Google Scholar] [CrossRef]
  21. Seijo, M.; Bonanno, M.N.; Bryk, G.; Zeni, C.M.; Pita, M.D.P.M.; Zeni, S.N. Does Vitamin D Insufficiency Influence Prebiotic Effect on Calcium Absorption and Bone Retention? Calcif. Tissue Int. 2022, 111, 300–312. [Google Scholar] [CrossRef]
  22. Martiniakova, M.; Babikova, M.; Mondockova, V.; Blahova, J.; Kovacova, V.; Omelka, R. The Role of Macronutrients, Micronutrients and Flavonoid Polyphenols in the Prevention and Treatment of Osteoporosis. Nutrients 2022, 14, 523. [Google Scholar] [CrossRef] [PubMed]
  23. Abrahamsen, B.; Madsen, J.S.; Tofteng, C.L.; Stilgren, L.; Bladbjerg, E.M.; Kristensen, S.R.; Brixen, K.; Mosekilde, L. Are effects of MTHFR (C677T) genotype on BMD confined to women with low folate and riboflavin intake? Analysis of food records from the Danish osteoporosis prevention study. Bone 2005, 36, 577–583. [Google Scholar] [CrossRef] [PubMed]
  24. Chaves, N.A.; Yano, C.L.; Paredes-Gamero, E.J.; Machado, D.; Justo, G.Z.; Peppelenbosch, M.P.; Ferreira, C.V. Riboflavin and photoproducts in MC3T3-E1 differentiation. Toxicol. In Vitro 2010, 24, 1911–1919. [Google Scholar] [CrossRef] [PubMed]
  25. McLean, R.R.; Jacques, P.F.; Selhub, J.; Fredman, L.; Tucker, K.L.; Samelson, E.J.; Kiel, D.P.; Cupples, L.A.; Hannan, M.T. Plasma B vitamins, homocysteine, and their relation with bone loss and hip fracture in elderly men and women. J. Clin. Endocrinol. Metab. 2008, 93, 2206–2212. [Google Scholar] [CrossRef] [PubMed]
  26. Johnson, N.E.; Harland, B.F.; Ross, E.; Gautz, L.; Dunn, M.A. Effects of dietary aluminum and niacin on chick tibiae. Poult. Sci. 1992, 71, 1188–1195. [Google Scholar] [CrossRef] [PubMed]
  27. Johnson, N.E.; Qiu, X.L.; Gautz, L.D.; Ross, E. Changes in dimensions and mechanical properties of bone in chicks fed high levels of niacin. Food Chem. Toxicol. 1995, 33, 265–271. [Google Scholar] [CrossRef] [PubMed]
  28. Rondanelli, M.; Tartara, A.; Fossari, F.; Vecchio, V.; Faliva, M.A.; Naso, M.; Perna, S.; Nichetti, M.; Peroni, G. Adequate Intake and Supplementation of B Vitamins, in Particular Folic Acid, can Play a Protective Role in Bone Health. Curr. Aging Sci. 2022, 15, 110–120. [Google Scholar] [CrossRef] [PubMed]
  29. Tjaderhane, L.; Larmas, M. A high sucrose diet decreases the mechanical strength of bones in growing rats. J. Nutr. 1998, 128, 1807–1810. [Google Scholar] [CrossRef]
  30. Terada, M.; Inaba, M.; Yano, Y.; Hasuma, T.; Nishizawa, Y.; Morii, H.; Otani, S. Growth-inhibitory effect of a high glucose concentration on osteoblast-like cells. Bone 1998, 22, 17–23. [Google Scholar] [CrossRef]
  31. Douard, V.; Sabbagh, Y.; Lee, J.; Patel, C.; Kemp, F.W.; Bogden, J.D.; Lin, S.; Ferraris, R.P. Excessive fructose intake causes 1,25-(OH)(2)D(3)-dependent inhibition of intestinal and renal calcium transport in growing rats. Am. J. Physiol. Endocrinol. Metab. 2013, 304, E1303–E1313. [Google Scholar] [CrossRef]
  32. Zhang, Q.; Ma, G.; Greenfield, H.; Zhu, K.; Du, X.; Foo, L.H.; Hu, X.; Fraser, D.R. The association between dietary protein intake and bone mass accretion in pubertal girls with low calcium intakes. Br. J. Nutr. 2010, 103, 714–723. [Google Scholar] [CrossRef]
  33. Vatanparast, H.; Bailey, D.A.; Baxter-Jones, A.D.; Whiting, S.J. The effects of dietary protein on bone mineral mass in young adults may be modulated by adolescent calcium intake. J. Nutr. 2007, 137, 2674–2679. [Google Scholar] [CrossRef]
  34. Remer, T.; Manz, F.; Alexy, U.; Schoenau, E.; Wudy, S.A.; Shi, L. Long-term high urinary potential renal acid load and low nitrogen excretion predict reduced diaphyseal bone mass and bone size in children. J. Clin. Endocrinol. Metab. 2011, 96, 2861–2868. [Google Scholar] [CrossRef]
  35. Ekbote, V.H.; Khadilkar, A.V.; Chiplonkar, S.A.; Khadilkar, V.V. Determinants of bone mineral content and bone area in Indian preschool children. J. Bone Miner. Metab. 2011, 29, 334–341. [Google Scholar] [CrossRef]
  36. Fazeli, P.K.; Horowitz, M.C.; MacDougald, O.A.; Scheller, E.L.; Rodeheffer, M.S.; Rosen, C.J.; Klibanski, A. Marrow fat and bone--new perspectives. J. Clin. Endocrinol. Metab. 2013, 98, 935–945. [Google Scholar] [CrossRef]
  37. Gao, S.; Qian, X.; Huang, S.; Deng, W.; Li, Z.; Hu, Y. Association between macronutrients intake distribution and bone mineral density. Clin. Nutr. 2022, 41, 1689–1696. [Google Scholar] [CrossRef] [PubMed]
  38. Felson, D.T.; Zhang, Y.; Hannan, M.T.; Anderson, J.J. Effects of weight and body mass index on bone mineral density in men and women: The Framingham study. J. Bone Miner. Res. 1993, 8, 567–573. [Google Scholar] [CrossRef] [PubMed]
  39. Shu, L.; Beier, E.; Sheu, T.; Zhang, H.; Zuscik, M.J.; Puzas, E.J.; Boyce, B.F.; Mooney, R.A.; Xing, L. High-fat diet causes bone loss in young mice by promoting osteoclastogenesis through alteration of the bone marrow environment. Calcif. Tissue Int. 2015, 96, 313–323. [Google Scholar] [CrossRef] [PubMed]
  40. Rharass, T.; Lucas, S. Mechanisms In Endocrinology: Bone marrow adiposity and bone, a bad romance? Eur. J. Endocrinol. 2018, 179, R165–R182. [Google Scholar] [CrossRef] [PubMed]
  41. Zhang, Z.; Zhang, Z.; Pei, L.; Zhang, X.; Li, B.; Meng, Y.; Zhou, X. How high-fat diet affects bone in mice: A systematic review and meta-analysis. Obes. Rev. 2022, 23, e13493. [Google Scholar] [CrossRef]
  42. Muruganandan, S.; Ionescu, A.M.; Sinal, C.J. At the Crossroads of the Adipocyte and Osteoclast Differentiation Programs: Future Therapeutic Perspectives. Int. J. Mol. Sci. 2020, 21, 2277. [Google Scholar] [CrossRef]
  43. Chen, X.; Wang, C.; Zhang, K.; Xie, Y.; Ji, X.; Huang, H.; Yu, X. Reduced femoral bone mass in both diet-induced and genetic hyperlipidemia mice. Bone 2016, 93, 104–112. [Google Scholar] [CrossRef]
  44. Deng, P.; Yuan, Q.; Cheng, Y.; Li, J.; Liu, Z.; Liu, Y.; Li, Y.; Su, T.; Wang, J.; Salvo, M.E.; et al. Loss of KDM4B exacerbates bone-fat imbalance and mesenchymal stromal cell exhaustion in skeletal aging. Cell Stem Cell 2021, 28, 1057–1073. [Google Scholar] [CrossRef] [PubMed]
  45. Fabiani, R.; Naldini, G.; Chiavarini, M. Dietary Patterns in Relation to Low Bone Mineral Density and Fracture Risk: A Systematic Review and Meta-Analysis. Adv. Nutr. 2019, 10, 219–236. [Google Scholar] [CrossRef] [PubMed]
  46. Orozco, P. Atherogenic lipid profile and elevated lipoprotein (a) are associated with lower bone mineral density in early postmenopausal overweight women. Eur. J. Epidemiol. 2004, 19, 1105–1112. [Google Scholar] [CrossRef] [PubMed]
  47. Liu, J.; Fu, F. Convolutional neural network model by deep learning and teaching robot in keyboard musical instrument teaching. PLoS ONE 2023, 18, e0293411. [Google Scholar] [CrossRef]
  48. Han, H.; Chen, S.; Wang, X.; Jin, J.; Li, X.; Li, Z. Association between muscle strength and mass and bone mineral density in the US general population: Data from NHANES 1999–2002. J. Orthop. Surg. Res. 2023, 18, 397. [Google Scholar] [CrossRef] [PubMed]
Figure 1. Flowchart for selecting research participants.
Nutrients 16 00758 g001
Figure 2. The correlation between age and femoral bone density. The solid blue line represents a smoothed curve fit between variables. The blue dashed band represents the 95% confidence interval for the fit.
Nutrients 16 00758 g002
Figure 3. Use of neural network models to score the importance and normal importance of selected variables before 20 years old.
Nutrients 16 00758 g003
Figure 4. Use of neural network models to score the importance and normal importance of selected variables after 20 years old.
Nutrients 16 00758 g004
Table 1. Demographic characteristics of the study subjects (n = 5603).
CharacteristicsTotal Number of Subjects (n = 5603)Statisticp Value
≤20>20
Gender 2.5650.109
Male11001905
Female10051593
Country of Birth 175.729<0.001
Mexican Americans18562577
Other Hispanic175739
Non-Hispanic white74182
Citizenship 22.335<0.001
Born or naturalized citizens18973006
Non-US citizens208487
Others05
Marital status 2640.290<0.001
Married112050
Widowhood1217
Divorce0430
Separation8108
Never married1087458
Living with a partner33234
other9651
Total number of households 1007.355<0.001
121509
21501028
3348708
4572562
5505377
6265160
>6244154
Annual household income 383.878<0.001
less than USD 20,000449629
USD 20,000 to 44,9996361059
USD 45,000 to 74,999474756
More than USD 75,000526527
others20527
Total femoral density(g/cm2)0.91 ± 0.18 0.96 ± 0.15 94.554<0.001
Table 2. Dietary intake of study subjects (n = 5603).
CharacteristicsTotal Number of Subjects (n = 5603)Statisticp Value
≤20>20
Energy (kcal)2262.71 ± 1082.292221.44 ± 1055.19−1.2860.198
Protein (g)79.16 ± 44.0984.90 ± 47.08−4.843<0.01
Carbohydrates (g)296.38 ± 147.61266.60 ± 131.92−7.885<0.01
Total fat (g)85.52 ± 46.5583.56 ± 48.21−2.3360.019
Fat energy supply769.66 ± 418.91752.04 ± 433.92−2.3360.019
The proportion of fat energy supply0.34 ± 0.080.33 ± 0.09−1.53<0.01
Cholesterol (mg)256.61 ± 212.22307.22 ± 251.91−7.341<0.01
Vitamin E 6.43 ± 4.807.95 ± 5.86−11.018<0.01
Total folic acid (μg)398.83 ± 300.08409.99 ± 248.63−4.312<0.01
Vitamin B12 (μg)5.38 ± 5.015.50 ± 8.62−3.571<0.01
Vitamin C (mg)93.72 ± 107.2587.86 ± 102.63−1.1080.268
Vitamin K (μg)63.04 ± 80.98 106.32 ± 152.39 −16.597<0.01
Calcium (mg)984.85 ± 639.68 924.24 ± 594.45 −3.308<0.01
Phosphorus (mg)1303.05 ± 695.55 1376.44 ± 705.68−4.446<0.01
Magnesium (mg)245.21 ± 130.73 307.18 ± 157.02 −17.139<0.01
Iron (mg)16.21 ± 9.85 15.63 ± 9.15 −1.6810.093
Zinc (mg)11.88 ± 7.71 12.26 ± 12.86 −0.4080.683
Selenium (μg)105.01 ± 60.74 116.62 ± 72.25 −6.146<0.01
Caffeine (mg)39.99 ± 72.38 176.02 ± 221.89 −33.095<0.01
Vitamin B2 (mg)2.15 ± 1.31 2.23 ± 1.33 −2.4250.015
Vitamin B1(mg)1.69 ± 1.01 1.67 ± 1.01 −0.7580.448
Niacin (mg)24.34 ± 15.14 26.11 ± 15.96 −4.9990.957
Vitamin B6 (mg)1.86 ± 1.28 2.10 ± 1.40 −7.146<0.01
Table 3. Correlation analysis between age and femoral bone density at different stages (n = 5603).
AgePearson’s Correlationp Value
≤20 years0.658<0.001
>20 years-0.307<0.001
Table 4. Logistic regression analysis of dietary factors and bone status.
Model 1Model 2Model 3
bp ValueORbp ValueORbp ValueOR
≤20 years
Vitamin B20.0210.651.021−0.0980.1630.906−0.3490.0750.705
Vitamin B60.0640.151.0660.0010.9961.001−0.4660.0340.627
Niacin0.0060.0931.0060.0120.1811.0120.0610.0041.062
Vitamin B120.0080.4951.00800.995100.9831
Carbohydrates stage
Appropriate 0.251 0.422 0.818
Low−0.1860.1520.830.2330.3461.2630.0740.7721.077
High−0.3040.2010.7380.0770.7611.08−0.2190.5780.803
Protein stage
Appropriate 0.188 0.221 0.082
Low−0.2890.1250.7490.1930.1741.212−0.5670.0790.567
High−0.1830.1690.833−0.0680.7640.935−0.320.2510.726
HFD stage
Appropriate
High1.4290.0494.1731.3880.0574.0071.1420.2863.133
>20 years
Vitamin B20.0240.4781.0250.1420.0071.1530.2530.0021.288
Vitamin B6−0.0580.1040.943−0.1720.0220.842−0.1250.1680.883
Niacin−0.0030.2880.9970.0040.5841.0040.0030.7651.003
Vitamin B12−0.0030.6530.997−0.0030.6890.997−0.0050.6960.995
Carbohydrates stage
Appropriate 0.031 0.057 0.068
Low−0.1230.2830.884−0.1170.3270.889−0.1660.2580.847
High0.2920.1091.3390.2910.1171.3380.3330.0891.396
Protein stage
Appropriate 0.077 0.356 0.529
Low0.2660.0851.3040.2140.1771.2390.1830.3031.2
High−0.080.4250.923−0.010.9240.99−0.0680.6220.934
HFD stage
Appropriate 1
High−0.0350.8970.966−0.0510.8520.95−0.0470.8781.048
Model 1 does not adjust any variables; in model 2, 7 variables were adjusted. Model 3 adjusts all variables such as age, gender, race, marital status, income poverty ratio, and education level.
Disclaimer/Publisher’s Note: The statements, opinions and data contained in all publications are solely those of the individual author(s) and contributor(s) and not of MDPI and/or the editor(s). MDPI and/or the editor(s) disclaim responsibility for any injury to people or property resulting from any ideas, methods, instructions or products referred to in the content.

