


Exploring Diet and Nutrient Insufficiencies across Age Groups: Insights from a Population-Based Study of Brazilian Adults

 , , , and
 Highlights
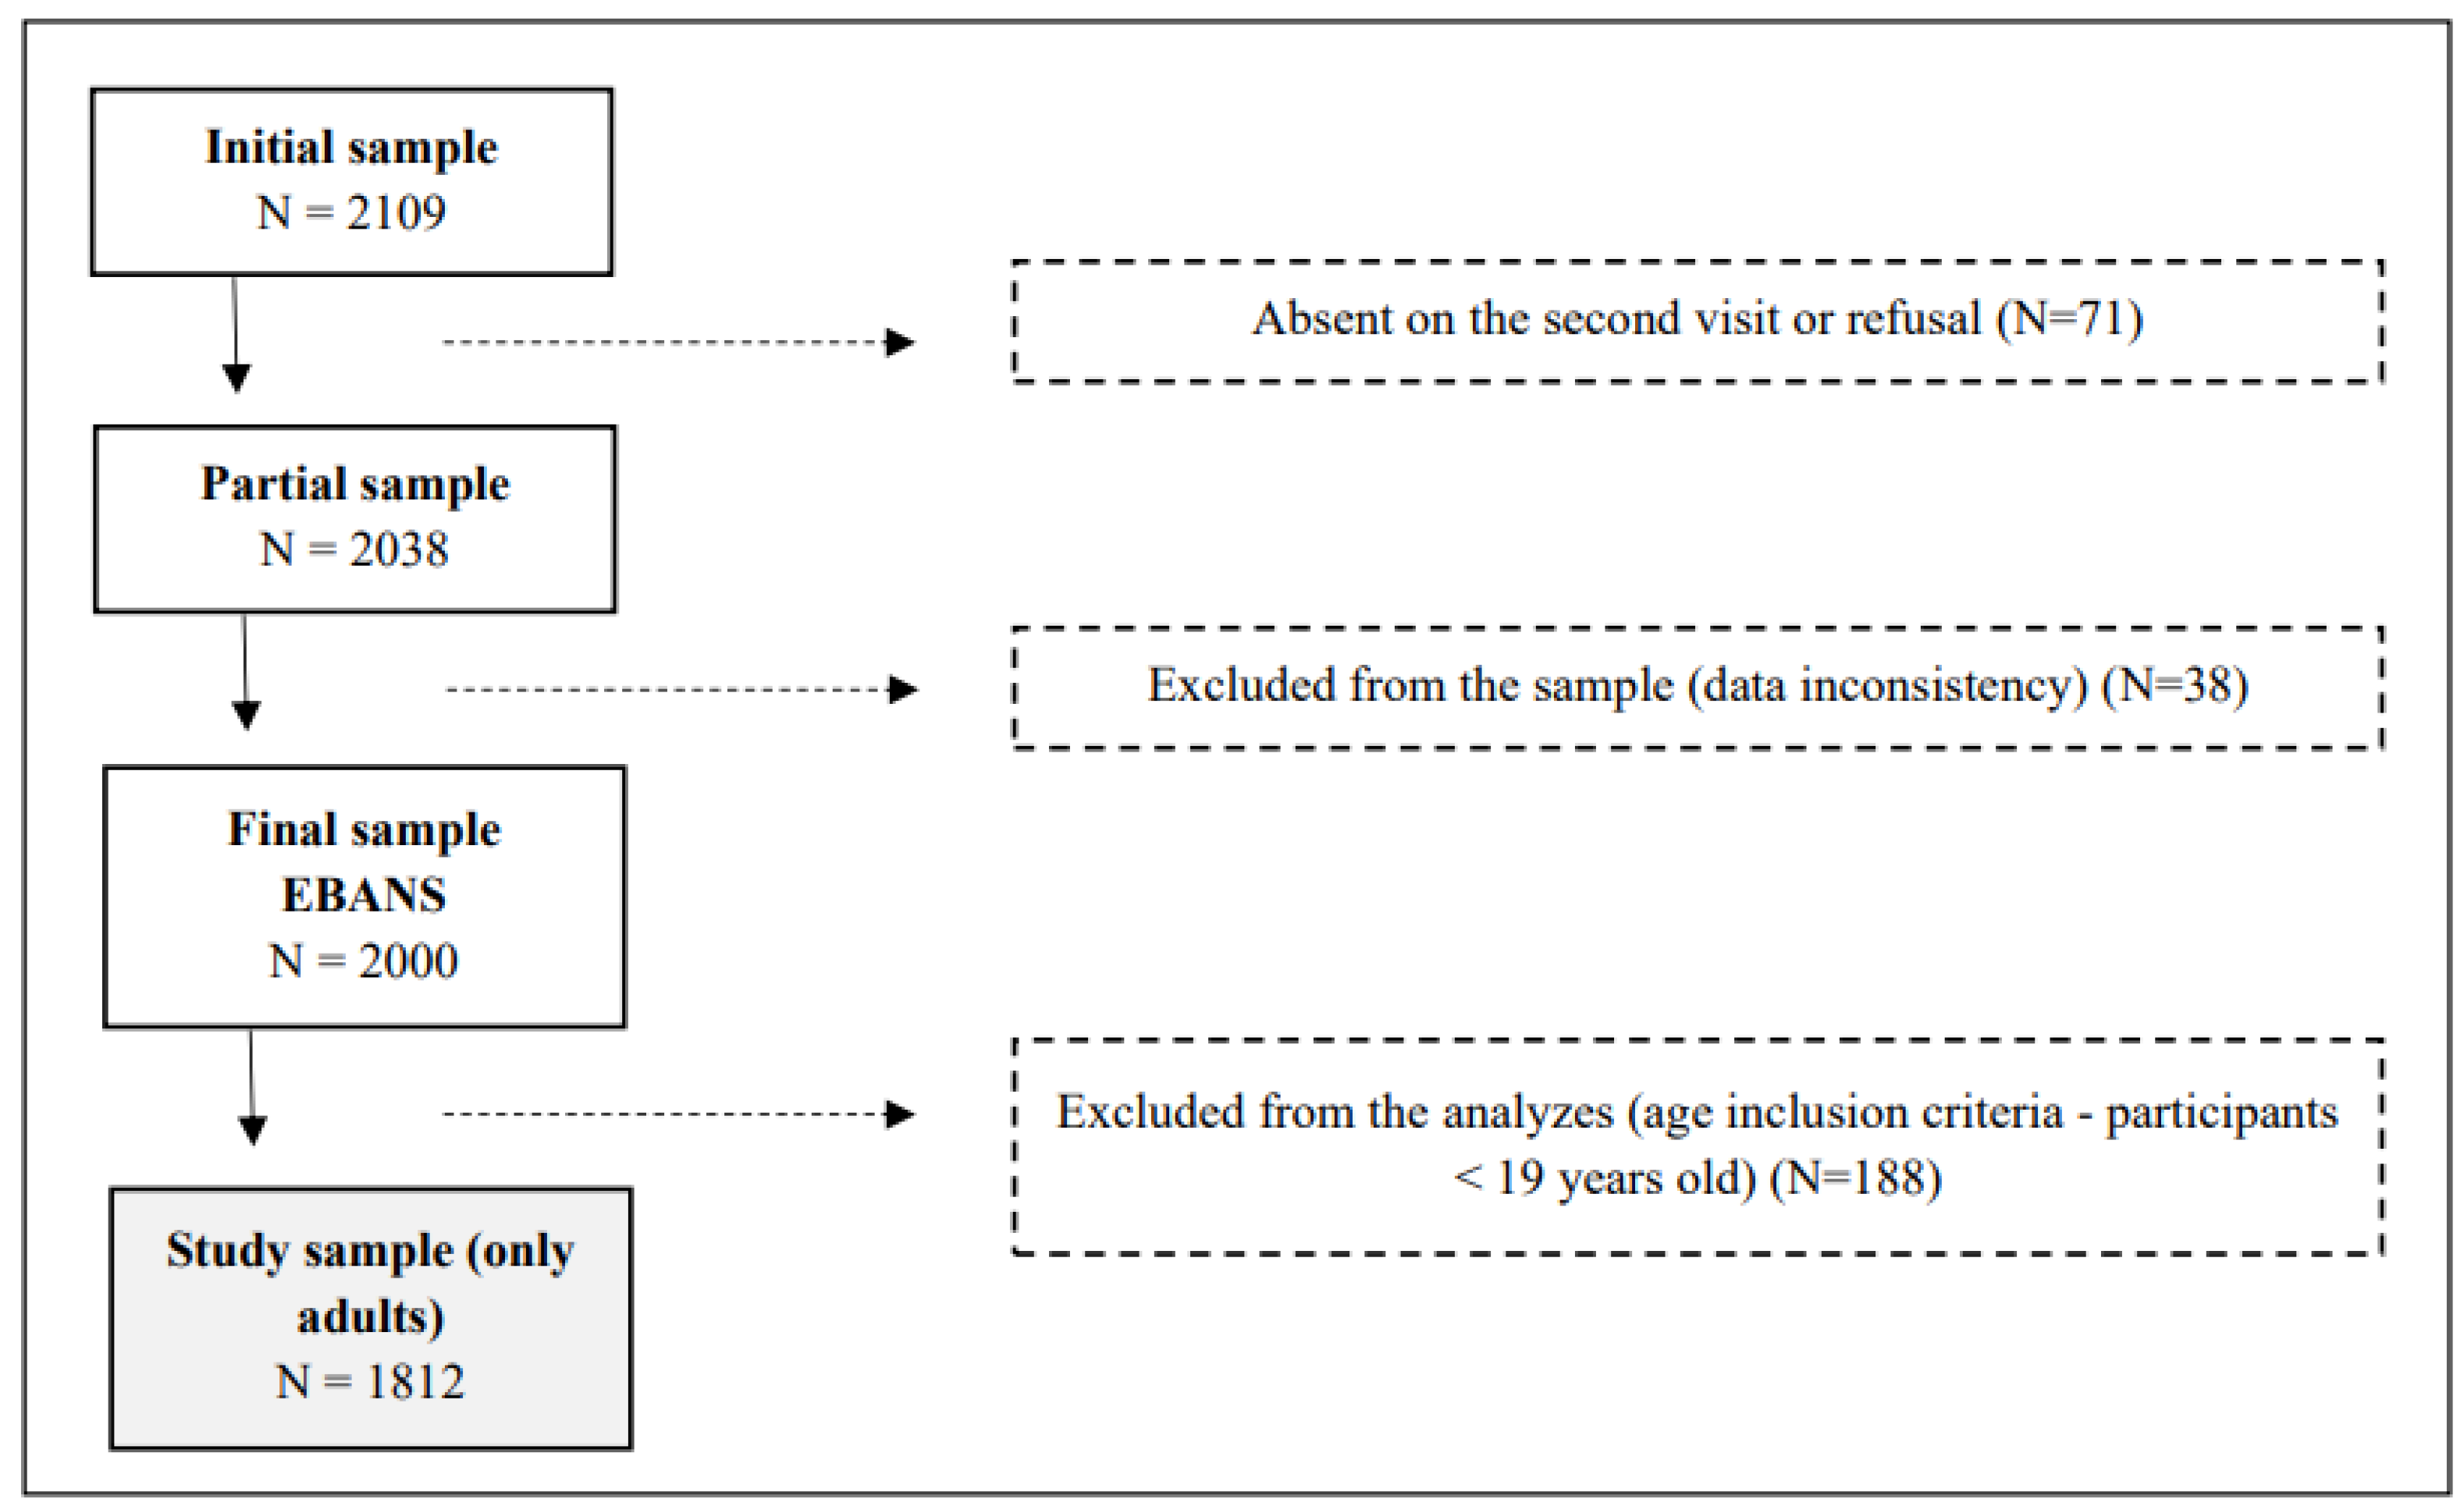
- The study investigates nutrient intakes and micronutrient inadequacies in a representative survey of Brazilian adults aged 19 to 65, utilizing a cross-sectional design featuring 1812 participants (EBANS study).
- It reveals that over 99% of individuals met protein intake recommendations, while significant inadequacies were found for vitamins D and E, calcium, and magnesium, particularly among women and older adults.
- The research highlights a concerning prevalence of excess weight and poor dietary habits, emphasizing the need for targeted public health policies to address these nutritional vulnerabilities.
- The findings underscore the importance of implementing educational programs that promote balanced diets and encourage healthier lifestyle choices.
Abstract
1. Introduction
2. Materials and Methods
2.1. Study Design and Settings
2.2. Subjects and Sample Size
2.3. Dietary Intake Assessment
2.4. Sociodemographic and Anthropometric Measurements
2.5. Statistical Analysis
3. Results
4. Discussion
5. Conclusions
Supplementary Materials
Author Contributions
Funding
Institutional Review Board Statement
Informed Consent Statement
Data Availability Statement
Acknowledgments
Conflicts of Interest
References
- Wilson, N.; Blakely, T.; Foster, R.H.; Hadorn, D.; Vos, T. Prioritizing risk factors to identify preventive interventions for economic assessment. Bull. World Health Organ. 2012, 90, 88–96. [Google Scholar] [CrossRef] [PubMed]
- Felisbino-Mendes, M.S.; Cousin, E.; Malta, D.C.; Machado, Í.E.; Ribeiro, A.L.P.; Duncan, B.B.; Schmidt, M.I.; Silva, D.A.S.; Glenn, S.; Afshin, A.; et al. The burden of non-communicable diseases attributable to high BMI in Brazil, 1990–2017: Findings from the Global Burden of Disease Study. Popul. Health Metr. 2020, 18, 18. [Google Scholar] [CrossRef] [PubMed]
- Afshin, A.; Sur, P.J.; Fay, K.A.; Cornaby, L.; Ferrara, G.; Salama, J.S.; Mullany, E.C.; Abate, K.H.; Abbafati, C.; Abebe, Z.; et al. Health effects of dietary risks in 195 countries, 1990–2017: A systematic analysis for the Global Burden of Disease Study 2017. Lancet 2019, 393, 1958–1972. [Google Scholar] [CrossRef] [PubMed]
- Oikonomou, E.; Psaltopoulou, T.; Georgiopoulos, G.; Siasos, G.; Kokkou, E.; Antonopoulos, A.; Vogiatzi, G.; Tsalamandris, S.; Gennimata, V.; Papanikolaou, A.; et al. Western Dietary Pattern Is Associated with Severe Coronary Artery Disease. Angiology 2018, 69, 339–346. [Google Scholar] [CrossRef] [PubMed]
- Mujica-Coopman, M.F.; Brito, A.; López de Romaña, D.; Ríos-Castillo, I.; Cori, H.; Olivares, M. Prevalence of Anemia in Latin America and the Caribbean. Food Nutr. Bull. 2015, 36, S119–S128. [Google Scholar] [CrossRef] [PubMed]
- Galani, Y.J.H.; Orfila, C.; Gong, Y.Y. A review of micronutrient deficiencies and analysis of maize contribution to nutrient requirements of women and children in Eastern and Southern Africa. Crit. Rev. Food Sci. Nutr. 2022, 62, 1568–1591. [Google Scholar] [CrossRef] [PubMed]
- Bailey, R.L.; Pac, S.G.; Fulgoni, V.L.; Reidy, K.C.; Catalano, P.M. Estimation of Total Usual Dietary Intakes of Pregnant Women in the United States. JAMA Netw. Open 2019, 2, e195967. [Google Scholar] [CrossRef]
- Bai, Y.; Herforth, A.; Masters, W.A. Global variation in the cost of a nutrient-adequate diet by population group: An observational study. Lancet Planet Health 2022, 6, e19–e28. [Google Scholar] [CrossRef]
- Perez-Escamilla, R.; Bermudez, O.; Buccini, G.S.; Kumanyika, S.; Lutter, C.K.; Monsivais, P.; Victora, C. Nutrition disparities and the global burden of malnutrition. BMJ 2018, 361, k2252. [Google Scholar] [CrossRef]
- Jura, M.; Kozak, L.P. Obesity and related consequences to ageing. Age 2016, 38, 23. [Google Scholar] [CrossRef]
- Wegmüller, R.; Bentil, H.; Wirth, J.P.; Petry, N.; Tanumihardjo, S.A.; Allen, L.; Williams, T.N.; Selenje, L.; Mahama, A.; Amoaful, E.; et al. Anemia, micronutrient deficiencies, malaria, hemoglobinopathies and malnutrition in young children and non-pregnant women in Ghana: Findings from a national survey. PLoS ONE 2020, 15, e0228258. [Google Scholar] [CrossRef] [PubMed]
- Popkin, B.M.; Corvalan, C.; Grummer-Strawn, L.M. Dynamics of the double burden of malnutrition and the changing nutrition reality. Lancet 2020, 395, 65–74. [Google Scholar] [CrossRef] [PubMed]
- Verly, E., Jr.; Marchioni, D.M.; Araujo, M.C.; Carli, E.D.; de Oliveira, D.C.R.S.; Yokoo, E.M.; Sichieri, R.; Pereira, R.A. Evolução da ingestão de energia e nutrientes no Brasil entre 2008–2009 e 2017–2018. Rev. De Saúde Pública 2021, 55 (Suppl. S1), 1–22. [Google Scholar] [CrossRef] [PubMed]
- Micha, R.; Coates, J.; Leclercq, C.; Charrondiere, U.R.; Mozaffarian, D. Global Dietary Surveillance: Data Gaps and Challenges. Food Nutr. Bull. 2018, 39, 175–205. [Google Scholar] [CrossRef]
- Miller, V.; Singh, G.M.; Onopa, J.; Reedy, J.; Shi, P.; Zhang, J.; Tahira, A.; Morris, M.L.S.; Marsden, D.P.; Kranz, S.; et al. Global Dietary Database 2017: Data availability and gaps on 54 major foods, beverages, and nutrients among 5.6 million children and adults from 1220 surveys worldwide. BMJ Glob. Health 2021, 6, e003585. [Google Scholar] [CrossRef]
- Simone, P.; Carolina, B.; Ty, B.; Pia, J.A.; Sabri, B.; Ling, C.; Anali, G.; Tue, C.; Arnold, D.; Selma, K.G.; et al. Estimating national and subnational nutrient intake distributions of global diets. Am. J. Clin. Nutr. 2022, 116, 551–560. [Google Scholar] [CrossRef]
- Fisberg, M.; Kovalskys, I.; Previdelli, A.N.; Zimberg, I.Z.; Del’Arco, A.P.W.T.; Ferrari, G.L.D.M. Brazilian Study of Nutrition and Health (EBANS)—Brazilian data of ELANS: Methodological opportunities and challenges. Rev. Da Assoc. Méd. Bras. 2019, 65, 669–677. [Google Scholar] [CrossRef]
- Fisberg, M.; Kovalskys, I.; Gomez, G.; Rigotti, A.; Cortes, L.Y.; Herrera-Cuenca, M.; Yepez, M.C.; Pareja, R.G.; Guajardo, V.; Zimberg, I.Z.; et al. Latin American Study of Nutrition and Health (ELANS): Rationale and study design. BMC Public Health 2015, 16, 93. [Google Scholar] [CrossRef]
- Moshfegh, A.J.; Rhodes, D.G.; Baer, D.J.; Murayi, T.; Clemens, J.C.; Rumpler, W.V.; Paul, D.R.; Sebastian, R.S.; Kuczynski, K.J.; Ingwersen, L.A.; et al. The US Department of Agriculture Automated Multiple-Pass Method reduces bias in the collection of energy intakes. Am. J. Clin. Nutr. 2008, 88, 324–332. [Google Scholar] [CrossRef] [PubMed]
- Universidade de São Paulo (USP). Food Research Center (FoRC). Versão 6.0. 2017. Tabela Brasileira de Composição de Alimentos (TBCA). Available online: https://www.tbca.net.br/ (accessed on 8 February 2024).
- Kovalskys, I.; Fisberg, M.; Gómez, G.; Rigotti, A.; Cortés, L.Y.; Yépez, M.C.; Pareja, R.G.; Herrera-Cuenca, M.; Zimberg, I.Z.; Tucker, K.L.; et al. Standardization of the Food Composition Database Used in the Latin American Nutrition and Health Study (ELANS). Nutrients 2015, 7, 7914–7924. [Google Scholar] [CrossRef] [PubMed]
- Harttig, U.; Haubrock, J.; Knüppel, S.; Boeing, H. The MSM program: Web-based statistics package for estimating usual dietary intake using the Multiple Source Method. Eur. J. Clin. Nutr. 2011, 65, S87–S91. [Google Scholar] [CrossRef]
- IOM/Food and Nutrition Board. Dietary Reference Intakes for Energy, Carbohydrate, Fiber, Fat Fatty Acids, Cholesterol, Protein, and Amino Acids (Macronutrients); National Academics Press: Washington, DC, USA, 2005. [Google Scholar]
- World Health Organization. Saturated Fatty Acid and Trans-Fatty Acid Intake for Adults and Children; WHO guideline: Geneva, Switzerland, 2023. [Google Scholar]
- World Health Organization. Carbohydrate Intake for Adults and Children; WHO guideline: Geneva, Switzerland, 2023. [Google Scholar]
- U.S. Department of Agriculture and U.S. Department of Health and Human Services. Dietary Guidelines for Americans, 2020–2025, 9th ed.; U.S. Department of Agriculture and U.S. Department of Health and Human Services: Washington, DC, USA, 2020. [Google Scholar]
- WHO. World Health Organization. Guideline: Sugars Intake for Adults and Children; WHO: Geneva, Switzerland, 2015. [Google Scholar]
- Marchioni, D.M.L.; Slater, B.; Fisberg, R.M. Aplicação das Dietary Reference Intakes na avaliação da ingestão de nutrientes para indivíduos. Rev. De Nutr. 2004, 17, 207–216. [Google Scholar] [CrossRef]
- WHO—World Health Organization. WHO Consultation on Obesity: Preventing and Managing the Global Epidemic; WHO: Geneva, Switzerland, 1998. [Google Scholar]
- Kamakura, W.; Mazzon, J.A. Critérios de estratificação e comparação de classificadores socioeconômicos no Brasil. Rev. De Adm. De Empresas 2016, 56, 55–70. [Google Scholar] [CrossRef]
- Matsudo, S.; Araújo, T.; Marsudo, V.; Andrade, D.; Andrade, E.; Braggion, G. Questionário Internacional de Atividade Física (IPAQ): Estudo de validade e reprodutibilidade no Brasil. Rev. Bras. Ativ. Fís. Saúde 2012, 6, 5–18. [Google Scholar]
- Craig, C.L.; Marshall, A.L.; Sjöström, M.; Bauman, A.E.; Booth, M.L.; Ainsworth, B.E.; Pratt, M.; Ekelund, U.L.F.; Yngve, A.; Sallis, J.F.; et al. International Physical Activity Questionnaire: 12-Country Reliability and Validity. Med. Sci. Sports Exerc. 2003, 35, 1381–1395. [Google Scholar] [CrossRef] [PubMed]
- Bull, F.C.; Al-Ansari, S.S.; Biddle, S.; Borodulin, K.; Buman, M.P.; Cardon, G.; Carty, C.; Chaput, J.P.; Chastin, S.; Chou, R.; et al. World Health Organization 2020 guidelines on physical activity and sedentary behaviour. Br. J. Sports Med. 2020, 54, 1451–1462. [Google Scholar] [CrossRef] [PubMed]
- Ferrari, G.L.D.M.; Kovalskys, I.; Fisberg, M.; Gómez, G.; Rigotti, A.; Sanabria, L.Y.C.; García, M.C.Y.; Torres, R.G.P.; Herrera-Cuenca, M.; Zimberg, I.Z.; et al. Socio-demographic patterning of objectively measured physical activity and sedentary behaviours in eight Latin American countries: Findings from the ELANS study. Eur. J. Sport Sci. 2020, 20, 670–681. [Google Scholar] [CrossRef] [PubMed]
- De Moraes Ferrari, G.L.; Kovalskys, I.; Fisberg, M.; Gómez, G.; Rigotti, A.; Sanabria, L.Y.C.; García, M.C.Y.; Torres, R.G.P.; Herrera-Cuenca, M.; Zimberg, I.Z.; et al. Methodological design for the assessment of physical activity and sedentary time in eight Latin American countries—The ELANS study. MethodsX 2020, 7, 100843. [Google Scholar] [CrossRef] [PubMed]
- Slater, B.; Marchioni, D.L.; Fisberg, R.M. Estimando a prevalência da ingestão inadequada de nutrientes. Rev. Saúde Pública 2004, 38, 599–605. [Google Scholar] [CrossRef] [PubMed]
- Mendes, A.; Gavioli, L.; Previdelli, A.N.; Fisberg, R.M.; Marchioni, D.M.L. The diet quality index evaluates the adequacy of energy provided by dietary macronutrients. Rev. Nutr. 2015, 28, 341–348. [Google Scholar] [CrossRef]
- Araujo, M.C.; Bezerra, I.N.; Barbosa, F.D.S.; Junger, W.L.; Yokoo, E.M.; Pereira, R.A.; Sichieri, R. Consumo de macronutrientes e ingestão inadequada de micronutrientes em adultos. Rev. Saúde Pública 2013, 47 (Suppl. S1), 177s–189s. [Google Scholar] [CrossRef]
- Ley, S.H.; Hamdy, O.; Mohan, V.; Hu, F.B. Prevention and management of type 2 diabetes: Dietary components and nutritional strategies. Lancet 2014, 383, 1999–2007. [Google Scholar] [CrossRef] [PubMed]
- Lutomski, J.E.; van den Broeck, J.; Harrington, J.; Shiely, F.; Perry, I.J. Sociodemographic, lifestyle, mental health and dietary factors associated with direction of misreporting of energy intake. Public Health Nutr. 2011, 14, 532–541. [Google Scholar] [CrossRef] [PubMed]
- Rippin, H.L.; Hutchinson, J.; Greenwood, D.C.; Jewell, J.; Breda, J.J.; Martin, A.; Rippin, D.M.; Schindler, K.; Rust, P.; Fagt, S.; et al. Inequalities in education and national income are associated with poorer diet: Pooled analysis of individual participant data across 12 European countries. PLoS ONE 2020, 15, e0232447. [Google Scholar] [CrossRef]
- Gómez, G.; Kovalskys, I.; Leme, A.C.B.; Quesada, D.; Rigotti, A.; Cortes Sanabria, L.Y.; Yepez Garcia, M.C.; Liria-Domínguez, M.R.; Herrera-Cuenca, M.; Fisberg, R.M.; et al. Socioeconomic Status Impact on Diet Quality and Body Mass Index in Eight Latin American Countries: ELANS Study Results. Nutrients 2021, 13, 2404. [Google Scholar] [CrossRef]
- Shlisky, J.; Bloom, D.E.; Beaudreault, A.R.; Tucker, K.L.; Keller, H.H.; Freund-Levi, Y.; Fielding, R.A.; Cheng, F.W.; Jensen, G.L.; Wu, D.; et al. Nutritional Considerations for Healthy Aging and Reduction in Age-Related Chronic Disease. Adv. Nutr. 2017, 8, 17–26. [Google Scholar] [CrossRef]
- Santos, P.V.; Sales, C.H.; Vieira, D.A.; de Mello Fontanelli, M.; Marchioni, D.M.; Fisberg, R.M. Family income per capita, age, and smoking status are predictors of low fiber intake in residents of São Paulo, Brazil. Nutr. Res. 2016, 36, 478–487. [Google Scholar] [CrossRef]
- Lu, L.; Li, X.; Lv, L.; Xu, Y.; Wu, B.; Huang, C. Associations between omega-3 fatty acids and insulin resistance and body composition in women with polycystic ovary syndrome. Front Nutr. 2022, 9, 1016943. [Google Scholar] [CrossRef]
- Carballo-Casla, A.; García-Esquinas, E.; Banegas, J.R.; Rodríguez-Artalejo, F.; Ortolá, R. Fish consumption, omega-3 fatty acid intake, and risk of pain: The Seniors-ENRICA-1 cohort. Clin. Nutr. 2022, 41, 2587–2595. [Google Scholar] [CrossRef] [PubMed]
- Bhatt, D.L.; Steg, P.G.; Miller, M.; Brinton, E.A.; Jacobson, T.A.; Ketchum, S.B.; Doyle Jr, R.T.; Juliano, R.A.; Jiao, L.; Granowitz, C.; et al. Cardiovascular Risk Reduction with Icosapent Ethyl for Hypertriglyceridemia. N. Engl. J. Med. 2019, 380, 11–22. [Google Scholar] [CrossRef] [PubMed]
- Castelló, A.; Rodríguez-Barranco, M.; Fernández de Larrea, N.; Jakszyn, P.; Dorronsoro, A.; Amiano, P.; Chirlaque, M.D.; Colorado-Yohar, S.; Guevara, M.; Moreno-Iribas, C.; et al. Adherence to the Western, Prudent and Mediterranean Dietary Patterns and Colorectal Cancer Risk: Findings from the Spanish Cohort of the European Prospective Investigation into Cancer and Nutrition (EPIC-Spain). Nutrients 2022, 14, 3085. [Google Scholar] [CrossRef]
- Sisa, I.; Abeyá-Gilardon, E.; Fisberg, R.M.; Jackson, M.D.; Mangialavori, G.L.; Sichieri, R.; Cudhea, F.; Bannuru, R.R.; Ruthazer, R.; Mozaffarian, D.; et al. Impact of diet on CVD and diabetes mortality in Latin America and the Caribbean: A comparative risk assessment analysis. Public Health Nutr. 2021, 24, 2577–2591. [Google Scholar] [CrossRef]
- IBGE. Instituto Brasileiro de Geografia e Estatística. Pesquisa de Orçamentos Familiares 2017–2018: Avaliação Nutricional da Disponibilidade Domiciliar de Alimentos no Brasil; IBGE: Rio de Janeiro, Brazil, 2020. [Google Scholar]
- Institute of Medicine (US) Committee to Review Dietary Reference Intakes for Vitamin D and Calcium; Ross, A.C.; Del Valle, H.B.; Yaktine, A.L.; Taylor, C.L. Dietary Reference Intakes for Calcium and Vitamin D; Institute of Medicine: Washington, DC, USA, 2011. [Google Scholar]
- Martini, L.A.; Verly Jr, E.; Marchioni, D.M.; Fisberg, R.M. Prevalence and correlates of calcium and vitamin D status adequacy in adolescents, adults, and elderly from the Health Survey—São Paulo. Nutrition 2013, 29, 845–850. [Google Scholar] [CrossRef] [PubMed]
- De M Fontanelli, M.; Sales, C.H.; de Castro, M.A.; Fisberg, R.M. Healthful grain foods consumption by São Paulo residents: A 12-year analysis and future trends. Public Health Nutr. 2021, 24, 2987–2997. [Google Scholar] [CrossRef] [PubMed]
- De Mello Fontanelli, M.; Arroyo, A.M.; Sales, C.H.; Seal, C.J.; Fisberg, R.M. Opportunities for diet quality improvement: The potential role of staple grain foods. Public Health Nutr. 2021, 24, 6145–6156. [Google Scholar] [CrossRef] [PubMed]
- Steluti, J.; Selhub, J.; Paul, L.; Reginaldo, C.; Fisberg, R.M.; Marchioni, D.M.L. An overview of folate status in a population-based study from São Paulo, Brazil, and the potential impact of 10 years of national folic acid fortification policy. Eur. J. Clin. Nutr. 2017, 71, 1173–1178. [Google Scholar] [CrossRef]
- Ministry of Health of Brazil. Secretariat of Health Care. Primary Health Care Department. Dietary Guidelines for the Brazilian Population; Ministry of Health of Brazil, Secretariat of Health Care: Brasília, Brazil, 2015. [Google Scholar]
- The World Bank. Rural Population (% of Total Population)—Brazil. 2018. Available online: https://data.worldbank.org/indicator/SP.RUR.TOTL.ZS?locations=BR (accessed on 12 December 2023).


| Total Population (N = 1812) | Male (N = 828) | Female (N = 984) | |||||||||||||||||||
|---|---|---|---|---|---|---|---|---|---|---|---|---|---|---|---|---|---|---|---|---|---|
| Age Strata (Years) | Age Strata (Years) | Age Strata (Years) | |||||||||||||||||||
| 19–30 | 31–50 | 51–65 | 19–30 | 31–50 | 51–65 | 19–30 | 31–50 | 51–65 | |||||||||||||
| N | % | N | % | N | % | p-Value | N | % | N | % | N | % | p-Value | N | % | N | % | N | % | p-Value | |
| 573 | 32.0 | 851 | 47.0 | 388 | 21.0 | 295 | 16.0 | 394 | 22.0 | 139 | 8.0 | 278 | 15.0 | 457 | 25.0 | 249 | 14.0 | ||||
| Education level | |||||||||||||||||||||
| None to middle school | 196 | 23.8 | 380 | 46.2 | 247 | 30.0 | <0.001 | 95 | 32.2 | 178 | 45.2 | 86 | 61.9 | <0.001 | 101 | 36.3 | 202 | 44.2 | 161 | 64.7 | <0.001 |
| High school | 345 | 60.2 | 372 | 43.7 | 104 | 26.8 | 185 | 62.7 | 172 | 43.7 | 38 | 27.3 | 160 | 57.6 | 200 | 43.8 | 66 | 26.5 | |||
| College/university degree | 32 | 5.6 | 99 | 11.6 | 37 | 9.5 | 15 | 5.1 | 44 | 11.2 | 15 | 10.8 | 17 | 6.1 | 55 | 12.0 | 22 | 8.8 | |||
| Socioeconomic status | |||||||||||||||||||||
| High | 44 | 7.7 | 78 | 9.2 | 31 | 8.0 | 0.003 | 26 | 8.8 | 33 | 8.4 | 13 | 9.4 | 0.099 | 18 | 6.5 | 45 | 9.9 | 18 | 7.2 | 0.033 |
| Middle | 269 | 47.0 | 402 | 47.2 | 143 | 36.9 | 157 | 53.2 | 200 | 50.8 | 55 | 39.6 | 112 | 40.3 | 202 | 44.2 | 88 | 35.3 | |||
| Low | 260 | 45.4 | 371 | 43.6 | 214 | 55.2 | 112 | 38.0 | 161 | 40.9 | 71 | 51.1 | 148 | 53.2 | 210 | 46.0 | 143 | 57.4 | |||
| Excess weight | |||||||||||||||||||||
| BMI < 25 kg/m2 | 298 | 52.0 | 303 | 35.6 | 99 | 25.5 | <0.001 | 156 | 52.9 | 148 | 37.6 | 34 | 24.5 | <0.001 | 142 | 51.1 | 155 | 33.9 | 65 | 26.1 | <0.001 |
| BMI ≥ 25 kg/m2 | 275 | 48.0 | 548 | 64.4 | 289 | 74.5 | 139 | 47.1 | 246 | 62.4 | 105 | 75.5 | 136 | 48.9 | 302 | 66.1 | 184 | 73.9 | |||
| PAL (IPAQ) | |||||||||||||||||||||
| Insufficiently active | 300 | 54.4 | 462 | 56.6 | 233 | 62.1 | 0.058 | 131 | 46.1 | 210 | 54.8 | 75 | 55.2 | 0.058 | 169 | 63.1 | 252 | 58.1 | 158 | 66.1 | 0.010 |
| Active | 252 | 45.7 | 355 | 43.5 | 142 | 37.9 | 153 | 53.9 | 173 | 45.2 | 61 | 44.9 | 99 | 36.9 | 182 | 41.9 | 81 | 33.9 | |||
| Supplement use | |||||||||||||||||||||
| No | 488 | 85.2 | 722 | 84.8 | 318 | 82.0 | 0.624 | 257 | 87.1 | 345 | 87.6 | 115 | 82.7 | 0.558 | 231 | 83.1 | 377 | 82.5 | 203 | 81.5 | 0.986 |
| Yes | 26 | 4.5 | 42 | 4.9 | 25 | 6.4 | 11 | 3.7 | 14 | 3.6 | 9 | 6.5 | 15 | 5.4 | 28 | 6.1 | 16 | 6.4 | |||
| Not informed | 59 | 10.3 | 87 | 10.2 | 45 | 11.6 | 27 | 9.2 | 35 | 8.9 | 15 | 10.8 | 32 | 11.5 | 52 | 11.4 | 30 | 12.1 | |||
| Nutrient Intake | Total Population (n = 1812) | K–Wallis | Male (n = 828) | Female (n = 984) | K–Wallis | ||||||||||||
|---|---|---|---|---|---|---|---|---|---|---|---|---|---|---|---|---|---|
| Mean | SD | P25 | P50 | P75 | p-Value * | Mean | SD | P25 | P50 | P75 | Mean | SD | P25 | P50 | P75 | p Value ** | |
| Energy (kcal) | |||||||||||||||||
| 19–30 years | 1978 | 623 | 1564 | 1888 | 2275 | <0.001 a,b,c | 2252 | 651 | 1824 | 2162 | 2523 | 1687 | 430 | 1366 | 1691 | 1921 | <0.001 e,f,h,i,j,k,l |
| 31–50 years | 1830 | 576 | 1417 | 1753 | 2151 | 2088 | 594 | 1690 | 2034 | 2416 | 1609 | 458 | 1278 | 1564 | 1866 | ||
| 51–65 years | 1566 | 464 | 1230 | 1511 | 1844 | 1827 | 474 | 1493 | 1810 | 2077 | 1420 | 389 | 1147 | 1341 | 1648 | ||
| Carbohydrates (% EI) | |||||||||||||||||
| 19–30 years | 50.78 | 6.65 | 46.76 | 51.16 | 55.05 | 0.103 | 49.89 | 6.71 | 45.19 | 49.94 | 54.54 | 51.72 | 6.46 | 47.98 | 52.01 | 55.91 | <0.001 j,k,l |
| 31–50 years | 50.13 | 6.61 | 45.76 | 50.29 | 54.71 | 49.30 | 6.76 | 44.81 | 49.62 | 53.67 | 50.84 | 6.4 | 46.59 | 50.67 | 55.33 | ||
| 51–65 years | 50.35 | 7.25 | 46.06 | 50.81 | 54.79 | 48.64 | 6.82 | 44.27 | 48.96 | 53.21 | 51.30 | 7.31 | 46.98 | 51.64 | 56.14 | ||
| Proteins (% EI) | |||||||||||||||||
| 19–30 years | 17.26 | 3.31 | 15.09 | 16.97 | 19.15 | 0.001 b,c | 17.58 | 3.42 | 15.38 | 17.11 | 19.6 | 16.92 | 3.15 | 14.9 | 16.77 | 18.7 | <0.001 e,f |
| 31–50 years | 17.53 | 3.37 | 15.18 | 17.21 | 19.46 | 17.51 | 3.33 | 15.35 | 17.21 | 19.58 | 17.54 | 3.41 | 15.11 | 17.21 | 19.32 | ||
| 51–65 years | 18.11 | 3.54 | 15.72 | 17.81 | 19.92 | 18.64 | 3.57 | 16.37 | 18.61 | 20.28 | 17.82 | 3.5 | 15.45 | 17.31 | 19.69 | ||
| Total fats (% EI) | |||||||||||||||||
| 19–30 years | 30.18 | 4.91 | 27.32 | 30.08 | 33.37 | 0.383 | 29.89 | 4.78 | 27.22 | 30.02 | 33.22 | 30.48 | 5.03 | 27.37 | 30.38 | 33.6 | 0.006 k |
| 31–50 years | 29.8 | 5.25 | 26.74 | 30.05 | 33.12 | 28.99 | 5.46 | 25.92 | 29.47 | 32.68 | 30.5 | 4.96 | 27.46 | 30.45 | 33.81 | ||
| 51–65 years | 29.7 | 5.38 | 26.43 | 29.83 | 33.31 | 29.3 | 5.25 | 25.94 | 29.71 | 32.88 | 29.93 | 5.46 | 26.7 | 30.25 | 33.54 | ||
| Saturated fats (% EI) | |||||||||||||||||
| 19–30 years | 9.95 | 1.99 | 8.69 | 9.9 | 11.33 | 0.274 | 9.85 | 1.9 | 8.62 | 9.93 | 11.25 | 10.06 | 2.07 | 8.75 | 9.87 | 11.55 | 0.003 k |
| 31–50 years | 9.84 | 2.13 | 8.47 | 9.7 | 11.23 | 9.57 | 2.22 | 8.16 | 9.47 | 10.91 | 10.08 | 2.03 | 8.73 | 9.9 | 11.39 | ||
| 51–65 years | 9.81 | 2.17 | 8.35 | 9.8 | 11.1 | 9.58 | 2.05 | 8.25 | 9.58 | 10.93 | 9.93 | 2.23 | 8.53 | 9.94 | 11.27 | ||
| Unsaturated fats (% EI) | |||||||||||||||||
| 19–30 years | 7.61 | 1.87 | 6.27 | 7.52 | 8.76 | 0.319 | 7.46 | 1.82 | 6.19 | 7.5 | 8.51 | 7.77 | 1.92 | 6.47 | 7.57 | 8.94 | 0.093 |
| 31–50 years | 7.45 | 1.86 | 6.31 | 7.39 | 8.47 | 7.26 | 1.82 | 6.13 | 7.33 | 8.36 | 7.61 | 1.87 | 6.47 | 7.4 | 8.68 | ||
| 51–65 years | 7.41 | 1.79 | 6.26 | 7.31 | 8.43 | 7.31 | 1.65 | 6.19 | 7.39 | 8.26 | 7.47 | 1.86 | 6.27 | 7.31 | 8.62 | ||
| EPA (mg) | |||||||||||||||||
| 19–30 years | 11.81 | 8.42 | 7.51 | 10.5 | 13.32 | <0.001 a,b | 10.98 | 7.19 | 7.18 | 9.56 | 13.02 | 12.68 | 9.49 | 8.58 | 11.27 | 13.64 | <0.001 e,j,k |
| 31–50 years | 12.8 | 8.22 | 8.34 | 11.08 | 14.57 | 12.19 | 8.51 | 7.9 | 10.31 | 13.75 | 13.32 | 7.94 | 9.21 | 11.74 | 15.27 | ||
| 51–65 years | 13.49 | 10.73 | 8.55 | 11.58 | 14.67 | 12.93 | 8.31 | 8.47 | 11.06 | 14.7 | 13.8 | 11.87 | 8.96 | 11.92 | 14.67 | ||
| DHA (mg) | |||||||||||||||||
| 19–30 years | 48.16 | 33.58 | 29.41 | 40.23 | 54.51 | 0.187 | 49.46 | 37.06 | 29.41 | 40.69 | 55.86 | 46.79 | 29.43 | 29.28 | 39.19 | 54.1 | 0.550 |
| 31–50 years | 51.05 | 36.38 | 29.81 | 40.93 | 58.58 | 51.72 | 36.33 | 30.02 | 41.1 | 58.63 | 50.48 | 36.46 | 29.71 | 40.62 | 57.73 | ||
| 51–65 years | 50.4 | 39.84 | 28.28 | 39.26 | 57.41 | 52.03 | 35.75 | 26.2 | 38.68 | 64.18 | 49.49 | 42 | 29.25 | 39.31 | 53.35 | ||
| Nutrient | Total Population (n = 1812) | Male (n = 828) | Female (n = 984) | ||||||
|---|---|---|---|---|---|---|---|---|---|
| n | % | p-Value | n | % | p-Value | n | % | p-Value | |
| Total fiber (g) | <25 g/day | <25 g/day | <25 g/day | ||||||
| Total—19–65 years | 1508 | 83.22 | 580 | 70.05 | 928 | 94.31 | |||
| 19–30 years | 463 | 80.8 | 0.062 | 197 | 66.78 | 0.170 | 266 | 95.68 | 0.354 |
| 31–50 years | 709 | 83.31 | 278 | 70.56 | 431 | 94.31 | |||
| 51–65 years | 336 | 86.6 | 105 | 75.54 | 231 | 92.77 | |||
| Added sugar (% EI) | >10% of EI | >10% of EI | >10% of EI | ||||||
| Total—19–65 years | 1121 | 61.87 | 453 | 54.71 | 668 | 67.89 | |||
| 19–30 years | 404 | 70.51 | p < 0.001 | 184 | 62.37 | p < 0.001 | 220 | 79.14 | p < 0.001 |
| 31–50 years | 523 | 61.46 | 212 | 53.81 | 311 | 68.05 | |||
| 51–65 years | 194 | 50 | 57 | 41.01 | 137 | 55.02 | |||
| Saturated fat (%EI) | >10% of EI | >10% of EI | >10% of EI | ||||||
| Total—19–65 years | 814 | 44.92 | 346 | 41.79 | 468 | 47.56 | |||
| 19–30 years | 273 | 47.64 | 0.225 | 143 | 48.47 | 0.014 | 130 | 46.76 | 0.940 |
| 31–50 years | 366 | 43.01 | 148 | 37.56 | 218 | 47.7 | |||
| 51–65 years | 175 | 45.1 | 55 | 39.57 | 120 | 48.19 | |||
| Micronutrient | Brazil (n = 1812) | Male (n = 828) | Female (n = 984) | |||||||
|---|---|---|---|---|---|---|---|---|---|---|
| Mean | SD | Mean | SD | EAR | Inadequacy (%) | Mean | SD | EAR | Inadequacy (%) | |
| Vitamin A (mcg) | ||||||||||
| 19–30 years | 554.51 | 590.02 | 567.77 | 706.99 | 625 | 53.19% | 540.43 | 433.56 | 500 | 46.41% |
| 31–50 years | 547.55 | 459.15 | 557.57 | 497.32 | 625 | 55.57% | 538.91 | 423.85 | 500 | 46.41% |
| 51–65 years | 527.48 | 461.74 | 560.79 | 503.24 | 625 | 55.17% | 508.88 | 436.81 | 500 | 49.20% |
| Vitamin C (mg) | ||||||||||
| 19–30 years | 90.52 | 84.76 | 90.04 | 90.16 | 75 | 43.25% | 91.03 | 78.80 | 60 | 34.83% |
| 31–50 years | 91.56 | 79.72 | 90.19 | 84.13 | 75 | 42.86% | 92.74 | 75.78 | 60 | 33.36% |
| 51–65 years | 98.00 | 83.26 | 94.88 | 82.79 | 75 | 40.52% | 99.74 | 83.63 | 60 | 31.56% |
| Vitamin D (mcg) | ||||||||||
| 19–30 years | 3.54 | 2.16 | 3.79 | 2.27 | 10 | 99.69% | 3.28 | 2.00 | 10 | 99.88% |
| 31–50 years | 3.32 | 1.85 | 3.52 | 1.96 | 10 | 99.95% | 3.16 | 1.73 | 10 | 99.87% |
| 51–65 years | 3.12 | 1.73 | 3.24 | 1.72 | 10 | 99.99% | 3.05 | 1.73 | 10 | 99.46% |
| Vitamin E (mg) | ||||||||||
| 19–30 years | 7.40 | 2.73 | 8.03 | 2.86 | 12 | 91.77% | 6.72 | 2.43 | 12 | 98.50% |
| 31–50 years | 7.06 | 2.91 | 7.74 | 3.22 | 12 | 90.66% | 6.47 | 2.48 | 12 | 98.71% |
| 51–65 years | 6.55 | 2.61 | 7.41 | 3.09 | 12 | 93.06% | 6.07 | 2.15 | 12 | 99.70% |
| Thiamin (mg) | ||||||||||
| 19–30 years | 1.62 | 0.51 | 1.82 | 0.52 | 1.0 | 5.82% | 1.42 | 0.42 | 0.9 | 10.93% |
| 31–50 years | 1.60 | 0.57 | 1.78 | 0.58 | 1.0 | 9.01% | 1.45 | 0.52 | 0.9 | 14.23% |
| 51–65 years | 1.50 | 0.66 | 1.76 | 0.90 | 1.0 | 19.77% | 1.36 | 0.41 | 0.9 | 13.14% |
| Riboflavin (mg) | ||||||||||
| 19–30 years | 1.38 | 0.47 | 1.52 | 0.50 | 1.1 | 19.77% | 1.23 | 0.39 | 0.9 | 20.05% |
| 31–50 years | 1.30 | 0.45 | 1.43 | 0.47 | 1.1 | 24.20% | 1.18 | 0.39 | 0.9 | 23.27% |
| 51–65 years | 1.17 | 0.37 | 1.33 | 0.41 | 1.1 | 28.77% | 1.08 | 0.32 | 0.9 | 28.43% |
| Pyridoxine (mg) | ||||||||||
| 19–30 years | 1.74 | 0.72 | 2.01 | 0.80 | 1.1 | 12.17% | 1.46 | 0.47 | 1.1 | 22.06% |
| 31–50 years | 1.67 | 0.70 | 1.95 | 0.78 | 1.1 | 13.79% | 1.43 | 0.50 | 1.1 | 25.14% |
| 51–65 years | 1.49 | 0.65 | 1.80 | 0.82 | 1.4 | 31.21% | 1.32 | 0.45 | 1.3 | 48.40% |
| Vitamin B12 (mcg) | ||||||||||
| 19–30 years | 4.41 | 2.38 | 4.97 | 2.57 | 2.0 | 12.30% | 3.82 | 2.01 | 2.0 | 18.14% |
| 31–50 years | 4.26 | 2.34 | 4.76 | 2.58 | 2.0 | 14.23% | 3.83 | 2.01 | 2.0 | 18.14% |
| 51–65 years | 3.87 | 1.63 | 4.71 | 1.95 | 2.0 | 8.23% | 3.41 | 1.19 | 2.0 | 11.70% |
| Choline * | Prob. Adeq. (%) | Prob. Adeq. (%) | ||||||||
| 19–30 years | 337.85 | 123.23 | 387.9 | 132.47 | 550 * | 10.51% | 284.74 | 85.042 | 425 * | 6.12% |
| 31–50 years | 325.45 | 113.15 | 370.34 | 118.32 | 550 * | 6.60% | 286.75 | 92.497 | 425 * | 6.78% |
| 51–65 years | 295.85 | 98.167 | 351.12 | 107.99 | 550 * | 2.28% | 265 | 76.691 | 425 * | 4.02% |
| Micronutrient | Brazil (n = 1812) | Male (n = 828) | Female (n = 984) | |||||||
|---|---|---|---|---|---|---|---|---|---|---|
| Mean | SD | Mean | SD | EAR | Inadequacy (%) | Mean | SD | EAR | Inadequacy (%) | |
| Calcium (mg) | ||||||||||
| 19–30 years | 470.80 | 244.02 | 509.13 | 265.31 | 800 | 86.42% | 430.12 | 212.21 | 800 | 95.91% |
| 31–50 years | 451.66 | 239.22 | 463.56 | 219.30 | 800 | 93.70% | 441.40 | 254.94 | 800 | 92.07% |
| 51–65 years | 424.57 | 204.40 | 454.31 | 213.32 | 800 | 95.73% | 407.98 | 197.75 | 1000 | 99.86% |
| Iron (mg) | ||||||||||
| 19–30 years | 12.36 | 4.18 | 14.20 | 4.18 | 6.0 | 2.50% | 10.40 | 3.17 | 8.10 | 23.27% |
| 31–50 years | 11.36 | 4.11 | 13.22 | 4.38 | 6.0 | 4.95% | 9.75 | 3.05 | 8.10 | 29.46% |
| 51–65 years | 9.98 | 3.27 | 11.77 | 3.02 | 6.0 | 2.81% | 8.98 | 2.97 | 5.00 | 9.01% |
| Magnesium (mg) | ||||||||||
| 19–30 years | 216.45 | 71.79 | 246.95 | 77.02 | 330 | 85.99% | 184.09 | 48.01 | 255 | 93.06% |
| 31–50 years | 211.69 | 69.51 | 240.75 | 73.45 | 350 | 93.19% | 186.64 | 54.77 | 265 | 92.36% |
| 51–65 years | 199.76 | 62.56 | 228.55 | 65.74 | 350 | 96.78% | 183.69 | 54.58 | 265 | 93.19% |
| Zinc (mg) | ||||||||||
| 19–30 years | 12.40 | 5.33 | 14.53 | 6.04 | 9.4 | 19.77% | 10.13 | 3.15 | 6.8 | 14.46% |
| 31–50 years | 11.51 | 4.48 | 13.29 | 4.87 | 9.4 | 21.19% | 9.97 | 3.43 | 6.8 | 17.88% |
| 51–65 years | 10.41 | 4.05 | 12.29 | 3.95 | 9.4 | 23.27% | 9.36 | 3.71 | 6.8 | 24.51% |
Disclaimer/Publisher’s Note: The statements, opinions and data contained in all publications are solely those of the individual author(s) and contributor(s) and not of MDPI and/or the editor(s). MDPI and/or the editor(s) disclaim responsibility for any injury to people or property resulting from any ideas, methods, instructions or products referred to in the content. |
© 2024 by the authors. Licensee MDPI, Basel, Switzerland. This article is an open access article distributed under the terms and conditions of the Creative Commons Attribution (CC BY) license (https://creativecommons.org/licenses/by/4.0/).
Share and Cite
Fisberg, M.; Duarte Batista, L.; Previdelli, A.N.; Ferrari, G.; Fisberg, R.M. Exploring Diet and Nutrient Insufficiencies across Age Groups: Insights from a Population-Based Study of Brazilian Adults. Nutrients 2024, 16, 750. https://doi.org/10.3390/nu16050750
Fisberg M, Duarte Batista L, Previdelli AN, Ferrari G, Fisberg RM. Exploring Diet and Nutrient Insufficiencies across Age Groups: Insights from a Population-Based Study of Brazilian Adults. Nutrients. 2024; 16(5):750. https://doi.org/10.3390/nu16050750
Chicago/Turabian StyleFisberg, Mauro, Lais Duarte Batista, Agatha Nogueira Previdelli, Gerson Ferrari, and Regina Mara Fisberg. 2024. "Exploring Diet and Nutrient Insufficiencies across Age Groups: Insights from a Population-Based Study of Brazilian Adults" Nutrients 16, no. 5: 750. https://doi.org/10.3390/nu16050750
APA StyleFisberg, M., Duarte Batista, L., Previdelli, A. N., Ferrari, G., & Fisberg, R. M. (2024). Exploring Diet and Nutrient Insufficiencies across Age Groups: Insights from a Population-Based Study of Brazilian Adults. Nutrients, 16(5), 750. https://doi.org/10.3390/nu16050750