Article

Association between Child Nutritional Anthropometric Indices and Iron Deficiencies among Children Aged 6–59 Months in Nepal

by
Kingsley Emwinyore Agho
1,2,
Stanley Chitekwe
3,
Sanjay Rijal
4,
Naveen Paudyal
4,
Sanjeev Kumar Sahani
4 and
Blessing Jaka Akombi-Inyang
5,*
1
School of Health Sciences, Western Sydney University, Campbelltown, NSW 2560, Australia
2
Faculty of Health Sciences, University of Johannesburg, Johannesburg 2094, South Africa
3
Nutrition Section, United Nations Children’s Fund (UNICEF) Ethiopia, Addis Ababa 1169, Ethiopia
4
United Nations Children’s Fund (UNICEF), Nepal Country Office P.O. Box 1187, United Nations (UN) House, Pulchowk, Kathmandu P.O. Box 107, Nepal
5
School of Population Health, University of New South Wales (UNSW), Sydney, NSW 2052, Australia
*
Author to whom correspondence should be addressed.
Nutrients 2024, 16(5), 698; https://doi.org/10.3390/nu16050698
Submission received: 22 January 2024 / Revised: 26 February 2024 / Accepted: 26 February 2024 / Published: 29 February 2024
(This article belongs to the Special Issue Nutrition Programs and Policies for Maternal and Child Health)

Abstract

:
Developmental impairment remains an important public health problem among children in many developing countries, including Nepal. Iron deficiency in children may affect development and lead to anaemia. This study on 1702 children aged 6–59 months aimed to assess the association between nutritional anthropometric indices and iron deficiencies. Data for this study were extracted from the 2016 Nepal National Micronutrient Status Survey. Three nutritional anthropometric indices (stunting, wasting and underweight) and their association with anaemia and iron deficiencies (ferritin and sTfR biomarkers) were assessed by conducting multivariate statistical analyses. The prevalence of stunting, wasting and underweight among children aged 6–59 months was 35.6%, 11.7% and 29.0%, respectively. Most of the children were not stunted (64.4%), not wasted (71.0%) and not underweight (88.3%). Belonging to castes other than the Janajati, Dalit and Brahmin castes increased the odds of anaemia and iron deficiency (ferritin biomarker). Children in the age group 6–23 months were significantly at higher odds of having anaemia and iron deficiency (ferritin and sTfR biomarkers). Stunting significantly increased the odds of anaemia [adjusted odds ratio (OR): 1.55; 95% confidence interval (CI): (1.11, 2.17)], iron deficiency (ferritin biomarker [OR: 1.56; 95% CI: (1.16, 2.08)] and sTfR biomarker [OR: 1.60; 95% CI: (1.18, 2.15)]). Further, underweight significantly increased the odds of anaemia [OR: 1.69; 95% CI: (1.12, 2.54)] and iron deficiency (sTfR biomarker [OR: 1.48; 95% CI: (1.14, 1.93)]). Interventions to minimise the occurrence of anaemia and iron deficiencies among children in Nepal should focus on providing appropriate healthcare services that would reduce the burden of stunting and underweight.

1. Introduction

Anaemia is a medical condition in which the count of red blood cells or haemoglobin in the body is less than normal. Anaemia has been known as a major public health problem in low–middle-income countries (LMIC), including Nepal [1], with the subpopulations most affected being women of reproductive age, pregnant women and children [2]. It negatively affects a child’s cognitive development and physical growth from infancy to adolescence [3]. The most common causes of anaemia include parasitic infections and micronutrient deficiencies, particularly iron, vitamin A, folate, and vitamin B12 deficiencies [4,5,6,7]. In addition, malaria and genetic haemoglobin disorders are the main contributors to the anaemia burden [4]. Globally, anaemia affects about 43% of children [8], with approximately 40% of all children aged 6–59 months being anaemic due to iron deficiency [9].
Undernutrition is one of the main health issues highlighted in the 2015 Sustainable Development Goals (target 2.2: aspiring to end hunger by 2030) [10]. A 2015 report by the United Nations Children’s Emergency Fund (UNICEF) estimated that nearly 50% of deaths under 5 (about 3 million young lives a year) are attributed to undernutrition [11]. In Nepal, the burden of undernutrition and anaemia has been high over the years [12]. The 2016 Nepal Demographic and Health Survey reported that about 36% of children under 5 years of age were stunted, 10% were wasted, 27% were underweight and 53% were anaemic [12].
Iron deficiencies remain a major public health challenge, while the prevalence of undernutrition has increased over the past several decades [12]. The public health effects of iron deficiency include reduced work capacity and mental performance, poor growth development, impaired regulation of body temperature, impairments in behaviour and intellectual performance, and decreased resistance to infections [13,14]. Previous studies on the association between different indices of iron status and anthropometric measurements have reported that greater adiposity was associated with poorer iron status, which was demonstrated by lower serum iron (SI) and %transferrin saturation (%Tsat) and higher total iron-binding capacity (TIBC) and soluble transferrin receptor (sTfR) [15]. Overweight/obese children were also reported to require higher iron intake to maintain their iron homeostasis [15].
Currently, there are few studies on the association between undernutrition and different iron indices in children; knowledge of how anaemia and iron deficiency relate to nutritional anthropometric indices of children could enable public health professionals, the Nepalese government, and other stakeholders to identify and implement better evidence-based interventions to minimise the burden of these illnesses. To the best of our knowledge, there has not been any recent publication on iron deficiency and the nutritional status of children in Nepal. This present paper aims to assess the association between iron deficiency and nutritional anthropometric indices (stunting, wasting and underweight) among children aged 6–59 months in Nepal.

2. Methods

2.1. Study Design

Data used for this study were extracted from the 2016 Nepal National Micronutrient Status Survey (NNMSS). The NNMSS is a population-based study that uses a stratified multi-stage cluster sampling method. The country is divided into 15 strata, first by the five development regions (eastern, central, western, mid-western and far western) and then by three ecological zones (Terai, hill and mountain). The sample was selected using the 2011 census. Clusters (wards in the urban and rural areas) were used as the primary sampling units (PSUs). The minimum cluster size was defined as 100 households. Where necessary, clusters were combined prior to the first stage of sampling to meet this number. Further details of the sampling design and survey methodology are available in the 2016 NNMSS [16].

2.2. Study Participants

Nationally representative samples were collected on young children aged between 6 and 59 months.

2.3. Data Collection

The administered questionnaires were used to collect information on each household and for each child. Venous blood samples were collected from all the children. The young children’s questionnaire was used to collect information on socio-demographic characteristics from previous key national nutrition and other intervention programs in Nepal. The NNMS collected micronutrient supplementation intake (zinc, iron, folic acid, vitamin A, and multiple micronutrients), dietary diversity scale, two weeks recall of fever, cough, and diarrhoea, anthropometric measures, and documentation of the collection of biological data.

2.4. Anthropometric Measurements

Anthropometric measurements were collected from all of the participating children. For children aged less than 24 months, recumbent length was measured, and for those aged 24 months or older, standing height was measured using a standard height/length-measuring board (Shorr-Board). The weight of the participants was measured with an electronic SECA digital scale (UNICEF Electronic Scale or Uniscale). This scale makes room for the weighing of very young children through an automatic mother–child adjustment, which eliminates the weight of the mother while she is standing on the scale with her baby. The results of anthropometric measurements were immediately recorded on the questionnaire soon after each measurement.
The height-for-age, weight-for-height and weight-for-age indices of the children were calculated using growth standards published by the World Health Organization (WHO) in 2006. These growth standards were generated through data collected in the WHO Multicentre Growth Reference Study [17] and expressed in standard deviation units from the Multicentre Growth Reference Study median. The height-for-age, weight-for-height or weight-for-age index is an indicator of linear growth retardation and cumulative growth deficits in children.

2.5. Biological Indicators

Biological indicators assessed for the participating children included anaemia and iron status. The coverage for anaemia/haemoglobin was national, and it was assessed through a photometric method using the HemoCue® Hemoglobin system on small blood samples. This method is satisfactorily accurate and precise in laboratory evaluations using standard methods. The recommended volume for this analysis is 10 μL. Coverage of iron deficiency/ferritin was also national and in the five regions as well as in the three ecological zones. Ferritin is recommended by the World Health Organisation (WHO) as an indicator of iron deficiency in populations and is a measure of iron stores. Ferritin is an acute-phase reactant protein and is influenced by inflammation and infections. It is analysed at low cost using the enzyme-linked immunosorbent assay (ELISA) method. Soluble transferrin receptor (sTfR) is an indicator of iron insufficiency when iron stores are depleted (and assuming the absence of other causes of abnormal erythropoiesis). It can be elevated by thalassemia and is thought to be less influenced by inflammation and infection than ferritin. It can also be analysed at low cost using the ELISA method. The recommended volume for analysis for both ferritin and sTfR is 30 μL.

2.6. Specimen Collection and Processing

Blood samples were collected from the participating children to assess their micronutrient status. Blood was collected at the time of the survey. Details of the specimen collection can be obtained from the NNMSS final report [16].

2.7. Study Outcomes

The outcome variables for this study were anaemia and iron deficiency (ferritin and sTfR). Anaemia is one of the diseases that result due to low levels of haemoglobin in the blood. For children aged 6–59 months, anaemia is diagnosed when the haemoglobin level is less than 11.0 g/dL. Ferritin and sTfR are biomarkers for determining the deficiency of iron in the blood. In this study, both ferritin and sTfR were BRINDA adjusted. For all age groups, the sTfR level needs to be greater than 8.3 mg/L. Each occurrence of anaemia or iron deficiency was coded as 1; the non-occurrence of anaemia or iron deficiency was coded as 0.

3. Exposure Variables

3.1. Stunting (Height-for-Age)

Children with height-for-age Z-score below minus two standard deviations (−2 SD) from the median of the WHO reference population are stunted or chronically malnourished [17].

3.2. Wasting (Weight-for-Height)

Children with weight-for-height Z-scores below minus two standard deviations (−2 SD) from the median of the WHO reference population are regarded as wasted or acutely malnourished [17].

3.3. Underweight (Weight-for-Age)

Children whose weight-for-age is below minus two standard deviations (−2 SD) from the WHO Multicentre Growth Reference Study median [6] are classified as underweight [17].
The exposure variables were coded as 1 if stunted, wasted or underweight; otherwise, they were coded as 0.

3.4. Potential Confounding Variables

The selection of possible confounding variables was informed by the extant literature on factors associated with micronutrient deficiency [18,19,20,21], as well as their availability in the NNMSS dataset. These variables were categorised into individual-level factors, household-level factors, community-level factors, anthropometric factors, health status factors and diet habits (a day prior to the survey).
The individual-level factors included the child’s age, gender and relationship to the carer; household-level factors included the household wealth index and ethnicity. The household wealth index was represented as a score of household assets through the principal components analysis (PCA) method [22]. The index was categorised into three classes, namely, poor, middle and rich. The bottom 40% of the households were referred to as the poor; the next bottom 40% was referred to as the middle, and the top 20% was referred to as the rich.
Community-level factors included geographical region and ecological zone. Anthropometric factors included the child’s stunting, wasting and underweight status; health status factors included the contraction of fever, cough and diarrhoea; diet habit factors included the participants’ consumption of the different food groups and food security. Water and sanitation factors included quality of drinking water, type of toilet facility used in participants’ households and their water treatment habits.

3.5. Statistical Analysis

In this study, we used STATA/MP version 14 (Stata Corp., College Station, TX, USA) to conduct all statistical analyses. The ‘Svy’ commands were employed to allow for adjustments for the cluster-sampling design and weight. We first conducted frequency tabulations for exposure and all confounding factors, and this was followed by prevalence and univariate analyses that independently examined anaemia, ferritin and sTfR via the nutritional anthropometric index. Multivariate analyses were used to examine the association between child nutritional anthropometric indices and iron deficiencies. As part of the multivariate analyses, a staged modelling technique was carried out.
As a process of multivariate modelling technique, all community and household level factors were first entered into the baseline multivariable model with a backward elimination process to remove statistically non-significant variables (Model 1). In the next stage, individual-level factors were examined with model 1 (Model 2). Next, health-related factors were assessed with model 2 (Model 3). In the fourth modelling stage, water and sanitation factors were examined with model 3 (Model 4). In the final model (Model 5), the exposure variables (stunting, wasting and underweight) were examined with those variables significant in models 1–4.
In the final model, we tested and reported any co-linearity. The odds ratios with 95% confidence intervals were calculated to assess the adjusted odds of independence.

4. Results

4.1. Characteristics of the Sample

The characteristics of the study population are summarised in Table 1. Of the 1702 children, more than two-thirds were aged 24–59 months. Male children were 53.5%, while females were 46.5%. A large proportion of the children (96.7%) lived with their biological parents. In the two weeks preceding the survey, most of the children did not have fever, cough, or diarrhoea (61.6%, 61.8% and 80.4%, respectively). The majority of participants were not stunted, not wasted and not overweight (64%, 71% and 88%, respectively). Less than one in every five children (19%) were from rich households, and more than three-quarters of the children (87%) resided in rural areas. The central region was home to most of the children (36.5%), and more than one-half (~51%) of them were from the Terai ecological zone. Less than one-third of the children (~23%) consumed food from less than four food groups, and approximately 8% came from households with severe food insecurity and unimproved sources of drinking water. Most of the children were from households which drank untreated water (83.4%) and that had flush or pour-flush toilets (~71%).

4.2. Prevalence of Anaemia and Iron Deficiency by Nutritional Anthropometric Index

4.2.1. Anaemia

Prevalence and adjusted odds ratios (aOR) of anaemia, ferritin and sTfR in terms of the nutritional anthropometric index of the children are summarised in Table 2. Approximately 23% [95% confidence interval (CI): (18.3, 28.2)] of stunted children were anaemic, whilst 17.1% [95% CI: (13.9, 20.7)] who were not stunted had anaemia. The likelihood of developing anaemia was significantly higher among stunted children compared with those who were not stunted [aOR: 1.44; 95% CI: (1.04, 1.98)].
Approximately 23% of the children who were wasted were anaemic [95% CI: (15.6, 32.9)], whilst 18.6% of those not wasted had anaemia [95% CI: (15.4, 22.2)]. Children who were wasted were significantly more predisposed to anaemia compared to those who were not wasted [aOR: 1.32; 95% CI: (0.78, 2.21)], although this was not statistically significant.
More than 24% of the underweight children had anaemia, whilst approximately 17% did not have the illness [95% CI: (13.9, 20.6)]. The likelihood of contracting anaemia was significantly higher among underweight children compared with those who were not underweight [aOR: 1.58; 95% CI: (1.11, 2.26)]. The prevalence of undernutrition due to zinc deficiency was evenly distributed, ranging from 20% to 24%, and no statistical difference was observed (Table 2).

4.2.2. Iron Deficiency (Ferritin Biomarker)

Slightly more than 40% of the stunted children were iron deficient (ferritin biomarker) [95% CI: (33.2, 45.7)], whilst 33.1% of those not stunted were iron deficient (ferritin biomarker). Stunted children were significantly more prone to being iron deficient (ferritin biomarker) compared with those who were not stunted [aOR: 1.35; 95% CI: (1.04, 1.77)].
Approximately 39% of children who were wasted were iron deficient (ferritin biomarker) [CI: (29.4, 49.8)]. Close to 38% of children who were underweight were deficient in iron (ferritin biomarker) [95% CI: (31.0, 44.9)], whilst 34.7% of those who were not underweight had iron deficiency (ferritin biomarker) [CI: (30.8, 38.8)].

4.2.3. Iron Deficiency (sTfR Biomarker)

Approximately 40% of the stunted children were deficient in iron (sTfR biomarker) [CI: (33.0, 48.0)], and 34.8% of those who were not stunted were not iron deficient (sTfR biomarker).
Children who were wasted and those not wasted who developed iron deficiency (sTfR biomarker) were almost equally represented [37.3%, 95% CI: (29.1, 46.3) and 36.8%, 95% CI: (31.8, 42.0), respectively]. Approximately 41% of the underweight children were anaemic [CI: (34.3, 48.7)] against almost 35% of those who were not underweight being anaemic [CI: (30.2, 39.9)].

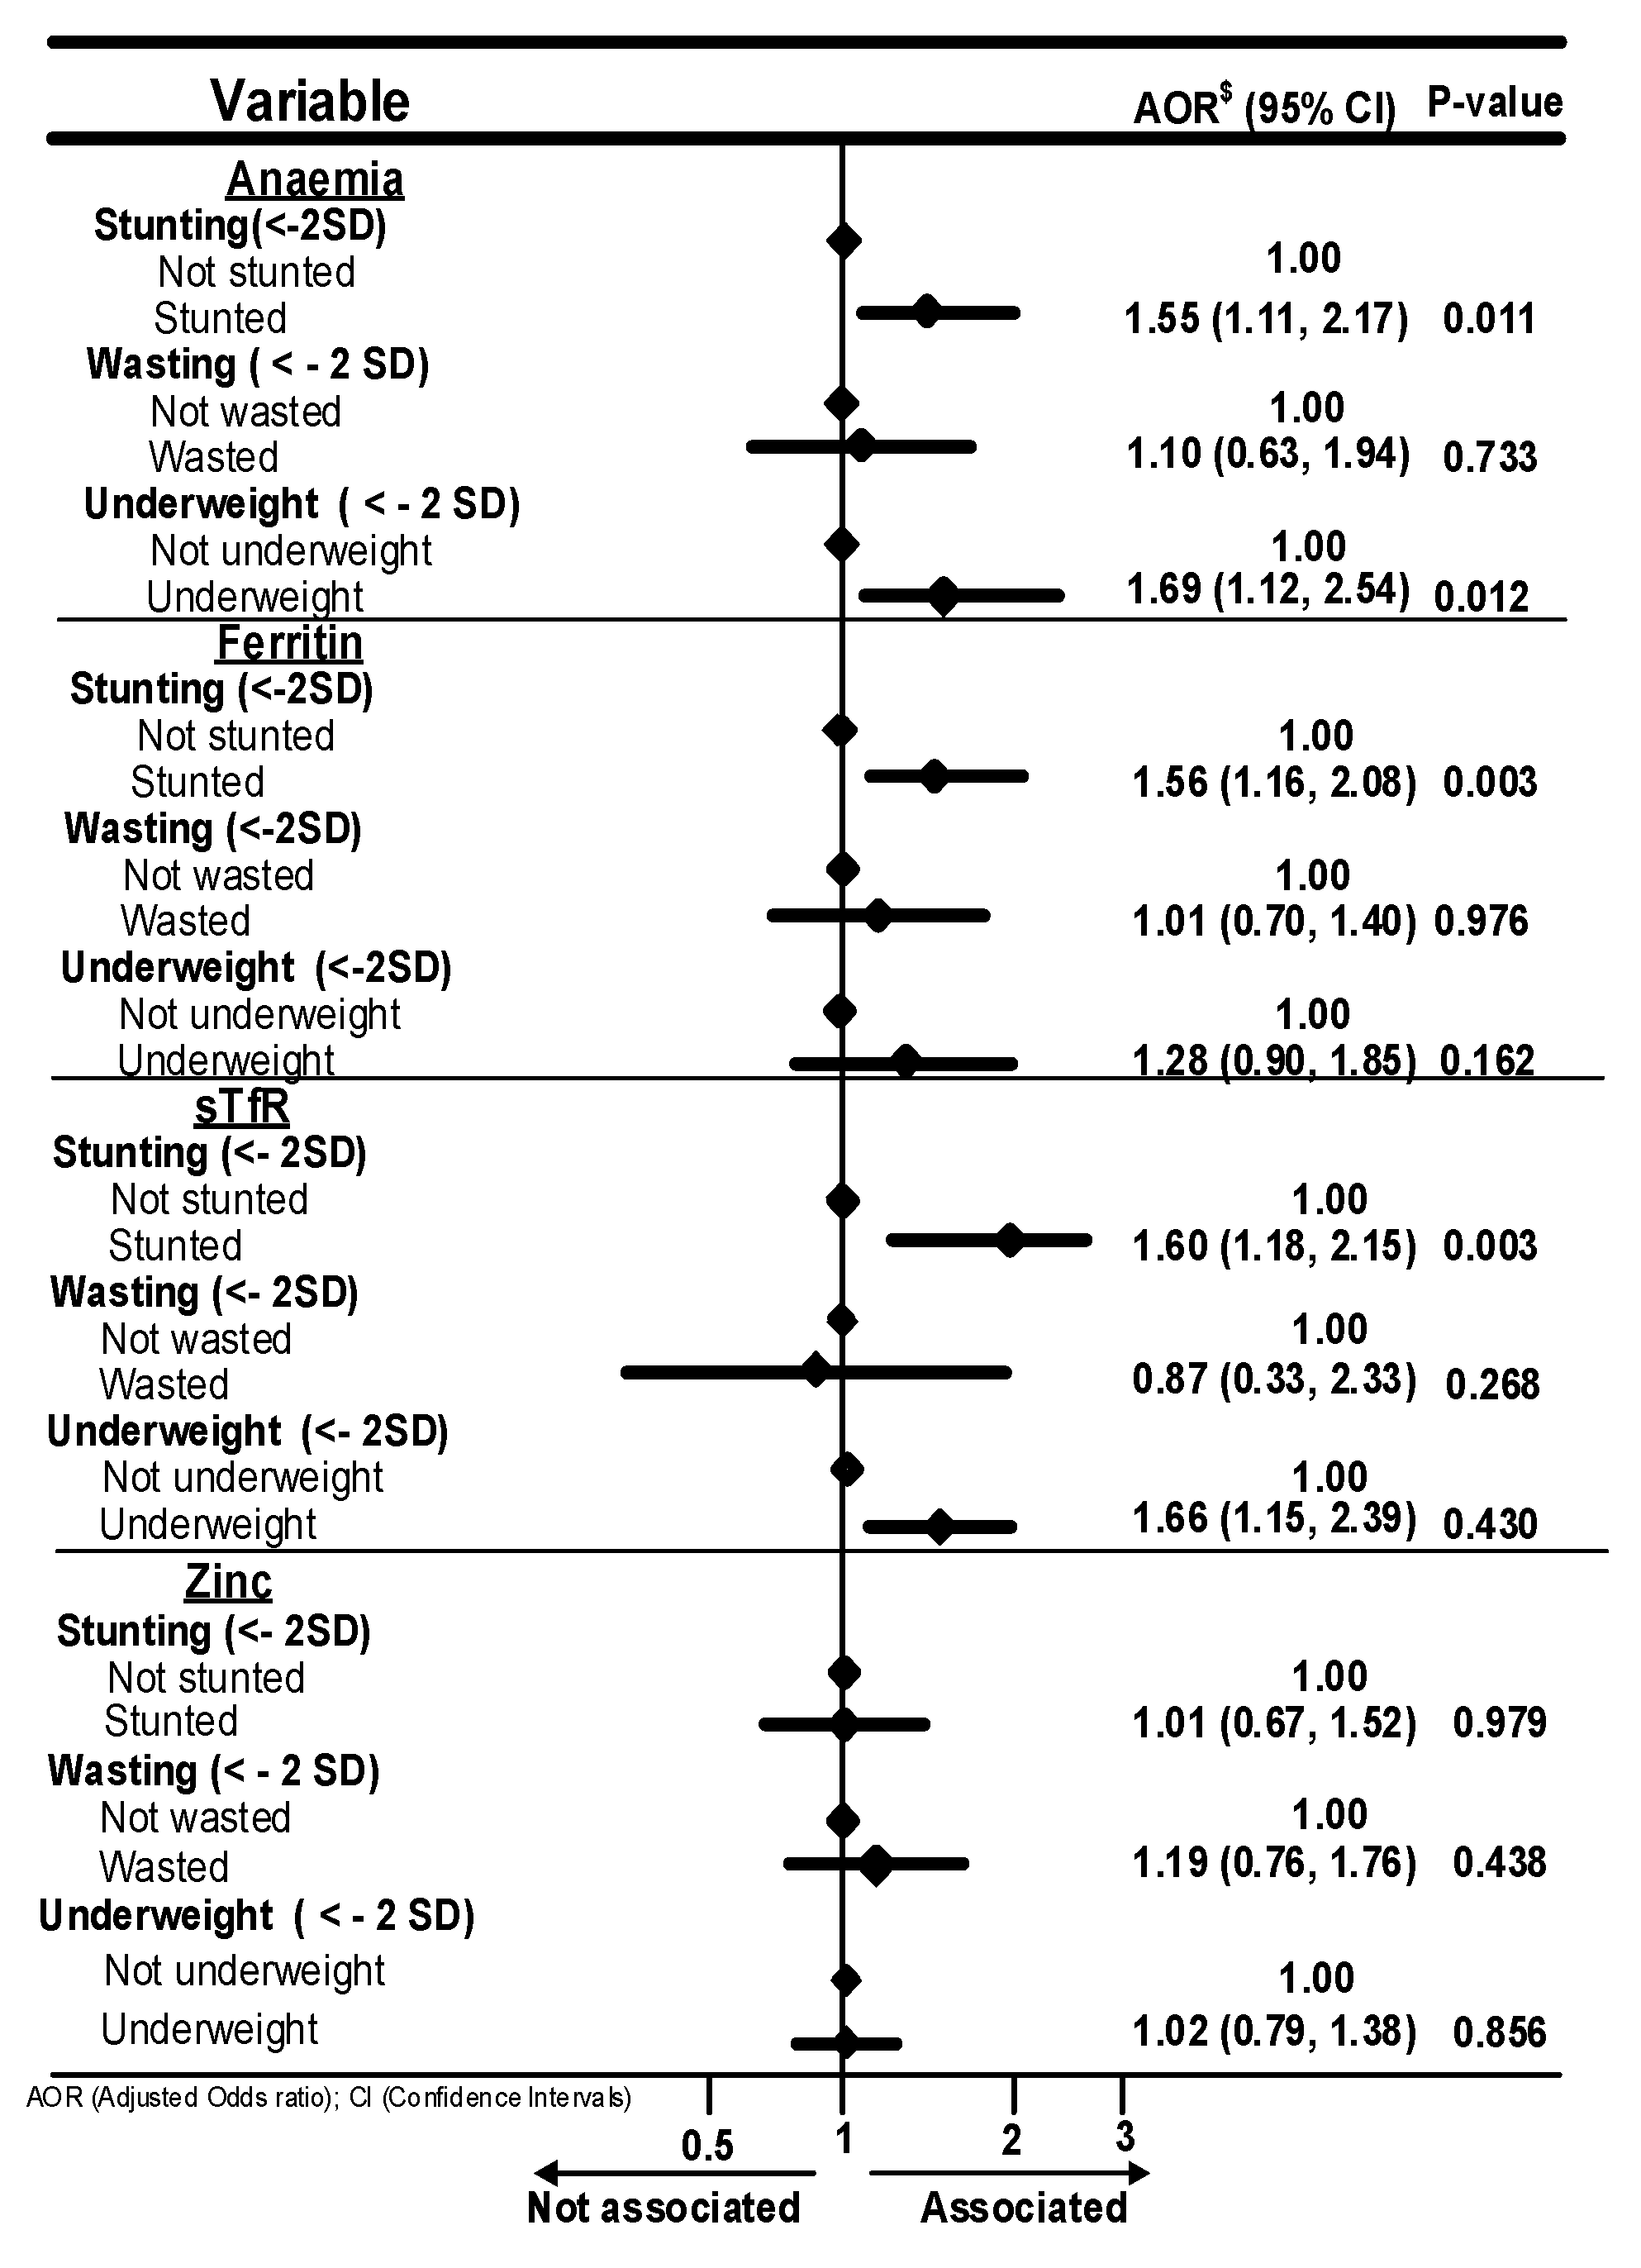
4.2.4. Association of Nutritional Anthropometric Indices with Anaemia and Iron Deficiencies

Figure 1 summarises the association of nutritional anthropometric indices with anaemia, iron deficiencies and zinc deficiency. Stunting [aOR: 1.55; 95% CI: (1.11, 2.17)] and underweight [aOR: 1.69; 95% CI: (1.12, 2.54)] significantly increased the likelihood of anaemia in the children. Stunting significantly increased the odds of iron deficiency (ferritin biomarker) ([aOR: 1.56; 95% CI: (1.16, 2.08)]). The odds of iron deficiency (sTfR biomarker) were increased by both stunting [aOR: 1.60; 95% CI: (1.18, 2.15)] and underweight [aOR: 1.48; 95% CI: (1.14, 1.93)]. The odds of stunting, wasting and underweight among children aged 6–59 months with zinc deficiency were 1% (aOR: 1.01; 95% CI: (067, 1.52, p = 0.979), 19% (aOR: 1.19; 95% CI: (0.76, 1.76, p = 0.438), and 2% (aOR: 1.02; 95% CI: (0.79, 1.38, p = 0.856), respectively.
After adjusting for community, household and individual-level factors, anthropometry and nutrition factors, health status, and water and sanitation factors, significant factors associated with anaemia and iron deficiencies are summarised in Table 3. Children from castes other than the Janajati and Dalit castes had an increased risk of anaemia and iron deficiency (ferritin biomarker). Younger children aged 6–23 months had increased odds of anaemia and iron deficiency (ferritin and sTfR biomarkers). Children who had a fever in the two weeks prior to the survey had increased odds of iron deficiency (ferritin biomarker), and those from the Terai ecological zone had increased odds of iron deficiency (sTfR biomarker). Further, children who did not have diarrhoea in the two weeks preceding the survey had decreased odds of iron deficiency (ferritin biomarker), and those who lived in households with treated water had decreased odds of anaemia. Children from households with severe food insecurity had increased odds of iron deficiency (sTfR biomarker). Children aged 6–59 months living in rural areas have higher odds of zinc deficiency compared to children 6–59 months living in urban areas.

5. Discussion

Based on the analysis of the NNMSS dataset, this current study revealed that more Nepalese children aged 6–59 months who were stunted, wasted and underweight had anaemia and iron deficiencies (both ferritin and sTfR biomarkers) compared to their counterparts who were not. Specifically, stunting was positively associated with iron deficiencies, while being underweight was associated with anaemia and sTfR biomarkers.
Our study revealed that children who were stunted were at increased odds of developing anaemia and iron deficiencies (ferritin and sTfR biomarkers). Similar findings have been reported in previous studies. For instance, a study to determine if stunting could have an effect on the severity of malaria-associated anaemia in African children reported that children who were stunted were at an increased risk of severe anaemia and high serum concentrations of C-reactive protein and sTfR [23]. Another study on polyparasite helminth infections and their association with anaemia and undernutrition in northern Rwanda reported that stunted relatives of non-stunted children were found to be much more inclined to have anaemia [24]. On the other hand, research has supported the assertion that deficiency in iron, which leads to anaemia, is a contributing factor to poor growth. It has also been reported that iron supplementation to anaemic children has a positive effect on linear growth [25].
In this study, children aged between 6 and 59 months belonging to the Janajati caste had lower odds of ferritin than those from the Brahmin/Chettri caste. This finding may be attributed to the fact that a considerable number of women and children from the Janajati caste belong to the lowest wealth quintile. The relationship between caste, wealth and suboptimal nutrition has been reported in previous studies [26]. Furthermore, in the univariable logistic regression analysis, anaemia and sTfR biomarkers were associated with current breastfeeding. However, this association was no longer significant after adjusting for potential confounding factors such as diarrhoea (2 weeks prior to the survey), child’s age (6–59 months) and household food security. These findings supported a cross-sectional study conducted in Kenya among 6–10-month-old infants, which found that duration of breastfeeding correlated haemoglobin and sTfR concentrations and concluded that sTfR concentrations were lower among infants who were still exclusively breastfed at 6–10 months [27].
We found that children who were underweight had an increased likelihood of developing anaemia (low haemoglobin levels). This finding is consistent with findings from previous research on the risk factors for anaemia among school children in the Tanga region, Tanzania [28]. The study found that the risk of all forms of anaemia was high among underweight children, among other factors such as iron deficiency, ascariasis, schistosomiasis, and vitamin A deficiency. The increased odds of experiencing lower haemoglobin levels among underweight children could suggest that the observed anaemia may be diet-related.
In this study, younger children had increased odds of developing anaemia and iron deficiency, which is consistent with a finding from a past study in Rwanda, which reported that older children were significantly less prone to anaemia than younger children [24]. A similar finding was reported in a past study in Kenya [29] and other West African countries [30]. This finding may be attributed to the fact that younger children experience a higher demand for iron, which is associated with early childhood development. Extra iron is therefore required during the growing period of children to increase muscle mass and for the growth spurt of adolescence. The lack of essential minerals and vitamins in the diet of these children, or when such micronutrients are marginalized, may result in nutritional deficiencies.
Our study also reported that children from the Terai ecological zone were more prone to iron deficiency (sTfR levels), while children from castes other than the Janajati, Dalit and Brahmin/Chettri had increased odds of developing anaemia and iron deficiency (ferritin biomarker). Such differences have been found in other past studies [20,31,32,33]. Similar findings have been reported in previous studies, which indicate that geographical location is associated with iron deficiency and is often higher in rural areas than in urban areas [3,34]. A Ugandan study reported the prevalence of anaemia to be higher in one sector (the Bulange sub-county) than in other areas (the Namutumba and Magada sub-counties) [35]. The differences may be a manifestation of some regions or sectors being better off in terms of nutrition education, availability of appropriate and adequate foods or socio-economic resources.
In this study, children aged 6–59 months in rural Nepal were found to have a significantly increased likelihood of zinc deficiency. Several factors, including socio-economic, environmental, and healthcare-related factors, may contribute to this difference in zinc deficiency prevalence between rural and urban areas. In rural settings, limited access to diverse and nutritious foods, poor sanitation and hygiene practices and lower socio-economic status may contribute to inadequate zinc intake and absorption. Additionally, rural populations may have limited access to healthcare services and nutritional interventions compared to urban areas, further exacerbating the risk of nutrient deficiencies. Addressing this rural–urban disparity in the prevalence of zinc deficiency in Nepal would require targeted interventions to improve access to nutritious foods, healthcare services and public health initiatives in rural communities to ensure adequate zinc intake and reduce the burden of zinc deficiency among children. This observation aligns with the results of a cross-sectional study conducted in Nepal, which reported that zinc deficiency was approximately three times more prevalent among children aged 6–59 months residing in rural areas compared to their urban counterparts [36]. These findings are also in line with research conducted in Ethiopia [37] and rural Benin [38]. A key strength of this current study was that the NNMSS, from which our data were acquired, is population-based and nationally representative with large datasets. Consequently, the findings of the study may be applied to any section of the country. The study, however, was limited in a number of ways, which need to be considered when interpreting the results. First, because the study was cross-sectional in design, the causation between anaemia and iron deficiency and their associated factors could not be established. Second, biomarkers such as ferritin and sTfR may not necessarily represent the amount of iron obtained from foods and may be influenced by inflammation, multi-morbidity and interactions between nutrients and drugs.

6. Recommendations

The Ministry of Health and Population and other stakeholders in Nepal should intensify their efforts to institute appropriate education about adequate complementary feeding for young children. Providing information on indigenous Nepalese foods that are iron-rich could go a long way in reducing the prevalence of anaemia in the country.
Since our study found stunting to be significantly associated with anaemia and iron deficiency, a strategic way to minimise anaemia and iron deficiency by the government and other stakeholders would be to pay attention to the factors that increase the risk of stunting, such as being male [39,40,41,42,43], household poverty [39,43,44,45] and baby delivery with assistance from untrained personnel [46,47].

7. Conclusions

In this present study, we demonstrated the association between nutritional anthropometric indices and anaemia and iron deficiency among children aged 6–59 months. Stunted children were more likely to develop anaemia and iron deficiencies (both ferritin and sTfR biomarkers), while underweight children were found to have an increased risk of developing anaemia. The Ministry of Health and Population in Nepal and other stakeholders should intensify efforts to minimise anaemia and iron deficiency among children aged 6–59 months. Factors associated with child stunting and underweight should be considered, most importantly infant and young child feeding practices, which consist mainly of appropriate breastfeeding and complementary feeding.

Author Contributions

Conceptualization, K.E.A. and B.J.A.-I.; Methodology, K.E.A.; Software, K.E.A.; Validation, S.C., S.R., N.P. and S.K.S.; Formal Analysis, K.E.A. and B.J.A.-I.; Resources, B.J.A.-I.; Data Curation, K.E.A. and S.C.; Writing—Original Draft Preparation, K.E.A.; Writing—Review and Editing, K.E.A., S.C., S.R., N.P., S.K.S. and B.J.A.-I.; Supervision, B.J.A.-I.; Project Administration, K.E.A., S.C. and B.J.A.-I. All authors have read and agreed to the published version of the manuscript.

Funding

This research received no external funding.

Institutional Review Board Statement

Not applicable.

Informed Consent Statement

Not applicable. The study used existing secondary data available in public domain survey data sets with all identifier information removed.

Data Availability Statement

The study was based on an analysis of existing survey datasets that are available by applying to UNICEF Nepal, with all identifier information removed. Written informed consent for the present analysis was not necessary because secondary data analysis did not involve interaction with the participants. The data collection methods for the Nepal National Micronutrient Status Survey Report 2016 used in this analysis, including the consent process, have been previously described at [16]. Written informed consent for the present analysis was unnecessary because secondary data analysis did not involve interaction with the participants.

Acknowledgments

The research was funded by USAID Nepal and UNICEF Nepal.

Conflicts of Interest

The authors declare no conflicts of interest.

References

  1. Kalaivani, K. Prevalence & consequences of anaemia in pregnancy. Indian J. Med. Res. 2009, 130, 627–633. [Google Scholar] [PubMed]
  2. Crawley, J. Reducing the burden of anemia in infants and young children in malaria-endemic countries of Africa: From evidence to action. Am. J. Trop. Med. Hyg. 2004, 71 (Suppl. 2), 25–34. [Google Scholar] [CrossRef] [PubMed]
  3. World Health Organisation. Iron Deficiency Anaemia: Assessment, Prevention, and Control. 2001. Available online: http://apps.who.int/iris/bitstream/10665/66914/1/WHO_NHD_01.3.pdf?ua=1 (accessed on 9 September 2018).
  4. Anaemias, W.N. Tools for Effective Prevention and Control; World Health Organization: Geneva, Switzerland, 2017; pp. 1–83. [Google Scholar]
  5. Engle-Stone, R.; Aaron, G.J.; Huang, J.; Wirth, J.P.; Namaste, S.M.; Williams, A.M.; Peerson, J.M.; Rohner, F.; Varadhan, R.; Addo, O.Y.; et al. Predictors of anemia in preschool children: Biomarkers Reflecting Inflammation and Nutritional Determinants of Anemia (BRINDA) project. Am. J. Clin. Nutr. 2017, 106 (Suppl. 1), 402S–415S. [Google Scholar] [CrossRef] [PubMed]
  6. Green, R.; Mitra, A.D. Megaloblastic anemias: Nutritional and other causes. Med. Clin. 2017, 101, 297–317. [Google Scholar]
  7. Global Health Metrics. Anaemia–Level 1 Impairment. Lancet 2019, 393. Available online: https://www.healthdata.org/research-analysis/diseases-injuries/factsheets/anemia-level-1-impairment (accessed on 27 December 2023).
  8. WHO. UNICEF Focusing on Anaemia: Towards an Integrated Approach for Effective Anaemia Control. 2004. Available online: https://www.who.int/publications/m/item/focusing-on-anaemia-towards-an-integrated-approach-for-effective-anaemia-control (accessed on 9 September 2018).
  9. Stevens, G.A.; Finucane, M.M.; De-Regil, L.M.; Paciorek, C.J.; Flaxman, S.R.; Branca, F.; Peña-Rosas, J.P.; Bhutta, Z.A.; Ezzati, M. Global, regional, and national trends in haemoglobin concentration and prevalence of total and severe anaemia in children and pregnant and non-pregnant women for 1995–2011: A systematic analysis of population-representative data. Lancet Glob. Health 2013, 1, e16–e25. [Google Scholar] [CrossRef]
  10. Sustainable Development Goals. Available online: https://sustainabledevelopment.un.org/ (accessed on 9 September 2018).
  11. UNICEF The State of the World’s Children. 2015. Available online: https://data.unicef.org/resources/state-worlds-children-2015/ (accessed on 9 September 2018).
  12. World Food Programme. A Manual: Measuring and Interpreting Malnutrition and Mortality; Nutrition Service WFP: Rome, Italy, 2005; pp. 1–222. [Google Scholar]
  13. Stevens, G.A.; Finucane, M.M.; De-Regil, L.M.; Paciorek, C.J.; Flaxman, S.R.; Branca, F. Assessing the iron status of populations. Report of a Joint World Health Organization/Centers. Trends Cell Biol. 2020, 201424, 30312. [Google Scholar]
  14. Yip, R. Iron deficiency: Contemporary scientific issues and international programmatic approaches. J. Nutr. 1994, 124, S1479–S1490. [Google Scholar] [CrossRef]
  15. Suteerojntrakool, O.; Khongcharoensombat, T.; Chomtho, S.; Bongsebandhu-Phubhakdi, C.; Tempark, T.; Fewtrell, M. Anthropometric Markers and Iron Status of 6–12-Year-Old Thai Children: Associations and Predictors. J. Nutr. Metab. 2021, 2021, 9629718. [Google Scholar] [CrossRef]
  16. Ministry of Health Nepal; New ERA; UNICEF; EU; USAID; CDC. Nepal National Micronutrient Status Survey–2016; Minisry of Health, Nepal: Kathmandu, Nepal, 2017. [Google Scholar]
  17. World Health Organization. WHO Child Growth Standards: Length/Height-for-Age, Weight-for-Age, Weight-for-Length, Weight-for-Height and Body Mass Index-for-Age: Methods and Development; World Health Organization: Geneva, Switzerland, 2006. [Google Scholar]
  18. Balcı, Y.I.; Karabulut, A.; Gürses, D.; Çövüt, I.E. Prevalence and risk factors of anemia among adolescents in Denizli, Turkey. Iran. J. Pediatr. 2012, 22, 77. [Google Scholar]
  19. Alzaheb, R.A.; Al-Amer, O. The Prevalence of Iron Deficiency Anemia and its Associated Risk Factors among a Sample of Female University Students in Tabuk, Saudi Arabia. Clin. Med. Insights: Women’s Health 2017, 10, 1179562X17745088. [Google Scholar] [CrossRef]
  20. Alaofè, H.; Burney, J.; Naylor, R.; Taren, D. Prevalence of anaemia, deficiencies of iron and vitamin A and their determinants in rural women and young children: A cross-sectional study in Kalalé district of northern Benin. Public Health Nutr. 2017, 20, 1203–1213. [Google Scholar] [CrossRef]
  21. Harding, K.L.; Aguayo, V.M.; Namirembe, G.; Webb, P. Determinants of anemia among women and children in Nepal and Pakistan: An analysis of recent national survey data. Matern. Child Nutr. 2018, 14, e12478. [Google Scholar] [CrossRef] [PubMed]
  22. Filmer, D.; Pritchett, L.H. Estimating Wealth Effects without Expenditure Data—Or Tears: An Application to Educational Enrollments in States of India. Demography 2001, 38, 115–132. [Google Scholar]
  23. Verhoef, H.; West, C.E.; Veenemans, J.; Beguin, Y.; Kok, F.J. Stunting may determine the severity of malaria-associated anemia in African children. Pediatrics 2002, 110, e48. [Google Scholar] [CrossRef]
  24. Mupfasoni, D.; Karibushi, B.; Koukounari, A.; Ruberanziza, E.; Kaberuka, T.; Kramer, M.H.; Mukabayire, O.; Kabera, M.; Nizeyimana, V.; Deville, M.-A. Polyparasite helminth infections and their association to anaemia and undernutrition in Northern Rwanda. PLoS Neglected Trop. Dis. 2009, 3, e517. [Google Scholar] [CrossRef]
  25. Bhandari, N.; Bahl, R.; Taneja, S. Effect of micronutrient supplementation on linear growth of children. Br. J. Nutr. 2001, 85, S131–S137. [Google Scholar] [CrossRef] [PubMed]
  26. Pandey, J.P.; Dhakal, M.R.; Sujan Karki, S.K.; Pradeep Poudel, P.P.; Pradhan, M.S. Maternal and Child Health in Nepal: The Effects of Caste, Ethnicity, and Regional Identity: Further Analysis of the 2011 Nepal Demographic and Health Survey. Available online: https://dhsprogram.com/publications/publication-fa73-further-analysis.cfm (accessed on 25 February 2024).
  27. Uyoga, M.A.; Karanja, S.; Paganini, D.; Cercamondi, C.I.; Zimmermann, S.A.; Ngugi, B.; Holding, P.; Moretti, D.; Zimmermann, M.B. Duration of exclusive breastfeeding is a positive predictor of iron status in 6-to 10-month-old infants in rural Kenya. Matern. Child Nutr. 2017, 13, e12386. [Google Scholar] [CrossRef]
  28. Tatala, S.; Kihamia, C.; Kyungu, L.; Svanbergrhaaa, U. Risk factors for anaemia in schoolchildren in Tanga Region, Tanzania. Tanzan. J. Health Res. 2008, 10, 4. [Google Scholar] [CrossRef]
  29. Ngesa, O.; Mwambi, H. Prevalence and risk factors of anaemia among children aged between 6 months and 14 years in Kenya. PLoS ONE 2014, 9, e113756. [Google Scholar] [CrossRef] [PubMed]
  30. Magalhaes, R.J.S.; Clements, A.C. Mapping the risk of anaemia in preschool-age children: The contribution of malnutrition, malaria, and helminth infections in West Africa. PLoS Med. 2011, 8, e1000438. [Google Scholar]
  31. Desalegn, A.; Mossie, A.; Gedefaw, L. Nutritional iron deficiency anemia: Magnitude and its predictors among school age children, southwest ethiopia: A community based cross-sectional study. PLoS ONE 2014, 9, e114059. [Google Scholar] [CrossRef]
  32. Herrador, Z.; Sordo, L.; Gadisa, E.; Buño, A.; Gómez-Rioja, R.; Iturzaeta, J.M.; de Armas, L.F.; Benito, A.; Aseffa, A.; Moreno, J. Micronutrient deficiencies and related factors in school-aged children in Ethiopia: A cross-sectional study in Libo Kemkem and Fogera districts, Amhara Regional State. PLoS ONE 2014, 9, e112858. [Google Scholar] [CrossRef]
  33. International Zinc Nutrition Consultative Group (IZiNCG). Determining the Risk of Zinc Deficiency: Assessment of Dietary Zinc Intake. 2007. Available online: https://static1.squarespace.com/static/56424f6ce4b0552eb7fdc4e8/t/5c7d940dc830258ac74be573/1551733775429/IZiNCG_Technical+Brief+%233_2nd+Ed_04Mar2019_final.pdf (accessed on 30 April 2018).
  34. Preziosi, P.; Prual, A.; Galan, P.; Daouda, H.; Boureima, H.; Hercberg, S. Effect of iron supplementation on the iron status of pregnant women: Consequences for newborns. Am. J. Clin. Nutr. 1997, 66, 1178–1182. [Google Scholar] [CrossRef] [PubMed]
  35. Kuziga, F.; Adoke, Y.; Wanyenze, R.K. Prevalence and factors associated with anaemia among children aged 6 to 59 months in Namutumba district, Uganda: A cross-sectional study. BMC Pediatr. 2017, 17, 25. [Google Scholar] [CrossRef] [PubMed]
  36. Chitekwe, S.; Parajuli, K.R.; Paudyal, N.; Haag, K.C.; Renzaho, A.; Issaka, A.; Agho, K. Individual, household and national factors associated with iron, vitamin A and zinc deficiencies among children aged 6–59 months in Nepal. Matern. Child Nutr. 2022, 18, e13305. [Google Scholar] [CrossRef] [PubMed]
  37. Belay, A.; Gashu, D.; Joy, E.J.; Lark, R.M.; Chagumaira, C.; Likoswe, B.H.; Zerfu, D.; Ander, E.L.; Young, S.D.; Bailey, E.H.; et al. Zinc deficiency is highly prevalent and spatially dependent over short distances in Ethiopia. Sci. Rep. 2021, 11, 6510. [Google Scholar] [CrossRef]
  38. Galetti, V.; Mitchikpè, C.E.; Kujinga, P.; Tossou, F.; Hounhouigan, D.J.; Zimmermann, M.B.; Moretti, D. Rural Beninese children are at risk of zinc deficiency according to stunting prevalence and plasma zinc concentration but not dietary zinc intakes. J. Nutr. 2016, 146, 114–123. [Google Scholar] [CrossRef] [PubMed]
  39. Kavosi, E.; Rostami, Z.H.; Kavosi, Z.; Nasihatkon, A.; Moghadami, M.; Heidari, M. Prevalence and determinants of under-nutrition among children under six: A cross-sectional survey in Fars province, Iran. Int. J. Health Policy Manag. 2014, 3, 71. [Google Scholar] [CrossRef] [PubMed]
  40. Masibo, P.K.; Makoka, D. Trends and determinants of undernutrition among young Kenyan children: Kenya Demographic and Health Survey; 1993, 1998, 2003 and 2008–2009. Public Health Nutr. 2012, 15, 1715–1727. [Google Scholar] [CrossRef]
  41. Agho, K.E.; Inder, K.J.; Bowe, S.J.; Jacobs, J.; Dibley, M.J. Prevalence and risk factors for stunting and severe stunting among under-fives in North Maluku province of Indonesia. BMC Pediatr. 2009, 9, 64. [Google Scholar]
  42. Darteh, E.K.M.; Acquah, E.; Kumi-Kyereme, A. Correlates of stunting among children in Ghana. BMC Public Health 2014, 14, 504. [Google Scholar] [CrossRef]
  43. Akombi, B.J.; Agho, K.E.; Hall, J.J.; Merom, D.; Astell-Burt, T.; Renzaho, A.M. Stunting and severe stunting among children under-5 years in Nigeria: A multilevel analysis. BMC Pediatr. 2017, 17, 15. [Google Scholar] [CrossRef]
  44. Masiye, F.; Chama, C.; Chitah, B.; Jonsson, D. Determinants of child nutritional status in Zambia: An analysis of a national survey. Zamb. Soc. Sci. J. 2010, 1, 4. [Google Scholar]
  45. Tiwari, R.; Ausman, L.M.; Agho, K.E. Determinants of stunting and severe stunting among under-fives: Evidence from the 2011 Nepal Demographic and Health Survey. BMC Pediatr. 2014, 14, 239. [Google Scholar] [CrossRef] [PubMed]
  46. Biswas, S.; Bose, K. Association between place of delivery and undernutrition. Nutr Segm. 2011, 1, 154. [Google Scholar]
  47. Rahman, A.; Chowdhury, S. Determinants of chronic malnutrition among preschool children in Bangladesh. J. Biosoc. Sci. 2007, 39, 161–173. [Google Scholar] [CrossRef] [PubMed]
Figure 1. Association of nutritional anthropometric indices with anaemia, iron and zinc deficiencies. $: Independent variables adjusted are: Community level, household level, Individual level factors, health status, current breastfeeding, anthropometric and nutrition, Water and Sanitation factors.
Nutrients 16 00698 g001
Table 1. Characteristics distribution of children aged 6–59 months.
CharacteristicsN (%)
Individual level factors
Child’s age (months)
6–23520 (30.6)
24–591180 (69.4)
Child’s gender
Male909 (53.5)
Female791 (46.5)
Relation to child
Biological parents1643 (96.7)
Others57 (3.3)
Health status
Child had fever
Yes619 (36.4)
No1080 (61.6)
Child had cough
Yes649 (38.2)
No1051 (61.8)
Child had diarrhoea
Yes334 (19.6)
No1366 (80.4)
Anthropometry and nutrition
Current Breastfeeding
No1229 (71.9)
Yes481 (28.1)
Child Stunted (<−2 SD)
No1095 (64.4)
Yes605 (35.6)
Child wasted (<−2 SD)
No1495 (88.3)
Yes199 (11.7)
Child underweight (<−2 SD)
No1206 (71.0)
Yes494 (29.0)
Household level factors
Household Wealth Index
Poor698 (41.1)
Middle676 (39.8)
Rich325 (19.1)
Ethnicity (Caste)
Brahmin/Chettri518 (30.5)
Dalit313 (18.4)
Janajati496 (29.2)
Others371 (21.9)
Community level factors
Residence
Urban220 (13.0)
Rural1480 (87.0)
Geographical region
Eastern369 (21.6)
Central620 (36.5)
Western297 (17.5)
Mid-western242 (14.3)
Far-western171 (10.1)
Ecological zone
Mountain130 (7.6)
Hill709 (41.7)
Terai861 (50.7)
Dietary Diversity
<4 foods1304 (76.7)
4 or more foods
Household food security
395 (23.3)
Food security909 (53.5)
Mild food security183 (10.8)
Moderate food security464 (27.3)
Severe food insecurity143 (8.4)
Water and Sanitation
Source of drinking water
Improved1564 (92.0)
Unimproved136 (8.0)
Type of toilet facility
Flush or Pour flush toilet1210 (71.2)
Pit Latrine490 (28.8)
Water treatment habit
Yes282 (16.6)
No1417 (83.4)
Table 2. Prevalence and 95% confidence interval (CI) and unadjusted odd ratios (OR) of anaemia, ferritin and sTfR by nutritional anthropometric index among children aged 6–59 months.
VariablePrevalence (95%CI)OR (95% CI)p-Value
Anaemia (Haemoglobin < 11.0 g/dL)
Stunting (<−2 SD)
Not stunted17.1 (13.9, 20.7)1.00
Stunted22.8 (18.3, 28.2)1.44 (1.04, 1.98)0.027
Wasting (<−2 SD)
Not wasted16.9 (13.9, 20.6)1.00
Wasted24.4 (19.2, 30.5)1.58 (1.11, 2.26)0.012
Underweight (<−2 SD)
Not underweight18.6 (15.4, 22.2)1.00
Underweight23.1 (15.6, 32.9)1.32 (0.78, 2.21)0.294
BRINDA adjusted Ferritin (<15 μg/L)
Stunting (<−2 SD)
Not stunted33.1 (29.7, 36.7)1.00
Stunted40.1 (33.2, 47.5)1.35 (1.04, 1.77)0.026
Wasting (<−2 SD)
Not wasted34.7 (30.8, 38.8)1.00
Wasted37.7 (31.0, 44.9)1.14 (0.87, 1.49)0.328
Underweight (<−2 SD)
Not underweight35.2 (31.2, 39.3)1.00
Underweight39.2 (29.4, 49.8)1.19 (0.80, 1.77)0.397
BRINDA adjusted sTfR (>8.3 mg/L)
Stunting (<−2 SD)
Not stunted34.8 (30.5, 39.4)1.00
Stunted40.3 (33.0, 48.0)1.26 (0.96, 1.66)0.089
Wasting (<−2 SD)
Not wasted34.9 (30.2, 39.9)1.00
Wasted41.3 (34.3, 48.7)1.31 (0.99, 1.73)0.054
Underweight (<−2 SD)
Not underweight36.8 (31.8, 42.0)1.00
Underweight37.3 (29.1, 46.3)1.02 (0.70, 1.49)0.906
Zinc deficiency (adjusted serum zinc < 65.0 μg/dL)
Stunting (<−2 SD)
Not stunted20.3 (16.5, 24.7)1.00
Stunted20.8 (15.9, 26.8)1.03 (0.70, 1.51)0.874
Wasting (<−2 SD)
Not wasted20.0 (16.9, 23.6)1.00
Wasted24.2 (16.3, 34.2)1.27 (0.81, 1.99)0.293
Underweight (<−2 SD)
Not underweight20.1 (16.6, 24.1)1.00
Underweight21.3 (17.0, 26.3)1.08 (0.83, 1.40)0.579
Table 3. Non-biological factors associated with anaemia, ferritin, sTfR and zinc deficiency among children aged 6–59 months in Nepal: adjusted odd ratios (AOR); CI: confidence interval.
CharacteristicsAdjusted OR (95% CI)p-ValueAdjusted OR (95% CI)p-ValueAdjusted OR (95% CI)p-ValueAdjusted OR (95% CI)p-Value
AnaemiaFerritinsTfRZinc
Ecological zone
Mountain 1.00
Hill 1.39 (0.86, 2.25)0.170
Terai 3.80 (2.20, 6.59)<0.001
Place of residence
Urban 1.00
Rural 3.03 (1.56, 5.92)0.001
Ethnicity (Caste)
Brahmin/chettri1.00 1.00
Dalit1.13 (0.70, 1.86)0.5950.96 (0.61, 1.52)0.859
Janajati1.20 (0.76, 1.88)0.4250.50 (0.32, 0.77)0.002
Others2.60 (1.65, 4.10)<0.0011.51 (1.08, 2.13)0.019
Child Age
24–59 months1.00 1.00 1.00
6–23 months3.26 (2.43, 4.38)<0.0014.18 (3.00, 5.83)<0.0014.39 (3.39, 5.95)<0.001
Child had diarrhoea
Yes1.00 1.00
No0.61 (0.38, 0.97)0.0360.63 (0.46, 0.86)0.004
Child’s household treated water
No1.00
Yes0.53 (0.34, 0.83)0.007
Child had fever
No 1.00
Yes 1.83 (1.30, 0.57)0.001
Household wealth index
Food secure 1.00
Mild food security 0.88 (0.53, 1.39)0.540
Moderate food security 1.24 (0.86, 1.80)0.244
Severe food insecurity 1.41 (1.00, 1.99)0.048
Disclaimer/Publisher’s Note: The statements, opinions and data contained in all publications are solely those of the individual author(s) and contributor(s) and not of MDPI and/or the editor(s). MDPI and/or the editor(s) disclaim responsibility for any injury to people or property resulting from any ideas, methods, instructions or products referred to in the content.

