
The Impact of Glucomannan, Inulin, and Psyllium Supplementation (SolowaysTM) on Weight Loss in Adults with FTO, LEP, LEPR, and MC4R Polymorphisms: A Randomized, Double-Blind, Placebo-Controlled Trial

 , , ,
, , ,
Abstract
1. Introduction
2. Materials and Methods
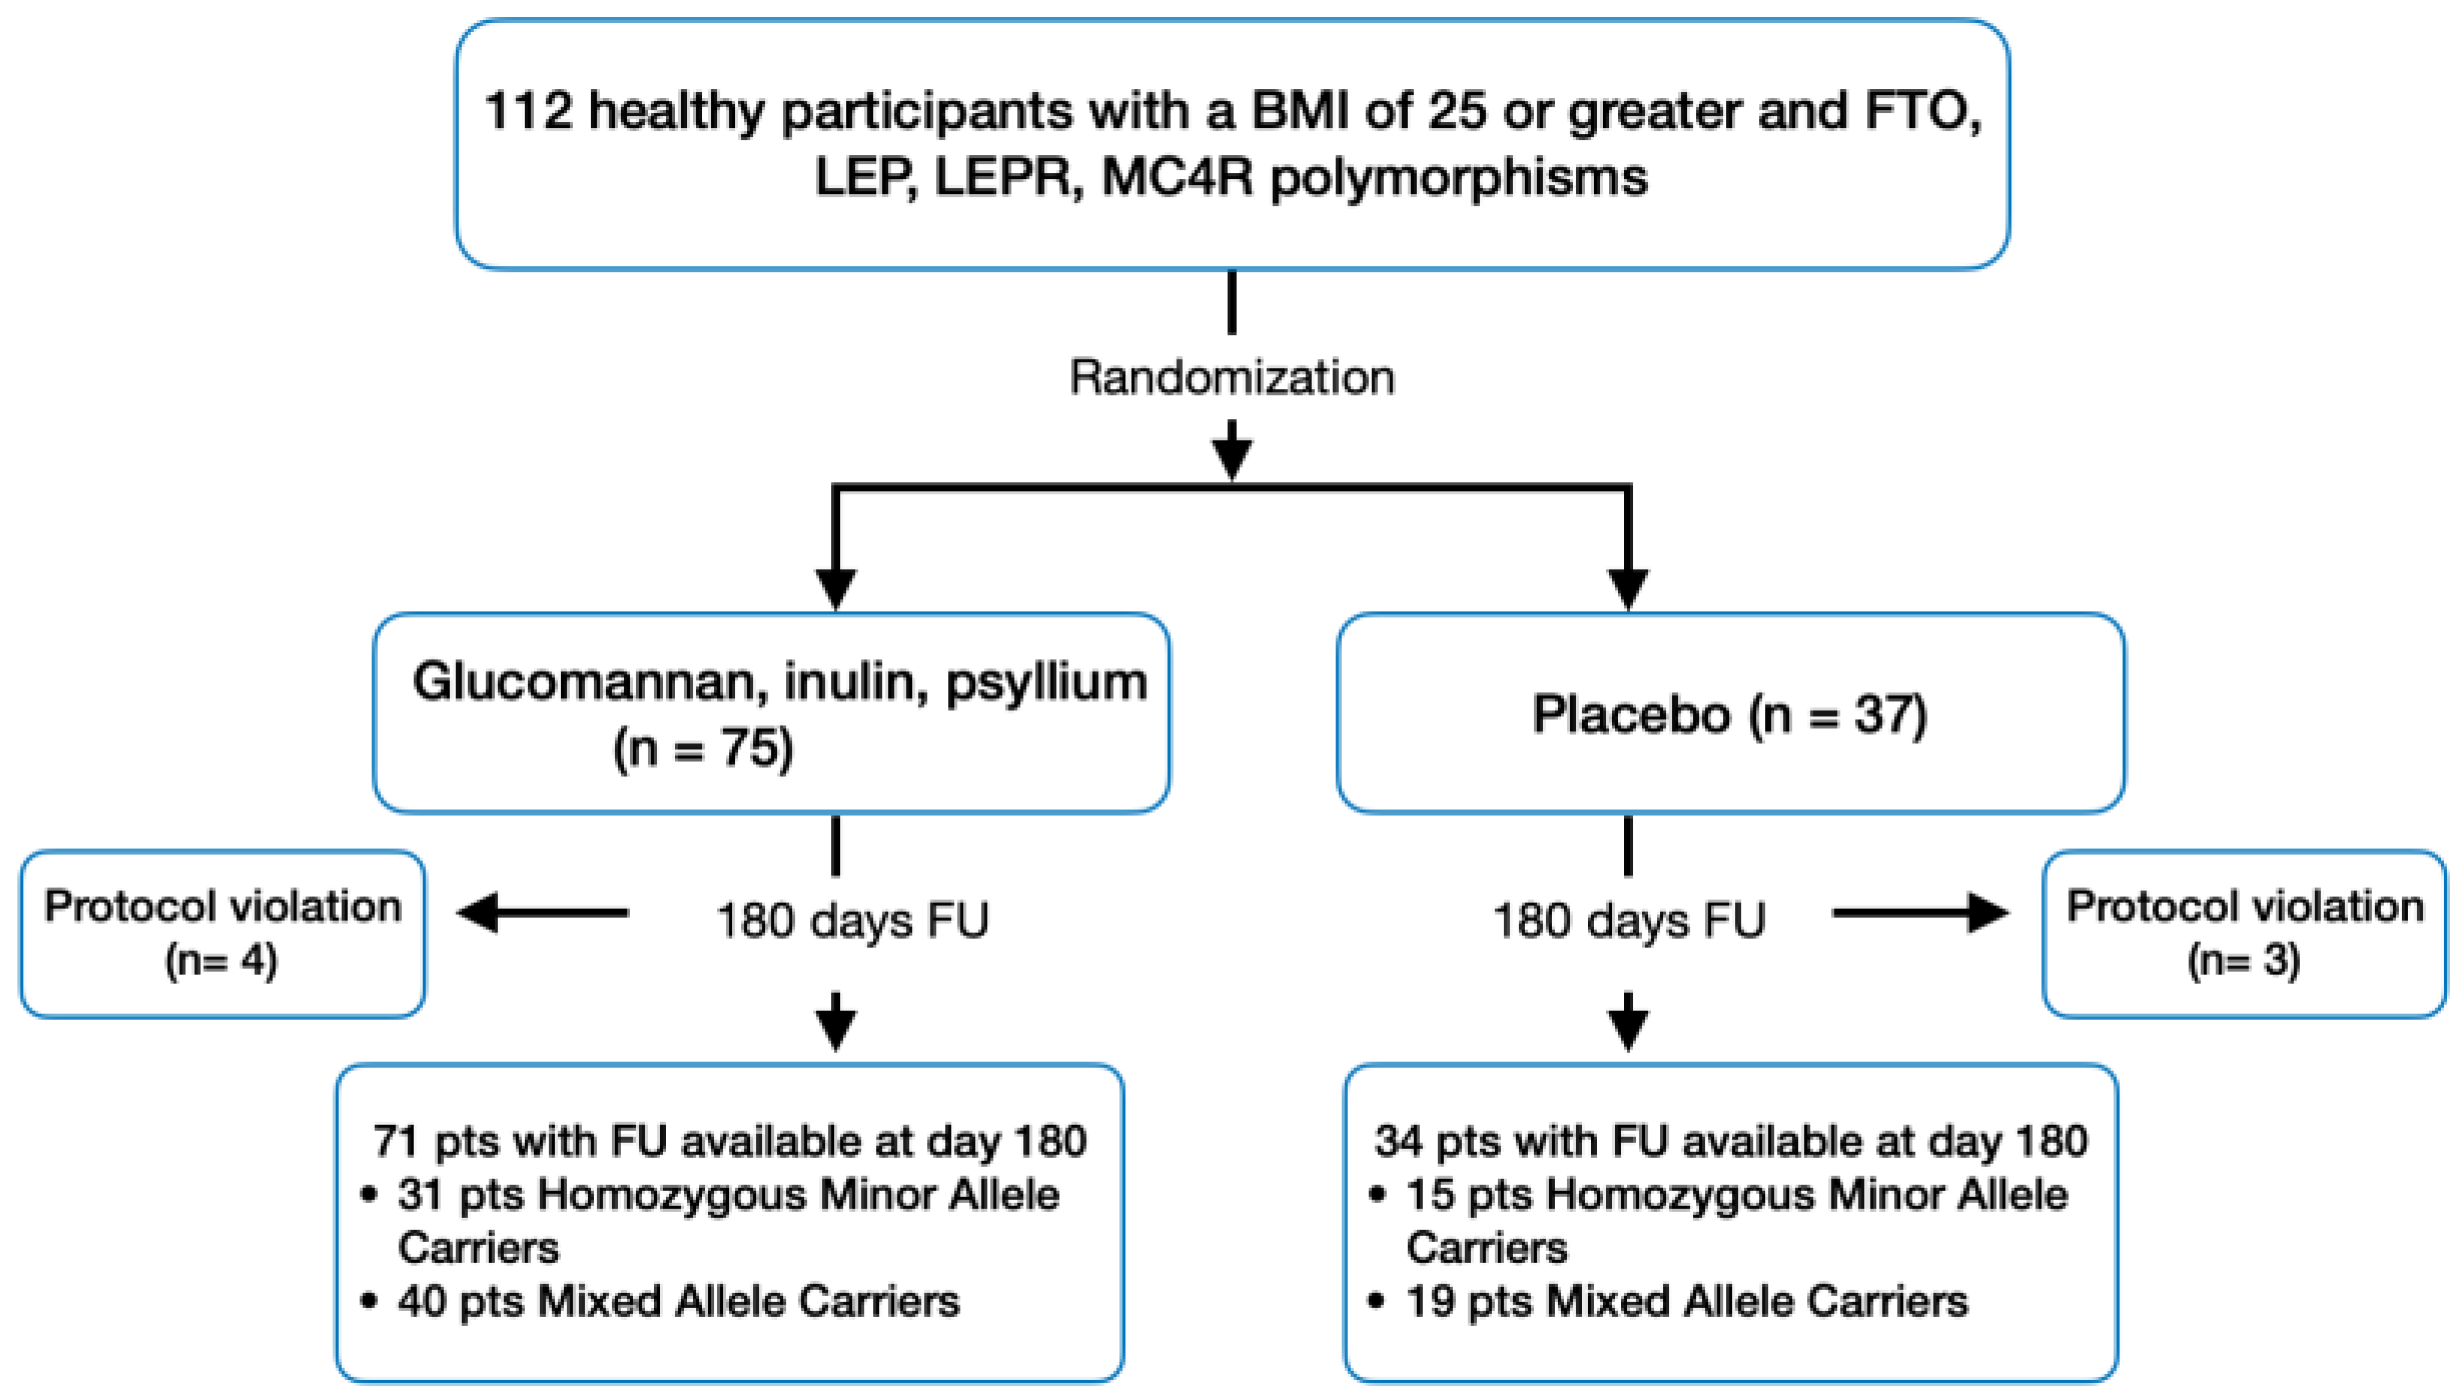
2.1. Patient Population and Design
- Healthy participants aged between 40 and 60 years;
- BMI of 25 or greater and no more than a 3% change in body mass within the last three months;
- Presence of at least one minor allele in any of the following genetic polymorphisms: FTO (rs9939609; T > A), LEP (rs2167270; G > A), LEPR (rs1137101; A > G; Gln223Arg), and MC4R (rs17782313; T > C) [38].
- Individuals who have taken any prescribed medications or dietary supplements in the two weeks prior to the study;
- Those with a clinically significant history of major digestive, liver, kidney, cardiovascular, hematological diseases, diabetes, gastrointestinal disorders, or any other serious acute or chronic medical conditions.
2.2. Study Endpoints and Assessments
2.3. Sample Size Calculation and Statistical Power
2.4. Statistical Analyses
3. Results
3.1. Change in Body Weight
3.2. Other Secondary End Points
3.3. Postprandial Appetite
3.4. Safety and Side-Effect Profile
4. Discussion
5. Conclusions
Author Contributions
Funding
Institutional Review Board Statement
Informed Consent Statement
Data Availability Statement
Acknowledgments
Conflicts of Interest
References
- NCD Risk Factor Collaboration. Worldwide trends in body-mass index, underweight, overweight, and obesity from 1975 to 2016: A pooled analysis of 2416 population-based measurement studies in 128.9 million children, adolescents, and adults. Lancet 2017, 390, 2627–2642. [Google Scholar] [CrossRef] [PubMed]
- Pagotto, U.; Vanuzzo, D.; Vicennati, V.; Pasquali, R. Pharmacological therapy of obesity. G. Ital. Cardiol. 2008, 9, 83S–93S. [Google Scholar]
- Fried, M.; Hainer, V.; Basdevant, A.; Buchwald, H.; Deitel, M.; Finer, N.; Greve, J.W.M.; Horber, F.; Mathus-Vliegen, E.; Scopinaro, N.; et al. Interdisciplinary European guidelines on surgery of severe obesity. Obes. Facts 2008, 1, 52–59. [Google Scholar] [CrossRef] [PubMed]
- Artham, S.M.; Lavie, C.J.; Milani, R.V.; Ventura, H.O. The obesity paradox: Impact of obesity on the prevalence and prognosis of cardiovascular diseases. Postgrad. Med. 2008, 120, 34–41. [Google Scholar] [CrossRef] [PubMed]
- Abdelaal, M.; le Roux, C.W.; Docherty, N.G. Morbidity and mortality associated with obesity. Ann. Transl. Med. 2017, 5, 161. [Google Scholar] [CrossRef] [PubMed]
- Kushner, R.F.; Ryan, D.H. Assessment and lifestyle management of patients with obesity: Clinical recommendations from systematic reviews. JAMA 2014, 312, 943–952. [Google Scholar] [CrossRef] [PubMed]
- Corella, D.; Qi, L.; Sorlí, J.V.; Godoy, D.; Portolés, O.; Coltell, O.; Greenberg, A.S.; Ordovas, J.M. Obese subjects carrying the 11482G > A polymorphism at the perilipin locus are resistant to weight loss after dietary energy restriction. J. Clin. Endocrinol. Metab. 2005, 90, 5121–5126. [Google Scholar] [CrossRef]
- Phares, D.A.; Halverstadt, A.A.; Shuldiner, A.R.; Ferrell, R.E.; Douglass, L.W.; Ryan, A.S.; Goldberg, A.P.; Hagberg, J.M. Association between body fat response to exercise training and multilocus ADR genotypes. Obes. Res. 2004, 12, 807–815. [Google Scholar] [CrossRef]
- MacLean, P.S.; Wing, R.R.; Davidson, T.; Epstein, L.; Goodpaster, B.; Hall, K.D.; Levin, B.E.; Perri, M.G.; Rolls, B.J.; Rosenbaum, M.; et al. NIH working group report: Innovative research to improve maintenance of weight loss. Obesity 2015, 23, 7–15. [Google Scholar] [CrossRef]
- Apovian, C.M.; Aronne, L.J.; Bessesen, D.H.; McDonnell, M.E.; Murad, M.H.; Pagotto, U.; Ryan, D.H.; Still, C.D.; Endocrine, S. Pharmacological management of obesity: An endocrine Society clinical practice guideline. J. Clin. Endocrinol. Metab. 2015, 100, 342–362. [Google Scholar] [CrossRef] [PubMed]
- Patel, D. Pharmacotherapy for the management of obesity. Metab. Clin. Exp. 2015, 64, 1376–1385. [Google Scholar] [CrossRef] [PubMed]
- Jovanovski, E.; Mazhar, N.; Komishon, A.; Khayyat, R.; Li, D.; Blanco Mejia, S.; Khan, T.; Jenkins, A.L.; Smircic-Duvnjak, L.; Sievenpiper, J.L.; et al. Can dietary viscous fiber affect body weight independently of an energy-restrictive diet? A systematic review and meta-analysis of randomized controlled trials. Am. J. Clin. Nutr. 2020, 111, 471–485. [Google Scholar] [CrossRef] [PubMed]
- Malnick, S.D.H.; Knobler, H. The medical complications of obesity. QJM Mon. J. Assoc. Physicians 2006, 99, 565–579. [Google Scholar] [CrossRef] [PubMed]
- Reynolds, A.; Mann, J.; Cummings, J.; Winter, N.; Mete, E.; Te Morenga, L. Carbohydrate quality and human health: A series of systematic reviews and meta-analyses. Lancet 2019, 393, 434–445. [Google Scholar] [CrossRef] [PubMed]
- Slavin, J.L. Dietary fiber and body weight. Nutrition 2005, 21, 411–418. [Google Scholar] [CrossRef]
- Thompson, S.V.; Hannon, B.A.; An, R.; Holscher, H.D. Effects of isolated soluble fiber supplementation on body weight, glycemia, and insulinemia in adults with overweight and obesity: A systematic review and meta-analysis of randomized controlled trials. Am. J. Clin. Nutr. 2017, 106, 1514–1528. [Google Scholar] [CrossRef] [PubMed]
- Fuglsang-Nielsen, R.; Rakvaag, E.; Langdahl, B.; Knudsen, K.E.B.; Hartmann, B.; Holst, J.J.; Hermansen, K.; Gregersen, S. Effects of whey protein and dietary fiber intake on insulin sensitivity, body composition, energy expenditure, blood pressure, and appetite in subjects with abdominal obesity. Eur. J. Clin. Nutr. 2021, 75, 611–619. [Google Scholar] [CrossRef]
- Lyon, M.R.; Reichert, R.G. The effect of a novel viscous polysaccharide along with lifestyle changes on short-term weight loss and associated risk factors in overweight and obese adults: An observational retrospective clinical program analysis. Altern. Med. Rev. A J. Clin. Ther. 2010, 15, 68–75. [Google Scholar]
- Cairella, M.; Marchini, G. Evaluation of the action of glucomannan on metabolic parameters and on the sensation of satiation in overweight and obese patients. Clin. Ter. 1995, 146, 269–274. [Google Scholar]
- Hess, A.L.; Benítez-Páez, A.; Blædel, T.; Larsen, L.H.; Iglesias, J.R.; Madera, C.; Sanz, Y.; Larsen, T.M.; MyNewGut, C. The effect of inulin and resistant maltodextrin on weight loss during energy restriction: A randomised, placebo-controlled, double-blinded intervention. Eur. J. Nutr. 2020, 59, 2507–2524. [Google Scholar] [CrossRef]
- Qin, Y.-Q.; Wang, L.-Y.; Yang, X.-Y.; Xu, Y.-J.; Fan, G.; Fan, Y.-G.; Ren, J.-N.; An, Q.; Li, X. Inulin: Properties and health benefits. Food Funct. 2023, 14, 2948–2968. [Google Scholar] [CrossRef]
- Brighenti, F. Dietary fructans and serum triacylglycerols: A meta-analysis of randomized controlled trials. J. Nutr. 2007, 137, 2552S–2556S. [Google Scholar] [CrossRef] [PubMed]
- McRorie, J.W.; McKeown, N.M. Understanding the Physics of Functional Fibers in the Gastrointestinal Tract: An Evidence-Based Approach to Resolving Enduring Misconceptions about Insoluble and Soluble Fiber. J. Acad. Nutr. Diet. 2017, 117, 251–264. [Google Scholar] [CrossRef] [PubMed]
- Blackwood, A.D.; Salter, J.; Dettmar, P.W.; Chaplin, M.F. Dietary fibre, physicochemical properties and their relationship to health. J. R. Soc. Promot. Health 2000, 120, 242–247. [Google Scholar] [CrossRef] [PubMed]
- Yao, M.; Roberts, S.B. Dietary energy density and weight regulation. Nutr. Rev. 2001, 59, 247–258. [Google Scholar] [CrossRef] [PubMed]
- Holt, S.; Brand, J.; Soveny, C.; Hansky, J. Relationship of satiety to postprandial glycaemic, insulin and cholecystokinin responses. Appetite 1992, 18, 129–141. [Google Scholar] [CrossRef] [PubMed]
- Burton-Freeman, B.; Davis, P.A.; Schneeman, B.O. Plasma cholecystokinin is associated with subjective measures of satiety in women. Am. J. Clin. Nutr. 2002, 76, 659–667. [Google Scholar] [CrossRef]
- Anderson, J.W.; Randles, K.M.; Kendall, C.W.C.; Jenkins, D.J.A. Carbohydrate and fiber recommendations for individuals with diabetes: A quantitative assessment and meta-analysis of the evidence. J. Am. Coll. Nutr. 2004, 23, 5–17. [Google Scholar] [CrossRef] [PubMed]
- Goodarzi, M.O. Genetics of Obesity: What Genetic Association Studies Have Taught Us about the Biology of Obesity and Its Complications. Lancet Diabetes Endocrinol. 2018, 6, 223–236. [Google Scholar] [CrossRef]
- Leonska-Duniec, A.; Jastrzebski, Z.; Jazdzewska, A.; Krzysztof, F.; Cieszczyk, P. Leptin and Leptin Receptor Genes Are Associated With Obesity-Related Traits Changes in Response to Aerobic Training Program. J. Strength Cond. Res. 2018, 32, 1036–1044. [Google Scholar] [CrossRef]
- Paolin, B.; Maltese, P.E.; Del Ciondolo, I.; Tavian, D.; Missaglia, S.; Ciuoli, C.; Zuntini, M.; Cecchin, S.; Bertelli, M.; Pompucci, G. Prevalence of mutations in LEP, LEPR, and MC4R genes in individuals with severe obesity. Genet. Mol. Res. 2016, 15, gmr.15038718. [Google Scholar] [CrossRef] [PubMed]
- Loos, R.J.F.; Yeo, G.S.H. The Bigger Picture of FTO: The First GWAS-Identified Obesity Gene. Nat. Rev. Endocrinol. 2014, 10, 51–61. [Google Scholar] [CrossRef] [PubMed]
- Fairbrother, U.; Kidd, E.; Malagamuwa, T.; Walley, A. Genetics of Severe Obesity. Curr. Diab. Rep. 2018, 18, 85. [Google Scholar] [CrossRef] [PubMed]
- Hertzel, A.V.; Bernlohr, D.A. The Mammalian Fatty Acid-Binding Protein Multigene Family: Molecular and Genetic Insights into Function. Trends Endocrinol. Metab. 2000, 11, 175–180. [Google Scholar] [CrossRef] [PubMed]
- Evans, D.S.; Calton, M.A.; Kim, M.J.; Kwok, P.-Y.; Miljkovic, I.; Harris, T.; Koster, A.; Liu, Y.; Tranah, G.J.; Ahituv, N.; et al. Genetic Association Study of Adiposity and Melanocortin-4 Receptor (MC4R) Common Variants: Replication and Functional Characterization of Non-Coding Regions. PLoS ONE 2014, 9, e96805. [Google Scholar] [CrossRef] [PubMed]
- Leonska-Duniec, A.; Jastrzebski, Z.; Zarebska, A.; Smółka, W.; Cieszczyk, P. Impact of the Polymorphism Near MC4R (Rs17782313) on Obesity-and Metabolic-Related Traits inWomen Participating in an Aerobic Training Program. J. Hum. Kinet. 2017, 58, 111–119. [Google Scholar] [CrossRef]
- Pražnikar, Z.J.; Mohorko, N.; Gmajner, D.; Kenig, S.; Petelin, A. Effects of Four Different Dietary Fibre Supplements on Weight Loss and Lipid and Glucose Serum Profiles during Energy Restriction in Patients with Traits of Metabolic Syndrome: A Comparative, Randomized, Placebo-Controlled Study. Foods 2023, 12, 2122. [Google Scholar] [CrossRef]
- Maculewicz, E.; Leońska-Duniec, A.; Mastalerz, A.; Szarska, E.; Garbacz, A.; Lepionka, T.; Łakomy, R.; Anyżewska, A.; Bertrandt, J. The Influence of FTO, FABP2, LEP, LEPR, and MC4R Genes on Obesity Parameters in Physically Active Caucasian Men. Int. J. Environ. Res. Public. Health. 2022, 19, 6030. [Google Scholar] [CrossRef]
- Sood, N.; Baker, W.; Coleman, C. Effect of glucomannan on plasma lipid and glucose concentrations, body weight, and blood pressure: Systematic review and meta-analysis. Am. J. Clin. Nutr. 2008, 88, 1167–1175. [Google Scholar] [CrossRef]
- Salazar, N.; Dewulf, E.; Neyrinck, A.; Bindels, L.; Cani, P.; Mahillon, J.; de Vos, W.; Thissen, J.; Gueimonde, M.; de Los Reyes-Gavilán, C.; et al. Inulin-type fructans modulate intestinal Bifidobacterium species populations and decrease fecal short-chain fatty acids in obese women. Clin. Nutr. 2015, 34, 501–507. [Google Scholar] [CrossRef]
- Anderson, J.; Allgood, L.; Lawrence, A.; Altringer, L.; Jerdack, G.; Hengehold, D.; Morel, J. Cholesterol-lowering effects of psyllium intake adjunctive to diet therapy in men and women with hypercholesterolemia: Meta-analysis of 8 controlled trials. Am. J. Clin. Nutr. 2000, 71, 472–479. [Google Scholar] [CrossRef]
- Martins, M.C.; Trujillo, J.; Freitas-Vilela, A.A.; Farias, D.R.; Rosado, E.L.; Struchiner, C.J.; Kac, G. Associations between obesity candidate gene polymorphisms (fat mass and obesity-associated (FTO), melanocortin-4 receptor (MC4R), leptin (LEP) and leptin receptor (LEPR)) and dietary intake in pregnant women. Br. J. Nutr. 2018, 120, 454–463. [Google Scholar] [CrossRef]
- Hosseini-Esfahani, F.; Koochakpoor, G.; Daneshpour, M.S.; Mirmiran, P.; Sedaghati-Khayat, B.; Azizi, F. The interaction of fat mass and obesity associated gene polymorphisms and dietary fiber intake in relation to obesity phenotypes. Sci. Rep. 2017, 7, 18057. [Google Scholar] [CrossRef]
- Warrilow, A.; Mellor, D.; McKune, A.; Pumpa, K. Dietary fat, fibre, satiation, and satiety-a systematic review of acute studies. Eur. J. Clin. Nutr. 2019, 73, 333–344. [Google Scholar] [CrossRef]
- Vella, A.; Camilleri, M. The Gastrointestinal Tract as an Integrator of Mechanical and Hormonal Response to Nutrient Ingestion. Diabetes 2017, 66, 2729–2737. [Google Scholar] [CrossRef] [PubMed]
- Razquin, C.; Martinez, J.A.; Martinez-Gonzalez, M.A.; Bes-Rastrollo, M.; Fernández-Crehuet, J.; Marti, A. A 3-year intervention with a Mediterranean diet modified the association between the rs9939609 gene variant in FTO and body weight changes. Int. J. Obes. 2010, 34, 266–272. [Google Scholar] [CrossRef] [PubMed]
- Ortega-Azorín, C.; Sorlí, J.V.; Asensio, E.M.; Coltell, O.; Martínez-González, M.Á.; Salas-Salvadó, J.; Covas, M.I.; Arós, F.; Lapetra, J.; Serra-Majem, L.; et al. Associations of the FTO rs9939609 and the MC4R rs17782313 polymorphisms with type 2 diabetes are modulated by diet, being higher when adherence to the Mediterranean diet pattern is low. Cardiovasc. Diabetol. 2012, 11, 137. [Google Scholar] [CrossRef] [PubMed]
- Di Renzo, L.; Cioccoloni, G.; Falco, S.; Abenavoli, L.; Moia, A.; Salimei, P.S.; De Lorenzo, A. Influence of FTO rs9939609 and Mediterranean diet on body composition and weight loss: A randomized clinical trial. J. Transl. Med. 2018, 16, 308. [Google Scholar] [CrossRef]
- Grundy, M.M.-L.; Edwards, C.H.; Mackie, A.R.; Gidley, M.J.; Butterworth, P.J.; Ellis, P.R. Re-evaluation of the mechanisms of dietary fibre and implications for macronutrient bioaccessibility, digestion and post-prandial metabolism. Br. J. Nutr. 2016, 116, 816–833. [Google Scholar] [CrossRef]
- Lovegrove, A.; Edwards, C.H.; De Noni, I.; Patel, H.; El, S.N.; Grassby, T.; Zielke, C.; Ulmius, M.; Nilsson, L.; Butterworth, P.J.; et al. Role of polysaccharides in food, digestion, and health. Crit. Rev. Food Sci. Nutr. 2017, 57, 237–253. [Google Scholar] [CrossRef]


| Glucomannan, Inulin, Psyllium (n = 75) | Placebo (n = 37) | p-Value | Homozygous Minor Allele Carriers (n = 33) | Mixed Allele Carriers (n = 42) | p-Value | |
|---|---|---|---|---|---|---|
| Age, y | 46 ± 10 | 46 ± 12 | p = 0.81 | 45 ± 9 | 46 ± 11 | p = 0.78 |
| Women, % | 71.8 | 72.0 | p = 0.89 | 72.7 | 71.4 | p = 0.82 |
| Body weight, kg | 89.3 ± 10.4 | 90.6 ± 10.8 | p = 0.73 | 91.4 ± 11.1 | 87.8 ± 9.6 | p = 0.13 |
| Body mass index, kg/m2 | 30.7 ± 3.4 | 31.3 ± 3.5 | p = 0.67 | 31.1 ± 3.8 | 30.5 ± 2.9 | p = 0.11 |
| Fat mass, % | 37.5 ± 4.6 | 38.1 ± 4.2 | p = 0.46 | 37.8 ± 3.8 | 37.1 ± 5.1 | p = 0.58 |
| Fat-free mass, kg | 57.5 ± 10.7 | 57.1 ± 11.8 | p = 0.72 | 56.1 ± 11.2 | 58.3 ± 10.1 | p = 0.32 |
| Visceral fat rating | 9.7 ± 3.5 | 9.5 ± 3.6 | p = 0.68 | 9.8 ± 3.5 | 9.6 ± 3.4 | p = 0.75 |
| Systolic blood pressure, mm Hg | 128 ± 9 | 129 ± 9 | p = 0.88 | 129 ± 8 | 128 ± 11 | p = 0.61 |
| Diastolic blood pressure, mm Hg | 81 ± 7 | 82 ± 4 | p = 0.71 | 82 ± 6 | 81 ± 6 | p = 0.74 |
| Total cholesterol, mmol/L | 5.12 ± 0.73 | 5.1 ± 0.7 | p = 0.90 | 5.32 ± 0.62 | 4.98 ± 0.78 | p = 0.14 |
| LDL-C, mmol/L | 3.95 ± 0.71 | 4.18 ± 0.59 | p = 0.86 | 4.14 ± 0.48 | 3.82 ± 0.91 | p = 0.13 |
| HDL-C, mmol/L | 1.54 ± 0.46 | 1.59 ± 0.52 | p = 0.76 | 1.44 ± 0.43 | 1.61 ± 0.48 | p = 0.23 |
| Triglycerides, mmol/L | 1.28 ± 0.57 | 1.37 ± 0.64 | p = 0.78 | 1.38 ± 0.51 | 1.22 ± 0.63 | p = 0.16 |
| Fasting plasma glucose, mmol/L | 5.55 ± 0.50 | 5.68 ± 0.58 | p = 0.64 | 5.39 ± 0.41 | 5.68 ± 0.59 | p = 0.12 |
| hsCRP, mg/L | 2.00 ± 1.28 | 2.32 ± 1.3 | p = 0.78 | 2.11 ± 1.35 | 1.92 ± 1.21 | p = 0.33 |
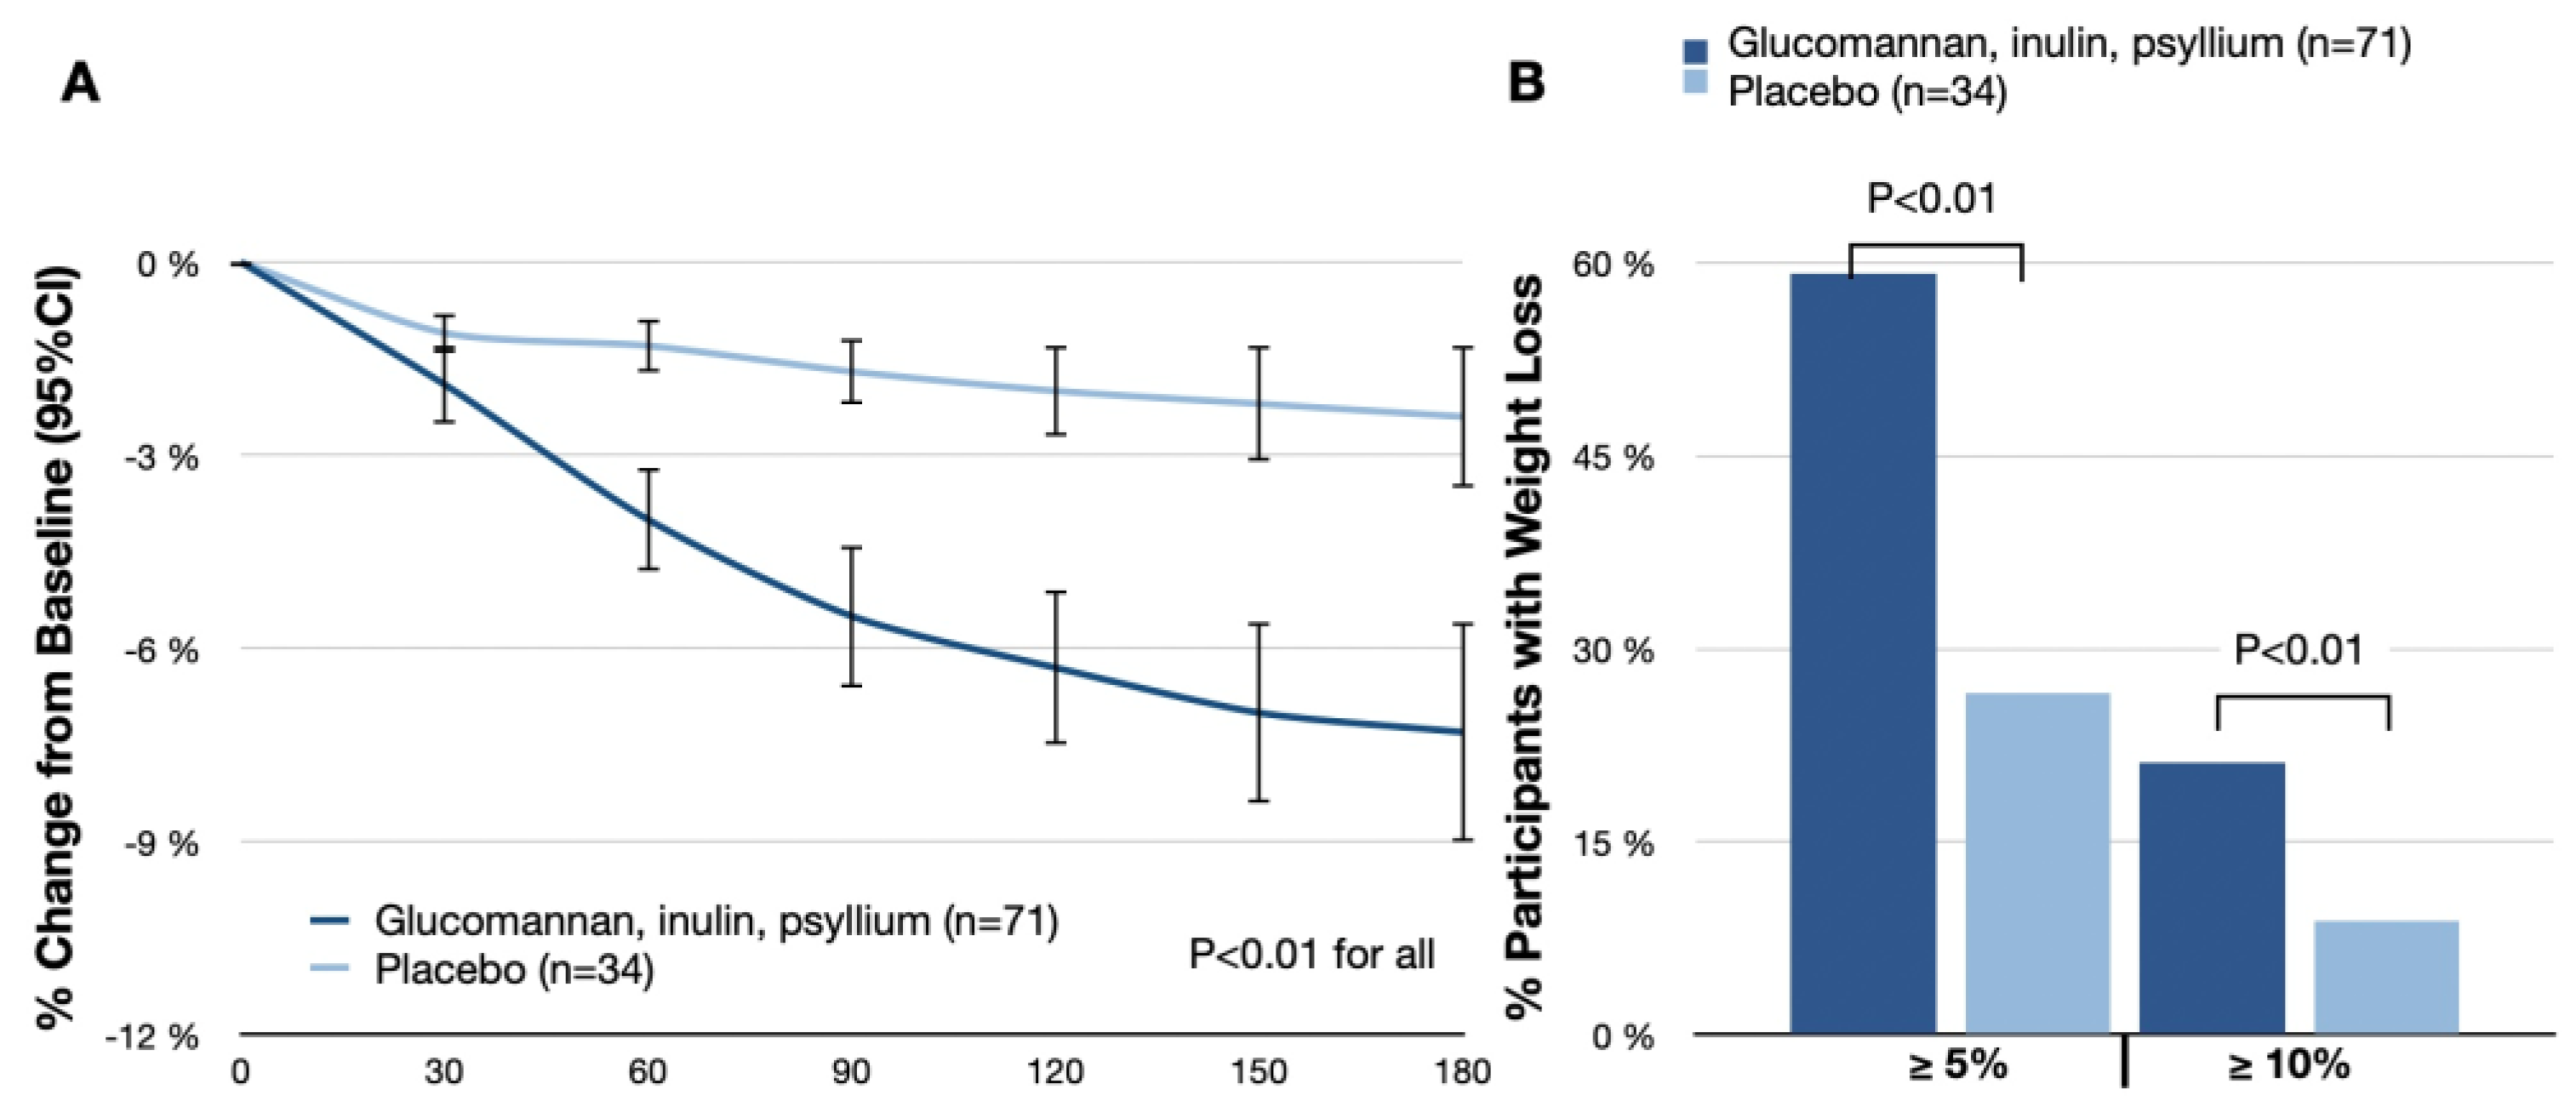
| Glucomannan, Inulin, Psyllium (n = 71) | Placebo (n = 34) | Difference (95% CI) | Odds Ratio | p-Value | |
|---|---|---|---|---|---|
| Body weight change from baseline to day 180, % | −7.3 (−9.0 to −5.6) | −2.4 (−3.5 to −1.3) | −4.9 (−6.9 to −2.9) | p < 0.01 | |
| Participants with body weight reduction ≥ 5% at day 180, % | 59.2 | 26.5 | 4.0 (1.6 to 9.9) | p < 0.01 | |
| Participants with body weight reduction ≥ 10% at day 180, % | 21.1 | 8.8 | 2.8 (1.4 to 5.4) | p < 0.01 | |
| Body weight (change from baseline to day 180), kg | −6.5 (−7.2 to −5.9) | −2.2 (−2.4 to −2.0) | −4.3 (−5.2 to −3.5) | p < 0.01 | |
| Body mass index (change from baseline to day 180), kg/m2 | −2.2 (−2.3 to −2.1) | −0.8 (−0.9 to −0.6) | −1.4 (−1.7 to −1.2) | p < 0.01 | |
| Fat mass, (change from baseline to day 180), % | −19.4 (−21.3 to −17.5) | −6.4 (−6.9 to −5.8) | −13.0 (−14.4 to −11.7) | p < 0.01 | |
| Fat-free mass (change from baseline to day 180), kg | −1.3 (−4.9 to 2.3) | −0.8 (−3.0 to 1.4) | −0.5 (−6.3 to 5.3) | p = 0.11 | |
| Visceral fat rating (change from baseline to day 180) | −1.9 (−2.1 to −1.7) | −0.6 (−1.1 to −0.1) | −1.3 (−1.6 to −1.0) | p < 0.01 | |
| Systolic blood pressure, mm Hg | −4.8 (−10.3 to −1.3) | −9.1 (−13.7 to −4.5) | 4.2 (−1.7 to 10.1) | p = 0.13 | |
| Diastolic blood pressure, mm Hg | −3.9 (−7.5 to −0.4) | −7.3 (−9.7 to −4.9) | 3.1 (−1.2 to 7.4) | p = 0.15 | |
| Total cholesterol (ratio of day-180 value to baseline) | 0.93 (0.75 to 1.11) | 0.92 (0.74 to 1.10) | 1.01 (0.82 to 1.21) | p = 0.46 | |
| LDL-C (ratio of day-180 value to baseline) | 0.92 (0.74 to 1.08) | 0.91 (0.73 to 1.09) | 1.01 (0.81 to 1.21) | p = 0.51 | |
| HDL-C (ratio of day-180 value to baseline) | 0.91 (0.73 to 1.08) | 0.97 (0.78 to 1.16) | 0.94 (0.75 to 1.15) | p = 0.05 | |
| Triglycerides (ratio of day-180 value to baseline) | 0.93 (0.77 to 1.13) | 0.82 (0.66 to 0.98) | 1.13 (0.93 to 1.38) | p = 0.10 | |
| hsCRP (ratio of day-180 value to baseline) | 0.91 (0.75 to 1.07) | 1.16 (0.99 to 1.33) | 1.03 (0.85 to 1.21) | p = 0.08 | |
| Fasting plasma glucose, mmol/L | −0.38 (−1.56 to 0.80) | −0.48 (−0.94 to −0.02) | 0.10 (−1.15 to 1.35) | p = 0.26 |
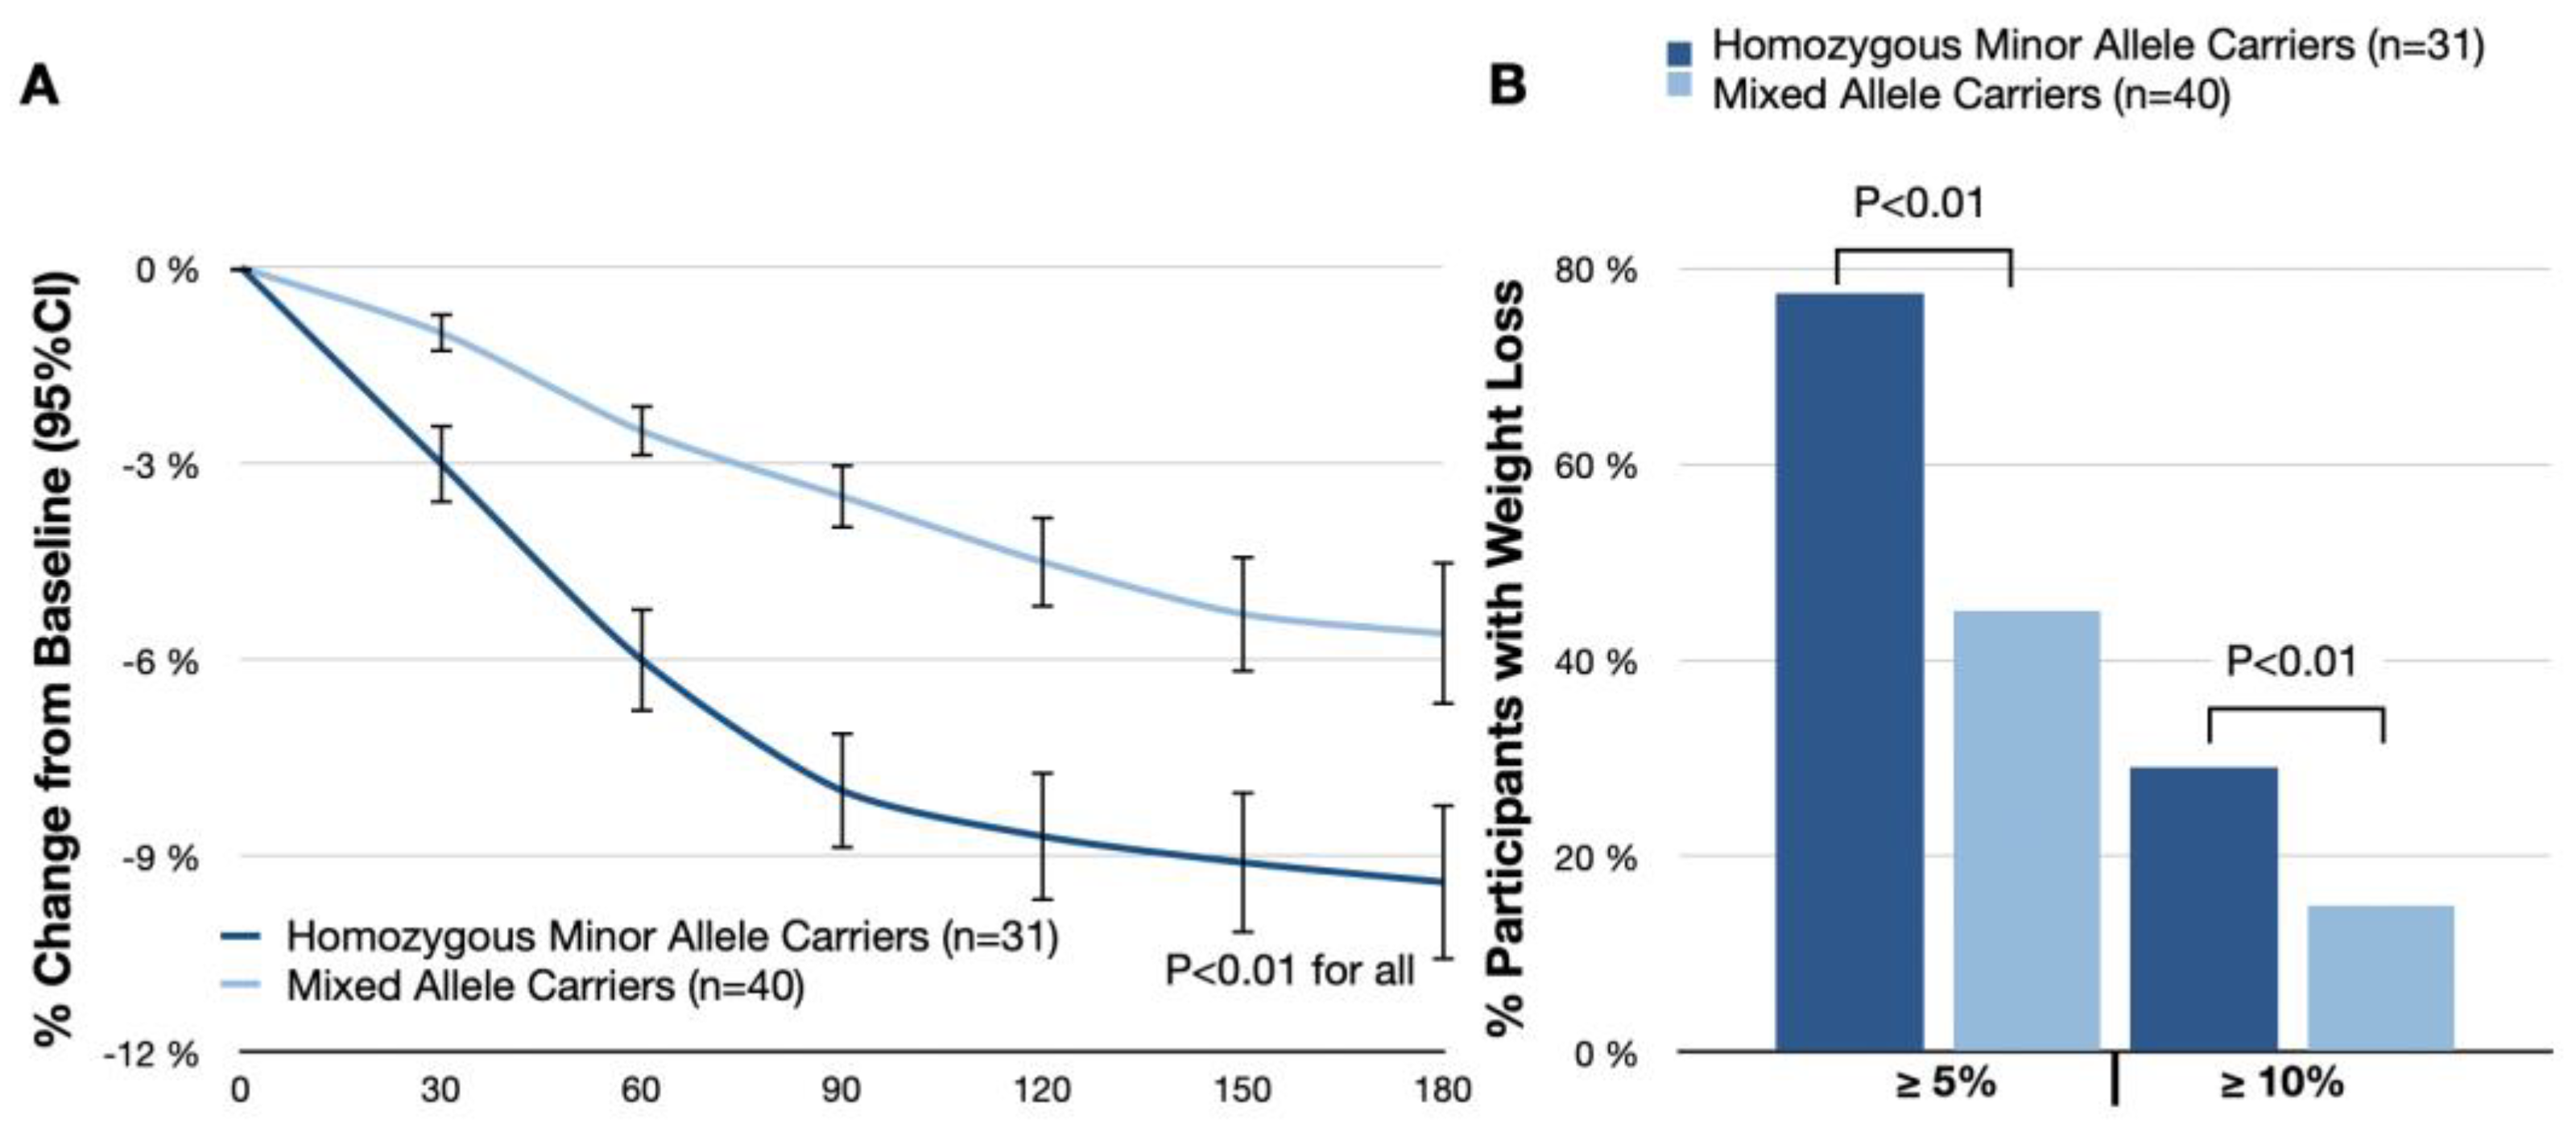
| Homozygous Minor Allele Carriers (n = 31) | Mixed Allele Carriers (n = 40) | Difference between Homozygous and Mixed Allele (95% CI) | Odds Ratio | p-Value | |
|---|---|---|---|---|---|
| Body weight change from baseline to day 180, % | −9.4 (−10.6 to −8.2) | −5.6 (−6.7 to −4.4) | −3.2 (−4.9 to −1.6) | p < 0.01 | |
| Participants with body weight reduction ≥ 5% at day 180, % | 77.4 | 45.0 | 4.1 (2.7 to 6.0) | p < 0.01 | |
| Participants with body weight reduction ≥ 10% at day 180, % | 29.0 | 15.0 | 2.3 (1.5 to 3.4) | p < 0.01 | |
| Body weight (change from baseline to day 180), kg | −8.6 (−9.4 to −7.8) | −4.9 (−5.4 to −4.4) | −3.7 (−5.0 to −2.4) | p < 0.01 | |
| Body mass index (change from baseline to day 180), kg/m2 | −2.9 (−3.4 to −2.4) | −1.7 (−2.0 to −1.4) | −1.2 (−2.0 to −0.4) | p < 0.01 | |
| Fat mass, (change from baseline to day 180), % | −24.9 (−27.2 to −22.6) | −15.1 (−16.6 to −13.5) | −9.8% (−10.6% to −9.1%) | p < 0.01 | |
| Fat-free mass (change from baseline to day 180), kg | −1.7 (−5.7 to 2.3) | −1.0 (−4.3 to 2.3) | −0.7 (−8.0 to 6.6) | p = 0.09 | |
| Visceral fat rating (change from baseline to day 180) | −2.4 (−2.6 to −2.2) | −1.5 (−1.7 to −1.3) | −0.9 (−1.3 to −0.5) | p < 0.01 | |
| Systolic blood pressure (change from baseline to day 180), mm Hg | −7.1 (−10.4 to −3.8) | −2.9 (−6.4 to 0.6) | −4.2 (−8.0 to −0.4) | p = 0.07 | |
| Diastolic blood pressure (change from baseline to day 180), mm Hg | −5.1 (−7.6 to −2.6) | −3.2 (−5.4 to −1.0) | −1.9 (−5.2 to 1.4) | p = 0.28 | |
| Total cholesterol (ratio of day-180 value to baseline) | 0.94 (0.76 to 1.12) | 0.91 (0.73 to 1.09) | 1.0 (0.79 to 1.21) | p = 0.32 | |
| LDL-C (ratio of day-180 value to baseline) | 0.93 (0.75 to 1.11) | 0.90 (0.74 to 1.06) | 1.02 (0.81 to 1.23) | p = 0.25 | |
| HDL-C (ratio of day-180 value to baseline) | 0.92 (0.74 to 1.10) | 0.89 (0.72 to 1.06) | 0.03 (0.01 to 0.05) | p = 0.60 | |
| Triglycerides (ratio of day-180 value to baseline) | 0.85 (0.69 to 1.01) | 1.04 (0.84 to 1.24) | −0.19 (−0.40 to 0.02) | p = 0.10 | |
| hsCRP (ratio of day-180 value to baseline) | 0.79 (0.64 to 0.94) | 1.04 (0.84 to 1.24) | −0.25 (−0.45 to −0.05) | p = 0.06 | |
| Fasting plasma glucose (change from baseline to day 180), mmol/L | −0.49 (−0.95 to −0.03) | −0.27 (−1.35 to 0.81) | −0.22 (−1.40 to 0.96) | p = 0.12 |
| Glucomannan, Inulin, Psyllium (n = 71) | Placebo (n = 34) | Difference (95% CI) | p-Value | |
|---|---|---|---|---|
| Hunger | −12.3 (−15.2 to −9.4) | −3.1 (−5.0 to −1.2) | −9.2 (−11.4 to −7.0) | p < 0.01 |
| Fullness | 10.4 (7.5 to 13.3) | 2.1 (0 to 4.2) | 8.3 (6.1 to 10.5) | p < 0.01 |
| Satiety | 11.6 (8.4 to 14.8) | 4.2 (2.1 to 6.3) | 7.4 (5.2 to 9.6) | p < 0.01 |
| Prospective | −10.7 (−13.5 to −7.9) | −2.3 (−4.0 to 0) | −8.4 (−10.6 to −6.2) | p < 0.01 |
| Overall appetite suppression score | 25.6 (21.4 to 29.8) | 8.4 (6.1 to 10.7) | 17.2 (15.3 to 19.1) | p < 0.01 |
| Glucomannan, Inulin, Psyllium (n = 71) | Placebo (n = 34) | p-Value | |||
|---|---|---|---|---|---|
| % Mild | % Moderate | % Mild | % Moderate | ||
| Flatulence, % (n) | 28.2% (20) | 9.9% (9) | 5.9% (2) | 0% (0) | <0.01 |
| Abdominal Discomfort, % (n) | 19.7% (14) | 7.0% (5) | 2.9% (1) | 0% (0) | <0.01 |
| Altered Bowel Habits, % (n) | 15.5% (11) | 5.6% (4) | 2.9% (1) | 0% (0) | <0.01 |
Disclaimer/Publisher’s Note: The statements, opinions and data contained in all publications are solely those of the individual author(s) and contributor(s) and not of MDPI and/or the editor(s). MDPI and/or the editor(s) disclaim responsibility for any injury to people or property resulting from any ideas, methods, instructions or products referred to in the content. |
© 2024 by the authors. Licensee MDPI, Basel, Switzerland. This article is an open access article distributed under the terms and conditions of the Creative Commons Attribution (CC BY) license (https://creativecommons.org/licenses/by/4.0/).
Share and Cite
Pokushalov, E.; Ponomarenko, A.; Garcia, C.; Pak, I.; Shrainer, E.; Seryakova, M.; Johnson, M.; Miller, R. The Impact of Glucomannan, Inulin, and Psyllium Supplementation (SolowaysTM) on Weight Loss in Adults with FTO, LEP, LEPR, and MC4R Polymorphisms: A Randomized, Double-Blind, Placebo-Controlled Trial. Nutrients 2024, 16, 557. https://doi.org/10.3390/nu16040557
Pokushalov E, Ponomarenko A, Garcia C, Pak I, Shrainer E, Seryakova M, Johnson M, Miller R. The Impact of Glucomannan, Inulin, and Psyllium Supplementation (SolowaysTM) on Weight Loss in Adults with FTO, LEP, LEPR, and MC4R Polymorphisms: A Randomized, Double-Blind, Placebo-Controlled Trial. Nutrients. 2024; 16(4):557. https://doi.org/10.3390/nu16040557
Chicago/Turabian StylePokushalov, Evgeny, Andrey Ponomarenko, Claire Garcia, Inessa Pak, Evgenya Shrainer, Mariya Seryakova, Michael Johnson, and Richard Miller. 2024. "The Impact of Glucomannan, Inulin, and Psyllium Supplementation (SolowaysTM) on Weight Loss in Adults with FTO, LEP, LEPR, and MC4R Polymorphisms: A Randomized, Double-Blind, Placebo-Controlled Trial" Nutrients 16, no. 4: 557. https://doi.org/10.3390/nu16040557
APA StylePokushalov, E., Ponomarenko, A., Garcia, C., Pak, I., Shrainer, E., Seryakova, M., Johnson, M., & Miller, R. (2024). The Impact of Glucomannan, Inulin, and Psyllium Supplementation (SolowaysTM) on Weight Loss in Adults with FTO, LEP, LEPR, and MC4R Polymorphisms: A Randomized, Double-Blind, Placebo-Controlled Trial. Nutrients, 16(4), 557. https://doi.org/10.3390/nu16040557