Article

Construction and Validation of Cardiovascular Disease Prediction Model for Dietary Macronutrients—Data from the China Health and Nutrition Survey

1
School of Public Health, Southwest Medical University, Luzhou 646000, China
2
School of Public Health, Shanxi Medical University, Taiyuan 030001, China
3
Collaborating Center of the National Institute of Health Data Sciences of China, Southwest Medical University, Luzhou 646000, China
*
Author to whom correspondence should be addressed.
These authors contributed equally to this work.
Nutrients 2024, 16(23), 4180; https://doi.org/10.3390/nu16234180
Submission received: 20 October 2024 / Revised: 27 November 2024 / Accepted: 29 November 2024 / Published: 2 December 2024
(This article belongs to the Section Nutrition Methodology & Assessment)

Abstract

:
Background: There are currently many studies on predictive models for cardiovascular disease (CVD) that do not use dietary macronutrients for prediction. This study aims to provide a non-invasive model incorporating dietary information to predict the risk of CVD in adults. Methods: The data for this study were obtained from the China Health and Nutrition Survey (CHNS) spanning the years 2004 to 2015. The dataset was divided into training and validation sets at ratio of 7:3. Variables were screened by LASSO, and the Cox proportional hazards regression model was used to construct the 10-year risk prediction model of CVD. The model’s performance was assessed using the concordance index (C-index), receiver operating characteristic (ROC) curve, calibration plots, and decision curve analysis (DCA) for discrimination, calibration, and clinical utility. Results: This study included 5,186 individuals, with males accounting for 48.1% and a mean age of 46.39 ± 13.74 years, and females accounting for 51.9% and a mean age of 47.36 ± 13.29 years. The incidence density was 10.84/1000 person years. The model ultimately incorporates 11 non-invasive predictive factors, including dietary-related, demographic indicators, lifestyle behaviors, and disease history. Performance measures for this model were significant (AUC = 0.808 [(95%CI: 0.778–0.837], C-index = 0.797 [0.765–0.829]). After applying the model to internal validation cohorts, the AUC and C-index were 0.799 (0.749–0.838), and 0.788 (0.737–0.838), respectively. The calibration and DCA curves showed that the non-invasive model has relatively high stability, with a good net return. Conclusions: We developed a simple and rapid non-invasive model predictive of CVD for the next 10 years among Chinese adults.

1. Introduction

Cardiovascular disease (CVD) which includes a range of chronic conditions that impair heart and blood vessel function, is the main cause of global death [1], with nearly one-third of all deaths worldwide attributed to CVD [2]. China is a country with a heavy burden of CVD [3]. It has been reported that 330 million people suffer from CVD and two out of every five people die from CVD in China [4]. Identifying CVD’s risk factors to prevent it is critically important [5].
Many scientists have been exploring models for early prediction of CVD. Well-known examples include the Framingham [6] general CVD equations, Pooled Cohort Equations (PCE) [7] in the United States (US), the QRISK in the United Kingdom [8], the Systematic Coronary Risk Evaluation (SCORE) [9] model in Europe and the WHO cardiovascular disease risk prediction chart [10].The Framingham and PCE models require recalibration and updating before they can be effectively implemented in Asian populations [11]. The World Health Organization (WHO) CVD risk prediction chart has been found to underestimate the 10-year CVD risk in most regions of China [12]. Those models are based on Western samples, which limits their applicability to Chinese [11,13,14]. China’s CVD prediction model, known as China-PAR [15], encompasses variables that necessitate laboratory tests, such as comprehensive metabolic panel indicators, making them unsuitable for individuals to conduct real-time self-assessment of cardiovascular risk.
Poor dietary habits account for about 50% of cardiovascular deaths each year [16]. The important guidelines for CVD prevention have always recommended this controllable lifestyle for self-regulation [17,18]. It is necessary to incorporate a reasonable diet into the prevention of CVD [19]. Non-invasive predictive models incorporating dietary information are rarely reported. Therefore, we have utilized data from a 10-year follow-up obtained from the “China Health and Nutrition Survey (CHNS)” database to identify particular indicators to develop and confirm a straightforward, practical, and accurate tool for predicting the risk of CVD.

2. Methods

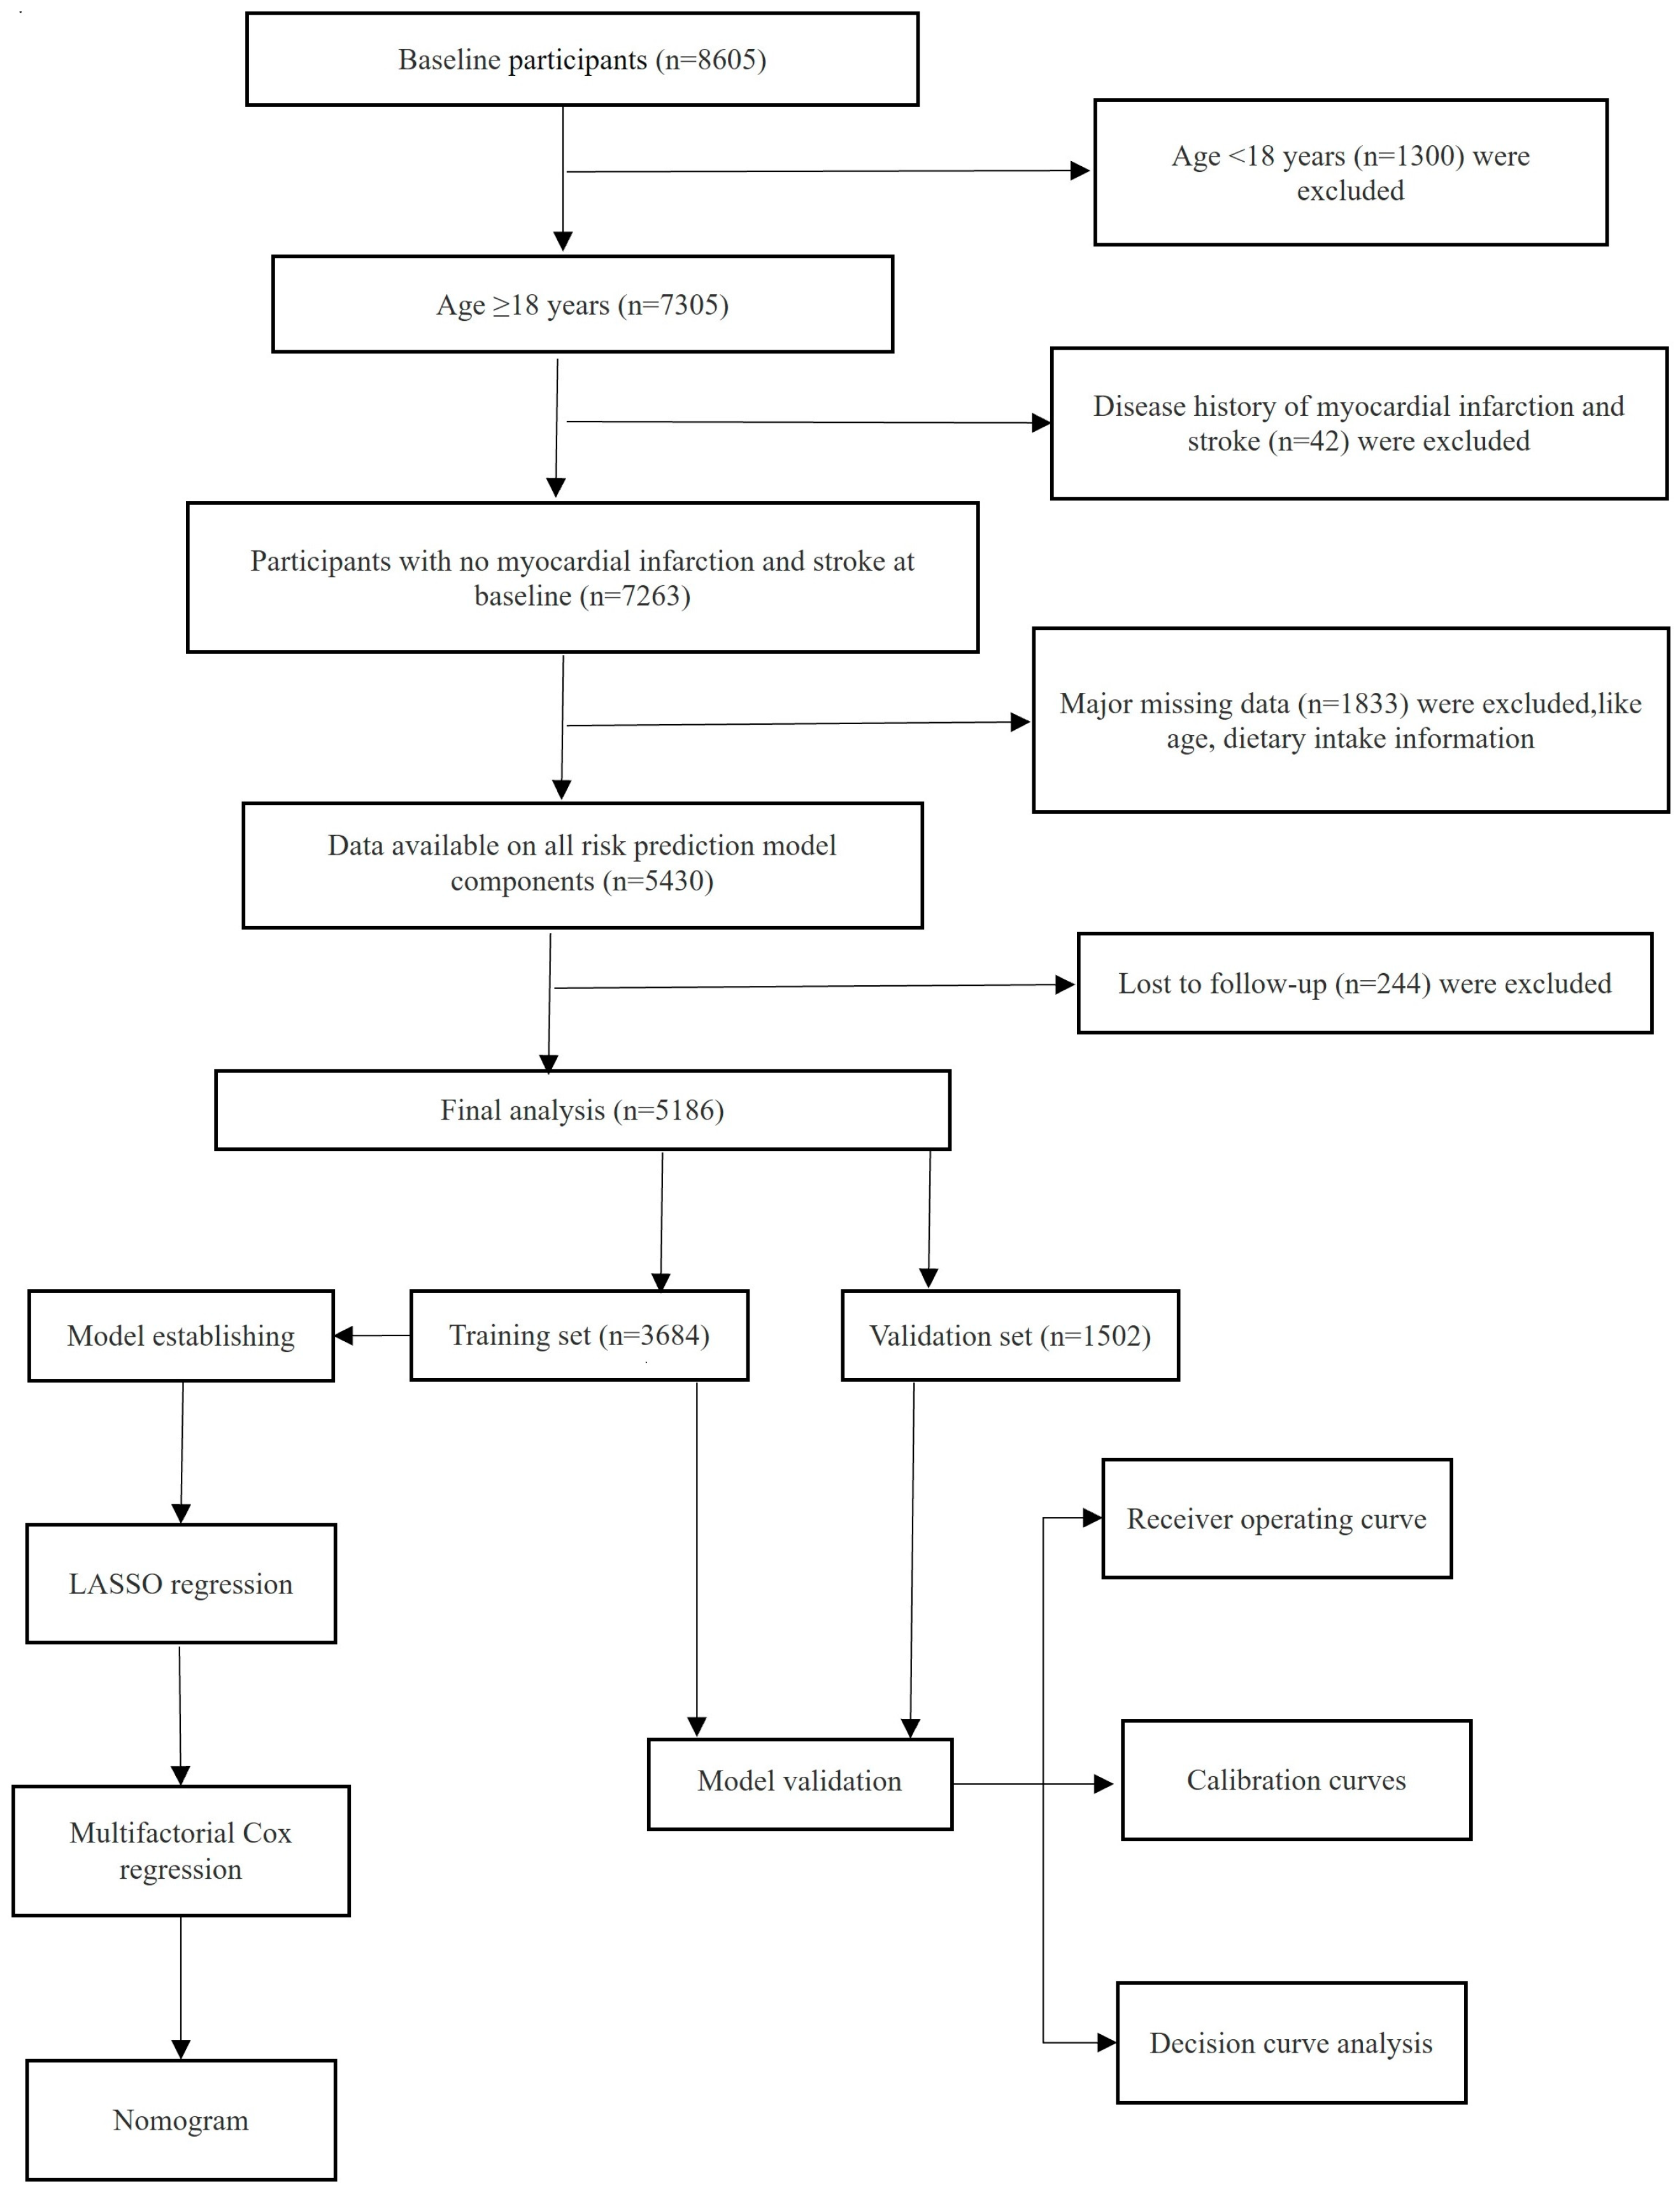
2.1. Study Design and Subject Selection

The research data utilized in this analysis were obtained from CHNS. This survey was designed to investigate the linkages between significant determinants such as socioeconomic status, dietary habits, levels of physical exercise, and overall health at various stages of life. To date, ten comprehensive survey rounds have been conducted, spanning the years 1989 to 2015. The survey covered nine provinces and used a multi-stage, random clustering process to draw a sample of each province. Written consent was obtained from all individuals participating in the CHNS study. The research received clearance from the ethics committees at the University of North Carolina at Chapel Hill and the National Institute of Nutrition and Food Safety, China Center for Disease Control and Prevention. The baseline data for this study were from August 2004 to December 2004, and the follow-up deadline was December 2015. Excluding residents younger than 18 years of age, patients with CVD at baseline, incomplete baseline data, lost to follow-up, and incomplete follow-up information left a total of 5186 individuals being incorporated into the final study group (Figure 1).

2.2. Data Collection

Standardized surveys were utilized to gather data on demographics, lifestyle information, and medical history. A person is considered a current smoker if they have smoked at least one cigarette daily for a year or longer. Alcohol consumption is defined as the average consumption of at least 50 g of alcohol per day for 1 year or more. A family history of atherosclerotic CVD is defined as at least one parent or sibling with myocardial infarction or stroke. Body mass index (BMI) is calculated by dividing a person’s weight in kilograms by their height in meters squared, with measurements taken in light indoor attire and without shoes.

2.3. Diagnostic Criteria

The primary outcomes of our study were myocardial infarction and all types of stroke. Myocardial infarction and stroke are the conclusions of a medical professional who diagnoses the study participants, and investigators record them through face-to-face or telephone interviews, such as asking the study participants, Has the doctor diagnosed you with myocardial infarction? Has the doctor diagnosed you with a stroke?

2.4. Predictive Variable Selection

We selected 17 variables based on a comprehensive literature review and clinical expertise. Structured questionnaires were used to collect information on sociodemographic factors and lifestyles, including age, sex (male, female), urbanization (urban, rural), marriage (unmarried, married, divorced and widowed), education (less than high school, high school or above), smoker (no, yes), alcohol (no, yes), hypertension (no, yes), antihypertensive therapy (no, yes), diabetes mellitus (no, yes), family history of CVD (no, yes) and BMI (lean and normal, overweight, obesity). BMI data were divided into three different groups: lean and normal weight group (<24 kg/m2), overweight group (24–28 kg/m2), and obese group (≥28 kg/m2). We assessed participants’ dietary intake through three consecutive 24-h dietary recalls and utilized the Chinese Food Composition Table (FCT) to convert the data into intake values for macronutrients including average daily kcal intake, average daily carbohydrate intake, average daily fat intake, and average daily protein intake. The geographic area was classified into northern (i.e., Liaoning, Heilongjiang, Shandong, and Henan) and southern regions (i.e., Hubei, Hunan, Guangxi, Guizhou, Jiangsu) based on the geographical demarcation of the Qinling-Huaihe line in China.

2.5. Statistical Analysis

A 7:3 ratio was applied to randomly assign participants to the training and validation sets. Missing information was filled by multiple interpolations, and the number of interpolations was 5. R software (Version 4.3.1) and SPSS software (Version 25.0) were employed for carrying out the statistical analysis. The two-sided test was used for statistical inference, and the p-value less than 0.05 was statistically considered significant. Continuous data were presented as mean with standard deviation, while categorical data were shown as proportions. Differences in continuous and categorical data were assessed using the Student’s t-test and chi-square test, respectively. The variables in the training set were screened by LASSO regression, and the variables with non-zero coefficients in the LASSO regression model were selected as candidate variables. Then, with the help of Cox proportional hazards regression, the risk prediction model of CVD was constructed, and finally the model with the smallest Akaike information criterion value was selected as the prediction model. Then we created a nomogram, to graphically represent predictions. The reliability of the risk prediction tool was gauged through multiple indicators, encompassing the ROC, C-Index, calibration charts, and DCA analysis. The AUC of an ROC curve ranges from 0.5 to 1, with a value near 1 signifying a model’s strong predictive performance. The C-index, representing the concordance rate between predicted and actual outcomes across all sample pairs, is a measure of a model’s discrimination capability, an index above 0.7 suggests high discriminative ability. A calibration plot, which scatter-plots actual versus predicted incidences, shows model accuracy when the plotted points align closely with the diagonal line of the coordinate system. DCA curves that surpass the boundaries of the highest and lowest values suggest that the model possesses good potential for practical use in clinical settings.

3. Results

3.1. General Characteristics of Training and Validation Sets

This study enrolled 5186 adults, having a mean age of 46.89 ± 13.51 years, with 2496 (48.1%) being male and 2690 (51.9%) being female. The average follow-up was 9.81 ± 2.23 years, and there were 276 new cases of CVD, with an incidence density of 10.84/1000 person-years. The entire group of participants in the study were segregated into two subsets: one for training, comprising 3684 individuals, and another for internal validation, with 1502 individuals. Training and validation sets did not exhibit a statistically significant difference except for geographical area (as shown in Table 1).

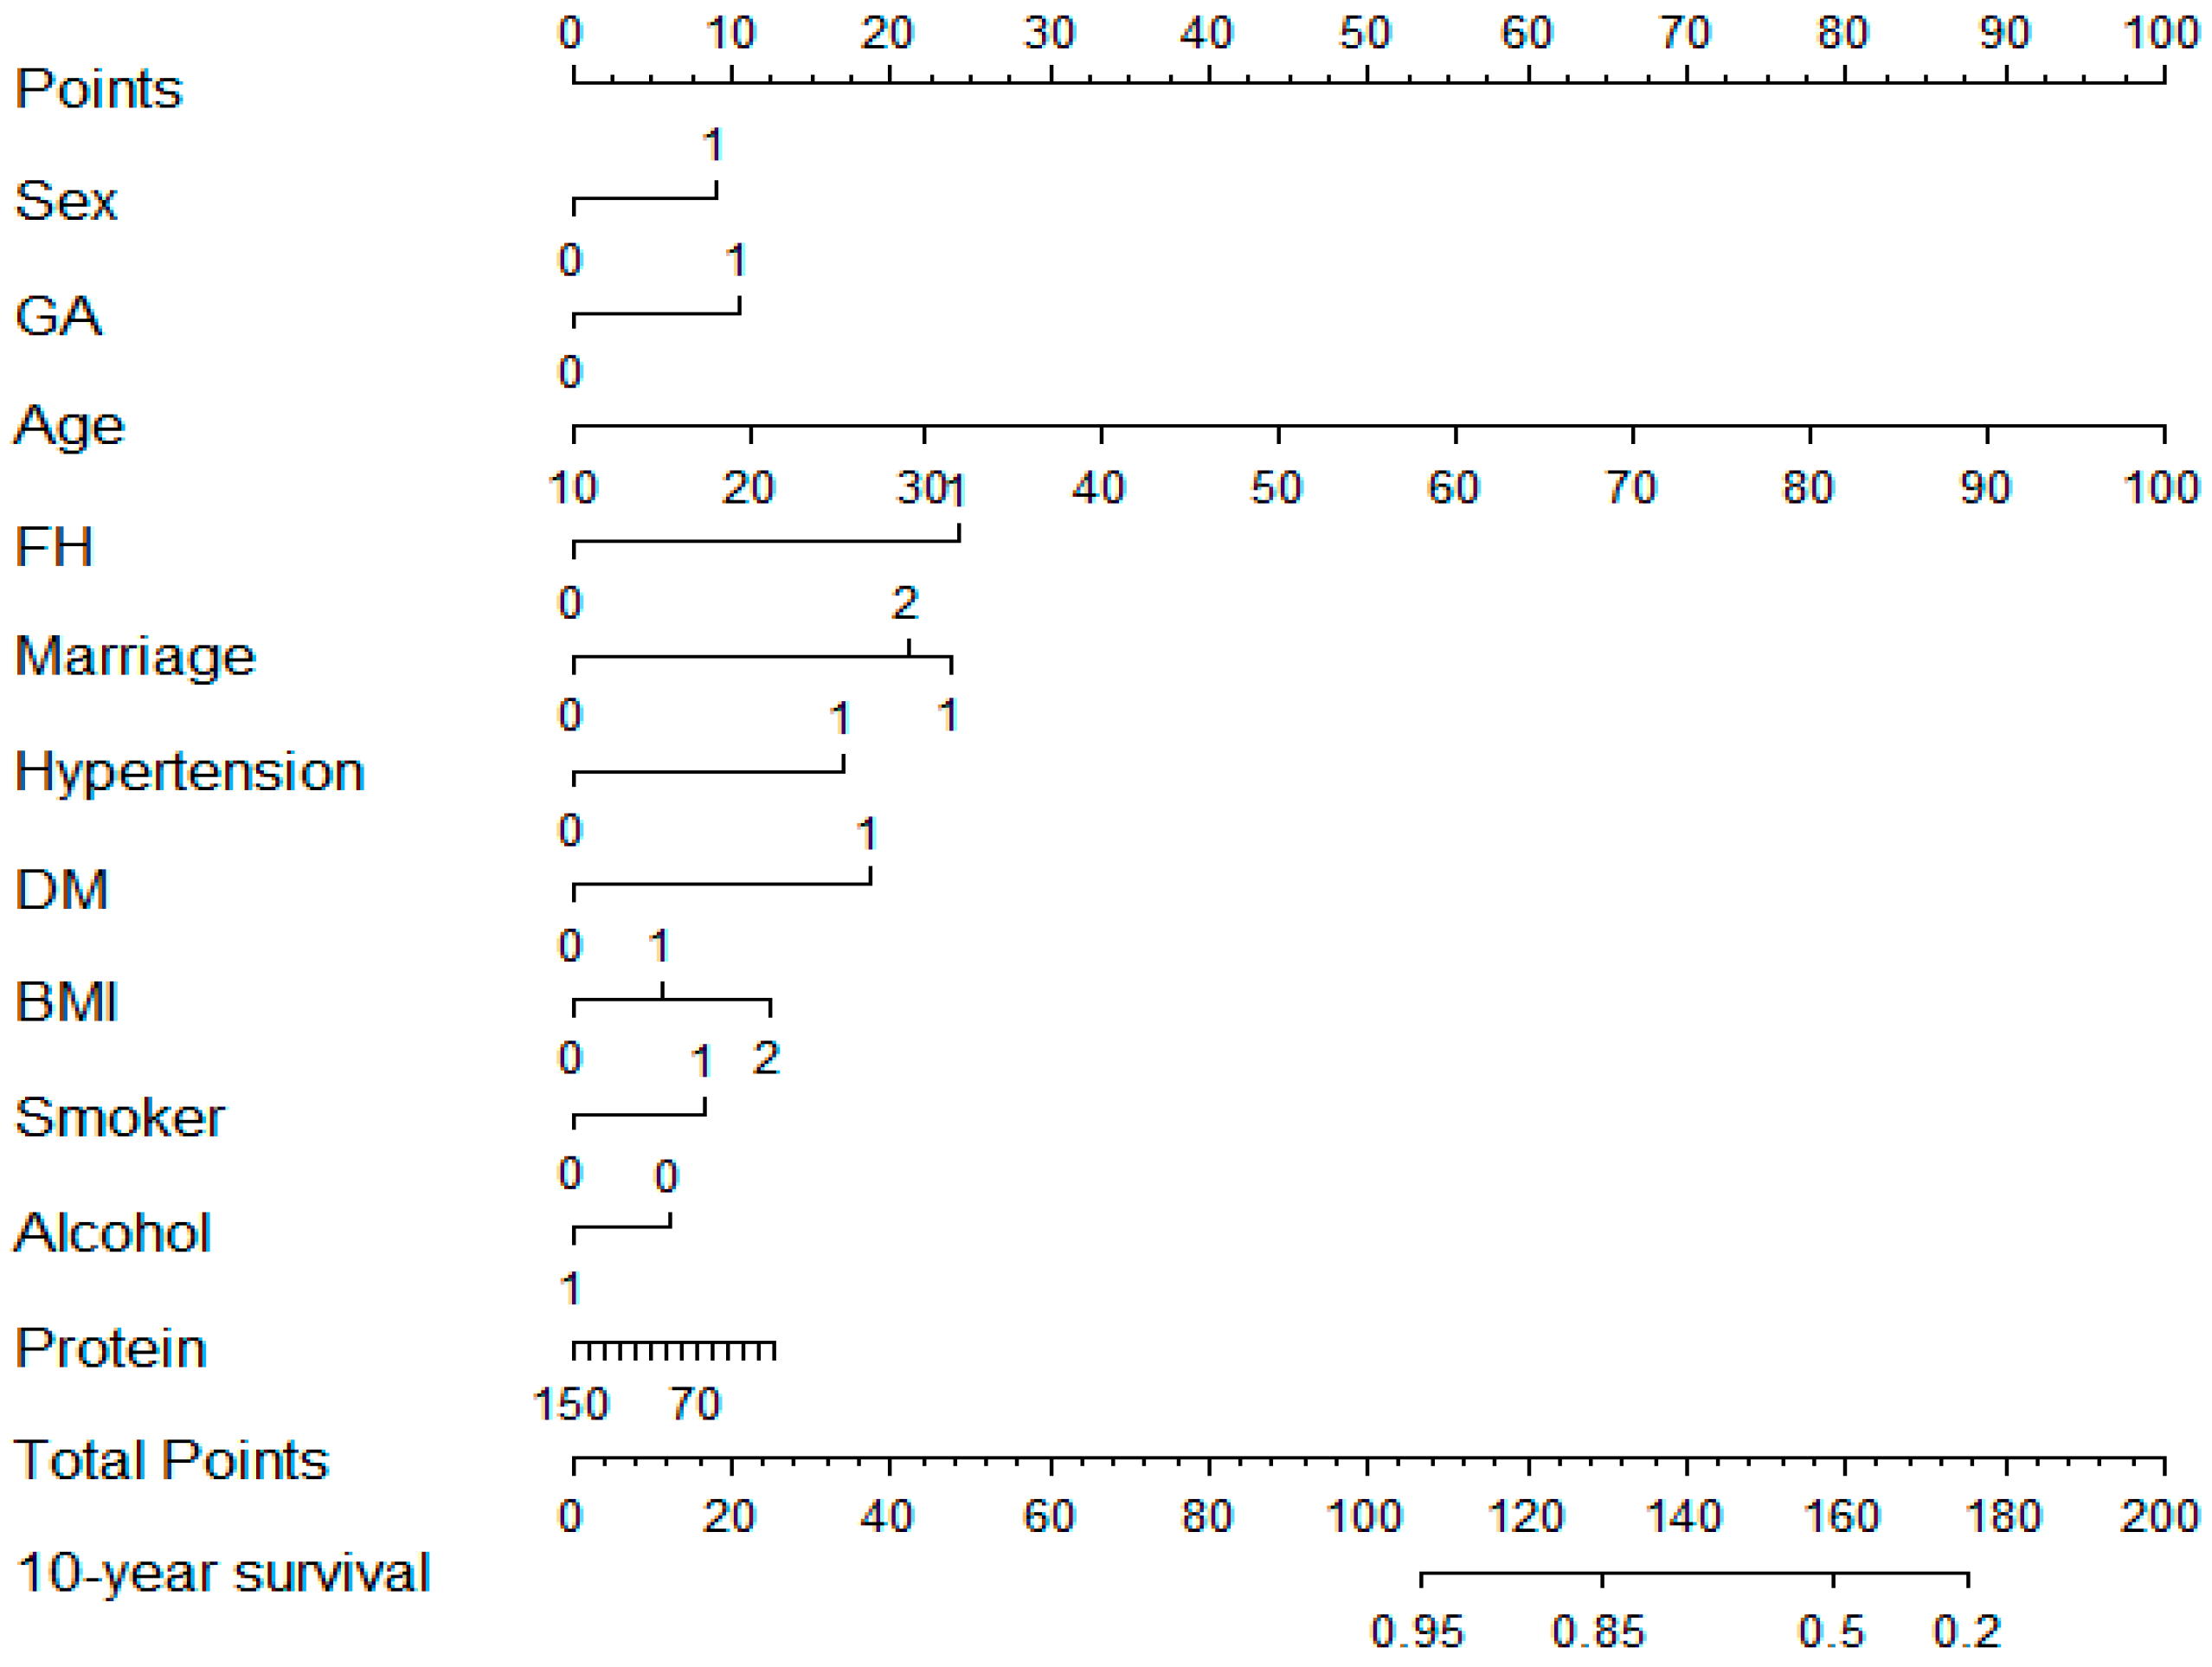
3.2. Construction of Prediction Models

LASSO regression was used to identify key variables from 17 factors in the training set. As λ increased, the coefficients of less influential variables on CVD morbidity risk approached zero sooner, and there was a progressive reduction in the count of variables (Figure 2A). All predictors were screened out when the minimum MSE was increased (λ = 0.0007). A total of 14 variables were screened out, which were average daily carbohydrate intake, average daily protein intake, age, sex, urbanization, family history of CVD, marriage, hypertension, antihypertensive therapy, diabetes, BMI, geographic area, smoke and drink. Fourteen variables were included and subjected to the multivariate Cox proportional hazards regression analysis (Table 2). The variables retained after further screening by the stepwise regression method were age, sex, urbanization, family history of CVD, marriage, geographic area, BMI, diabetes, smoke, drink, and average daily protein intake. Finally, these 11 variables were included in the nomogram (Figure 3). For example, in our nomogram, for a 60-year-old man from Sichuan, married, no family history of CVD, high blood pressure, no diabetes, smoking, and drinking, BMI is overweight, average daily protein intake is 70 g, the total score is 132, and the 10-year CVD survival rate is about 85%.

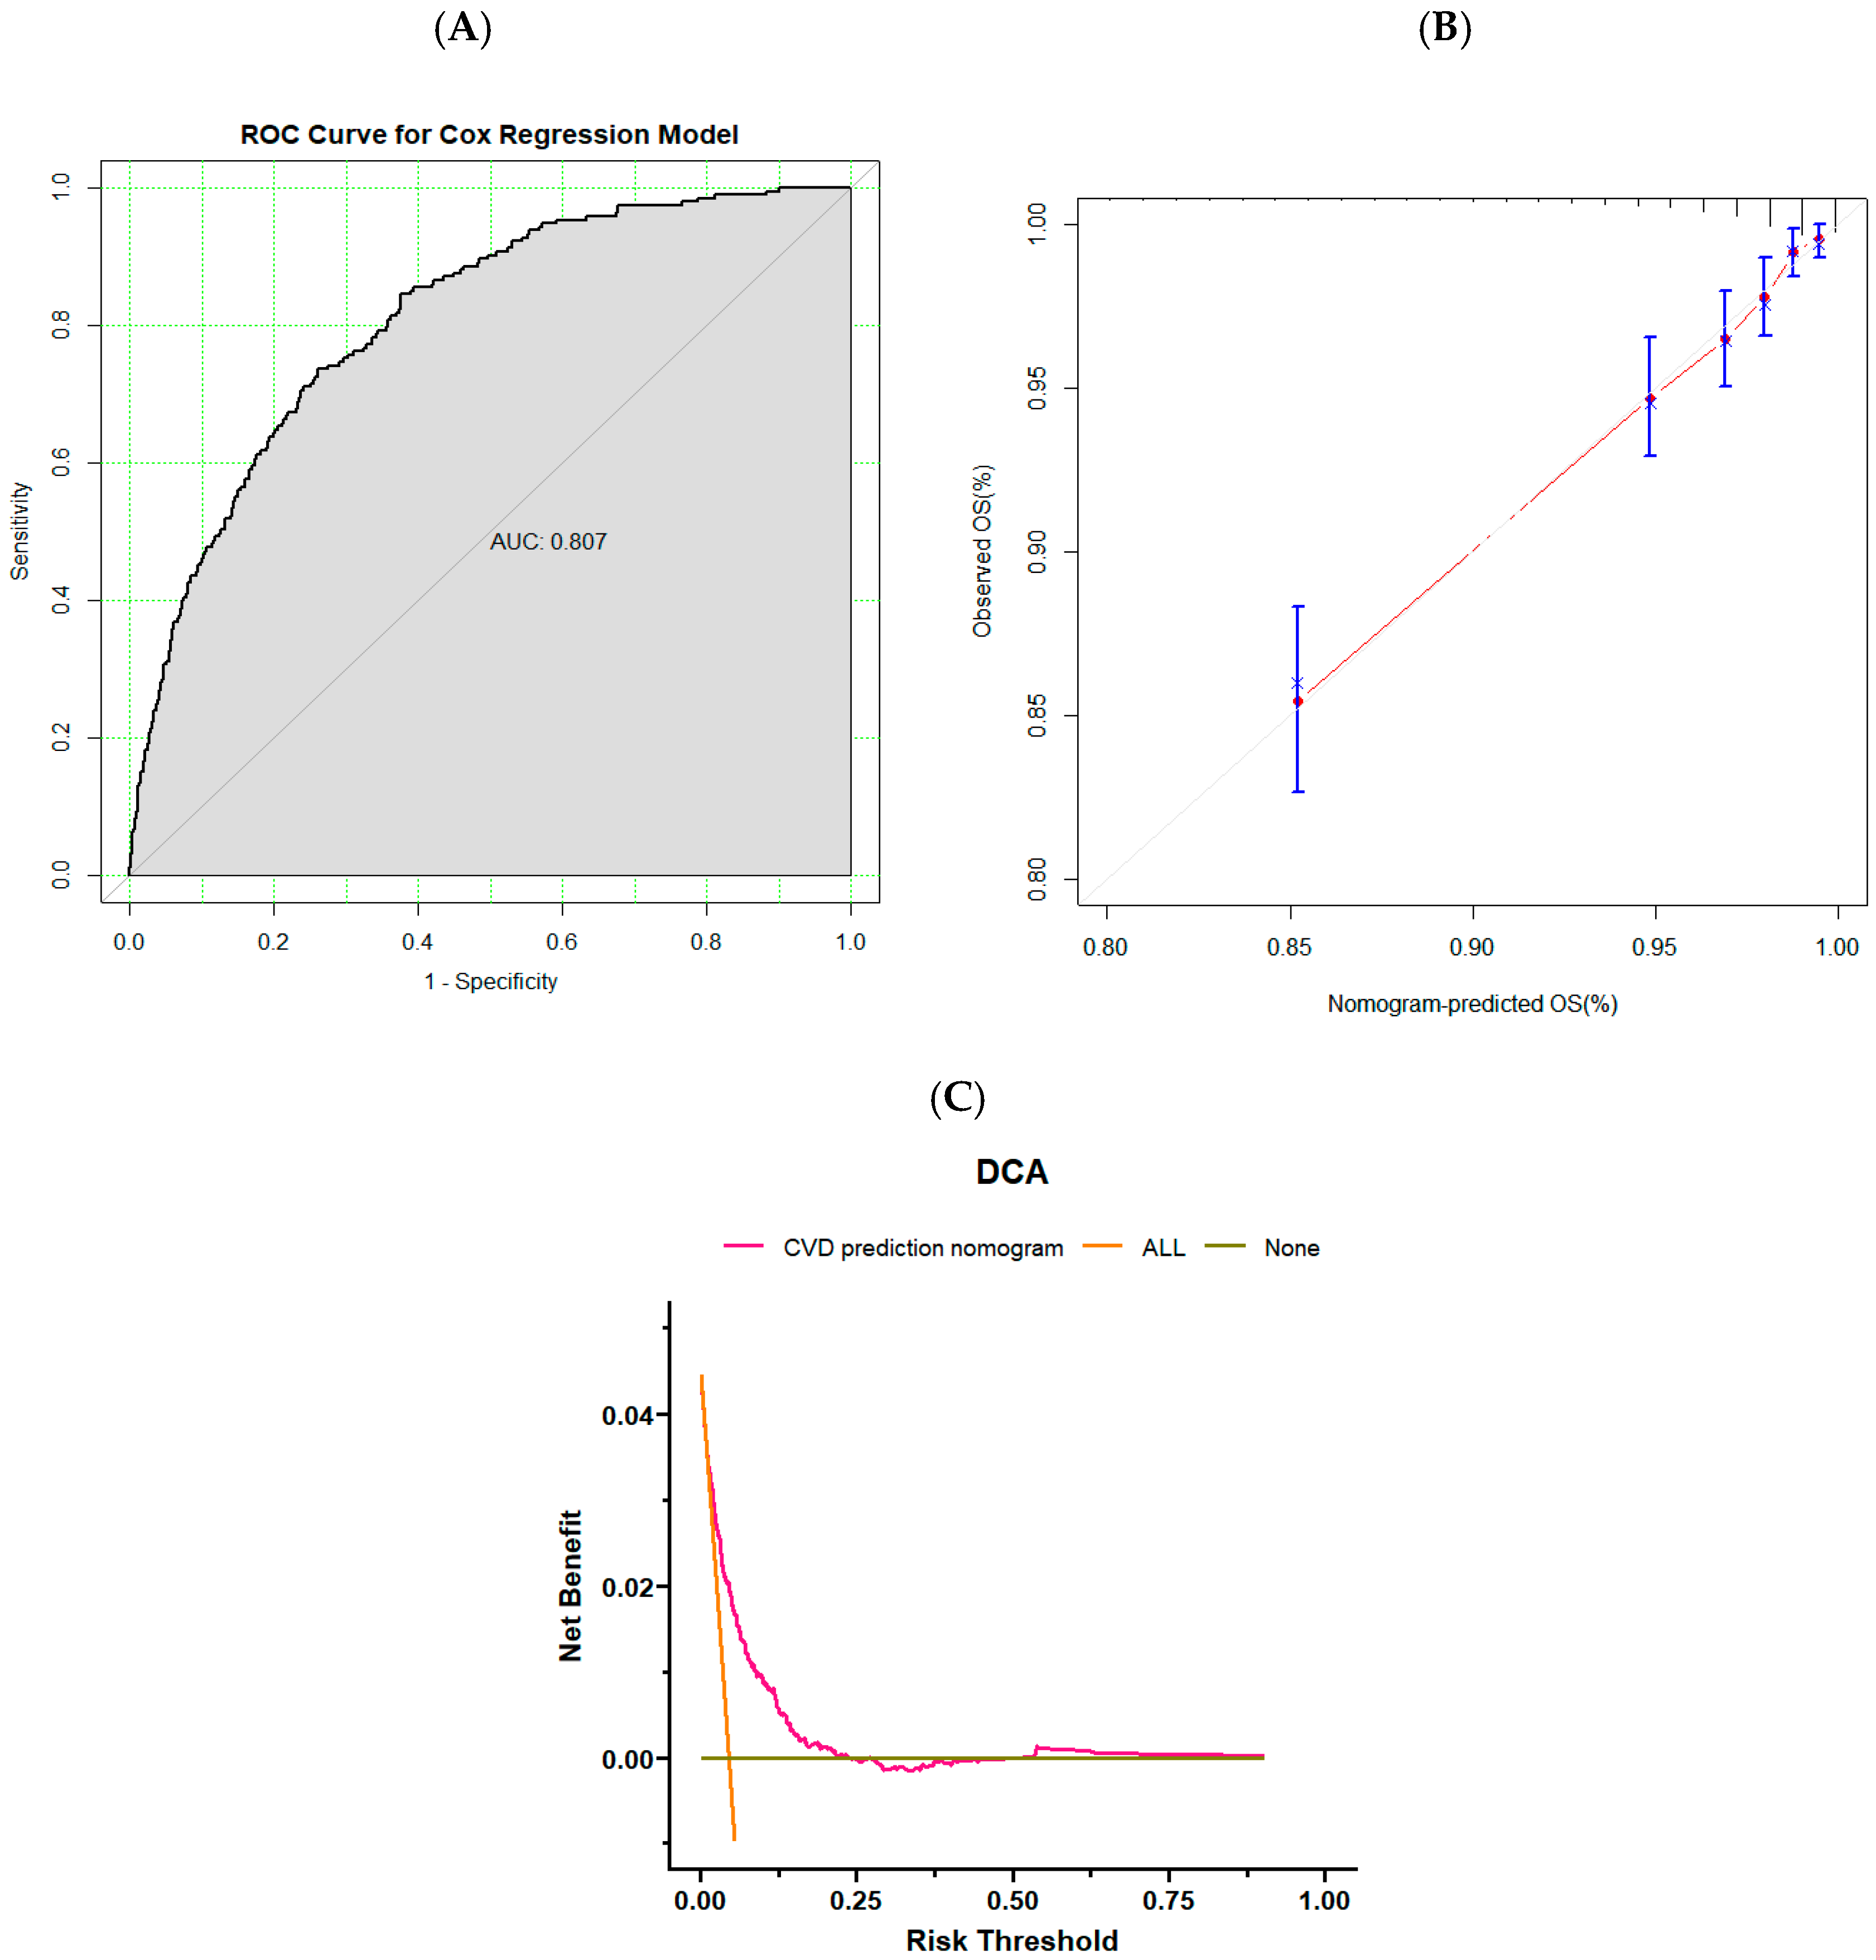
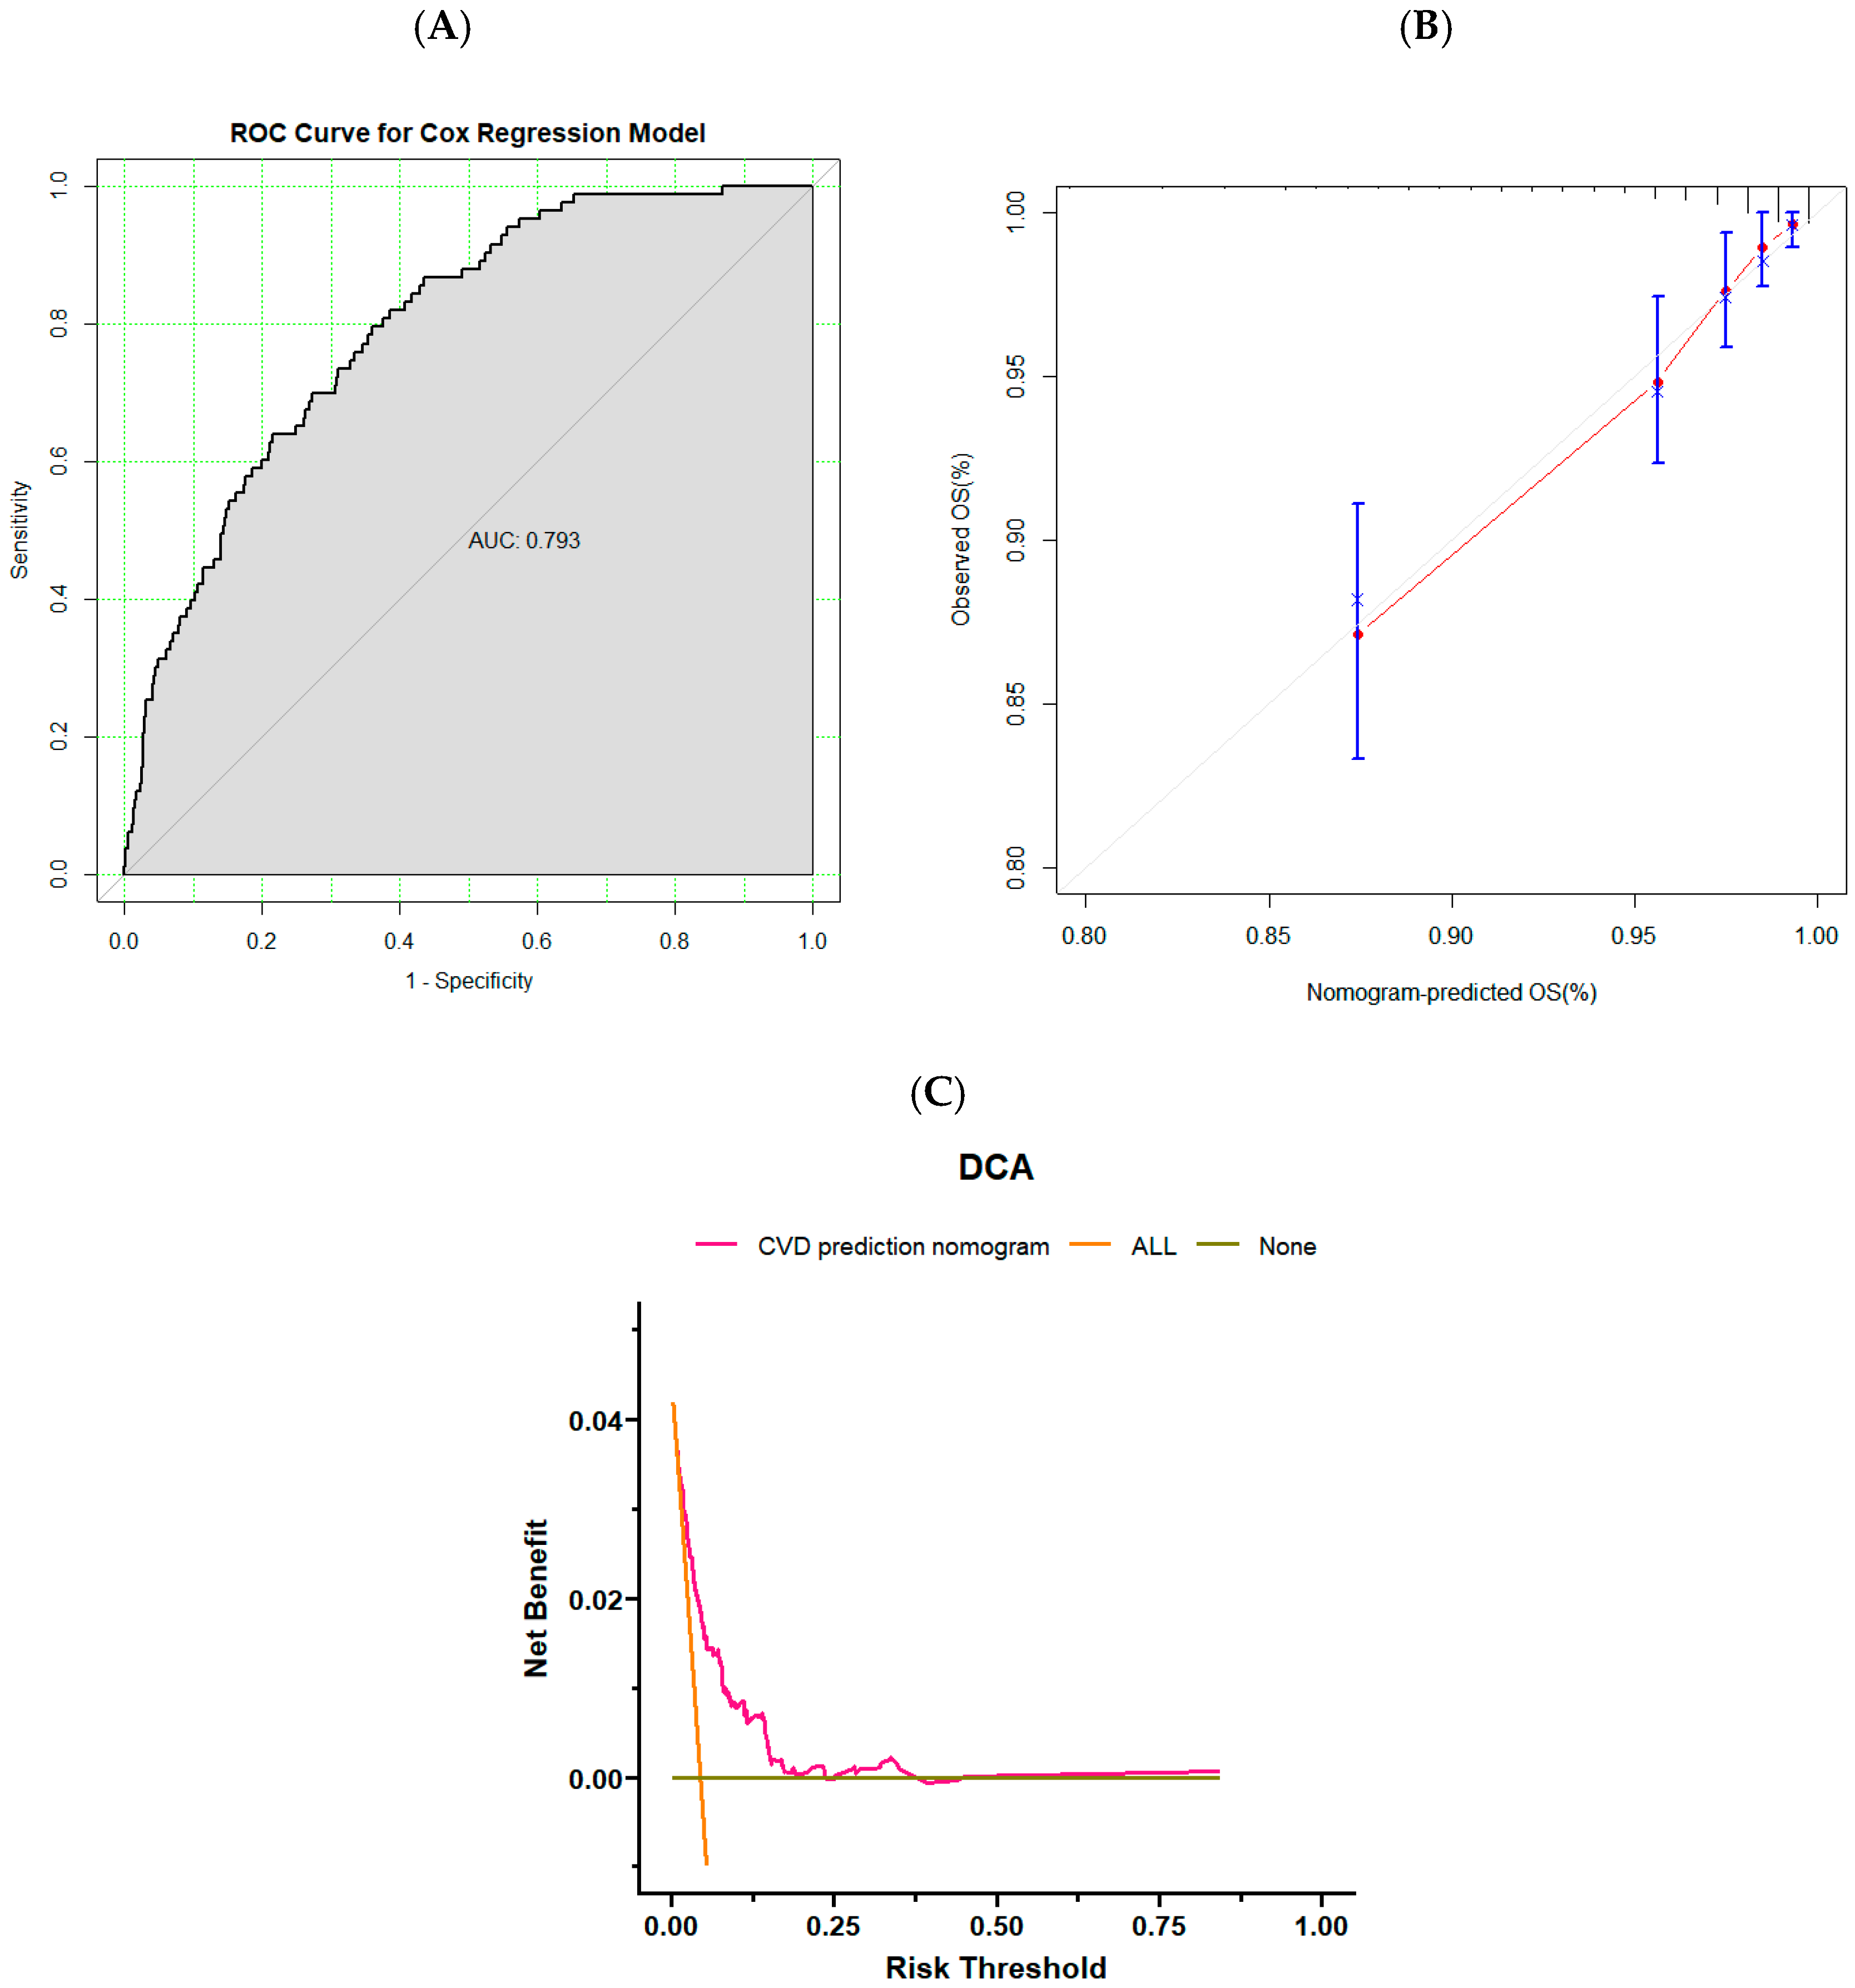
3.3. Validation of Risk Prediction Models

We utilize training and validation sets to evaluate established models for predicting CVD in adults. The C-index of the model was 0.797 (0.765–0.829) in the training set and 0.788 (0.737–0.838) in the validation set. The AUC was 0.808 (0.778–0.837) in the training set and 0.799 (0.749–0.838) in the validation set (Figure 4A and Figure 5A), both of which showed that the prediction model had good prediction performance. The training and validation sets were confirmed using calibration curves (Figure 4B and Figure 5B). The calibration curves were close to the dotted line in the calibration chart. It proved that the predicted survival rate of cardiovascular disease is close to the actual observed survival rate. Therefore, the prediction model has good calibration ability. Finally, the DCA of the training and validation sets (Figure 4C and Figure 5C) were analyzed, which were located in the range of 0.1–0.25 in horizontal coordinates, indicating that the benefit of using this model to predict CVD incidence was greater than that of patients receiving all treatment or no treatment if the threshold for the incidence probability of a patient was 10–25%. In the range of 10–25%, the net benefits are available.

4. Discussion

The present study screened variables through LASSO and constructed a 10-year risk prediction model for CVD using a Cox proportional hazards regression model. The performance of the model training and validation sets was evaluated using the C-index, ROC curve, calibration chart, and DCA, and it was found that the training set had good results in discrimination, calibration, and clinical utility. The validation set also yielded the same result. Historically, models for predicting CVD have used laboratory indicators, or not included the intake of macronutrients in people’s daily lives [6,7,8,9,10,15]. In this research, our ultimate findings reveal that the average daily protein intake in dietary macronutrients is associated with CVD. So, we tried to create a non-invasive CVD prediction model incorporating dietary information.
Firstly, we found that models without blood biochemistry can also predict CVD well. Secondly, lipid acquisition is more difficult and expensive than blood pressure, and test reports for laboratory indicators take time to obtain. Finally, some community residents are reluctant to draw blood, and in the case of limited medical resources, a model that does not rely on lipid information will be advantageous [9,10,20,21]. In contrast, most previous cardiovascular prediction models require laboratory indicators [6,7,8,9,15], which is not convenient for the early management of individual CVD. As a result, none of the 11 predictors in our study included blood biochemistry markers. We used a non-invasive model to predict CVD. Non-invasive predictive models are also involved in areas such as migraine and Parkinson’s disease [22,23]
Second, in addition to the metrics already included in previous models [6,7,8,9,10,15] such as age, sex, diabetes mellitus, smoker, and marriage [24], hypertension [25,26], alcohol [27,28], BMI [29], geographic area [30], and family history of CVD [31,32] are also associated with CVD, and our prediction model further uncovered the relationship between average daily protein intake in dietary macronutrients and CVD. An unhealthy diet significantly contributes to the risk of CVD [33]. Macronutrients constitute the primary elements of the human dietary intake [34]. However, the non-laboratory model developed by the WHO does not include dietary macronutrients [10]. A previous prediction model [20] with CVD was performed using the China Kadoorie Biobank and included fruit, meat, and eggs but not overall macronutrient intake. In our prediction model, average daily protein intake is a significant independent predictor [35]. Epidemiological studies indicate a strong correlation between higher protein consumption and a reduced likelihood of CVD [36,37]. Lyman [37] scholars noted that dietary proteins serve various roles beyond protein synthesis, significantly contributing to satiety, cellular communication, and the regulation of body temperature and blood sugar levels, with these metabolic effects being particularly noticeable when consumption exceeds the recommended dietary intake. A study conducted by Richter et al. [38] emphasized that more protein-rich plant foods should be consumed, and some animal protein sources, such as seafood, eggs, low-fat dairy products, poultry, and lean meats, should be consumed in moderation to replace refined carbohydrates and processed meats, so as to reduce the risk of CVD.
Different models have different values for CVD. We followed the 5.0% and 10.0% CVD risk values of the China-PAR model as cut-off points [21]. In the nomogram, an individual at high risk of CVD can be considered if the risk of CVD is ≥10.0% at 10 years. High-risk individuals require immediate and intensive interventions to correct harmful habits like smoking, weight issues and poor diet, supported by medical supervision and possibly advanced imaging for cardiovascular risk assessment. A risk of disease of 5.0–9.9%, can be regarded as an intermediate-risk individual. Intermediate-risk individuals need to modify unhealthy behaviors, potentially with clinical guidance. Low-risk individuals have a risk of disease of less than 5.0% and should follow health guidelines to sustain their status. Risk thresholds do not solely dictate medical intervention; lifestyle changes are vital at all levels. Stratification helps pinpoint the high-risk individuals for precise and timely intervention, ensuring resources are used wisely for maximum prevention effectiveness.
This study possesses several notable strengths. Firstly, our study included protein intake in daily dietary macronutrients to make predictions, which differed from the factors included in previous prediction models. Secondly, the practicability of our model is an advantage, as the model does not use blood biochemical indicators such as blood lipids, which can reduce medical costs and is more conducive to the detection and intervention of CVD at the grassroots level and individuals.Nonetheless, there are biases in the collection of outcome variables, as well as potential changes in social demographics, dietary habits, and risk factors over the years. In addition, we did not conduct external validation or make short-term predictions, which requires further compensation from subsequent research.

5. Conclusions

We have developed a non-invasive model that incorporates dietary macronutrients to predict CVD in adults. This model applies to primary community health services and helps adults predict their CVD risk in a personalized way, and people can actively manage their health based on the predictions.

Author Contributions

J.G.: Writing—review & editing, Writing—original draft, Methodology, Formal analysis. Y.D.: Writing—review & editing, Writing—original draft, Visualization, Formal analysis. Y.P.: Writing—review & editing, upervision. L.Z.: Writing—review & editing, Conceptualization. H.J.: Writing—review & editing, Writing—original draft, Visualization, Validation, Supervision. All authors have read and agreed to the published version of the manuscript.

Funding

This research received no external funding.

Institutional Review Board Statement

The study adhered to the guidelines in the Declaration of Helsinki and received clearance from the National Institute for Nutrition and Health under the Chinese Center for Disease Control and Prevention (ethics approval number 2018-004, dated 14 March 2018).

Informed Consent Statement

All participants obtained informed consent.

Data Availability Statement

The raw datasets used in this study are accessible to the public on the following platforms: CHNS (http://www.cpc.unc.edu/projects/china, (accessed on August 2004 to December 2015)).

Acknowledgments

The author thanks the research partners of CHNS Data for providing rich and rigorous data for this study.

Conflicts of Interest

The research was conducted with no potential conflicts of interest stemming from commercial or financial ties, as stated by the authors.

References

  1. Vos, T.; Lim, S.S.; Abbafati, C.; Abbas, K.M.; Abbasi, M.; Abbasifard, M.; Abbasi-Kangevari, M.; Abbastabar, H.; Abd-Allah, F.; Abdelalim, A.; et al. Global Burden of 369 Diseases and Injuries in 204 Countries and Territories, 1990–2019: A Systematic Analysis for the Global Burden of Disease Study 2019. Lancet 2020, 396, 1204–1222. [Google Scholar] [CrossRef] [PubMed]
  2. Fahimfar, N.; Malekzadeh, R.; Fotouhi, A.; Mansournia, M.A.; Sarrafzadegan, N.; Azizi, F.; Sepanlou, S.G.; Mansourian, M.; Hadaegh, F.; Emamian, M.H.; et al. An Office-Based Cardiovascular Prediction Model Developed and Validated in Cohort Studies of a Middle-Income Country. J. Clin. Epidemiol. 2022, 146, 1–11. [Google Scholar] [CrossRef] [PubMed]
  3. Zhang, J.; Tong, H.; Jiang, L.; Zhang, Y.; Hu, J. Trends and Disparities in China’s Cardiovascular Disease Burden from 1990 to 2019. Nutr. Metab. Cardiovasc. Dis. 2023, 33, 2344–2354. [Google Scholar] [CrossRef] [PubMed]
  4. The Writing Committee of the Report on Cardiovascular Health and Diseases in China. Report on Cardiovascular Health and Diseases in China 2022: An Updated Summary. Biomed. Environ. Sci. 2023, 36, 669–701. [Google Scholar]
  5. Zhang, Y.; Miao, H.; Chia, Y.C.; Buranakitjaroen, P.; Siddique, S.; Shin, J.; Turana, Y.; Park, S.; Tsoi, K.; Chen, C.H.; et al. Cardiovascular Risk Assessment Tools in Asia. J. Clin. Hypertens. 2022, 24, 369–377. [Google Scholar] [CrossRef]
  6. D’Agostino, R.B.; Vasan, R.S.; Pencina, M.J.; Wolf, P.A.; Cobain, M.; Massaro, J.M.; Kannel, W.B. General Cardiovascular Risk Profile for Use in Primary Care: The Framingham Heart Study. Circulation 2008, 117, 743–753. [Google Scholar] [CrossRef]
  7. Andrus, B.; Lacaille, D. 2013 ACC/AHA Guideline on the Assessment of Cardiovascular Risk. J. Am. Coll. Cardiol. 2014, 63, 2886. [Google Scholar] [CrossRef]
  8. Hippisley-Cox, J.; Coupland, C.; Brindle, P. Development and Validation of QRISK3 Risk Prediction Algorithms to Estimate Future Risk of Cardiovascular Disease: Prospective Cohort Study. BMJ 2017, 357, j2099. [Google Scholar] [CrossRef]
  9. Conroy, R.M.; Pyörälä, K.; Fitzgerald, A.E.; Sans, S.; Menotti, A.; De Backer, G.; De Bacquer, D.; Ducimetiere, P.; Jousilahti, P.; Keil, U.; et al. Estimation of Ten-Year Risk of Fatal Cardiovascular Disease in Europe: The SCORE Project. Eur. Heart J. 2003, 24, 987–1003. [Google Scholar] [CrossRef]
  10. Kaptoge, S.; Pennells, L.; De Bacquer, D.; Cooney, M.T.; Kavousi, M.; Stevens, G.; Riley, L.M.; Savin, S.; Khan, T.; Altay, S.; et al. World Health Organization Cardiovascular Disease Risk Charts: Revised Models to Estimate Risk in 21 Global Regions. Lancet Glob. Health 2019, 7, e1332–e1345. [Google Scholar] [CrossRef]
  11. Mahin, N.; Davood, K.; Mehdi, Y.; Ali, M.M.; Aryan, A.; Hossein, N.; Saharnaz, N. Validity of the Models Predicting 10-Year Risk of Cardiovascular Diseases in Asia: A Systematic Review and Prediction Model Meta-Analysis. PLoS ONE 2023, 18, e0292396. [Google Scholar]
  12. Yang, S.; Ding, Y.; Yu, C.; Guo, Y.; Pang, Y.; Sun, D.; Pei, P.; Yang, L.; Chen, Y.; Du, H.; et al. WHO Cardiovascular Disease Risk Prediction Model Performance in 10 Regions, China. Bull. World Health Organ. 2023, 101, 238–247. [Google Scholar] [CrossRef] [PubMed]
  13. Bendera, A.; Nakamura, K.; Seino, K.; Alemi, S. Performance of the Non-Laboratory Based 2019 WHO Cardiovascular Disease Risk Prediction Chart in Eastern Sub-Saharan Africa. Nutr. Metab. Cardiovasc. Dis. 2024, 34, 1448–1455. [Google Scholar] [CrossRef] [PubMed]
  14. Marsh, R.W. Predicting Cardiovascular Events Using Three Stage Discriminant Function Is Much More Accurate than Framingham or QRISK. Eur. J. Epidemiol. 2011, 26, 915–918. [Google Scholar] [CrossRef] [PubMed]
  15. Xueli, Y.; Jianxin, L.; Dongsheng, H.; Jichun, C.; Ying, L.; Jianfeng, H.; Xiaoqing, L.; Fangchao, L.; Jie, C.; Chong, S.; et al. Predicting the 10-Year Risks of Atherosclerotic Cardiovascular Disease in Chinese Population: The China-PAR Project (Prediction for ASCVD Risk in China). Circulation 2016, 134, 1430–1440. [Google Scholar]
  16. Niu, J.; Li, B.; Zhang, Q.; Chen, G.; Papadaki, A. Exploring the Traditional Chinese Diet and Its Association with Health Status—A Systematic Review. Nutr. Rev. 2024, nuae013. [Google Scholar] [CrossRef]
  17. Arnett, D.K.; Blumenthal, R.S.; Albert, M.A.; Buroker, A.B.; Goldberger, Z.D.; Hahn, E.J.; Dennison, H.C.; Amit, K.; Donald, L.-J.; William, M.J.; et al. 2019 ACC/AHA Guideline on the Primary Prevention of Cardiovascular Disease: A Report of the American College of Cardiology/American Heart Association Task Force on Clinical Practice Guidelines. Circulation 2019, 140, e596–e646. [Google Scholar] [CrossRef]
  18. Zhang, H.; Wang, S.; Gu, X.; Qiu, H.; Zhang, Y. L-Shaped Association between Dietary Zinc Intake and the Risk of Developing Cardiovascular Disease in Chinese Adults: A Cohort Study. Front. Nutr. 2023, 10, 1032048. [Google Scholar] [CrossRef]
  19. Yu, E.; Malik, V.S.; Hu, F.B. Cardiovascular Disease Prevention by Diet Modification. J. Am. Coll. Cardiol. 2018, 72, 914–926. [Google Scholar] [CrossRef]
  20. Yang, S.; Han, Y.; Yu, C.; Guo, Y.; Pang, Y.; Sun, D.; Pei, P.; Yang, L.; Chen, Y.; Du, H.; et al. Development of a Model to Predict 10-Year Risk of Ischemic and Hemorrhagic Stroke and Ischemic Heart Disease Using the China Kadoorie Biobank. Neurology 2022, 98, e2307–e2317. [Google Scholar] [CrossRef]
  21. Joint Task Force for Guideline on the Assessment and Management of Cardiovascular Risk in China. Guideline on the Assessment and Management of Cardiovascular Risk in China. Chin. J. Prev. Med. 2019, 53, 13–35. [Google Scholar] [CrossRef]
  22. Development and Validation of Non-Invasive Prediction Models for Migraine in Chinese Adults. Available online: https://www.pmop.cn/pubmed/37926825 (accessed on 2 August 2024).
  23. Predicting Parkinson’s Disease and Its Pathology via Simple Clinical Variables. Available online: https://www.pmop.cn/pubmed/34602502 (accessed on 2 August 2024).
  24. Wilson, S.J.; Cole, S.W.; Shrout, M.R.; Malarkey, W.B.; Andridge, R.; Kiecolt-Glaser, J.K. Your Suffering Is My Stressor: Proinflammatory Gene Expression Rises with Spousal Distress in Middle-Aged and Older Couples. Psychoneuroendocrinology 2023, 153, 106116. [Google Scholar] [CrossRef] [PubMed]
  25. Choi, E.; Shimbo, D.; Chen, L.; Foti, K.; Ghazi, L.; Hardy, S.T.; Muntner, P. Trends in All-Cause, Cardiovascular, and Noncardiovascular Mortality Among US Adults with Hypertension. Hypertension 2024, 81, 1055–1064. [Google Scholar] [CrossRef] [PubMed]
  26. Surendran, P.; Drenos, F.; Young, R.; Warren, H.; Cook, J.P.; Manning, A.K.; Grarup, N.; Sim, X.; Barnes, D.R.; Witkowska, K.; et al. Trans-Ancestry Meta-Analyses Identify Rare and Common Variants Associated with Blood Pressure and Hypertension. Nat. Genet. 2016, 48, 1151–1161. [Google Scholar] [CrossRef] [PubMed]
  27. Estruch, R.; Sacanella, E.; Badia, E.; Antúnez, E.; Nicolás, J.M.; Fernández-Solá, J.; Rotilio, D.; De Gaetano, G.; Rubin, E.; Urbano-Márquez, A. Different Effects of Red Wine and Gin Consumption on Inflammatory Biomarkers of Atherosclerosis: A Prospective Randomized Crossover Trial. Atherosclerosis 2004, 175, 117–123. [Google Scholar] [CrossRef] [PubMed]
  28. Kang, D.O.; Lee, D.-I.; Roh, S.-Y.; Na, J.O.; Choi, C.U.; Kim, J.W.; Kim, E.J.; Rha, S.-W.; Park, C.G.; Kim, Y.-S.; et al. Reduced Alcohol Consumption and Major Adverse Cardiovascular Events Among Individuals with Previously High Alcohol Consumption. JAMA Netw. Open 2024, 7, e244013. [Google Scholar] [CrossRef] [PubMed]
  29. Ahmadi, S.-F.; Streja, E.; Zahmatkesh, G.; Streja, D.; Kashyap, M.; Moradi, H.; Molnar, M.Z.; Reddy, U.; Amin, A.N.; Kovesdy, C.P.; et al. Reverse Epidemiology of Traditional Cardiovascular Risk Factors in the Geriatric Population. J. Am. Med. Dir. Assoc. 2015, 16, 933–939. [Google Scholar] [CrossRef]
  30. Qiong, W.; Yang, Z.; Lihua, L.; Yuehui, L.; Jianchao, L. Trend, Regional Variation and Socioeconomic Inequality in Cardiovascular Disease among the Elderly Population in China: Evidence from a Nationwide Longitudinal Study during 2011–2018. BMJ Glob. Health 2023, 8, e013311. [Google Scholar]
  31. Manas, C.; Sankara, S.P.; Sivadasanpillai, H.; Geevar, Z.; Panniyammakal, J. Family History of Cardiovascular Disease and Risk of Premature Coronary Heart Disease: A Matched Case-Control Study. Wellcome Open Res. 2020, 5, 70. [Google Scholar]
  32. Jae, K.S.; Deog, K.O.; EungJoon, L.; Myeong, O.S.; KyungSoo, K. Impact of a Family History of Cardiovascular Disease on Prevalence, Awareness, Treatment, Control of Dyslipidemia, and Healthy Behaviors: Findings from the Korea National Health and Nutrition Examination Survey. PLoS ONE 2021, 16, e0254907. [Google Scholar]
  33. Chareonrungrueangchai, K.; Wongkawinwoot, K.; Anothaisintawee, T.; Reutrakul, S. Dietary Factors and Risks of Cardiovascular Diseases: An Umbrella Review. Nutrients 2020, 12, 1088. [Google Scholar] [CrossRef]
  34. Koemel, N.A.; Senior, A.M.; Celermajer, D.S.; Grech, A.; Gill, T.P.; Simpson, S.J.; Raubenheimer, D.; Skilton, M.R. Multi-Nutrient Analysis of Dietary Macronutrients with All-Cause, Cardiovascular, and Cancer Mortality: Data from NHANES 1999–2014. Nutrients 2023, 15, 345. [Google Scholar] [CrossRef] [PubMed]
  35. Ma, Y.; Zheng, Z.; Zhuang, L.; Wang, H.; Li, A.; Chen, L.; Liu, L. Dietary Macronutrient Intake and Cardiovascular Disease Risk and Mortality: A Systematic Review and Dose-Response Meta-Analysis of Prospective Cohort Studies. Nutrients 2024, 16, 152. [Google Scholar] [CrossRef] [PubMed]
  36. Hu, F.B. Protein, Body Weight, and Cardiovascular Health. Am. J. Clin. Nutr. 2005, 82, 242S–247S. [Google Scholar] [CrossRef] [PubMed]
  37. Layman, D.K. Dietary Guidelines Should Reflect New Understandings about Adult Protein Needs. Nutr. Metab. 2009, 6, 12. [Google Scholar] [CrossRef]
  38. Richter, C.K.; Skulas-Ray, A.C.; Champagne, C.M.; Kris-Etherton, P.M. Plant Protein and Animal Proteins: Do They Differentially Affect Cardiovascular Disease Risk? Adv. Nutr. 2015, 6, 712–728. [Google Scholar] [CrossRef]
Figure 1. The established CVD prediction model and a flow chart for the selection of research subjects.
Nutrients 16 04180 g001
Figure 2. LASSO regression model was used to select factors for CVD. (A) The 17 colored lines in the figure represent 17 variables, which were screened using LASSO regression. The x-axis represents the log lambda, while the y-axis denotes the partial regression coefficient. As the logarithm of lambda rises, the regularization parameter strengthens, diminishing the bias regression coefficient’s magnitude, and potentially reducing it to near zero, leading to its exclusion. (B) The dashed line on the left is λ min, which means λ when the deviation is the smallest, which means that the model fitting effect is the highest under the lambda value. The 14 variables corresponding to log (λ) min were used.
Nutrients 16 04180 g002
Figure 3. A predictive tool for the likelihood of CVD progression, the nomogram assigns points to each factor according to its scoring system. The aggregate of these points yields a total score, which, when aligned with the scale, provides an estimated chance of surviving CVD. GA, Geographic area (0 = South, 1 = North); FH, Family history of CVD (0 = No, 1 = Yes); Marriage, (0 = No, 1 = Yes); Hypertension, (0 = No, 1 = Yes); Diabetes mellitus, (0 = No, 1 = Yes); BMI, (0: <24.0, 1: 24.0~28.0, 2: >28.0); Smoker, (0 = Unmarried, 1 = Married, 2 = Divorced or widowed); Alcohol, (0 = No, 1 = Yes); Protein, average daily protein intake.
Nutrients 16 04180 g003
Figure 4. (A) ROC of the training set. (B) Calibration curves of the training set. Calibration curves illustrate the relationship between predicted and actual CVD risks. Risk predictions made by the model are depicted on the x-axis, in contrast to the actual risks displayed on the y-axis. The dashed line indicates perfect predictions by an ideal model, while the solid line represents the nomogram’s performance, with closer alignment to the dashed line indicating better accuracy. (C) DCA of the training set. The black line indicates the net benefit assuming no participants develop CVD, whereas the light orange curve signifies the net benefit assuming all participants are at risk of developing CVD. The clinical utility of the model is illustrated by the area between the pink curve and the light orange curve.
Nutrients 16 04180 g004
Figure 5. (A) ROC of the validation set. (B) Calibration curves of the validation set. (C) DCA of the validation set.
Nutrients 16 04180 g005
Table 1. Baseline characteristics of training and validation sets.
Total
(n = 5186)
Validation Set
(n = 1502)
Training Set
(n = 3684)
p-Value
Follow-up time, y9.81 ± 2.239.84 ± 2.209.81 ± 2,240.648
Age, y46.89 ± 13.5146.65 ± 13.5046.99 ± 13.520.412
Sex, n (%) 0.524
 Male2496 (48.1)712 (47.4)1784 (48.4)
 Female2690 (51.9)790 (52.6)790 (52.6)
Geographic area, n (%) 0.030
 North2122 (40.9)650 (43.3)1472 (40.0)
 South3064 (59.1)852 (56.7)2212 (60.0)
Urbanization, n (%) 0.198
 Urban1427 (27.5)394 (26.2)1033 (28.0)
 Rural3759 (72.5)1108 (73.8)2651 (72.0)
Marriage, n (%) 0.422
 Unmarried351 (6.8)91 (6.1)260 (7.1)
 Married4518 (87.1)1320 (87.9)3198 (86.8)
 Divorced or widowed317 (6.1)91 (6.1)226 (6.1)
Education, n (%) 0.119
 Less than high school2367 (45.6)678 (45.1)1689 (45.9)
 High school or above2819 (54.4)824 (54.9)1995 (54.1)
Family history of CVD, n (%) 0.301
 Yes319 (6.2)101 (6.7)218 (5.9)
 No4867 (93.8)1401 (93.3)3466 (94.1)
Hypertension, n (%) 0.262
 Yes362 (7.0)95 (6.3)267 (7.2)
 No4824 (93.0)1407 (93.7)3417 (92.8)
Antihypertensive therapy, n (%) 0.319
 Yes243 (4.7)63 (4.2)180 (4.9)
 No4943 (95.3)1439 (95.8)3504 (95.1)
Diabetes mellitus, n (%) 0.774
 Yes47 (0.9)15 (1.0)32 (0.9)
 No5139 (99.1)1487 (99.0)3652 (99.1)
BMI, n (%) 0.298
 <24.03362 (64.8)998 (66.4)2364 (64.2)
 24.0 to <28.01414 (27.3)391 (26.0)1023 (27.8)
 ≥28410 (7.9)113 (7.5)297 (8.1)
Smoker, n (%) 0.905
 Yes1739 (33.5)506 (33.7)1233 (33.5)
 No3447 (66.5)996 (66.3)2451 (66.5)
Alcohol, n (%) 0.743
 Yes1749 (33.5)501 (33.4)1248 (33.9)
 No3437 (66.5)1001 (66.6)2436 (66.1)
Averagedaily kcal intake, kcal2238.69 ± 640.432214.31 ± 636.712248.63 ± 641.760.080
Average daily carbohydrate intake, g332.27 ± 105.57328.86 ± 103.79333.66 ± 106.280.137
Average daily fat intake, g67.94 ± 35.2067.07 ± 35.9468.30 ± 34.890.256
Average daily protein intake, g66.95 ± 22.6866.23 ± 22.5167.24 ± 34.890.145
Table 2. LASSO and multivariate Cox regression analysis of cardiovascular predictors in the study population.
CharacteristicsLASSO RegressionMultifactorial Cox Regression Analysis
Coefficientsλ. 1 minHazard Ratio95% CIp-Value
Sex0.34823112880.00073696001.5771.060, 2.344<0.05
Age0.05598619791.0571.044, 1.071<0.05
Geographic area0.49969289551.6971.258, 2.290<0.05
Urbanization−0.0359183200---
Family history of CVD1.19263549943.3692.322, 4.887<0.05
Marriage0.0610897230---
 Unmarried----
 Married-3.2780.803, 13.3880.098
 Divorced or widowed-2.8830.649, 12.8010.164
Hypertension0.81700911532.3531.662, 3.333<0.05
Antihypertensive0.0660699743---
Diabetes mellitus0.78649436172.5521.221, 5.333<0.05
BMI0.2907036033---
 <24.0----
 24.0 to <28.0-1.3280.958, 1.8390.088
 ≥28-1.8561.198, 2.875<0.05
Smoker0.39479069431.5121.048, 2.181<0.05
Alcohol−0.22455865230.7320.515, 1.039<0.05
Average daily carbohydrate intake0.0007983668---
Average daily protein intake−0.00603874040.9950.9884, 1.0020.162
Disclaimer/Publisher’s Note: The statements, opinions and data contained in all publications are solely those of the individual author(s) and contributor(s) and not of MDPI and/or the editor(s). MDPI and/or the editor(s) disclaim responsibility for any injury to people or property resulting from any ideas, methods, instructions or products referred to in the content.

