Abstract
Background: More than half of the states in the U.S. report that over 30% of adults are obese. Obesity increases the risk of many chronic diseases, including type 2 diabetes, hypertension, and cardiovascular disease, and can even reduce one’s lifespan. Similarly, the prevalence of type 2 diabetes follows a comparable trend. As a result, researchers are striving to find solutions to reduce obesity rates, with a particular focus on gut health, which has been previously linked to both obesity and type 2 diabetes. Recent studies suggest that Akkermansia muciniphila (Akk) may have a positive probiotic effect on preventing the onset of type 2 diabetes and obesity. Methods: We conducted a quantitative meta-analysis of 15 qualified animal studies investigating the effects of Akk administration as a probiotic. Results: The statistical analyses showed that Akk administration significantly reduced body weight gain by 10.4% and fasting blood glucose by 21.2%, while also significantly improving glucose tolerance by 22.1% and increasing blood insulin levels by 26.9%. However, our analysis revealed substantial heterogeneity between the control and experimental groups across all subgroups. Conclusions: Overall, Akk appears to be effective at reducing the onset of type 2 diabetes and diet-induced obesity. Long-term studies with larger sample sizes are needed to confirm these beneficial effects, as the current animal studies were of short duration (less than 20 weeks).
1. Introduction
The alarming surge in obesity and diabetes rates within the USA is reaching critical levels, with 41.9% and 14.7%, respectively among American adults [1,2]. In 2022, 43% of adults in the world were overweight and 16% were living with obesity [3]. Moreover, obesity stands as a significant precursor to diabetes, amplifying the urgency of this health crisis [3]. Both conditions demand sustained attention and comprehensive care, presenting formidable challenges to public health. Addressing this pressing issue necessitates the development of innovative, sustainable long-term strategies. There has been strong evidence suggesting that both obesity and diabetes have been strongly linked to gut microbiota, the vast community of microbes in our intestines [4]. Studies have shown that lean mice gained significant weight after transferring gut bacteria from obese mice, suggesting that gut microbiota play a key role in managing body weight [5,6]. Other studies in animals and humans demonstrate an inverse relationship between obesity and diversity of gut microbiota, specifically symbionts including genera Bifidobacteria, Lactobacillus, and Verrucomicrobiota (in which Akk belongs to) [7,8]. In addition, gut microbiota has been shown to alter low-grade inflammation and insulin resistance upon modification via dietary interventions [9]. In particular, a group of gut bacterial metabolites such as short-chain fatty acids (SCFAs) are believed play a role in mediating the effects of gut microbiota [10]. For instance, diabetes patients were found to have a reduced population of SCFAs-producing gut bacteria, suggesting a potential link of gut bacteria with impaired blood sugar control [4]. Common SCFAs include acetate, butyrate, and propionate, and their anti-obesity and anti-diabetes bioactivities have been widely studied. These findings also suggest that a potential strategy to manage obesity and type 2 diabetes is targeting gut microbiota.
Akk is a gram-negative gut bacterium belonging to the phylum Verrucomicrobia. It is one of the most abundant gut bacteria in humans, representing 3–5% of the microbial community. A. muciniphila was first isolated and identified in 2004 in purified mucin as an oval-shaped, strictly anaerobic bacterium. Akk has the ability to utilize mucus glycans as carbon sources to grow. As a mucin-degrading bacterium, Akk in turn stimulates the growth of the protective gut lining and enhances gut barrier functions [11,12]. Akk has recently gained increased research interest due to its potential benefits against obesity and metabolic syndrome. Research has found that Akk is more abundant in healthy subjects than in diabetic and obese patients. Further support comes from intervention studies that have also found an inverse correlation between Akk abundance and body weight, metabolic syndrome, and type 2 diabetes [13,14,15,16].
Despite the growing body of evidence suggesting that Akk is a promising probiotic, the exact mechanisms by which it exerts its beneficial impact on health have not been fully elucidated (Figure 1). Studies have shown that Akk promotes the gut production of short-chain fatty acids (SCFAs), improving insulin resistance and host metabolism—factors linked to obesity and diabetes [12,13,14,15]. Moreover, Akk has been shown to modify the gut microbiota by stimulating other beneficial gut bacteria such as Bifidobacteria, thereby promoting a healthier gut ecosystem [13].
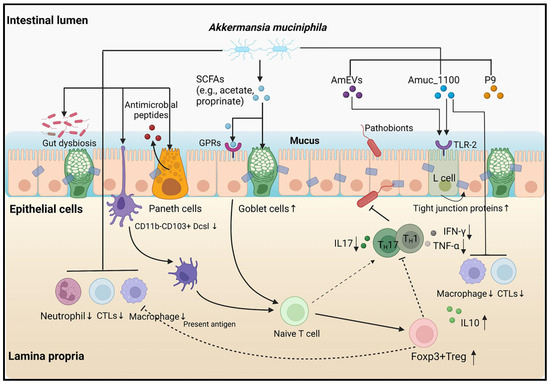
Figure 1.
Various pathways and models associated with A. muciniphila [7].
There have been a growing number of studies investigating the beneficial role of Akk on obesity and diabetes [7]. Animal studies have been particularly encouraging. For instance, dietary Akk supplementation has been shown to reduce body weight gain, fasting blood glucose, and insulin resistance in mice fed with a high-fat diet [14,15]. Similar findings have been demonstrated in other studies, suggesting the protective role of Akk against obesity and diabetes, though the exact mechanisms are not clear. A recent human trial, while demonstrating improved insulin sensitivity and reduced cholesterol in overweight/obese participants, did not show significant changes in weight or body fat composition [16]. This discrepancy highlights the need for a more comprehensive analysis of Akk effects on obesity and diabetes. A previous review that compared the effects of Akk on various metabolic diseases found a positive association with the onset of type 2 diabetes following Akk supplementation. However, this association lacked strong evidence [17]. To address this, our meta-analysis aims to systematically evaluate the latest research and compare the effects of Akk administration in different animal studies. We will employ the most comprehensive subgroup analyses possible to provide a more definitive understanding of the impact of Akk.
2. Materials and Methods
2.1. Literature Search Strategy and Inclusion Criteria
This meta-analysis investigated the effect of Akk dietary intake on obesity and type 2 diabetes, focusing on animal studies that generated quantitative data. This study was conducted strictly following the guidelines of Preferred Reporting Items for Systematic Reviews and Meta-Analyses (PRISMA) [18]. The databases PubMed, EMBASE, Web of Science, and Cochrane Library were searched for animal trials on Akk to prevent obesity and type 2 diabetes.
Publications from the inception of the databases until February 2024 were collected. We employed a combination of terms from medical subject headings (MeSH) and keywords. The search strategy encompassed subject headings “Obesity” or “diabetes mellitus” or “metabolic syndromes” in conjunction with identifiers such as “animals” or “mice” or “rats.” The search keywords included “probiotic(s)” and “Akkermansia muciniphila”. All retrieved articles were systematically compiled using Endnote software (20th version). Additionally, we searched bibliographies to ensure inclusivity of relevant literature not initially captured by the database search.
Inclusion criteria: (1) randomized controlled trials in mice; (2) studies employing the Akk probiotic in experimental groups, with a placebo control group for comparison; (3) alternatively, studies utilizing a substrate containing Akk; and (4) studies reporting outcomes related to the risk and development of diabetes or obesity. Exclusion criteria: (1) duplicate studies; (2) studies that were non-blinded trials; (3) studies where the probiotics composition of the intervention was not specified. Article screening and data extraction were completed by 2 reviewers using Covidence software (https://www.covidence.org (accessed on 10 March 2024)), as recommended by the Cochrane Handbook for Systematic Reviews of Interventions and others [19].
2.2. Data Extraction and Quality Assessment
Two researchers independently selected the studies, resolving any disagreements through consultation with a third researcher. Data from the selected studies were extracted into a shared spreadsheet by one reviewer and validated by a second reviewer. The data extraction utilized a standardized form by an independent researcher. The primary outcome was the incidence or biomarkers of obesity or type 2 diabetes, along with any metabolic syndrome factors, upon administration of Akk in animal models. The secondary outcome included the incidence of adverse events or outlier outcomes. Additional extracted data encompassed demographics, indications for antibiotics, probiotic species and dosage, and duration of probiotic administration. Data were extracted as continuous variables [20].
The quality of the selected studies was assessed using the Cochrane Handbook for Systematic Reviews of Interventions [21]. Previously used study quality scales were adapted to evaluate study quality and possible bias risk [22,23]. The methodological assessment scale and its elements were informed by guidelines and publications from rigorous biomedical research such as the STAIR and RIGOR guidelines [24,25]. Taking into account the distinctive nature of the selected animal studies on Akk, the following parameters were considered for study quality assessment: presence or absence of exclusion statement, study pre-registration, inclusion of both sexes, aged and/or compromised animals, sample size, control of diet in the experimental group, clear description of infusion parameters (e.g., rate and/or duration, and dosage), and conflict of interest statements.
2.3. Statistical Analyses
Data analyses were performed using RStudio (version 4.3.3, Ann Arbor, MI, USA), with plots generated using the robumeta, metafor, and dplyr packages. Due to the variability in probiotic durations and infusion parameters, a random-effect meta-analysis model utilizing the Derismonian-Laird estimator was selected for all endpoints. The standardized mean differences (SMDs) were used for calculating effect sizes, with Hedge’s G applied to correct for bias in studies with small sample sizes. Pooled relative risk (RR) and the 95% confidence interval (CI) were calculated using a random-effects model (DerSimonian-Laird method [26]) or a fixed-effects model (Mantel-Haenszel method [27]).
Meta-regression was conducted to evaluate heterogeneity, taking into account variables such as probiotic duration, infusion parameters (including temperature and rate volume), and methodological quality. Sensitivity and subgroup analyses were carried out in cases where unexpected or extreme outcomes were identified in the forest plots. Heterogeneity among the included studies was assessed using the Chi-squared (X2) test and the I2 statistic [28,29]. A p < 0.1 or I2 > 50% indicated substantial heterogeneity, warranting the adoption of a random-effects model. In the absence of substantial heterogeneity, a fixed-effects model was applied. Publication bias was evaluated through funnel plots and further evaluated using the Begg and Egger tests [22,23].
3. Results
3.1. Eligible Studies
A comprehensive literature search was conducted in January 2024, yielding 1552 citations across four databases: PubMed (461), Cochrane Library (52), EMBASE (336), and Web of Science (703). After removing duplicates and conducting title and abstract screenings, 1030 studies were deemed potentially relevant for further evaluation. Of these, 952 of these studies were excluded due to irrelevance or methodological shortcomings. A full-text review of the remaining 78 studies led to the exclusion of 63 studies due to methodological issues (15 non-blinded, 14 non-randomized, 11 unknown probiotic composition) or irrelevant outcomes (seven reporting non-SCFA metabolites, four involving unrelated diseases, and two with missing outcome data). Ultimately, 15 studies met our inclusion criteria, encompassing a total of 586 animals and were selected for data analysis and extraction [30,31,32,33,34,35,36,37,38,39,40,41,42,43,44]. The search flow details are depicted in Figure 2.
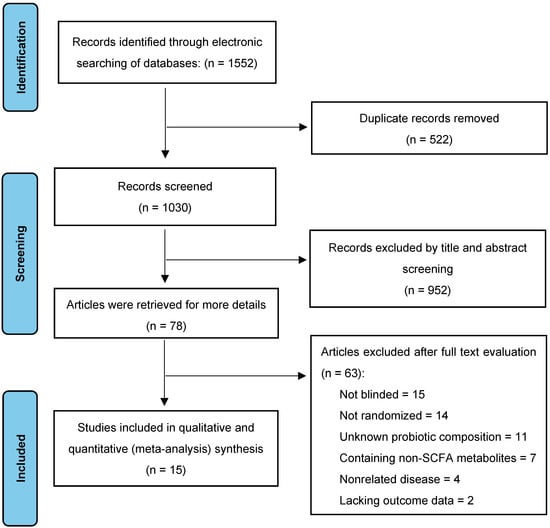
Figure 2.
Selection of studies for the meta-analysis.
3.2. Study Characteristics
Table 1 summarizes the characteristics of the selected individual studies, such as animal models, sample size, and Akk treatment conditions (e.g., prior antibiotic use, single treatment or combination with other supplements, dosage, and duration). Regarding animal models used for Akk intervention, C57BL/6J was the most prevalent (73%), followed by db/db, NOD mice, and other less common models (27%). Notably, one study utilized a streptozotocin-induced diabetic model in Sprague–Dawley rats for oral Akk administration. Methodologically, 83% of the studies reported randomization, 60% mentioned exclusions, 47% disclosed conflicts of interest, 26% ensured complete blinding (during Akk administration and outcome assessment), and 11% included the mortality rate for both experimental and placebo groups (Table 1). None of the studies performed a priori group size calculations.

Table 1.
Characteristics of the enrolled studies.
The experimental groups were predominantly fed a high-fat diet (HFD), comprising over 60% fat compared to carbohydrates (Figure 3A). Most studies employed young, male C57BL/6J, except for two studies which included females but did not consider biological sex as a variable parameter or specify the number of females per group (Figure 3B).
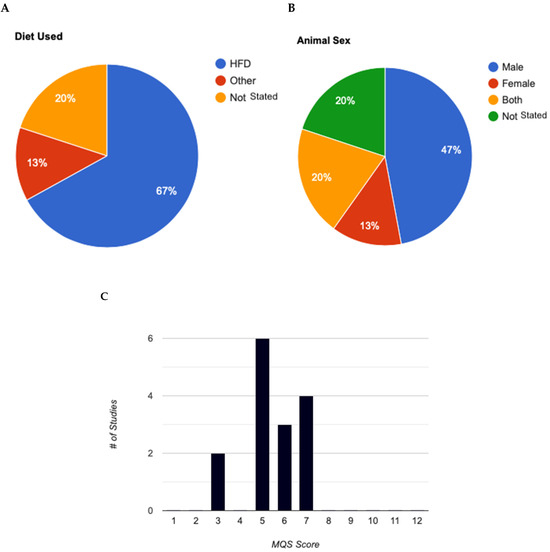
Figure 3.
Analysis of experimental characteristics used in animal models for Akkermansia muciniphila studies. (A): Breakdown of diets used in animal studies. (B): Animal sexes used in mouse animal studies. (C): Evaluation of methodological quality score for animal studies (max score = 12). MQS, Methodological Quality Score.
All studies measured changes in body weight during Akk intervention. Body composition (lean and fat mass) was assessed in 84% of the studies, highlighting its significance as an outcome measure for Akk intervention. Interestingly, four studies employed antibiotics prior to probiotic administration, likely aimed to create a more favorable intestinal environment for robust Akk colonization. The characteristics of interest for the enrolled studies were ranked from most to least prevalent to provide an overview of the current literature characteristics of selected studies (Table 2).

Table 2.
Methodological quality scale reporting elements for Akkermansia muciniphila research in type 2 diabetes and obesity, and percentage adherence.
3.3. Quality Assessment
The methodological quality of these studies was assessed using the STAIR and RIGOR guidelines, specifically designed to evaluate the rigor and robustness of preclinical research, thereby ensuring reliable translation of findings into human studies [28,29]. Of the 15 eligible studies, only 10 employed blinding to minimize detection bias. Reporting on other potential biases varied among the studies. Unfortunately, none of the included studies explicitly mentioned blinding procedures. For outcomes like obesity, which can be visually apparent, it is unclear what specific tools or methods were used to ensure blinding. Future studies should incorporate more rigorous blinding procedures, such as using blinded assessors for subjective outcomes and objective measurement tools for outcomes like obesity, to minimize the risk of bias and enhance the quality of the evidence.
Higher risk of attrition bias and other concerns were noted in studies that: 1. lacked clear methods for handling missing outcome data and outliers (three out of 15 studies); 2. had a short follow-up period (one out of 15 studies); 3. experienced excessive or unbalanced loss of subjects during the study (six out of 15 studies); 4. utilized a small sample size (five out of 15 studies); and 5. had unbalanced baseline characteristics between groups (four out of 15 studies). Nine studies assessed glucose tolerance, a key indicator of the body’s ability to regulate blood sugar levels. Additionally, 13 studies measured serum insulin levels, and nine studies assessed fasting blood glucose levels.
3.4. Analysis of Methodological Quality
Table 1 and Table 2 provide a detailed overview of the methodological quality scale and the analysis of studies incorporating experimental elements. None of the included studies explicitly mentioned the specific randomization and concealment methods used. Future studies should explicitly report randomization and concealment methods to enhance the study quality. Table 3 presents the methodological quality scores (MQS) of the selected studies. The overall median score was 5, indicating low to moderate methodological quality across the studies. Scores ranged from three to seven (out of a maximum of 12 points) as illustrated in Figure 3C. Characteristics of C75BL/6J Mice Model Studies in Akk. All studies, except one, administered Akk immediately after initiating a high-fat diet (HFD) containing 60% of energy from fat. The one exception did not use a HFD but instead administered an antibiotic prior to Akk administration. For studies that included additional supplements, such as metformin or tocotrienol, Akk was administered concurrently with the supplements. In these cases, the mice received either an HFD with 800 mg of tocotrienol or an HFD with 200 mg of metformin, along with Akk.

Table 3.
Statistical summary comparison and total percentage of reported MQS elements (✓ = yes, χ = no).
3.5. Impact of Akk on Body Weight
Ten studies examined changes in body weight during and after Akk administration. One study used rats, while the other nine studies used mice as the animal model. The study on rats showed that Akk supplementation significantly reduced body weight by an average of 25%, likely owing to a greater average body weight in rat models than mice models. In the nine mice studies, an average weight reduction of 3.8 g was observed (Table 4). The total number of mice in the control groups across all studies was 135, compared to 155 in the treatment groups. The average body weight in the Akk groups was 32.2 g, while the average weight of the controls was 36.4 g, suggesting a reduction of average body weight gain by 10.4%.

Table 4.
Descriptive characteristics of studies that assessed body weight.
Normalized effect sizes varied across studies, with most studies showing positive effect sizes, suggesting that the treatment generally had a beneficial effect. However, it is important to note that five out of the nine studies reported non-significant changes in overall body weight compared to baseline. This inconsistency suggests significant variability across the studies, with body weight changes ranging from a 0.08 g increase to an 11.0 g decrease following Akk treatment.
Overall, the weighted mean effect size of 0.33 (95% CI: 0.17–0.48) indicates a statistically significant reduction in body weight gain due to Akk treatment. A forest plot analysis indicated a significant reduction in body weight gain among mice treated with Akk compared to controls (p < 0.001, Figure 4A). However, substantial heterogeneity existed among studies (I2 = 46%), and the funnel plot suggested low publication bias (Figure 4B). The Baujat plot identified the studies by Chung et al. and Wu et al. as primary contributors to this heterogeneity (Figure 4C).
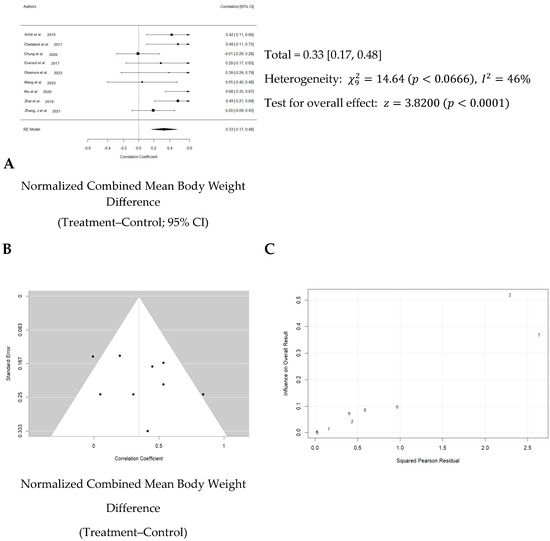
Figure 4.
Quantitative analysis of studies that assessed body weight using a random-effects meta-analysis. (A): Forest plot of studies investigating body weight effects (normalized mean difference 95% CI) [31,32,33,34,36,40,41,42,43]. Effect size estimates were heterogenous, likely owing to study design differences. (B): Funnel plot used to assess publication bias. These results suggest that the studies used in the meta-analysis had relatively low publication bias (i.e., the symmetric distribution of closed circles). (C): Baujat plot used to assess the studies that contributed most to heterogeneity. These results suggest that studies Chung et al. 2020 [33] and Wu et al. 2020 [41] likely had moderating variables that contributed the most to the heterogeneity.
3.6. Impact of Akk on Glucose Tolerance
Nine studies evaluated the effect of Akk on glucose tolerance (Table 5). In total, 111 animals were in the control groups, while 123 received treatment. On average, Akk treatment led to a 22.1% improvement in glucose tolerance, as estimated by the 2 h area under the curve (AUC) for blood glucose following a glucose tolerance test. Since the exact AUC values were not provided in all the selected studies, these estimates were derived from the individual study graphs using an image analysis program (https://imagej.nih.gov/ij/, accessed on 10 March 2024). The effect sizes varied. While three studies showed significant reductions in AUC, the majority reported only minor, non-significant decreases.

Table 5.
Descriptive characteristics of studies that assessed glucose tolerance.
Overall, a weighted mean effect size of 0.347 (95% CI: 0.18–0.63) indicated a statistically significant reduction in blood glucose levels due to Akk treatment. Forest plot analysis confirmed this, revealing a pooled effect size of 0.43 (95% CI: 0.18–0.63; p < 0.001, Figure 5A). A random-effects model was used to account for heterogeneity between studies, which was substantial (I2 = 73%). Nonetheless, the funnel plot suggested low publication bias (Figure 5B). The study by Shin et al. primarily contributed to the observed heterogeneity (Figure 5C).
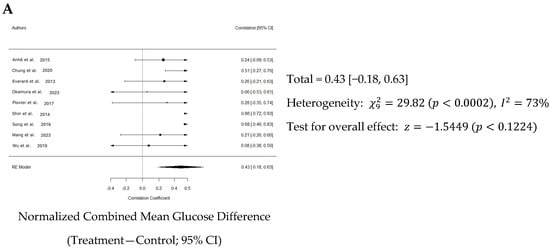
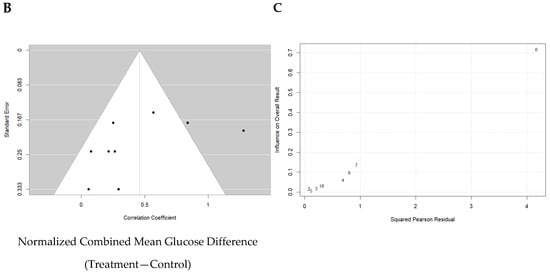
Figure 5.
Quantitative analysis of studies that assessed glucose tolerance using a random-effects meta-analysis. (A): Forest plot of studies investigating glucose tolerance (normalized mean difference ±95% CI) [31,33,34,36,37,38,39,40,41]. Effect size estimates were heterogenous, likely owing to study design differences. (B): Funnel plot used to assess publication bias. These results suggest that the studies used in the meta-analysis had relatively low publication bias. (C): Baujat plot used to assess the studies that contributed most to heterogeneity. These results suggest that the study Shin et al. 2014 [38] likely had moderating variables that contributed the most to the heterogeneity.
3.7. Impact of Akk on Blood Insulin
Thirteen studies examined circulating insulin hormone levels. As presented in Table 6, the total number of animals in the control groups across all studies was 168, compared to 200 in the treatment groups. The data suggest that Akk treatment stimulated blood insulin production in the animals by 26.9%, as shown by the higher mean level of 2.6 µIU/mL in the treatment groups compared to 1.9 µIU/mL in the control groups.

Table 6.
Descriptive characteristics of studies that assessed blood insulin.
Normalized effect sizes varied across studies, with most studies showing positive effect sizes, suggesting that the treatment generally had a beneficial effect. Nevertheless, only seven of 13 studies showed that the effect was significant. The weighted mean effect size of 0.827 with a confidence interval of 0.10 to 0.25 indicates a statistically significant reduction in blood glucose levels due to Akk treatment. The forest plot also revealed a significant increase in blood insulin levels in animals administered Akk compared to controls (p < 0.001) as shown in Figure 6A. The analysis showed a pooled effect size of 0.18 (95% confidence interval: 0.10–0.25). There was significant variation in the study results (I2 = 64%). Additionally, the analysis suggests a potential publication bias (Figure 6B). These results indicate that the studies by Shin et al., Song et al. and Wang et al. contributed the most to the observed heterogeneity (Figure 6C).
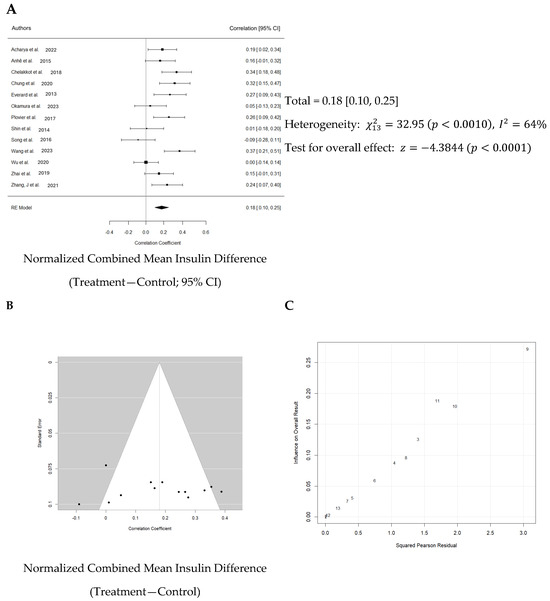
Figure 6.
Quantitative analysis of studies that assessed insulin hormone levels using a random-effects meta-analysis. (A): Forest plot of studies investigating insulin levels (normalized mean difference ±95% CI) [30,31,32,33,34,36,37,38,39,40,41,42,43]. Effect size estimates were very heterogenous, likely owing to study design differences and differences in probiotic duration. (B): Funnel plot used to assess publication bias. These results suggest that the studies used in the meta-analysis had relatively low publication bias. (C): Baujat plot used to assess the studies that contributed most to heterogeneity. These results suggest that studies Shin et al. 2014 [38], Song et al. 2016 [39], and Wang et al. 2023 [40] likely had moderating variables that contributed the most to the heterogeneity.
3.8. Impact of Akk on Fasting Blood Glucose
Nine studies investigated the impact of Akk on fasting blood glucose levels. Detailed information on these assessment methods can be found in Table 7. The analysis revealed that Akk treatment significantly reduced fasting blood glucose levels by 21.2%, as shown by the lower mean level of 114.7 mg/dL in the treatment groups compared to 145.5 mg/dL in the control groups.

Table 7.
Descriptive characteristics of studies that assessed fasting blood glucose levels.
Normalized effect sizes varied across studies, with most studies showing positive effect sizes, suggesting that the treatment generally had a beneficial effect. Seven of nine studies showed that the effect was significant. The weighted mean effect size of 0.623 with a confidence interval of 0.12 to 0.28 indicates a statistically significant reduction in blood glucose levels due to Akk treatment. The forest plot also revealed a significant increase in blood insulin levels in animals administered Akk compared to controls (p < 0.001) as shown in Figure 7A. The analysis showed a pooled effect size of 0.20 (95% confidence interval: 0.12–0.28). There was significant variation in the study results (I2 = 52%). However, the analysis suggests a low risk of publication bias, indicating a fair representation of both positive and negative findings (Figure 7B). Three studies by Shin et al., Wang et al. and Wu et al. contributed the most to the observed heterogeneity (Figure 7C).
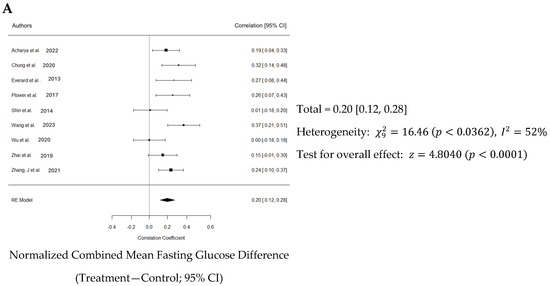
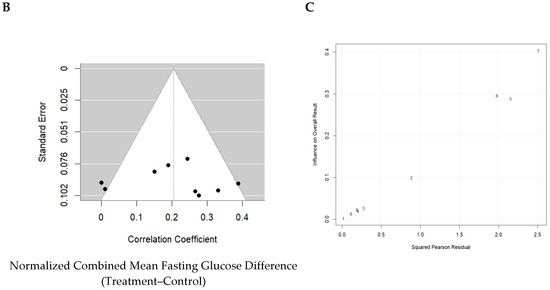
Figure 7.
Quantitative analysis of studies that assessed fasting blood glucose using a random-effects meta-analysis. (A): Forest plot of studies investigating fasting blood glucose (normalized mean difference ± 95% CI) [30,33,34,37,38,40,41,42,43]. Effect size estimates were heterogenous, likely owing to study design differences. (B): Funnel plot used to assess publication bias. These results suggest that the studies used in the meta-analysis had relatively low publication bias. (C): Baujat plot used to assess the studies that contributed most to heterogeneity. These results suggest that studies Shin et al. 2014 [38], Wang et al. 2023 [40], and Wu et al. 2020 [41] likely had moderating variables that contributed the most to the heterogeneity.
4. Discussion
This meta-analysis underscores the multifaceted benefits of Akk intake in mice subjected to a high-fat diet. Overall, dietary supplementation with Akk, as analyzed from nine selected studies, significantly reduced body weight by an average of 10.4%. The dosage of Akk ranged from 2 × 10⁸ to 5 × 10¹⁰ CFU/day, which aligns with the dosages commonly used in most probiotic animal studies. Most of the selected studies on Akk used dosages of 2 × 10⁸ and 1 × 10¹⁰ CFU. However, two studies by Wang et al. [40] and Zhang et al. [43] utilized a higher dose of 5 × 10¹⁰ CFU in mice. Interestingly, both studies showed that Akk had no effect on body weight, despite other studies with lower doses showing a beneficial effect in reducing body weight gain. These results suggest that there is no dose-dependent relationship of Akk in the prevention of body weight gain. The median duration of Akk treatment across the selected nine animal studies was 14 weeks, ranging from 6 to 20 weeks. The most prominent effects of Akk were observed during treatment durations of 6 to 12 weeks. The results suggest that Akk exerts its effect in reducing body weight gain during the early stages of obesity development (as early as 6 weeks), with the probiotic effect likely diminishing over time. For instance, Zhang’s study [43] extended Akk treatment to 20 weeks at higher dose, but showed no inhibiting effect on body weight gain. Obesity is a chronic disease that requires a long-term solution. The current animal studies were all of short duration (less than 20 weeks). Long-term studies are needed to verify Akk’s effect on obesity development.
The effect of Akk supplementation on the prevention of type 2 diabetes is reflected in its significant reduction of fasting blood glucose (by 21.2%) and improvement in glucose tolerance (by 22.1%), suggesting that Akk treatment is effective in preventing type 2 diabetes. Nine studies have measured fasting blood glucose. Except for two studies, all others showed a significant reduction in fasting blood glucose with Akk treatment. These two studies had a short treatment duration of 6 weeks, while the others were longer, suggesting that Akk may require more than 6 weeks to demonstrate a significant effect on blood glucose. No dose–response relationship was observed across the tested doses between 2 × 10⁸ and 5 × 10¹⁰ CFU/day in the nine studies. It was unclear if and how treatment duration affected the efficiency of the probiotic during administration. Additionally, a discrepancy emerged regarding the inclusion of antibiotics, which was the predominant method. In the study by Acharya et al., the administration of the antibiotic before the probiotic was actually more effective than administering the probiotic by itself [30]. Few authors provided clear justifications for the model choice and dosing parameters utilized in their studies.
Nine studies measured glucose tolerance. The meta-analysis showed that Akk significantly improved glucose tolerance in mice by reducing the 2 h AUC by 22.1%. However, there was substantial variation in the results across studies, as reflected by I2 = 73%. Indeed, six of nine studies showed modest but non-significant effects. The median duration of Akk treatment across studies was 12 weeks, ranging from 6 to 16 weeks. Shin et al. found that six weeks of Akk treatment significantly reduced DIO mice 2 h AUC by an estimated 27.3%. This mouse study of Akk treatment showed the most prominent effect among the studies with a normalized effect size of 0.856. Plovier et al. also investigated six weeks of Akk treatment on mouse glucose tolerance but with a lower dose (2 × 10⁸ CFU/d versus 1 × 10¹⁰ CFU/d in Shin’s study) and found no significant effect. The other two studies with significant effects by Akk treatment also used doses at or above 1 × 10¹⁰ CFU/d, suggesting that the Akk treatment dose may need to be no less than 1 × 10¹⁰ CFU/d to be effective. It should be noted that one study by Wang et al. used a model of FFAR4 knockout mice, which has been shown to cause severely impaired glucose tolerance under high-fat feeding conditions. FFAR4 regulates glucagon-like peptide 1 secretion by modifying Akk abundance. However, our meta-analysis showed that Akk treatment at 5 × 10¹⁰ CFU/d for 12 weeks in Wang’s study did not significantly improve glucose tolerance. There was substantial heterogeneity among the studies. The studies differed in terms of doses, duration, sample size, and other factors, which could significantly influence the results. Further research is needed to confirm the consistency and magnitude of the effect of Akk on glucose tolerance. Overall, fasting blood glucose decreased by 21.2%, whilst blood insulin increased by 26.9% when comparing control to treatment groups likely because insulin and blood glucose are inversely correlated.
Thirteen studies investigated the effect of Akk treatment on blood insulin levels in animals. The meta-analysis revealed a significant increase in blood insulin levels, from 1.9 to 2.6 µg/mL. Notably, three studies—Zhang et al. [43], Chung et al. [33], and Zhai et al. [42]—demonstrated strong treatment effects, with effect sizes of 1.64, 1.44, and 1.17, respectively. Interestingly, all three studies also reported significant reductions in fasting blood glucose levels. Additionally, some studies explored the anti-inflammatory efficacy of Akk; however, due to the heterogeneity of inflammation biomarkers across blood and tissue, a meta-analysis on the anti-inflammatory effects was not feasible.
One of the primary objectives of this meta-analysis was to identify the variables that contribute to the efficacy of Akk, such as changes in body weight and treatment duration. Surprisingly, the random-effects meta-regression model is not able to determine these expected variables. A random-effects model was selected for meta-regression because of the aforementioned variables in study design, such as probiotic duration, infusion parameters (including temperature, rate volume), and overall methodological quality. Notably, treatment duration which has been a critical determinant of efficacy in previous studies (both preclinical and clinical), did not emerge as a significant factor in our analysis [20,28]. This discrepancy might be due to the limited exploration of treatment durations in the analyzed studies. Only one study specifically investigated the impact of different treatment durations, reporting no significant effect of the probiotic beyond 14 weeks [18].
There are several limitations leading to inclusive results in our meta-regression models. First, the limited number of studies assessing fasting blood glucose levels restricted our ability to conduct a comprehensive meta-regression due to constraints in degrees of freedom [45]. Second, the presence of substantial variability among studies can compromise the power of meta-regression. Our analysis revealed significant variation between studies, as indicated by heterogeneity statistics in our primary endpoints model. This could be due to factors such as system errors among different laboratories, such as experiment duration, sample preparation, and administration parameters of Akk. Third, the animal models used (age, sex, and species) were inconsistent. This significant methodological and model variability among the studies made it challenging to identify clear cause-and-effect relationships. Fourth, most studies employed young, male C57BL/6J mice. Only two studies included female mice, but neither considered biological sex as a variable parameter or specified the number of females per group. Consequently, the potential effects of Akk on female animals remain unclear. Moreover, the inconclusive results regarding microbiota suggest that Akk’s influence on gut microbiota might be more critical than its direct metabolic effects on parameters such as blood glucose levels. On the other hand, the current data make it difficult to definitively determine the key factors influencing treatment outcomes.
5. Conclusions
Given the increasing prevalence of metabolic morbidities such as type 2 diabetes and diet-induced obesity, this meta-analysis aimed to evaluate the potential of Akk as a novel therapeutic intervention in animal models. Our findings strongly suggest that Akk is a promising candidate for mitigating these metabolic diseases, demonstrating efficacy in preventing body weight gain and type 2 diabetes. To further elucidate the clinical implications of these findings, future studies should incorporate a broader range of experimental parameters. Factors such as age, sex, and treatment duration may influence treatment outcomes [27,45]. Additionally, comprehensive, long-term outcome assessments are essential for a more complete understanding of Akk’s effects on body weight and type 2 diabetes. Therefore, we recommend conducting large-scale animal model validation studies to determine the reliability and generalizability of our meta-analysis findings. These future studies should address the limitations identified in the current literature and contribute to a more comprehensive understanding of the clinical potential of Akk.
Author Contributions
Conceptualization, E.L., X.J. and K.Z.; Data curation, E.L.; Formal analysis, E.L. and K.Z.; Investigation, E.L. and K.Z.; Methodology, E.L., X.J. and K.Z.; Project administration, K.Z.; Resources, K.Z.; Software, E.L.; Supervision, K.Z.; Validation, E.L. and K.Z.; Visualization, K.Z.; Writing—original draft, E.L. and K.Z.; Writing—review and editing, E.L., X.J. and K.Z. All authors have read and agreed to the published version of the manuscript.
Funding
This research received no external funding.
Institutional Review Board Statement
Not applicable.
Informed Consent Statement
Not applicable.
Data Availability Statement
The original contributions presented in this study are included in the article, further inquiries can be directed to the corresponding author.
Conflicts of Interest
The authors declare no conflicts of interest. The funders had no role in the design of this study; in the collection, analyses, or interpretation of data; in the writing of the manuscript; or in the decision to publish the results.
References
- Bhupathiraju, S.N.; Hu, F.B. Epidemiology of Obesity and Diabetes and Their Cardiovascular Complications. Circ. Res. 2016, 118, 1723–1735. [Google Scholar] [CrossRef] [PubMed]
- Xu, Y.; Wang, N.; Tan, H.Y.; Li, S.; Zhang, C.; Feng, Y. Function of Akkermansia muciniphila in Obesity: Interactions With Lipid Metabolism, Immune Response and Gut Systems. Front. Microbiol. 2020, 11, 219. [Google Scholar] [CrossRef] [PubMed]
- Dao, M.C.; Everard, A.; Aron-Wisnewsky, J.; Sokolovska, N.; Prifti, E.; Verger, E.O.; Kayser, B.D.; Levenez, F.; Chilloux, J.; Hoyles, L.; et al. Akkermansia muciniphila and Improved Metabolic Health During a Dietary Intervention in Obesity: Relationship with Gut Microbiome Richness and Ecology. Gut 2016, 65, 426–436. [Google Scholar] [CrossRef] [PubMed]
- Arslanian, S.; Bacha, F.; Grey, M.; Marcus, M.D.; White, N.H.; Zeitler, P. Evaluation and Management of Youth-Onset Type 2 Diabetes: A Position Statement by the American Diabetes Association. Diabetes Care 2018, 41, 2648–2668. [Google Scholar] [CrossRef] [PubMed]
- Harsch, I.A.; Konturek, P.C. The Role of Gut Microbiota in Obesity and Type 2 and Type 1 Diabetes Mellitus: New Insights into “Old” Diseases. Med. Sci. 2018, 6, 32. [Google Scholar] [CrossRef]
- Bastos, R.M.C.; Simplício-Filho, A.; Sávio-Silva, C.; Oliveira, L.F.V.; Cruz, G.N.F.; Sousa, E.H.; Noronha, I.L.; Mangueira, C.L.P.; Quaglierini-Ribeiro, H.; Josefi-Rocha, G.R.; et al. Fecal Microbiota Transplant in a Pre-Clinical Model of Type 2 Diabetes Mellitus, Obesity and Diabetic Kidney Disease. Int. J. Mol. Sci. 2022, 23, 3842. [Google Scholar] [CrossRef]
- Dalby, M.J. Questioning the Foundations of the Gut Microbiota and Obesity. Philos. Trans. R. Soc. Lond. B Biol. Sci. 2023, 378, 20220221. [Google Scholar] [CrossRef]
- Liu, B.N.; Liu, X.T.; Liang, Z.H.; Wang, J.H. Gut Microbiota in Obesity. World J. Gastroenterol. 2021, 27, 3837–3850. [Google Scholar] [CrossRef]
- Crovesy, L.; Masterson, D.; Rosado, E.L. Profile of the Gut Microbiota of Adults With Obesity: A Systematic Review. Eur. J. Clin. Nutr. 2020, 74, 1251–1262. [Google Scholar] [CrossRef]
- Malesza, I.J.; Malesza, M.; Walkowiak, J.; Mussin, N.; Walkowiak, D.; Aringazina, R.; Bartkowiak-Wieczorek, J.; Mądry, E. High-Fat, Western-Style Diet, Systemic Inflammation, and Gut Microbiota: A Narrative Review. Cells 2021, 10, 3164. [Google Scholar] [CrossRef]
- Al Bander, Z.; Nitert, M.D.; Mousa, A.; Naderpoor, N. The Gut Microbiota and Inflammation: An Overview. Int. J. Environ. Res. Public Health 2020, 17, 7618. [Google Scholar] [CrossRef] [PubMed]
- Li, J.; Yang, G.; Zhang, Q.; Liu, Z.; Jiang, X.; Xin, Y. Function of Akkermansia muciniphila in Type 2 Diabetes and Related Diseases. Front. Microbiol. 2023, 14, 1172400. [Google Scholar] [CrossRef] [PubMed]
- Karamzin, A.M.; Ropot, A.V.; Sergeyev, O.V.; Sechenov, E.O.K. Akkermansia muciniphila and Host Interaction Within the Intestinal Tract. Anaerobe 2021, 72, 102472. [Google Scholar] [CrossRef] [PubMed]
- Aron, R.A.C.; Abid, A.; Vesa, C.M.; Nechifor, A.C.; Behl, T.; Ghitea, T.C.; Munteanu, M.A.; Fratila, O.; Andronie-Cioara, F.L.; Toma, M.M.; et al. Recognizing the Benefits of Pre-/Probiotics in Metabolic Syndrome and Type 2 Diabetes Mellitus Considering the Influence of Akkermansia muciniphila as a Key Gut Bacterium. Microorganisms 2021, 9, 618. [Google Scholar] [CrossRef] [PubMed]
- Si, J.; Kang, H.; You, H.J.; Ko, G. Revisiting the Role of Akkermansia muciniphila as a Therapeutic Bacterium. Gut Microbes 2022, 14, 2078619. [Google Scholar] [CrossRef]
- Sanna, S.; van Zuydam, N.R.; Mahajan, A.; Kurilshikov, A.; Vich Vila, A.; Võsa, U.; Mujagic, Z.; Masclee, A.A.M.; Jonkers, D.; Oosting, M.; et al. Causal Relationships Among the Gut Microbiome, Short-chain Fatty Acids and Metabolic Diseases. Nat. Genet. 2019, 51, 600–605. [Google Scholar] [CrossRef]
- Ley, R.E.; Turnbaugh, P.J.; Klein, S.; Gordon, J.I. Microbial Ecology: Human Gut Microbes Associated With Obesity. Nature 2006, 444, 1022–1023. [Google Scholar] [CrossRef]
- Page, M.J.; McKenzie, J.E.; Bossuyt, P.M.; Boutron, I.; Hoffmann, T.C.; Mulrow, C.D.; Shamseer, L.; Tetzlaff, J.M.; Akl, E.A.; Brennan, S.E.; et al. The PRISMA 2020 Statement: An Updated Guideline for Reporting Systematic Reviews. BMJ 2021, 372, n71. [Google Scholar] [CrossRef]
- Cao, T.T.B.; Wu, K.C.; Hsu, J.L.; Chang, C.S.; Chou, C.; Lin, C.Y.; Liao, Y.M.; Lin, P.C.; Yang, L.Y.; Lin, H.W. Effects of Non-insulin Anti-hyperglycemic Agents on Gut Microbiota: A Systematic Review on Human and Animal Studies. Front. Endocrinol. 2020, 11, 573891. [Google Scholar] [CrossRef]
- Mikolajewicz, N.; Komarova, S.V. Meta-Analytic Methodology for Basic Research: A Practical Guide. Front. Physiol. 2019, 10, 203. [Google Scholar] [CrossRef]
- Higgins, J.P.; Thompson, S.G. Quantifying Heterogeneity in a Meta-analysis. Stat. Med. 2002, 21, 1539–1558. [Google Scholar] [CrossRef] [PubMed]
- Begg, C.B.; Mazumdar, M. Operating Characteristics of a Rank Correlation Test for Publication Bias. Biometrics 1994, 50, 1088–1101. [Google Scholar] [CrossRef]
- Egger, M.; Davey Smith, G.; Schneider, M.; Minder, C. Bias in Meta-analysis Detected by a Simple, Graphical Test. BMJ 1997, 315, 629–634. [Google Scholar] [CrossRef] [PubMed]
- Viechtbauer, W.; López-López, J.A.; Sánchez-Meca, J.; Marín-Martínez, F. A Comparison of Procedures to Test for Moderators in Mixed-effects Meta-regression Models. Psychol. Methods 2015, 20, 360–374. [Google Scholar] [CrossRef]
- McCann, S.K.; Lawrence, C.B. Comorbidity and Age in the Modelling of Stroke: Are We Still Failing to Consider the Characteristics of Stroke Patients? BMJ Open Sci. 2020, 4, e100013. [Google Scholar] [CrossRef]
- Ottman, N.; Reunanen, J.; Meijerink, M.; Pietilä, T.E.; Kainulainen, V.; Klievink, J.; Huuskonen, L.; Aalvink, S.; Skurnik, M.; Boeren, S.; et al. Pili-like Proteins of Akkermansia muciniphila Modulate Host Immune Responses and Gut Barrier Function. PLoS ONE 2017, 12, e0173004. [Google Scholar] [CrossRef]
- Meldrum, D.R.; Morris, M.A.; Gambone, J.C. Obesity Pandemic: Causes, Consequences, and Solutions-but Do we Have the Will? Fertil. Steril. 2017, 107, 833–839. [Google Scholar] [CrossRef]
- DerSimonian, R.; Laird, N. Meta-analysis in Clinical Trials. Control Clin. Trials 1986, 7, 177–188. [Google Scholar] [CrossRef]
- Liddle, L.J.; Ralhan, S.; Ward, D.L.; Colbourne, F. Translational Intracerebral Hemorrhage Research: Has Current Neuroprotection Research ARRIVEd at a Standard for Experimental Design and Reporting? Transl. Stroke Res. 2020, 11, 1203–1213. [Google Scholar] [CrossRef]
- Acharya, K.D.; Friedline, R.H.; Ward, D.V.; Graham, M.E.; Tauer, L.; Zheng, D.; Hu, X.; de Vos, W.M.; McCormick, B.A.; Kim, J.K.; et al. Differential Effects of Akkermansia-enriched Fecal Microbiota Transplant on Energy Balance in Female Mice on High-fat Diet. Front. Endocrinol. 2022, 13, 1010806. [Google Scholar] [CrossRef]
- Anhê, F.F.; Roy, D.; Pilon, G.; Dudonné, S.; Matamoros, S.; Varin, T.V.; Garofalo, C.; Moine, Q.; Desjardins, Y.; Levy, E.; et al. A Polyphenol-rich Cranberry Extract Protects From Diet-induced Obesity, Insulin Resistance and Intestinal Inflammation in Association With Increased Akkermansia spp. Population in the Gut Microbiota of Mice. Gut 2015, 64, 872–883. [Google Scholar] [CrossRef] [PubMed]
- Chelakkot, C.; Choi, Y.; Kim, D.K.; Park, H.T.; Ghim, J.; Kwon, Y.; Jeon, J.; Kim, M.S.; Jee, Y.K.; Gho, Y.S.; et al. Akkermansia muciniphila-derived Extracellular Vesicles Influence Gut Permeability Through the Regulation of Tight Junctions. Exp. Mol. Med. 2018, 50, e450. [Google Scholar] [CrossRef] [PubMed]
- Chung, E.; Elmassry, M.M.; Kottapalli, P.; Kottapalli, K.R.; Kaur, G.; Dufour, J.M.; Wright, K.; Ramalingam, L.; Moustaid-Moussa, N.; Wang, R.; et al. Metabolic Benefits of Annatto-extracted Tocotrienol on Glucose Homeostasis, Inflammation, and Gut Microbiome. Nutr. Res. 2020, 77, 97–107. [Google Scholar] [CrossRef]
- Everard, A.; Belzer, C.; Geurts, L.; Ouwerkerk, J.P.; Druart, C.; Bindels, L.B.; Guiot, Y.; Derrien, M.; Muccioli, G.G.; Delzenne, N.M.; et al. Cross-talk Between Akkermansia muciniphila and Intestinal Epithelium Controls Diet-induced Obesity. Proc. Natl. Acad. Sci. USA 2013, 110, 9066–9071. [Google Scholar] [CrossRef] [PubMed]
- Hänninen, A.; Toivonen, R.; Pöysti, S.; Belzer, C.; Plovier, H.; Ouwerkerk, J.P.; Emani, R.; Cani, P.D.; De Vos, W.M. Akkermansia muciniphila Induces Gut Microbiota Remodelling and Controls Islet Autoimmunity in NOD Mice. Gut 2018, 67, 1445–1453. [Google Scholar] [CrossRef] [PubMed]
- Okamura, T.; Hamaguchi, M.; Nakajima, H.; Kitagawa, N.; Majima, S.; Senmaru, T.; Okada, H.; Ushigome, E.; Nakanishi, N.; Sasano, R.; et al. Milk Protects Against Sarcopenic Obesity Due to Increase in the Genus Akkermansia in Faeces of db/db Mice. J. Cachexia Sarcopenia Muscle 2023, 14, 1395–1409. [Google Scholar] [CrossRef]
- Plovier, H.; Everard, A.; Druart, C.; Depommier, C.; Van Hul, M.; Geurts, L.; Chilloux, J.; Ottman, N.; Duparc, T.; Lichtenstein, L.; et al. A Purified Membrane Protein From Akkermansia muciniphila or the Pasteurized Bacterium Improves Metabolism in Obese and Diabetic Mice. Nat. Med. 2017, 23, 107–113. [Google Scholar] [CrossRef]
- Shin, N.R.; Lee, J.C.; Lee, H.Y.; Kim, M.S.; Whon, T.W.; Lee, M.S.; Bae, J.W. An Increase in the Akkermansia spp. Population Induced by Metformin Treatment Improves Glucose Homeostasis in Diet-induced Obese Mice. Gut 2014, 63, 727–735. [Google Scholar] [CrossRef]
- Song, H.Z.; Chu, Q.; Yan, F.J.; Yang, Y.Y.; Han, W.; Zheng, X.D. Red Pitaya Betacyanins Protects From Diet-induced Obesity, Liver Steatosis and Insulin Resistance in Association With Modulation of Gut Microbiota in Mice. J. Gastroenterol. Hepatol. 2016, 31, 1462–1469. [Google Scholar] [CrossRef]
- Wang, Z.; Cui, S.; Zhang, T.; Wang, W.; Li, J.; Chen, Y.Q.; Zhu, S.L. Akkermansia muciniphila Supplementation Improves Glucose Tolerance in Intestinal Ffar4 Knockout Mice During the Daily Light to Dark Transition. mSystems 2023, 8, e00573-23. [Google Scholar] [CrossRef]
- Wu, F.; Guo, X.; Zhang, M.; Ou, Z.; Wu, D.; Deng, L.; Lu, Z.; Zhang, J.; Deng, G.; Chen, S.; et al. An Akkermansia muciniphila Subtype Alleviates High-fat Diet-induced Metabolic Disorders and Inhibits the Neurodegenerative Process in Mice. Anaerobe 2020, 61, 102138. [Google Scholar] [CrossRef] [PubMed]
- Zhai, R.; Xue, X.; Zhang, L.; Yang, X.; Zhao, L.; Zhang, C. Strain-specific Anti-inflammatory Properties of Two Akkermansia muciniphila Strains on Chronic Colitis in Mice. Front. Cell. Infect. Microbiol. 2019, 9, 239. [Google Scholar] [CrossRef] [PubMed]
- Zhang, J.; Ni, Y.; Qian, L.; Fang, Q.; Zheng, T.; Zhang, M.; Gao, Q.; Zhang, Y.; Ni, J.; Hou, X.; et al. Decreased Abundance of Akkermansia muciniphila Leads to the Impairment of Insulin Secretion and Glucose Homeostasis in Lean Type 2 Diabetes. Adv. Sci. 2021, 8, e2100536. [Google Scholar] [CrossRef] [PubMed]
- Zhang, L.; Qin, Q.Q.; Liu, M.N.; Zhang, X.L.; He, F.; Wang, G.Q. Akkermansia muciniphila can Reduce the Damage of Gluco/lipotoxicity, Oxidative Stress and Inflammation, and Normalize Intestine Microbiota in Streptozotocin-induced Diabetic Rats. Pathog. Dis. 2018, 76, fty028. [Google Scholar] [CrossRef]
- Langan, D.; Higgins, J.P.; Gregory, W.; Sutton, A.J. Graphical Augmentations to the Funnel Plot Assess the Impact of Additional Evidence on a Meta-analysis. J. Clin. Epidemiol. 2012, 65, 511–519. [Google Scholar] [CrossRef]
Disclaimer/Publisher’s Note: The statements, opinions and data contained in all publications are solely those of the individual author(s) and contributor(s) and not of MDPI and/or the editor(s). MDPI and/or the editor(s) disclaim responsibility for any injury to people or property resulting from any ideas, methods, instructions or products referred to in the content. |
© 2024 by the authors. Licensee MDPI, Basel, Switzerland. This article is an open access article distributed under the terms and conditions of the Creative Commons Attribution (CC BY) license (https://creativecommons.org/licenses/by/4.0/).