
A Five-Week Periodized Carbohydrate Diet Does Not Improve Maximal Lactate Steady-State Exercise Capacity and Substrate Oxidation in Well-Trained Cyclists compared to a High-Carbohydrate Diet
 , , ,
, , ,  ,
, 
Abstract
1. Introduction
2. Materials and Methods
2.1. Participants
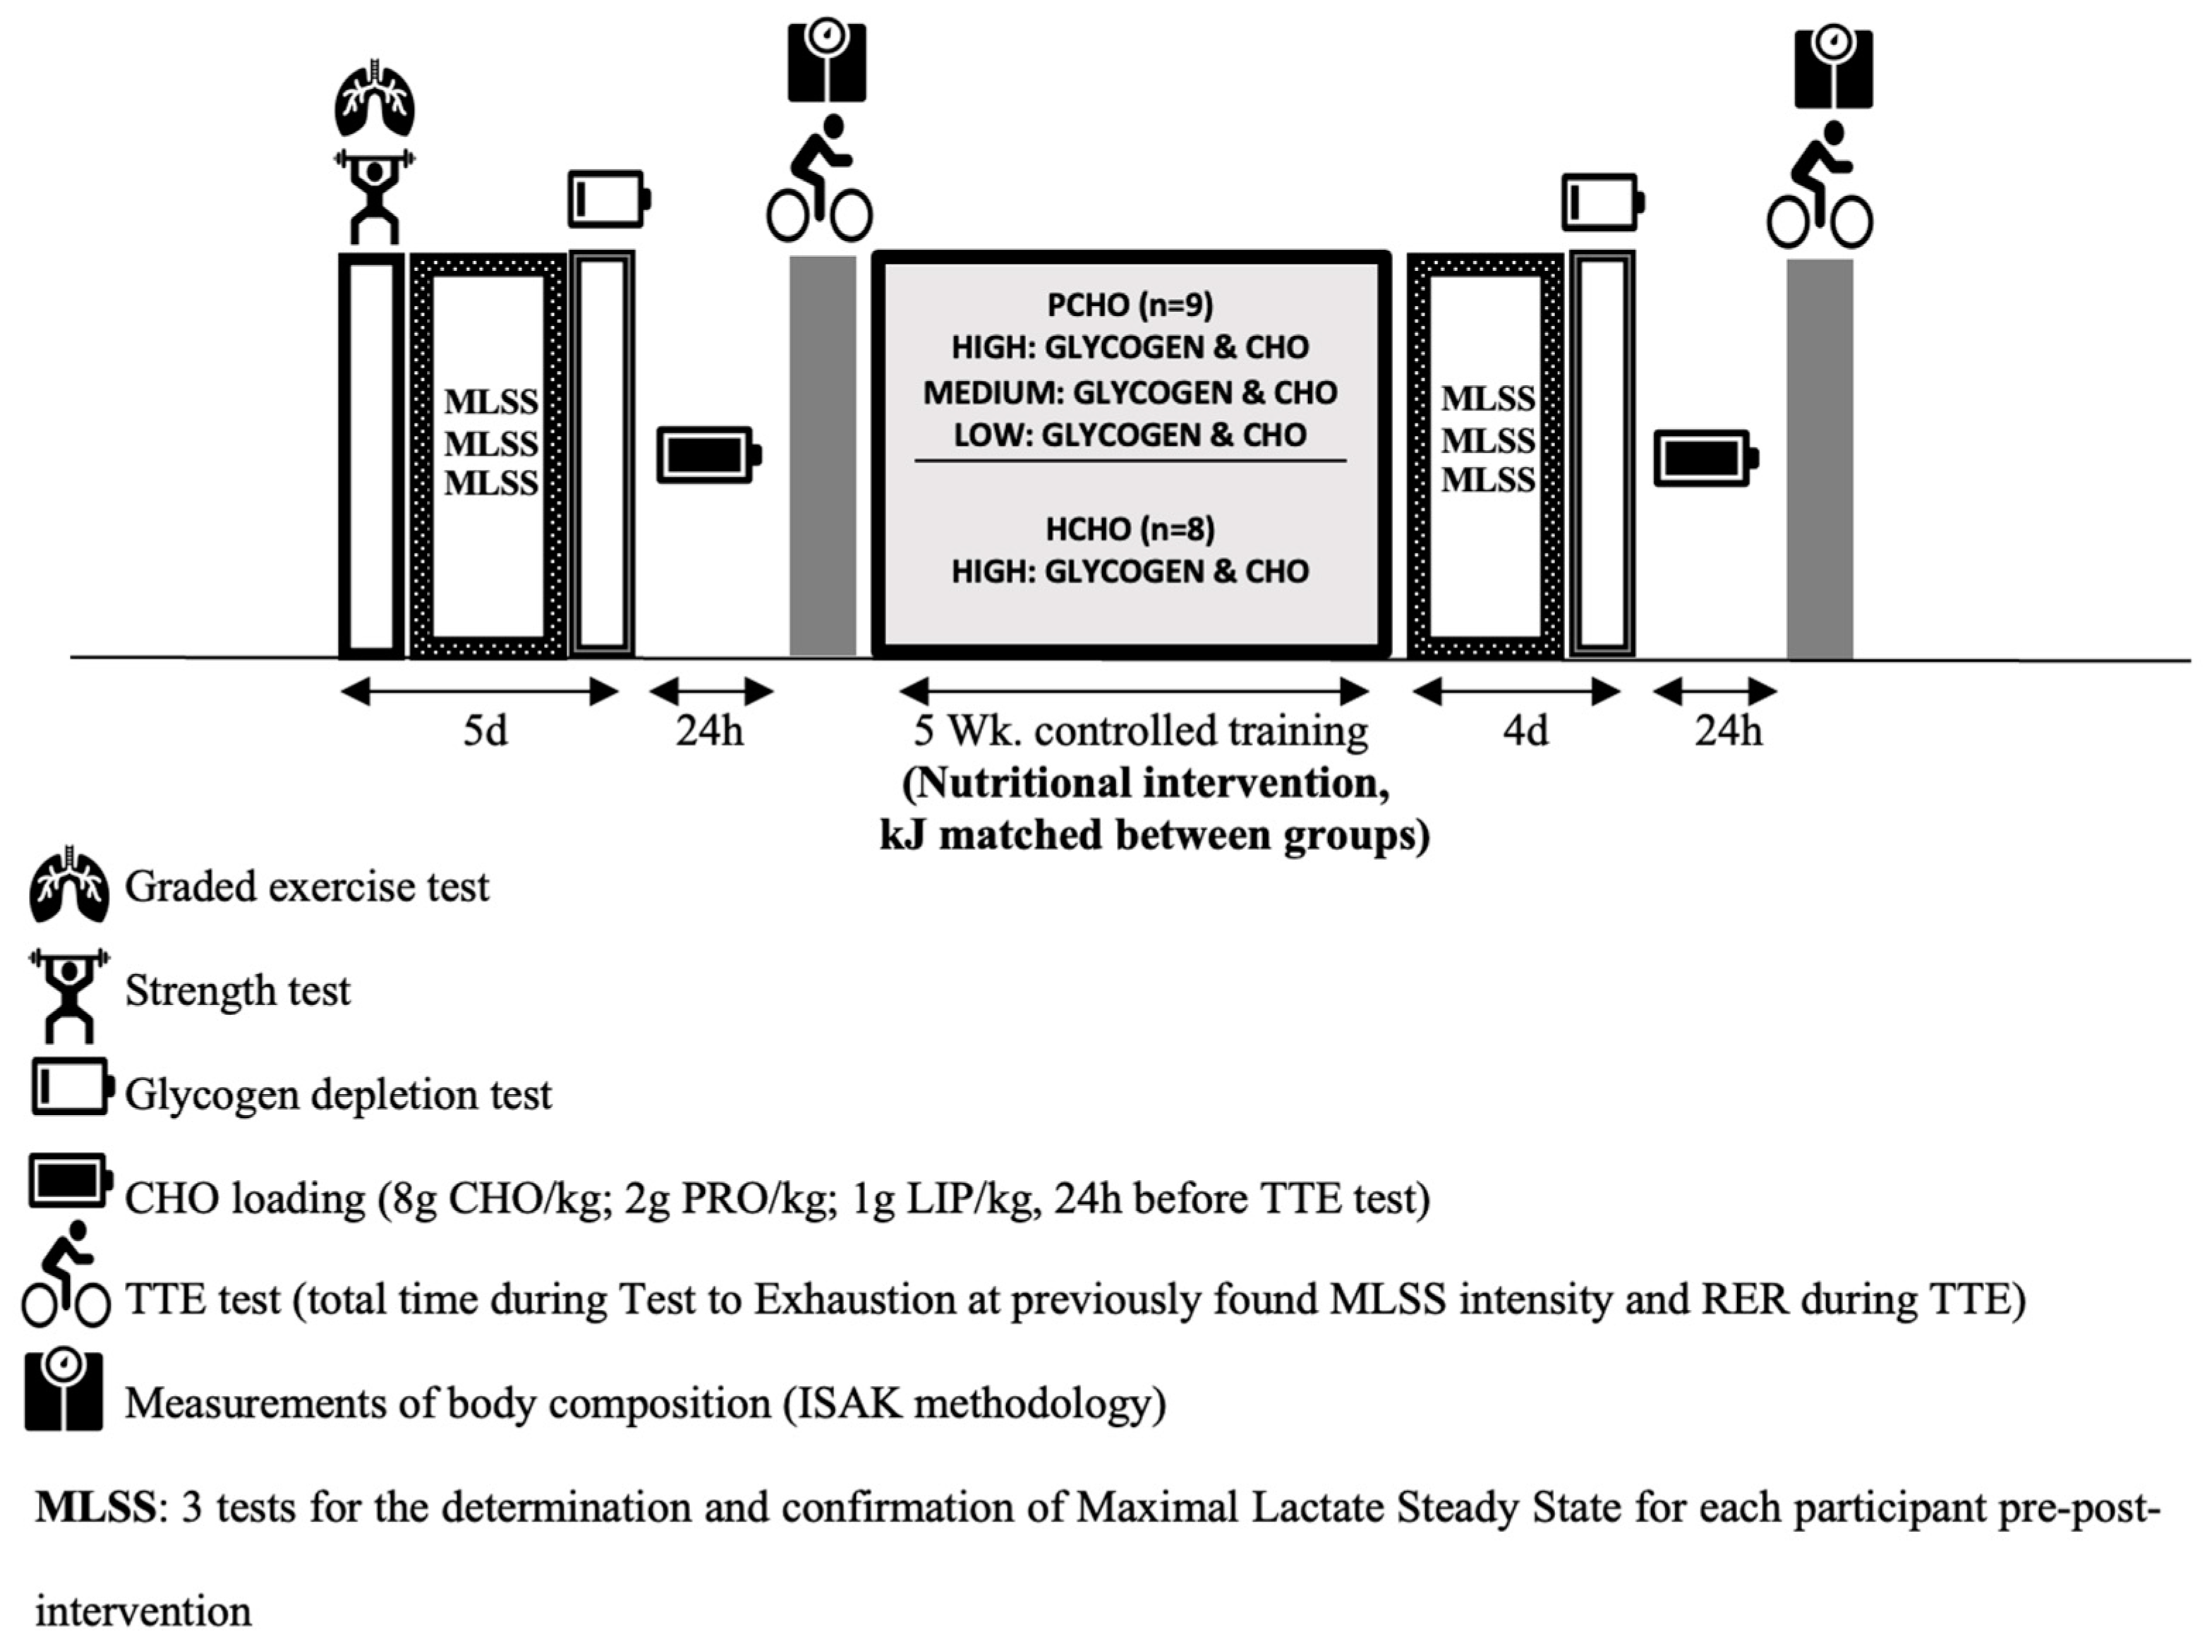
2.2. Study Design
2.3. Preliminary Tests
2.4. Pre–Post-Nutritional and Training Intervention Tests
2.5. Time-to-Exhaustion Exercise (TTE)
2.6. Intervention
2.6.1. Training Protocol
2.6.2. Nutritional Protocol
2.7. Statistical Analysis
3. Results
3.1. Nutritional Prescription
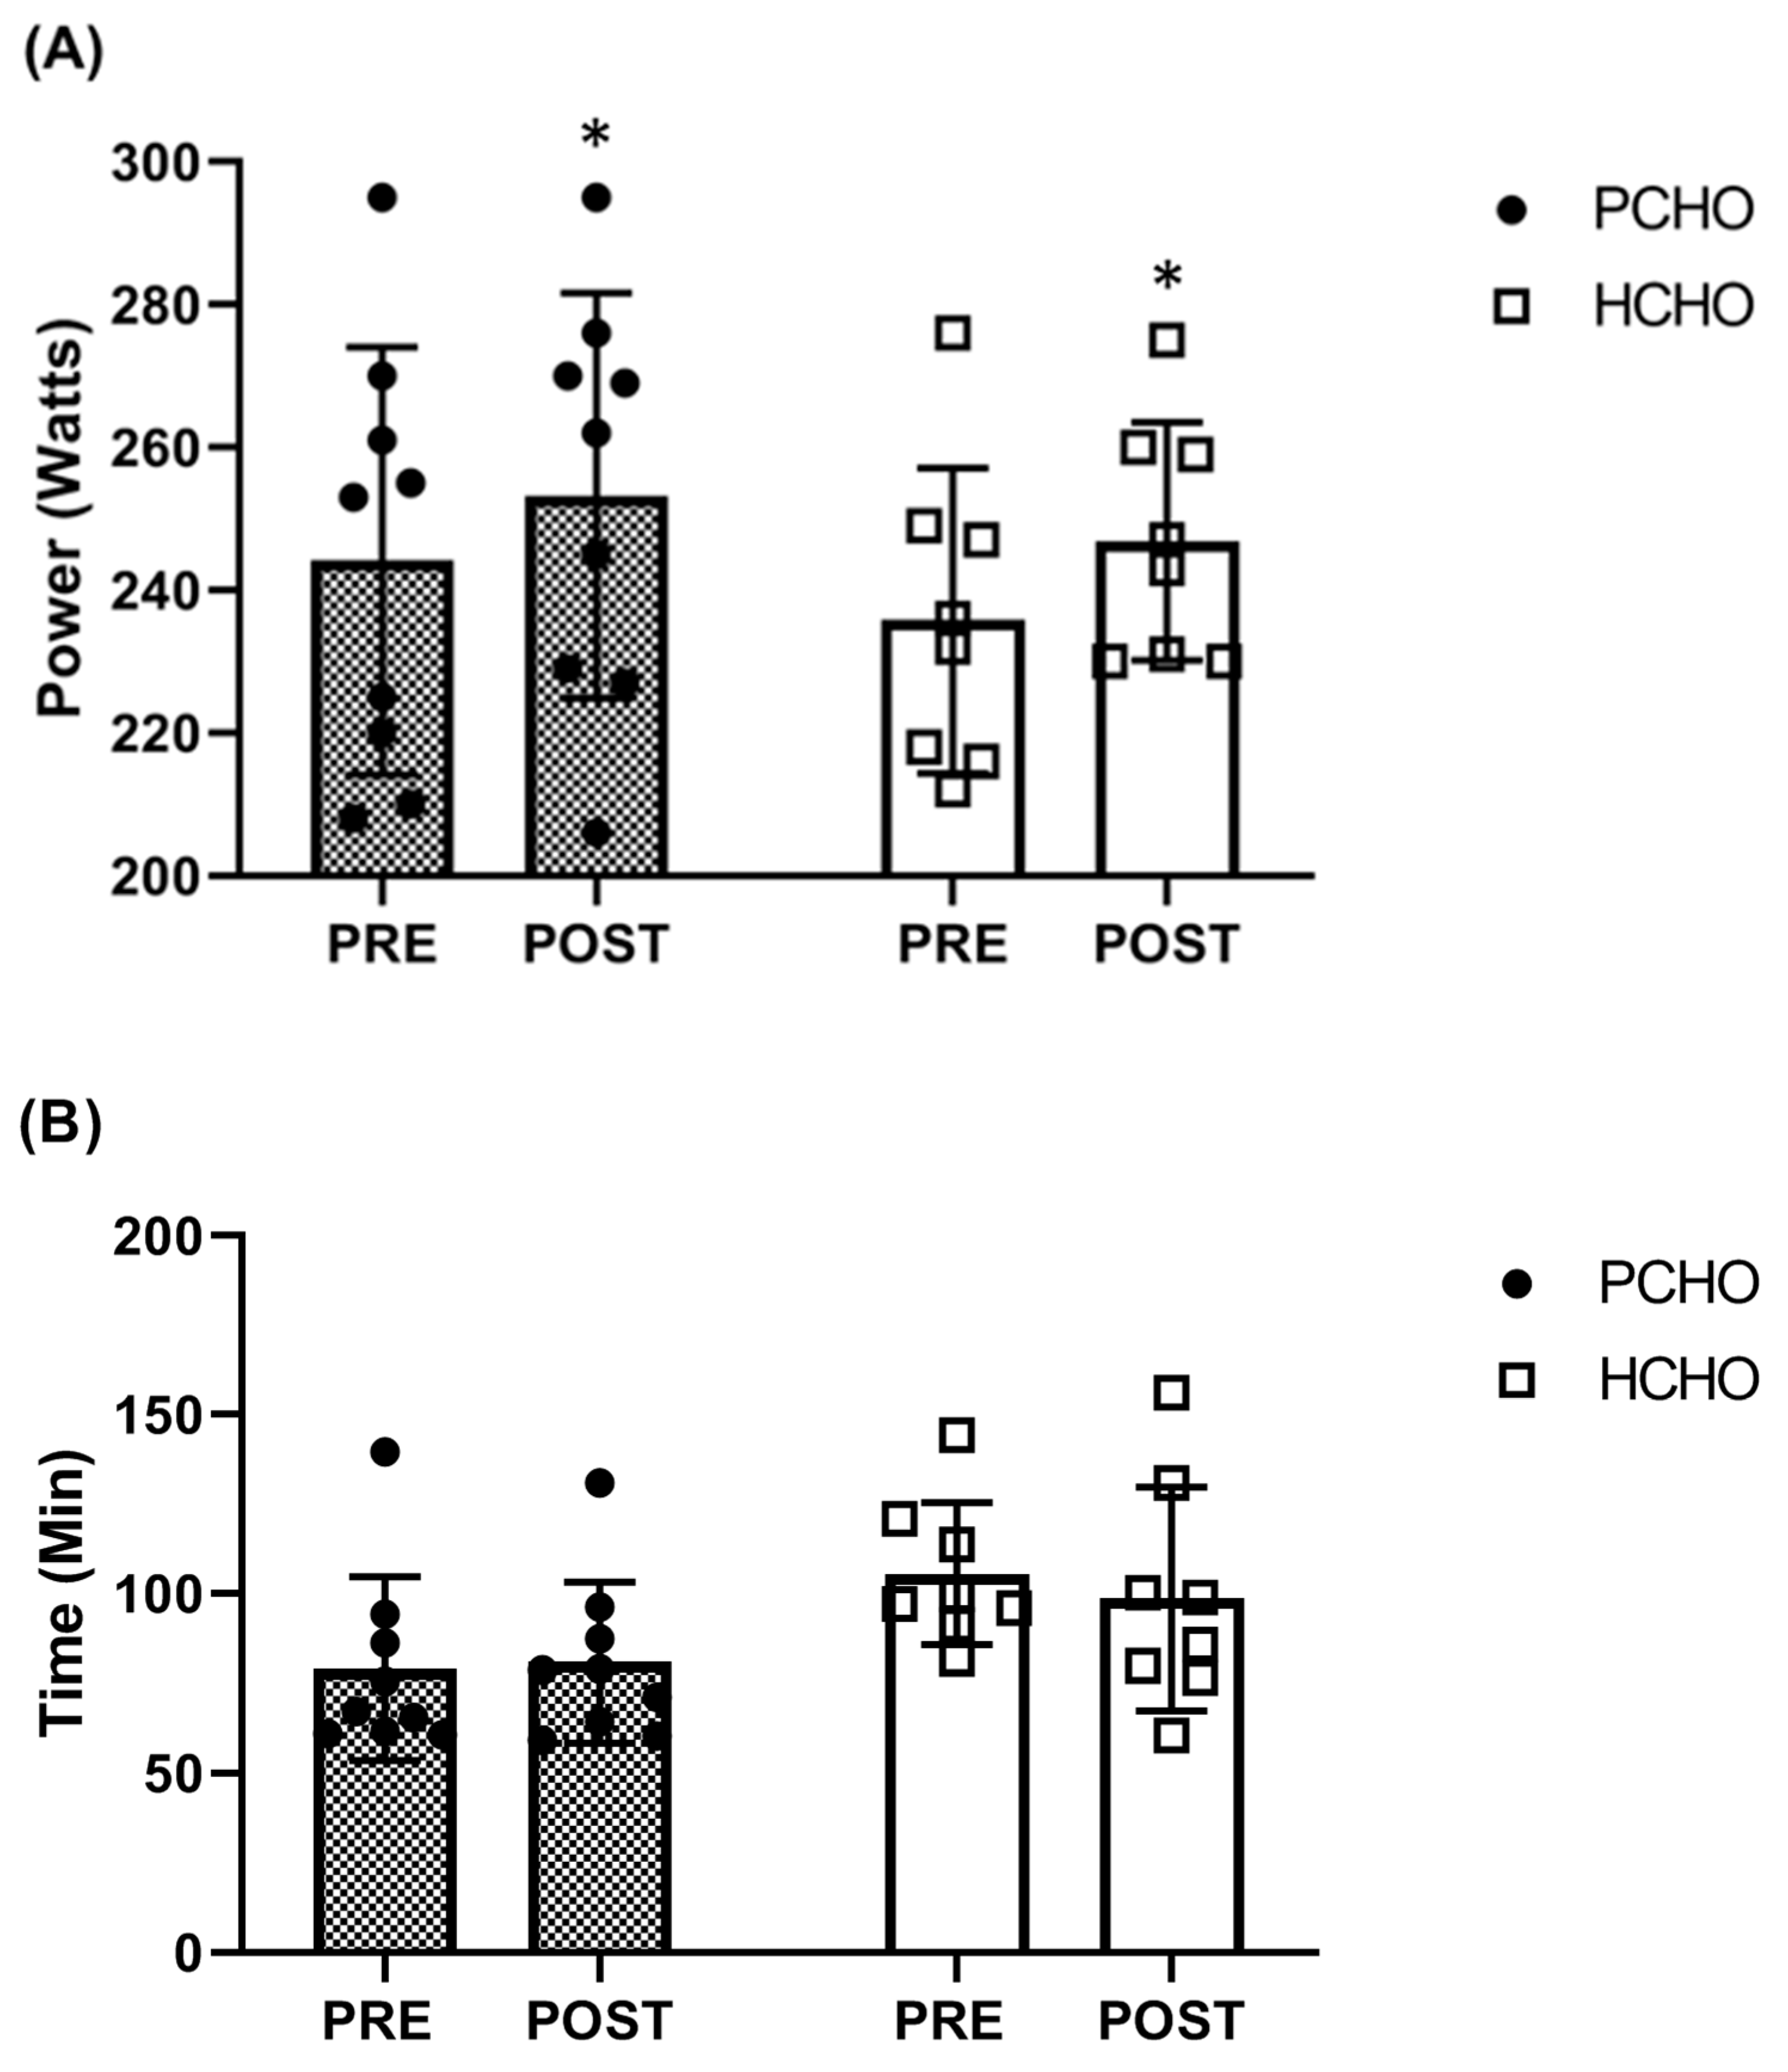
3.2. Pre–Post-MLSS
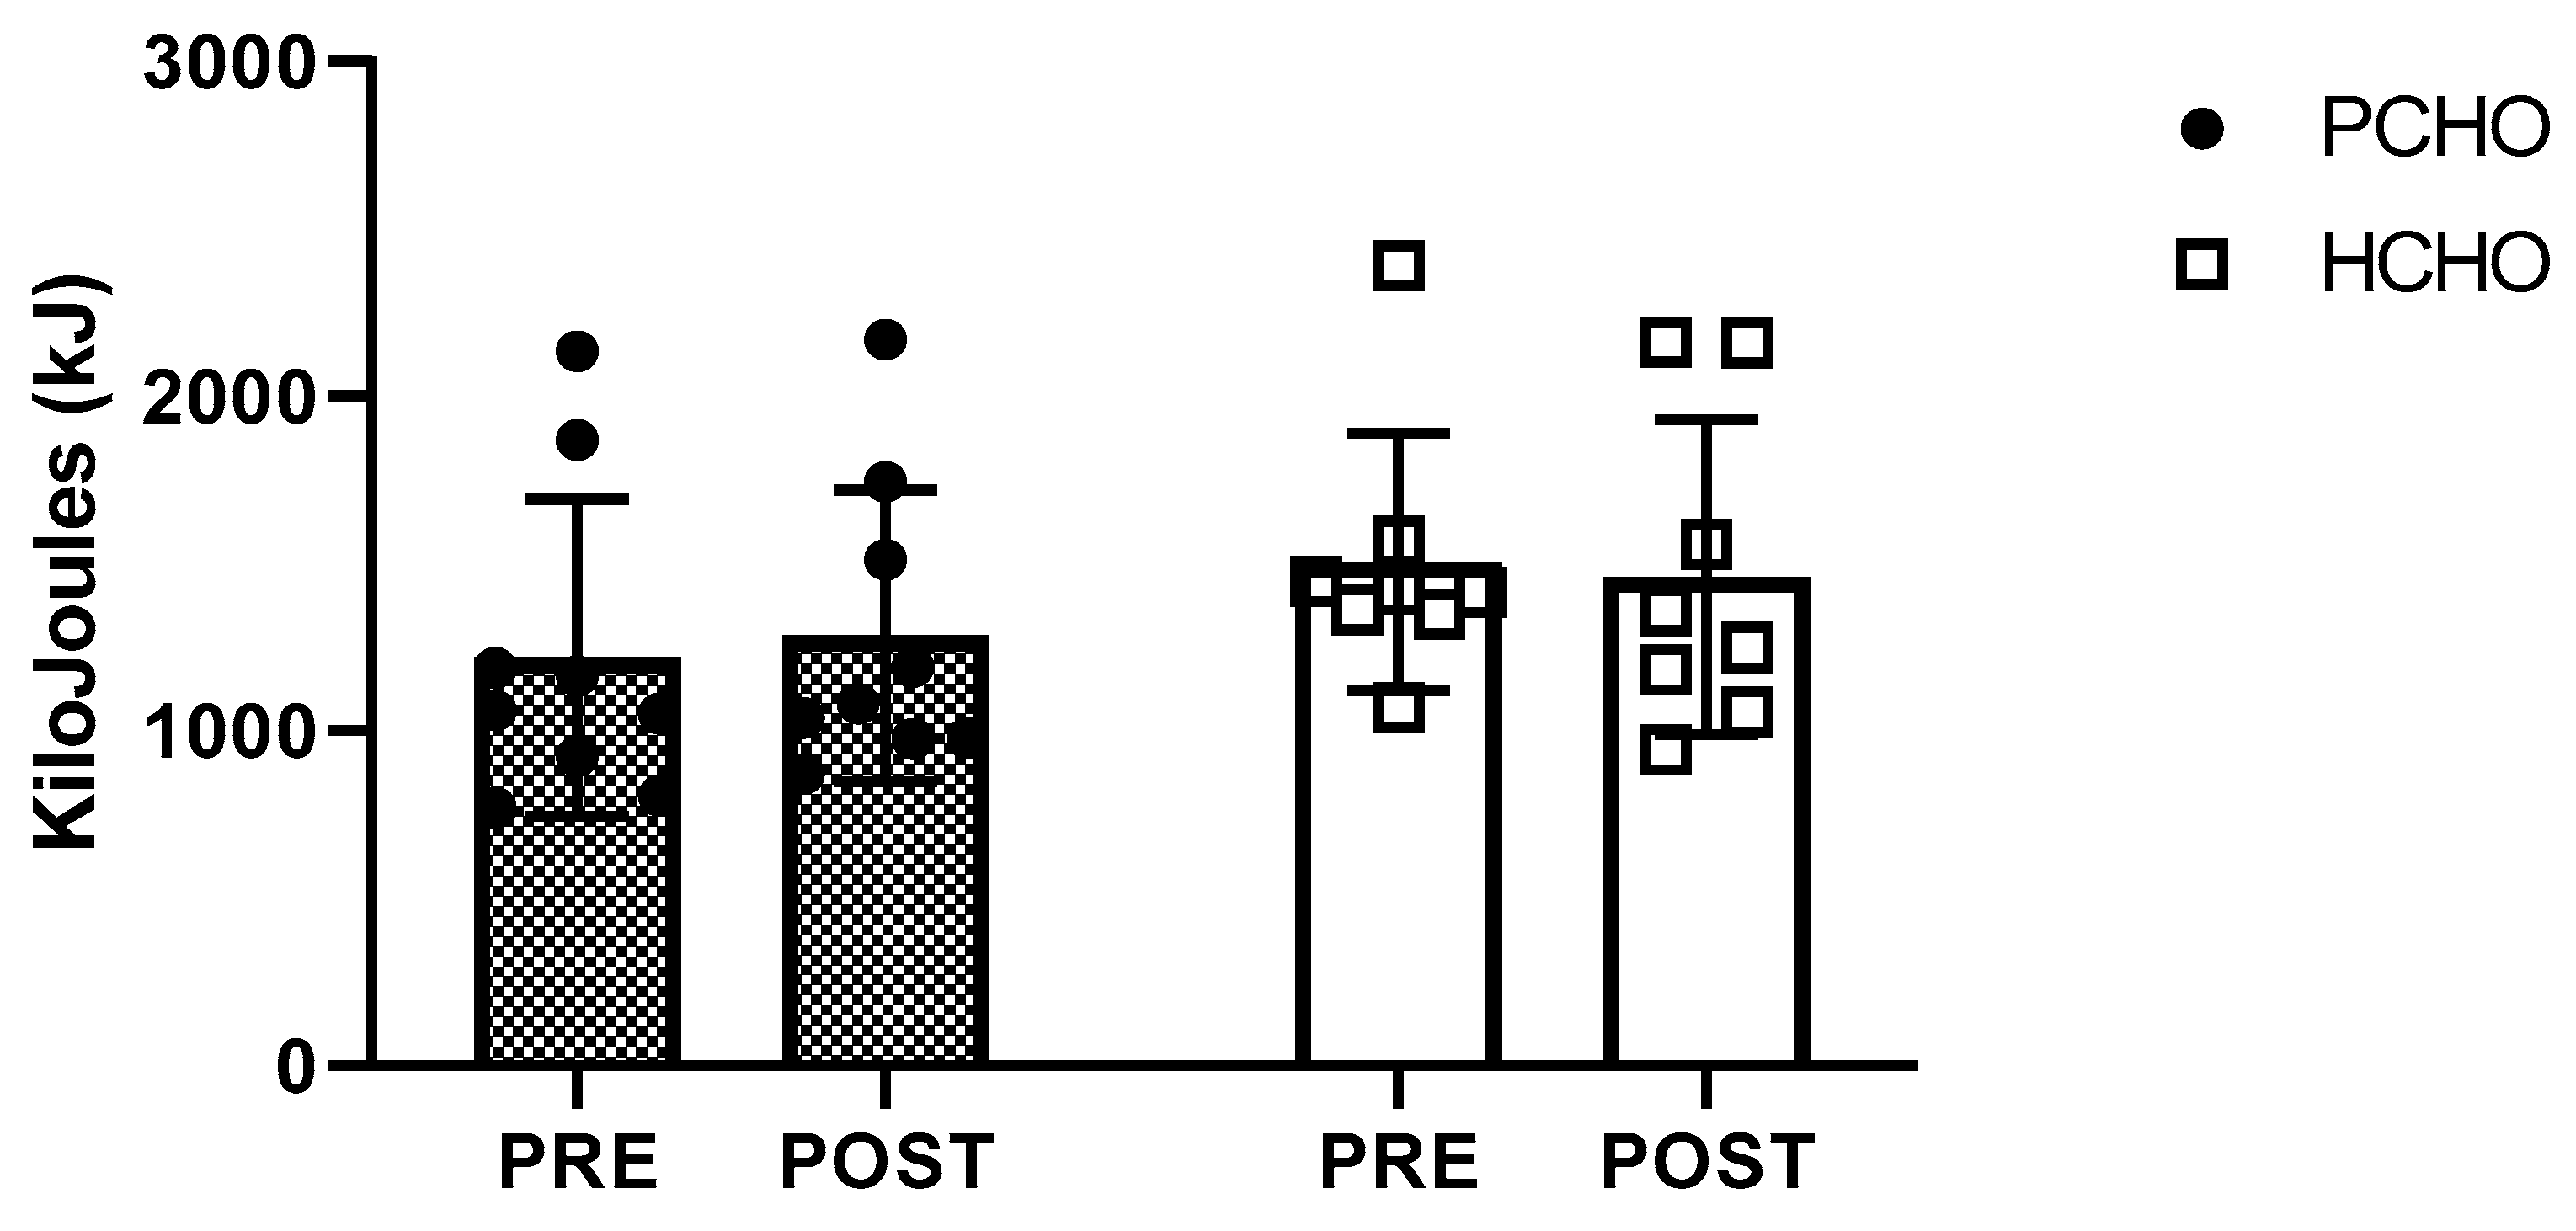
3.3. Pre–Post-Time-To-Exhaustion Exercise (TTE)
3.4. CHO and LIP Oxidation and Metabolism (RER)
4. Discussion
5. Conclusions
Practical Applications
Author Contributions
Funding
Institutional Review Board Statement
Informed Consent Statement
Data Availability Statement
Acknowledgments
Conflicts of Interest
References
- Learsi, S.K.; Ghiarone, T.; Silva-Cavalcante, M.D.; Andrade-Souza, V.A.; Ataide-Silva, T.; Bertuzzi, R.; de Araujo, G.G.; McConell, G.; Lima-Silva, A.E. Cycling Time Trial Performance Is Improved by Carbohydrate Ingestion during Exercise Regardless of a Fed or Fasted State. Scand. J. Med. Sci. Sports 2019, 29, 651–662. [Google Scholar] [CrossRef] [PubMed]
- Bergström, J.; Hermansen, L.; Hultman, E.; Saltin, B. Diet, Muscle Glycogen and Physical Performance. Acta Physiol. Scand. 1967, 71, 140–150. [Google Scholar] [CrossRef] [PubMed]
- Hawley, J.A.; Schabort, E.J.; Noakes, T.D.; Dennis, S.C. Carbohydrate-Loading and Exercise Performance. Sports Med. 1997, 24, 73–81. [Google Scholar] [CrossRef] [PubMed]
- Viribay, A.; Arribalzaga, S.; Mielgo-Ayuso, J.; Castañeda-Babarro, A.; Seco-Calvo, J.; Urdampilleta, A. Effects of 120 g/h of Carbohydrates Intake during a Mountain Marathon on Exercise-Induced Muscle Damage in Elite Runners. Nutrients 2020, 12, 1367. [Google Scholar] [CrossRef] [PubMed]
- Thomas, D.T.; Erdman, K.A.; Burke, L.M. Position of the Academy of Nutrition and Dietetics, Dietitians of Canada, and the American College of Sports Medicine: Nutrition and Athletic Performance. J. Acad. Nutr. Diet. 2016, 116, 501–528. [Google Scholar] [CrossRef] [PubMed]
- Hawley, J.A.; Lundby, C.; Cotter, J.D.; Burke, L.M. Maximizing Cellular Adaptation to Endurance Exercise in Skeletal Muscle. Cell Metab. 2018, 27, 962–976. [Google Scholar] [CrossRef]
- Burke, L.M.; Hawley, J.A.; Jeukendrup, A.; Morton, J.P.; Stellingwerff, T.; Maughan, R.J. Toward a Common Understanding of Diet-Exercise Strategies to Manipulate Fuel Availability for Training and Competition Preparation in Endurance Sport. Int. J. Sport. Nutr. Exerc. Metab. 2018, 28, 451–463. [Google Scholar] [CrossRef]
- Marquet, L.A.; Brisswalter, J.; Louis, J.; Tiollier, E.; Burke, L.M.; Hawley, J.A.; Hausswirth, C. Enhanced Endurance Performance by Periodization of Carbohydrate Intake: “Sleep Low” Strategy. Med. Sci. Sports Exerc. 2016, 48, 663–672. [Google Scholar] [CrossRef]
- Marquet, L.A.; Hausswirth, C.; Molle, O.; Hawley, J.A.; Burke, L.M.; Tiollier, E.; Brisswalter, J. Periodization of Carbohydrate Intake: Short-Term Effect on Performance. Nutrients 2016, 8, 755. [Google Scholar] [CrossRef]
- Yeo, W.K.; Paton, C.D.; Garnham, A.P.; Burke, L.M.; Carey, A.L.; Hawley, J.A. Skeletal Muscle Adaptation and Performance Responses to Once a Day versus Twice Every Second Day Endurance Training Regimens. J. Appl. Physiol. 2008, 105, 1462–1470. [Google Scholar] [CrossRef]
- Hulston, C.J.; Venables, M.C.; Mann, C.H.; Martin, C.; Philp, A.; Baar, K.; Jeukendrup, A.E. Training with Low Muscle Glycogen Enhances Fat Metabolism in Well-Trained Cyclists. Med. Sci. Sports Exerc. 2010, 42, 2046–2055. [Google Scholar] [CrossRef] [PubMed]
- Cox, G.R.; Clark, S.A.; Cox, A.J.; Halson, S.L.; Hargreaves, M.; Hawley, J.A.; Jeacocke, N.; Snow, R.J.; Yeo, W.K.; Burke, L.M. Daily Training with High Carbohydrate Availability Increases Exogenous Carbohydrate Oxidation during Endurance Cycling. J. Appl. Physiol. 2010, 109, 126–134. [Google Scholar] [CrossRef] [PubMed]
- Burke, L.M.; Ross, M.L.; Garvican-Lewis, L.A.; Welvaert, M.; Heikura, I.A.; Forbes, S.G.; Mirtschin, J.G.; Cato, L.E.; Strobel, N.; Sharma, A.P.; et al. Low Carbohydrate, High Fat Diet Impairs Exercise Economy and Negates the Performance Benefit from Intensified Training in Elite Race Walkers. J. Physiol. 2017, 595, 2785–2807. [Google Scholar] [CrossRef] [PubMed]
- Gejl, K.D.; Thams, L.B.; Hansen, M.; Rokkedal-Lausch, T.; Plomgaard, P.; Nybo, L.; Larsen, F.J.; Cardinale, D.A.; Jensen, K.; Holmberg, H.C.; et al. No Superior Adaptations to Carbohydrate Periodization in Elite Endurance Athletes. Med. Sci. Sports Exerc. 2017, 49, 2486–2497. [Google Scholar] [CrossRef] [PubMed]
- Riis, S.; Møller, A.B.; Dollerup, O.; Høffner, L.; Jessen, N.; Madsen, K. Acute and Sustained Effects of a Periodized Carbohydrate Intake Using the Sleep-Low Model in Endurance-Trained Males. Scand. J. Med. Sci. Sports 2019, 29, 1866–1880. [Google Scholar] [CrossRef] [PubMed]
- Burke, L.M.; Sharma, A.P.; Heikura, I.A.; Forbes, S.F.; Holloway, M.; McKay, A.K.A.; Bone, J.L.; Leckey, J.J.; Welvaert, M.; Ross, M.L. Crisis of Confidence Averted: Impairment of Exercise Economy and Performance in Elite Race Walkers by Ketogenic Low Carbohydrate, High Fat (LCHF) Diet Is Reproducible. PLoS ONE 2020, 15, e0234027. [Google Scholar] [CrossRef]
- Impey, S.G.; Hearris, M.A.; Hammond, K.M.; Bartlett, J.D.; Louis, J.; Close, G.L.; Morton, J.P. Fuel for the Work Required: A Theoretical Framework for Carbohydrate Periodization and the Glycogen Threshold Hypothesis. Sports Med. 2018, 48, 1031–1048. [Google Scholar] [CrossRef]
- Faude, O.; Kindermann, W.; Meyer, T. Lactate Threshold Concepts: How Valid Are They? Sports Med. 2009, 39, 469–490. [Google Scholar] [CrossRef]
- Pallarés, J.G.; Morán-Navarro, R.; Ortega, J.F.; Fernández-Elías, V.E.; Mora-Rodriguez, R. Validity and Reliability of Ventilatory and Blood Lactate Thresholds in Well-Trained Cyclists. PLoS ONE 2016, 11, e0163389. [Google Scholar] [CrossRef]
- Bueno, N.B.; De Melo, I.S.V.; De Oliveira, S.L.; Da Rocha Ataide, T. Very-Low-Carbohydrate Ketogenic Diet v. Low-Fat Diet for Long-Term Weight Loss: A Meta-Analysis of Randomised Controlled Trials. Br. J. Nutr. 2013, 110, 1178–1187. [Google Scholar] [CrossRef]
- Wachsmuth, N.B.; Aberer, F.; Haupt, S.; Schierbauer, J.R.; Zimmer, R.T.; Eckstein, M.L.; Zunner, B.; Schmidt, W.; Niedrist, T.; Sourij, H.; et al. The Impact of a High-Carbohydrate/Low Fat vs. Low-Carbohydrate Diet on Performance and Body Composition in Physically Active Adults: A Cross-Over Controlled Trial. Nutrients 2022, 14, 423. [Google Scholar] [CrossRef] [PubMed]
- McKay, A.K.A.; Stellingwerff, T.; Smith, E.S.; Martin, D.T.; Mujika, I.; Goosey-Tolfrey, V.L.; Sheppard, J.; Burke, L.M. Defining Training and Performance Caliber: A Participant Classification Framework. Int. J. Sports Physiol. Perform. 2022, 17, 317–331. [Google Scholar] [CrossRef] [PubMed]
- Hearris, M.; Hammond, K.; Fell, J.; Morton, J. Regulation of Muscle Glycogen Metabolism during Exercise: Implications for Endurance Performance and Training Adaptations. Nutrients 2018, 10, 298. [Google Scholar] [CrossRef] [PubMed]
- Whipp, B.J.; Ward, S.A. Physiological Determinants of Pulmonary Gas Exchange Kinetics during Exercise. Med. Sci. Sports Exerc. 1990, 22, 62–71. [Google Scholar] [CrossRef] [PubMed]
- Hawley, J.A.; Noakes, T.D. Peak Power Output Predicts Maximal Oxygen Uptake and Performance Time in Trained Cyclists. Eur. J. Appl. Physiol. Occup. Physiol. 1992, 65, 79–83. [Google Scholar] [CrossRef] [PubMed]
- Schilling, B.K.; Falvo, M.J.; Chiu, L.Z.F. Force-Velocity, Impulse-Momentum Relationships: Implications for Efficacy of Purposefully Slow Resistance Training. J. Sports Sci. Med. 2008, 7, 299–304. [Google Scholar]
- Marfell-jones, M.; Olds, T.; Stewart, A.; Carter, L. International Standards for Anthropometric Assessment; International Society for the Advancement of Kinanthropometry: Potchefstroom, South Africa, 2006. [Google Scholar]
- Dimitrijevic, M.; Paunovic, V.; Zivkovic, V.; Bolevich, S.; Jakovljevic, V. Body Fat Evaluation in Male Athletes from Combat Sports by Comparing Anthropometric, Bioimpedance, and Dual-Energy X-Ray Absorptiometry Measurements. Biomed. Res. Int. 2022, 2022, 3456958. [Google Scholar] [CrossRef]
- Cattrysse, E.; Zinzen, E.; Caboor, D.; Duquet, W.; Van Roy, P.; Clarys, J.P. Anthropometric Fractionation of Body Mass: Matiegka Revisited. J. Sports Sci. 2002, 20, 717–723. [Google Scholar] [CrossRef]
- Billat, V.L.; Sirvent, P.; Py, G.; Koralsztein, J.-P.; Mercier, J. The Concept of Maximal Lactate Steady State. Sports Med. 2003, 33, 407–426. [Google Scholar] [CrossRef]
- Taylor, C.; Bartlett, J.D.; van de Graaf, C.S.; Louhelainen, J.; Coyne, V.; Iqbal, Z.; MacLaren, D.P.M.; Gregson, W.; Close, G.L.; Morton, J.P. Protein Ingestion Does Not Impair Exercise-Induced AMPK Signalling When in a Glycogen-Depleted State: Implications for Train-Low Compete-High. Eur. J. Appl. Physiol. 2013, 113, 1457–1468. [Google Scholar] [CrossRef]
- Cermak, N.M.; Van Loon, L.J.C. The Use of Carbohydrates during Exercise as an Ergogenic Aid. Sports Med. 2013, 43, 1139–1155. [Google Scholar] [CrossRef] [PubMed]
- Beneke, R. Methodological Aspects of Maximal Lactate Steady State-Implications for Performance Testing. Eur. J. Appl. Physiol. 2003, 89, 95–99. [Google Scholar] [CrossRef] [PubMed]
- Ferrannini, E. The Theoretical Bases of Indirect Calorimetry: A Review. Metabolism 1988, 37, 287–301. [Google Scholar] [CrossRef]
- Frayn, K.N. Calculation of Substrate Oxidation Rates in Vivo from Gaseous Exchange. J. Appl. Physiol. Respir. Environ. Exerc. Physiol. 1983, 55, 628–634. [Google Scholar] [CrossRef]
- Skinner, J.S.; McLellan, T.H. The Transition from Aerobic to Anaerobic Metabolism. Res. Q. Exerc. Sport. 1980, 51, 234–248. [Google Scholar] [CrossRef] [PubMed]
- Sitko, S.; Cirer-Sastre, R.; López-Laval, I. Time to Exhaustion at Estimated Functional Threshold Power in Road Cyclists of Different Performance Levels. J. Sci. Med. Sport. 2022, 25, 783–786. [Google Scholar] [CrossRef] [PubMed]
- Martin, C.K.; Correa, J.B.; Han, H.; Allen, H.R.; Rood, J.C.; Champagne, C.M.; Gunturk, B.K.; Bray, G.A. Validity of the Remote Food Photography Method (RFPM) for Estimating Energy and Nutrient Intake in near Real-Time. Obesity 2012, 20, 891–899. [Google Scholar] [CrossRef]
- Cohen, J. Statistical Power Analysis for the Behavioural Sciences; Lawrence Earlbaum Associates: Hillside, NJ, USA, 1988. [Google Scholar]
- Wroble, K.A.; Trott, M.N.; Schweitzer, G.G.; Rahman, R.S.; Kelly, P.V.; Weiss, E.P. Low-Carbohydrate, Ketogenic Diet Impairs Anaerobic Exercise Performance in Exercise-Trained Women and Men: A Randomized-Sequence Crossover Trial. J. Sports Med. Phys. Fit. 2019, 59, 600–607. [Google Scholar] [CrossRef]
- Gejl, K.D.; Nybo, L. Performance Effects of Periodized Carbohydrate Restriction in Endurance Trained Athletes—A Systematic Review and Meta-Analysis. J. Int. Soc. Sports Nutr. 2021, 18, 1–12. [Google Scholar] [CrossRef]
- Hauser, T.; Adam, J.; Schulz, H. Comparison of Selected Lactate Threshold Parameters with Maximal Lactate Steady State in Cycling. Int. J. Sports Med. 2014, 35, 517–521. [Google Scholar] [CrossRef]
- Mendes, T.T.; Fonseca, T.R.; Ramos, G.P.; Wilke, C.F.; Cabido, C.E.T.; De Barros, C.L.M.; Lima, A.M.; Mortimer, L.D.Á.C.F.; De Carvalho, M.V.; Teixeira, M.M.; et al. Six Weeks of Aerobic Training Improves VO2max and MLSS but Does Not Improve the Time to Fatigue at the MLSS. Eur. J. Appl. Physiol. 2013, 113, 965–973. [Google Scholar] [CrossRef] [PubMed]
- Jamnick, N.A.; Pettitt, R.W.; Granata, C.; Pyne, D.B.; Bishop, D.J. An Examination and Critique of Current Methods to Determine Exercise Intensity. Sports Med. 2020, 50, 1729–1756. [Google Scholar] [CrossRef] [PubMed]
- Impey, S.G.; Smith, D.; Robinson, A.L.; Owens, D.J.; Bartlett, J.D.; Smith, K.; Limb, M.; Tang, J.; Fraser, W.D.; Close, G.L.; et al. Leucine-Enriched Protein Feeding Does Not Impair Exercise-Induced Free Fatty Acid Availability and Lipid Oxidation: Beneficial Implications for Training in Carbohydrate-Restricted States. Amino Acids 2015, 47, 407–416. [Google Scholar] [CrossRef] [PubMed]
- Kahlhöfer, J.; Lagerpusch, M.; Enderle, J.; Eggeling, B.; Braun, W.; Pape, D.; Müller, M.J.; Bosy-Westphal, A. Carbohydrate Intake and Glycemic Index Affect Substrate Oxidation during a Controlled Weight Cycle in Healthy Men. Eur. J. Clin. Nutr. 2014, 68, 1060–1066. [Google Scholar] [CrossRef] [PubMed]
- Pehleman, T.L.; Peters, S.J.; Heigenhauser, G.J.F.; Spriet, L.L. Enzymatic Regulation of Glucose Disposal in Human Skeletal Muscle after a High-Fat, Low-Carbohydrate Diet. J. Appl. Physiol. 2005, 98, 100–107. [Google Scholar] [CrossRef] [PubMed]
- Volek, J.S.; Noakes, T.; Phinney, S.D. Rethinking Fat as a Fuel for Endurance Exercise. Eur. J. Sport. Sci. 2015, 15, 13–20. [Google Scholar] [CrossRef]
- Hearris, M.A.; Hammond, K.M.; Seaborne, R.A.; Stocks, B.; Shepherd, S.O.; Philp, A.; Sharples, A.P.; Morton, J.P.; Louis, J.B. Graded Reductions in Preexercise Muscle Glycogen Impair Exercise Capacity but Do Not Augment Skeletal Muscle Cell Signaling: Implications for CHO Periodization. J. Appl. Physiol. 2019, 126, 1587–1597. [Google Scholar] [CrossRef]
- Mears, S.A.; Dickinson, K.; Bergin-Taylor, K.; Dee, R.; Kay, J.; James, L.J. Perception of Breakfast Ingestion Enhances High-Intensity Cycling Performance. Int. J. Sports Physiol. Perform. 2018, 13, 504–509. [Google Scholar] [CrossRef]
- Vidić, V.; Ilić, V.; Toskić, L.; Janković, N.; Ugarković, D. Effects of Calorie Restricted Low Carbohydrate High Fat Ketogenic vs. Non-Ketogenic Diet on Strength, Body-Composition, Hormonal and Lipid Profile in Trained Middle-Aged Men. Clin. Nutr. 2021, 40, 1495–1502. [Google Scholar] [CrossRef]
- Melin, A.K.; Heikura, I.A.; Tenforde, A.; Mountjoy, M. Energy Availability in Athletics: Health, Performance, and Physique. Int. J. Sport. Nutr. Exerc. Metab. 2019, 29, 152–164. [Google Scholar] [CrossRef]


| Training | Monday | Tuesday | Wednesday | Thursday | Friday | Saturday | Sunday |
|---|---|---|---|---|---|---|---|
| PCHO/HCHO | Medium/ High | Low/High | High/High | Low/High | Medium/High | High/High | Low/High |
| Week 1 | Morning: Gym 1 h 20′ -Wup 15′ + Core 20′ -4 × 4 (55–60 RM) | Morning: Bike 3 h -Ride Z1-Z2 | Morning: Bike 2 h 30′ -Wup 30′ -4× (10′Z3 rec 10′Z1-Z2) -40′Z1-Z2 | Morning: Bike 2 h 30′ -Ride Z1-Z2 | Morning: Gym 1 h 20′ -Wup 15′ + Core 20′ -4 × 4 (55–60 RM) | Morning: Bike 3 h -Ride Z1-Z2 | Morning: Bike 2 h 30′ -Ride Z1-Z2 |
| PCHO/HCHO | Medium/high | Medium/high | High/high | Low/high | Medium/high | High/high | Low/high |
| Week 2 | Rest | Morning: Bike 1 h 30′Z1-Z2 Afternoon: Gym 1 h 20′ -Wup 15′ + Core 20′ -4 × 4 (55–60 RM) | Morning: Bike 3 h 35′ -Wup 30′ -5 × (10′Z3 rec 3′Z1-Z2) -2 h Z1-Z2 | Morning: Bike 2 h 30′ -Ride Z1-Z2 | Morning: Bike 1 h 30′Z1-Z2 Afternoon: Gym 1 h 20′ -Wup 15′ + Core 20′ -4 × 4 (55–60 RM) | Morning: Bike 3 h -Wup 50′ -5× (10′Z3, rec 6′Z1-Z2) -50′Z1-Z2 | Morning: Bike 2 h 30′ -Ride Z1-Z2 |
| PCHO/HCHO | Medium/high | Medium/high | High/high | Low/high | Medium/high | High/high | Low/high |
| Week 3 | Rest | Morning: Bike 1 h 30′Z1-Z2 Afternoon: Gym 1 h 20′ -Wup 15′ + Core 20′ -4 × 4 (55–60 RM) | Bike 3 h -Wup 50′ -5× (10′Z3 rec 6′Z1-Z2) -50′Z1-Z2 | Morning: Bike 2 h 30′ -Ride Z1-Z2 | Morning: Bike 1 h 30′Z1-Z2 Afternoon: Gym 1 h 20′ -Wup 15′ + Core 20′ -4 × 4 (55–60 RM) | Morning: Bike 3 h -Wup 60′ -2× Ramp Up (5′Z3, 5′Z4, 5′Z4 5′Z5), rec 20′Z1-Z2 -4× (2′Z5-Z6, rec 8′) | Morning: Bike 2 h 30′ -Ride Z1-Z2 |
| PCHO/HCHO | Medium/high | Low/high | Medium/high | Low/high | Medium/high | High/high | Low/high |
| Week 4 | Rest | Morning: Bike 2 h 30′ -Ride Z1-Z2 | Morning: Bike 1 h 30′Z1-Z2 Afternoon: Gym 1 h 20′ -Wup 15′ + Core 20′ -4 × 4 (55–60 RM) | Morning: Bike 2 h 30′ -Ride Z1-Z2 | Morning: Bike 1 h 30′Z1-Z2 Afternoon: Gym 1 h 20′ -Wup 15′ + Core 20′ -4 × 4 (55–60 RM) | Morning: Bike 3 h -Wup 60′ -2× Ramp Up (5′Z3, 5′Z4, 5′Z4 5′Z5), rec 20′Z1-Z2 -4× (2′Z5-Z6, rec 8′) | Morning: Bike 2 h 30′ -Ride Z1-Z2 |
| PCHO/HCHO | Medium/high | Medium/high | Low/high | High/high | Low/high | Medium/high | Low/high |
| Week 5 | Rest | Morning: Bike 1 h 30′Z1-Z2 Afternoon: Gym 1 h 20′ -Wup 15′ + Core 20′ -4 × 4 (55–60 RM) | Morning: Bike 2 h 30′ -Ride Z1-Z2 | Morning: Bike 2 h 30′ -Wup 30′Z1-Z2 -60′Z3 -30′Z1-Z2 | Morning: Bike 3 h -Ride Z1-Z2 | Rest | Morning: Bike 2 h 30′ -Ride Z1-Z2 |
| WK 1 | Day 1 | Day 2 | Day 3 | Day 4 | Day 5 | Day 6 | Day 7 | |||||||
|---|---|---|---|---|---|---|---|---|---|---|---|---|---|---|
| PCHO | HCHO | PCHO | HCHO | PCHO | HCHO | PCHO | HCHO | PCHO | HCHO | PCHO | HCHO | PCHO | HCHO | |
| Classif. | MED | LOW | HIGH | LOW | MED. | HIGH | LOW | |||||||
| Macro. | CHO/PRO/LIP | CHO/PRO/LIP | CHO/PRO/LIP | CHO/PRO/LIP | CHO/PRO/LIP | CHO/PRO/LIP | CHO/PRO/LIP | CHO/PRO/LIP | CHO/PRO/LIP | CHO/PRO/LIP | CHO/PRO/LIP | CHO/PRO/LIP | CHO/PRO/LIP | CHO/PRO/LIP |
| Breakf. | 2.4/0.5/0.2 | 1.1/0.5/0.1 | 0.0/0.4/0.2 | 2.0/0.2/0.1 | 3.0/0.5/0.3 | 2.0/0.4/0.3 | 0.0/0.4/0.2 | 2.0/0.2/0.1 | 1.1/0.5/0.1 | 1.1/0.5/0.1 | 2.8/0.6/0.4 | 2.8/0.3/0.2 | 0.0/0.4/0.2 | 2.0/0.2/0.1 |
| Train. | Gym 1 h 20′ 30 g CHO (23 g/h) | Gym 1 h 20′ 30 g CHO (23 g/h) | Bike 3 h Z1-Z2 45 g PRO (15 g/h) | Bike 3 h Z1-Z2 90 g CHO (30 g/h) | Bike 2 h Z2-Z4 100 g CHO (50 g/h) | Bike 2 h Z2-Z4 100 g CHO (50 g/h) | Bike 2 h 30′ Z1-Z2 37.5 g PRO (15 g/h) | Bike 2 h 30′ Z1-Z2 75 g CHO (30 g/h) | Gym 1 h 20′ 30 g CHO (23 g/h) | Gym 1 h 20′ 30 g CHO (23 g/h) | Bike 3 h Z2 150 g CHO (50 g/h) | Bike 3 h Z2 150 g CHO (50 g/h) | Bike 2 h 30′ Z1-Z2 37.5 g PRO (15 g/h) | Bike 2 h 30′ Z1-Z2 75 g CHO (30 g/h) |
| Recov. | 1.2/0.5/0.0 | 1.0/0.5/0.0 | 1.2/0.3/0.0 | 1.0/0.3/0.0 | 1.2/0.5/0.0 | 1.0/0.5/0.0 | 1.2/0.3/0.0 | 1.0/0.3/0.0 | 1.0/0.5/0.0 | 1.0/0.5/0.0 | 1.2/0.5/0.0 | 1.0/0.3/0.0 | 1.2/0.4/0.0 | 1.0/0.3/0.0 |
| Lunch | 0.3/0.5/0.4 | 1.0/0.5/0.2 | 1.3/0.6/0.2 | 1.0/0.4/0.2 | 0.3/0.6/0.4 | 1.0/0.5/0.3 | 1.2/0.5/0.3 | 1.0/0.4/0.2 | 1.0/0.6/0.2 | 1.0/0.6/0.2 | 0.5/0.6/0.6 | 2.0/0.4/0.3 | 1.0/0.6/0.3 | 1.0/0.4/0.2 |
| Snack | 0.3/0.5/0.2 | 1.0/0.5/0.1 | 1.1/0.2/0.1 | 0.6/0.2/0.1 | 0.0/0.4/0.3 | 1.0/0.3/0.2 | 1.0/0.2/0.1 | 0.4/0.3/0.0 | 0.9/0.2/0.2 | 0.9/0.2/0.2 | 0.3/0.6/0.5 | 1.7/0.3/0.0 | 0.8/0.3/0.2 | 0.4/0.3/0.0 |
| Dinner | 0.3/0.5/0.4 | 2.0/0.5/0.2 | 2.0/0.5/0.3 | 1.4/0.4/0.1 | 0.3/0.7/0.5 | 1.2/0.5/0.3 | 1.7/0.5/0.2 | 1.0/0.4/0.2 | 1.2/0.6/0.3 | 1.2/0.6/0.3 | 0.5/0.7/0.6 | 2.0/0.4/0.3 | 1.0/0.6/0.4 | 1.0/0.4/0.2 |
| Daily CHO/PRO/LIP /kg BM | 5.0/2.5/1.2 | 6.6/2.5/0.5 | 5.6/2.8/0.8 | 7.6/1.5/0.5 | 6.6/2.7/1.5 | 8.0/2.2/1.1 | 5.1/2.6/0.8 | 6.8/1.6/0.5 | 5.7/2.5/0.9 | 5.7/2.5/0.9 | 8.0/3.0/2.1 | 12.2/1.7/0.8 | 4.0/3.0/1.1 | 6.8/1.6/0.5 |
| Daily kJ/kg | 170.7 | 171.1 | 170.7 | 171.1 | 212.1 | 212.1 | 159 | 159 | 171.1 | 171.1 | 263.2 | 262.8 | 158.6 | 159.4 |
| KJ (kJ/kg) | CHO (g/kg) | PRO (g/kg) | LIP (g/kg) | |
|---|---|---|---|---|
| Week 1 | ||||
| PCHO | 186.6 ± 38.1 | 5.7 ± 1.3 * | 2.7 ± 0.2 * | 1.2 ± 0.5 * |
| HCHO | 187.0 ± 37.7 | 7.7 ± 2.1 * | 1.9 ± 0.4 * | 0.7 ± 0.3 * |
| Week 2 | ||||
| PCHO | 202.1 ± 53.6 | 6.3 ± 2.4 | 2.7 ± 0.3 * | 1.4 ± 0.4 * |
| HCHO | 202.1 ± 52.7 | 8.3 ± 3.1 | 1.9 ± 0.4 * | 0.8 ± 0.3 * |
| Week 3 | ||||
| PCHO | 202.1 ± 53.6 | 6.3 ± 2.4 | 2.7 ± 0.3 * | 1.4 ± 0.4 * |
| HCHO | 202.1 ± 52.6 | 8.3 ± 3.1 | 1.9 ± 0.4 * | 0.8 ± 0.3 * |
| Week 4 | ||||
| PCHO | 179.1 ± 39.3 | 5.2 ± 1.7 | 2.7 ± 0.3 * | 1.2 ± 0.5 * |
| HCHO | 179.5 ± 38.9 | 7.2 ± 2.1 | 1.9 ± 0.4 * | 0.7 ± 0.3 * |
| Week 5 | ||||
| PCHO | 169.0 ± 30.1 | 4.7 ± 1.3 | 2.6 ± 0.3 * | 1.2 ± 0.5 |
| HCHO | 169.5 ± 29.7 | 6.6 ± 1.2 | 1.8 ± 0.3 * | 0.8 ± 0.3 |
| Week 1 to 5 (total) | ||||
| PCHO | 187.9 ± 43.1 | 5.7 ± 1.9 * | 2.7 ± 0.3 * | 1.3 ± 0.4 * |
| HCHO | 187.9 ± 42.7 | 7.6 ± 2.4 * | 1.8 ± 0.3 * | 0.8 ± 0.3 * |
| PRE | POST | F | p | ƞp2 | ||
|---|---|---|---|---|---|---|
| CHO oxidation (g/min) | ||||||
| PCHO | 3.92 ± 0.75 | 3.78 ± 0.94 | Group | 0.98 | 0.339 | 0.06 |
| HCHO | 4.00 ± 0.67 | 4.38 ± 0.81 | Time | 0.37 | 0.553 | 0.02 |
| Group × Time | 1.87 | 0.192 | 0.11 | |||
| LIP oxidation (g/min) | ||||||
| PCHO | 0.34 ± 0.21 | 0.37 ± 0.19 | Group | 3.27 | 0.091 | 0.18 |
| HCHO | 0.23 ± 0.22 | 0.16 ± 0.23 | Time | 0.16 | 0.693 | 0.01 |
| Group × Time | 0.72 | 0.410 | 0.05 | |||
| RER (VCO2/VO2) | ||||||
| PCHO | 0.94 ± 0.03 | 0.94 ± 0.04 | Group | 4.54 | 0.050 | 0.23 |
| HCHO | 0.96 ± 0.04 | 0.99 ± 0.05 | Time | 0.54 | 0.475 | 0.04 |
| Group × Time | 2.38 | 0.144 | 0.14 | |||
| VO2 (ml/kg/min) | ||||||
| PCHO | 3384 ± 395 | 3573 ± 453 | Group | 0.81 | 0.383 | 0.05 |
| HCHO | 3421 ± 365 | 3421 ± 359 | Time | 0.01 | 0.923 | 0.01 |
| Group × Time | 0.01 | 0.908 | 0.01 | |||
| Cadence (rpm) | ||||||
| PCHO | 84.89 ± 6.21 | 84.44 ± 6.19 | Group | 3.84 | 0.069 | 0.20 |
| HCHO | 79.25 ± 9.60 | 76.00 ± 10.62 | Time | 1.06 | 0.320 | 0.07 |
| Group × Time | 0.61 | 0.447 | 0.04 | |||
| HR (bpm) | ||||||
| PCHO | 151.22 ± 8.23 | 150.44 ± 9.93 | Group | 0.10 | 0.755 | 0.01 |
| HCHO | 154.25 ± 3.49 | 145.38 ± 3.49 | Time | 4.86 | 0.050 | 0.25 |
| Group × Time | 3.42 | 0.084 | 0.19 | |||
| Lactate (mmol/L) | ||||||
| PCHO | 3.86 ± 1.47 | 3.46 ± 0.70 | Group | 1.10 | 0.312 | 0.07 |
| HCHO | 3.19 ± 1.12 | 3.39 ± 1.03 | Time | 0.06 | 0.812 | 0.01 |
| Group × Time | 0.53 | 0.480 | 0.03 | |||
| Body mass loss (%) | ||||||
| PCHO | 2.42 ± 0.53 | 2.51 ± 0.64 | Group | 2.43 | 0.140 | 0.14 |
| HCHO | 2.24 ± 0.37 | 1.92 ± 0.86 | Time | 0.41 | 0.532 | 0.03 |
| Group × Time | 1.31 | 0.271 | 0.08 | |||
| PRE | POST | F | p | ƞp2 | ||
|---|---|---|---|---|---|---|
| Body Mass (kg) | ||||||
| PCHO | 67.08 ± 6.07 | 65.77 ± 5.11 * | Group | 1.11 | 0.309 | 0.07 |
| HCHO | 70.55 ± 5.39 | 67.71 ± 4.73 * | Time | 25.58 | <0.001 | 0.63 |
| Group × Time | 3.46 | 0.082 | 0.19 | |||
| Muscle Mass (%) | ||||||
| PCHO | 50.26 ± 1.23 | 50.77 ± 1.32 * | Group | 0.12 | 0.731 | 0.01 |
| HCHO | 49.98 ± 1.58 | 50.60 ± 1.21 * | Time | 21.91 | <0.001 | 0.59 |
| Group × Time | 0.22 | 0.644 | 0.02 | |||
| Body Fat (%) | ||||||
| PCHO | 8.32 ± 1.15 | 7.49 ± 1.33 * | Group | 0.16 | 0.699 | 0.01 |
| HCHO | 8.79 ± 1.23 | 7.46 ± 1.0 * | Time | 70.26 | <0.001 | 0.82 |
| Group × Time | 3.84 | 0.069 | 0.20 | |||
| Sum 6 skinfolds (mm) | ||||||
| PCHO | 48.16 ± 11.87 | 39.70 ± 13.65 * | Group | 0.16 | 0.697 | 0.01 |
| HCHO | 53.06 ± 12.68 | 39.39 ± 10.27 * | Time | 71.63 | <0.001 | 0.83 |
| Group × Time | 3.98 | 0.064 | 0.21 | |||
Disclaimer/Publisher’s Note: The statements, opinions and data contained in all publications are solely those of the individual author(s) and contributor(s) and not of MDPI and/or the editor(s). MDPI and/or the editor(s) disclaim responsibility for any injury to people or property resulting from any ideas, methods, instructions or products referred to in the content. |
© 2024 by the authors. Licensee MDPI, Basel, Switzerland. This article is an open access article distributed under the terms and conditions of the Creative Commons Attribution (CC BY) license (https://creativecommons.org/licenses/by/4.0/).
Share and Cite
Prieto-Bellver, G.; Diaz-Lara, J.; Bishop, D.J.; Fernández-Sáez, J.; Abián-Vicén, J.; San-Millan, I.; Santos-Concejero, J. A Five-Week Periodized Carbohydrate Diet Does Not Improve Maximal Lactate Steady-State Exercise Capacity and Substrate Oxidation in Well-Trained Cyclists compared to a High-Carbohydrate Diet. Nutrients 2024, 16, 318. https://doi.org/10.3390/nu16020318
Prieto-Bellver G, Diaz-Lara J, Bishop DJ, Fernández-Sáez J, Abián-Vicén J, San-Millan I, Santos-Concejero J. A Five-Week Periodized Carbohydrate Diet Does Not Improve Maximal Lactate Steady-State Exercise Capacity and Substrate Oxidation in Well-Trained Cyclists compared to a High-Carbohydrate Diet. Nutrients. 2024; 16(2):318. https://doi.org/10.3390/nu16020318
Chicago/Turabian StylePrieto-Bellver, Gorka, Javier Diaz-Lara, David J. Bishop, José Fernández-Sáez, Javier Abián-Vicén, Iñigo San-Millan, and Jordan Santos-Concejero. 2024. "A Five-Week Periodized Carbohydrate Diet Does Not Improve Maximal Lactate Steady-State Exercise Capacity and Substrate Oxidation in Well-Trained Cyclists compared to a High-Carbohydrate Diet" Nutrients 16, no. 2: 318. https://doi.org/10.3390/nu16020318
APA StylePrieto-Bellver, G., Diaz-Lara, J., Bishop, D. J., Fernández-Sáez, J., Abián-Vicén, J., San-Millan, I., & Santos-Concejero, J. (2024). A Five-Week Periodized Carbohydrate Diet Does Not Improve Maximal Lactate Steady-State Exercise Capacity and Substrate Oxidation in Well-Trained Cyclists compared to a High-Carbohydrate Diet. Nutrients, 16(2), 318. https://doi.org/10.3390/nu16020318