
Investigation of Relationships between Intakes of Human Milk Total Lipids and Metabolic Hormones and Infant Sex and Body Composition
 , , , ,
Abstract
1. Introduction
2. Materials and Methods
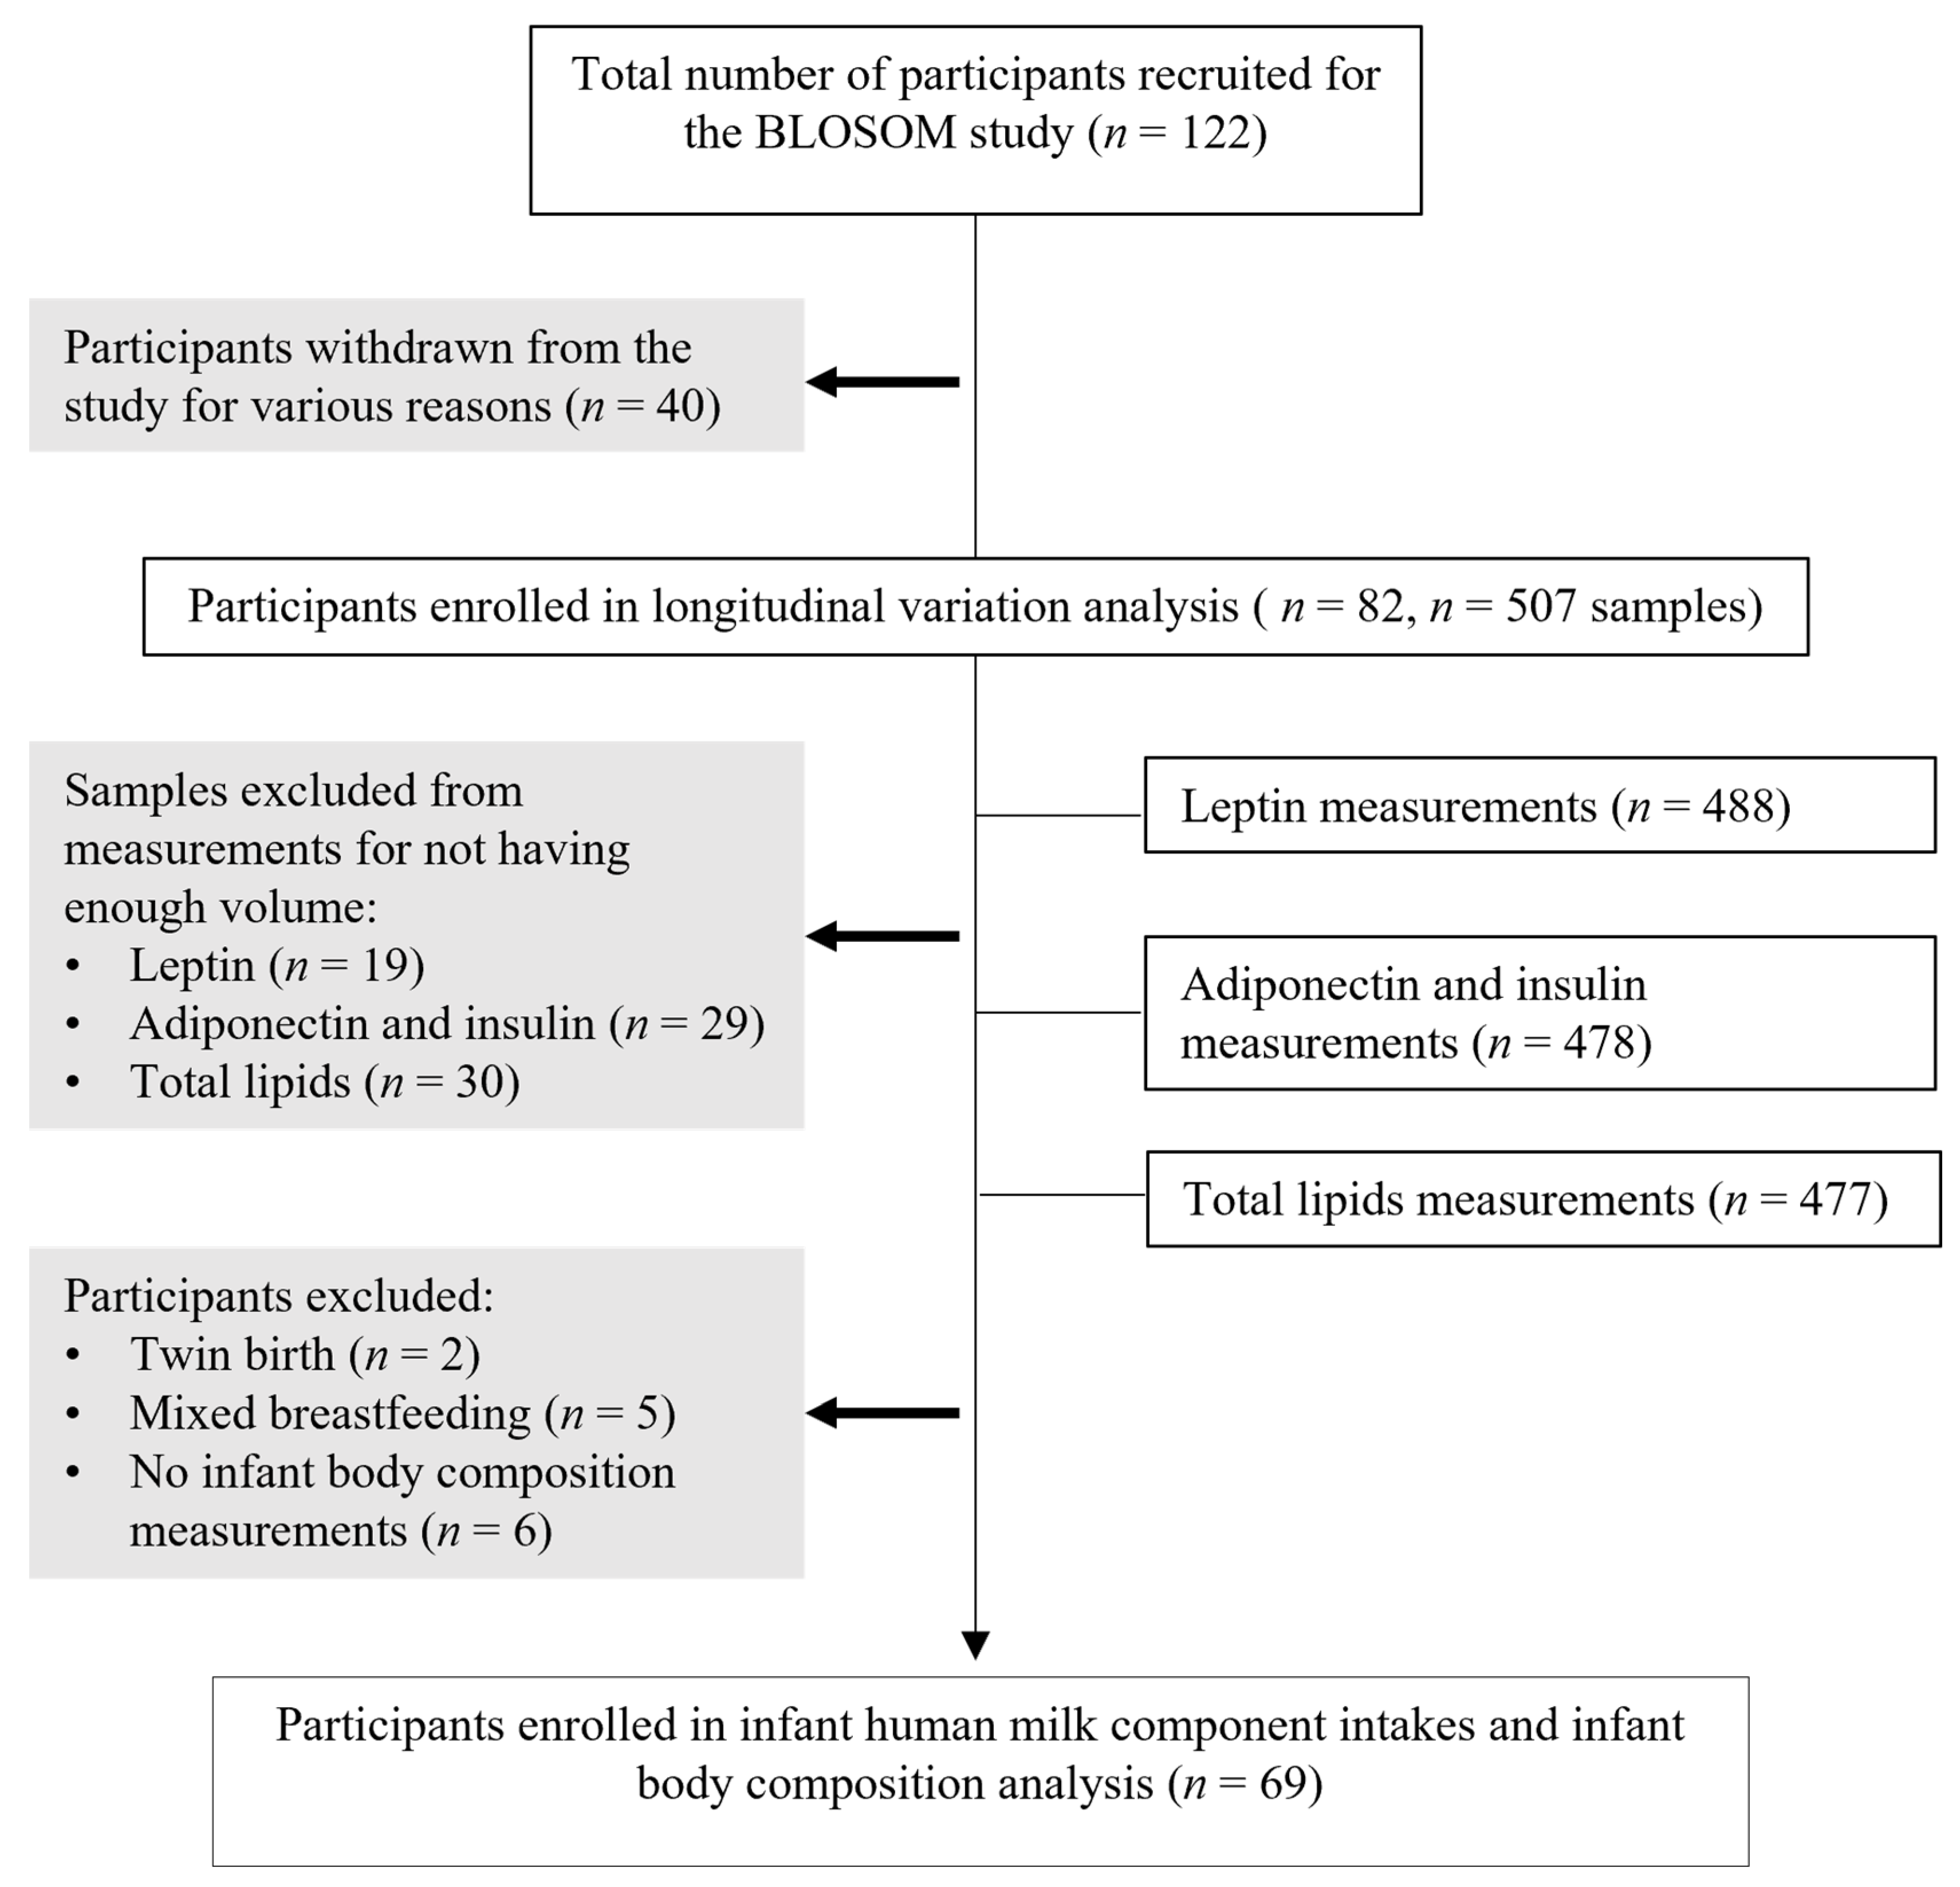
2.1. Study Design
2.2. Anthropometric and Body Composition Measurements
2.3. Milk Sample Collection
2.4. Biochemical Analysis
2.5. Calculation of Infant Intake of Human Milk Components
2.6. Statistical Analysis
3. Results
3.1. Participants’ Characteristics
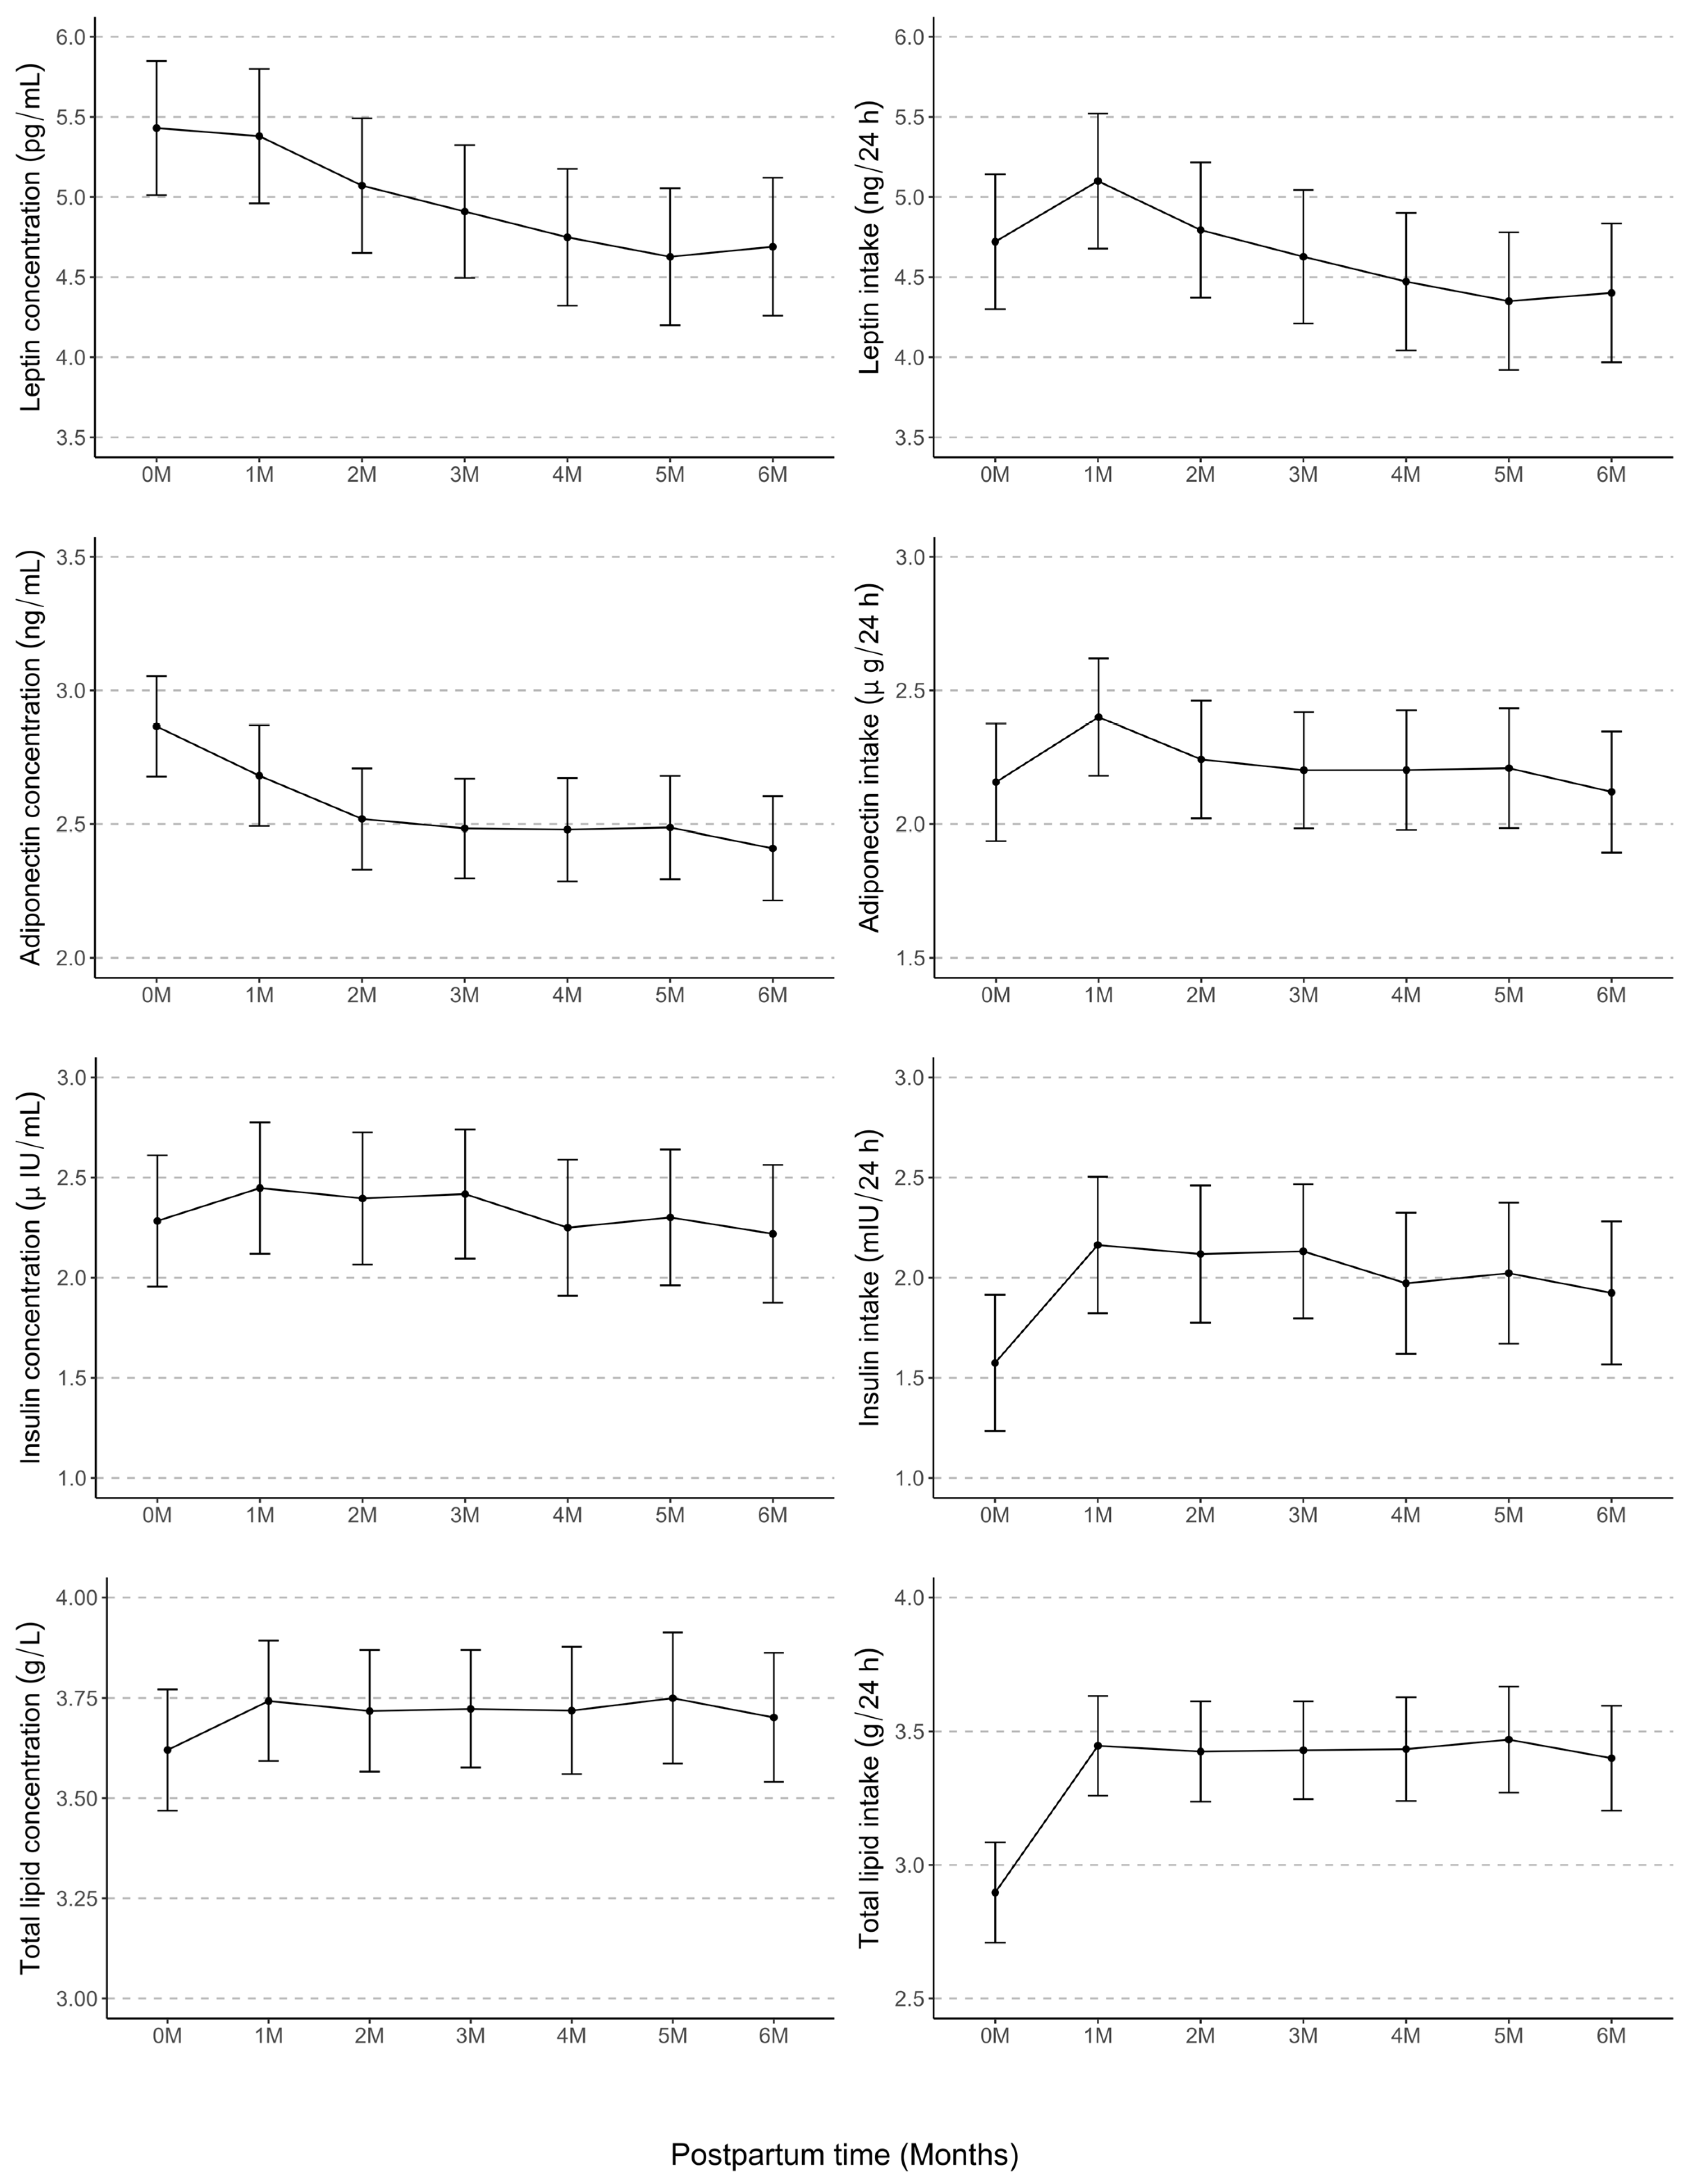
3.2. Longitudinal Variations in HM Component Concentrations and Intakes
3.3. Maternal Body Composition and Concentrations and Intakes of Human Milk Components
3.4. Infant Body Composition and Cumulative Average Intakes of Human Milk Components
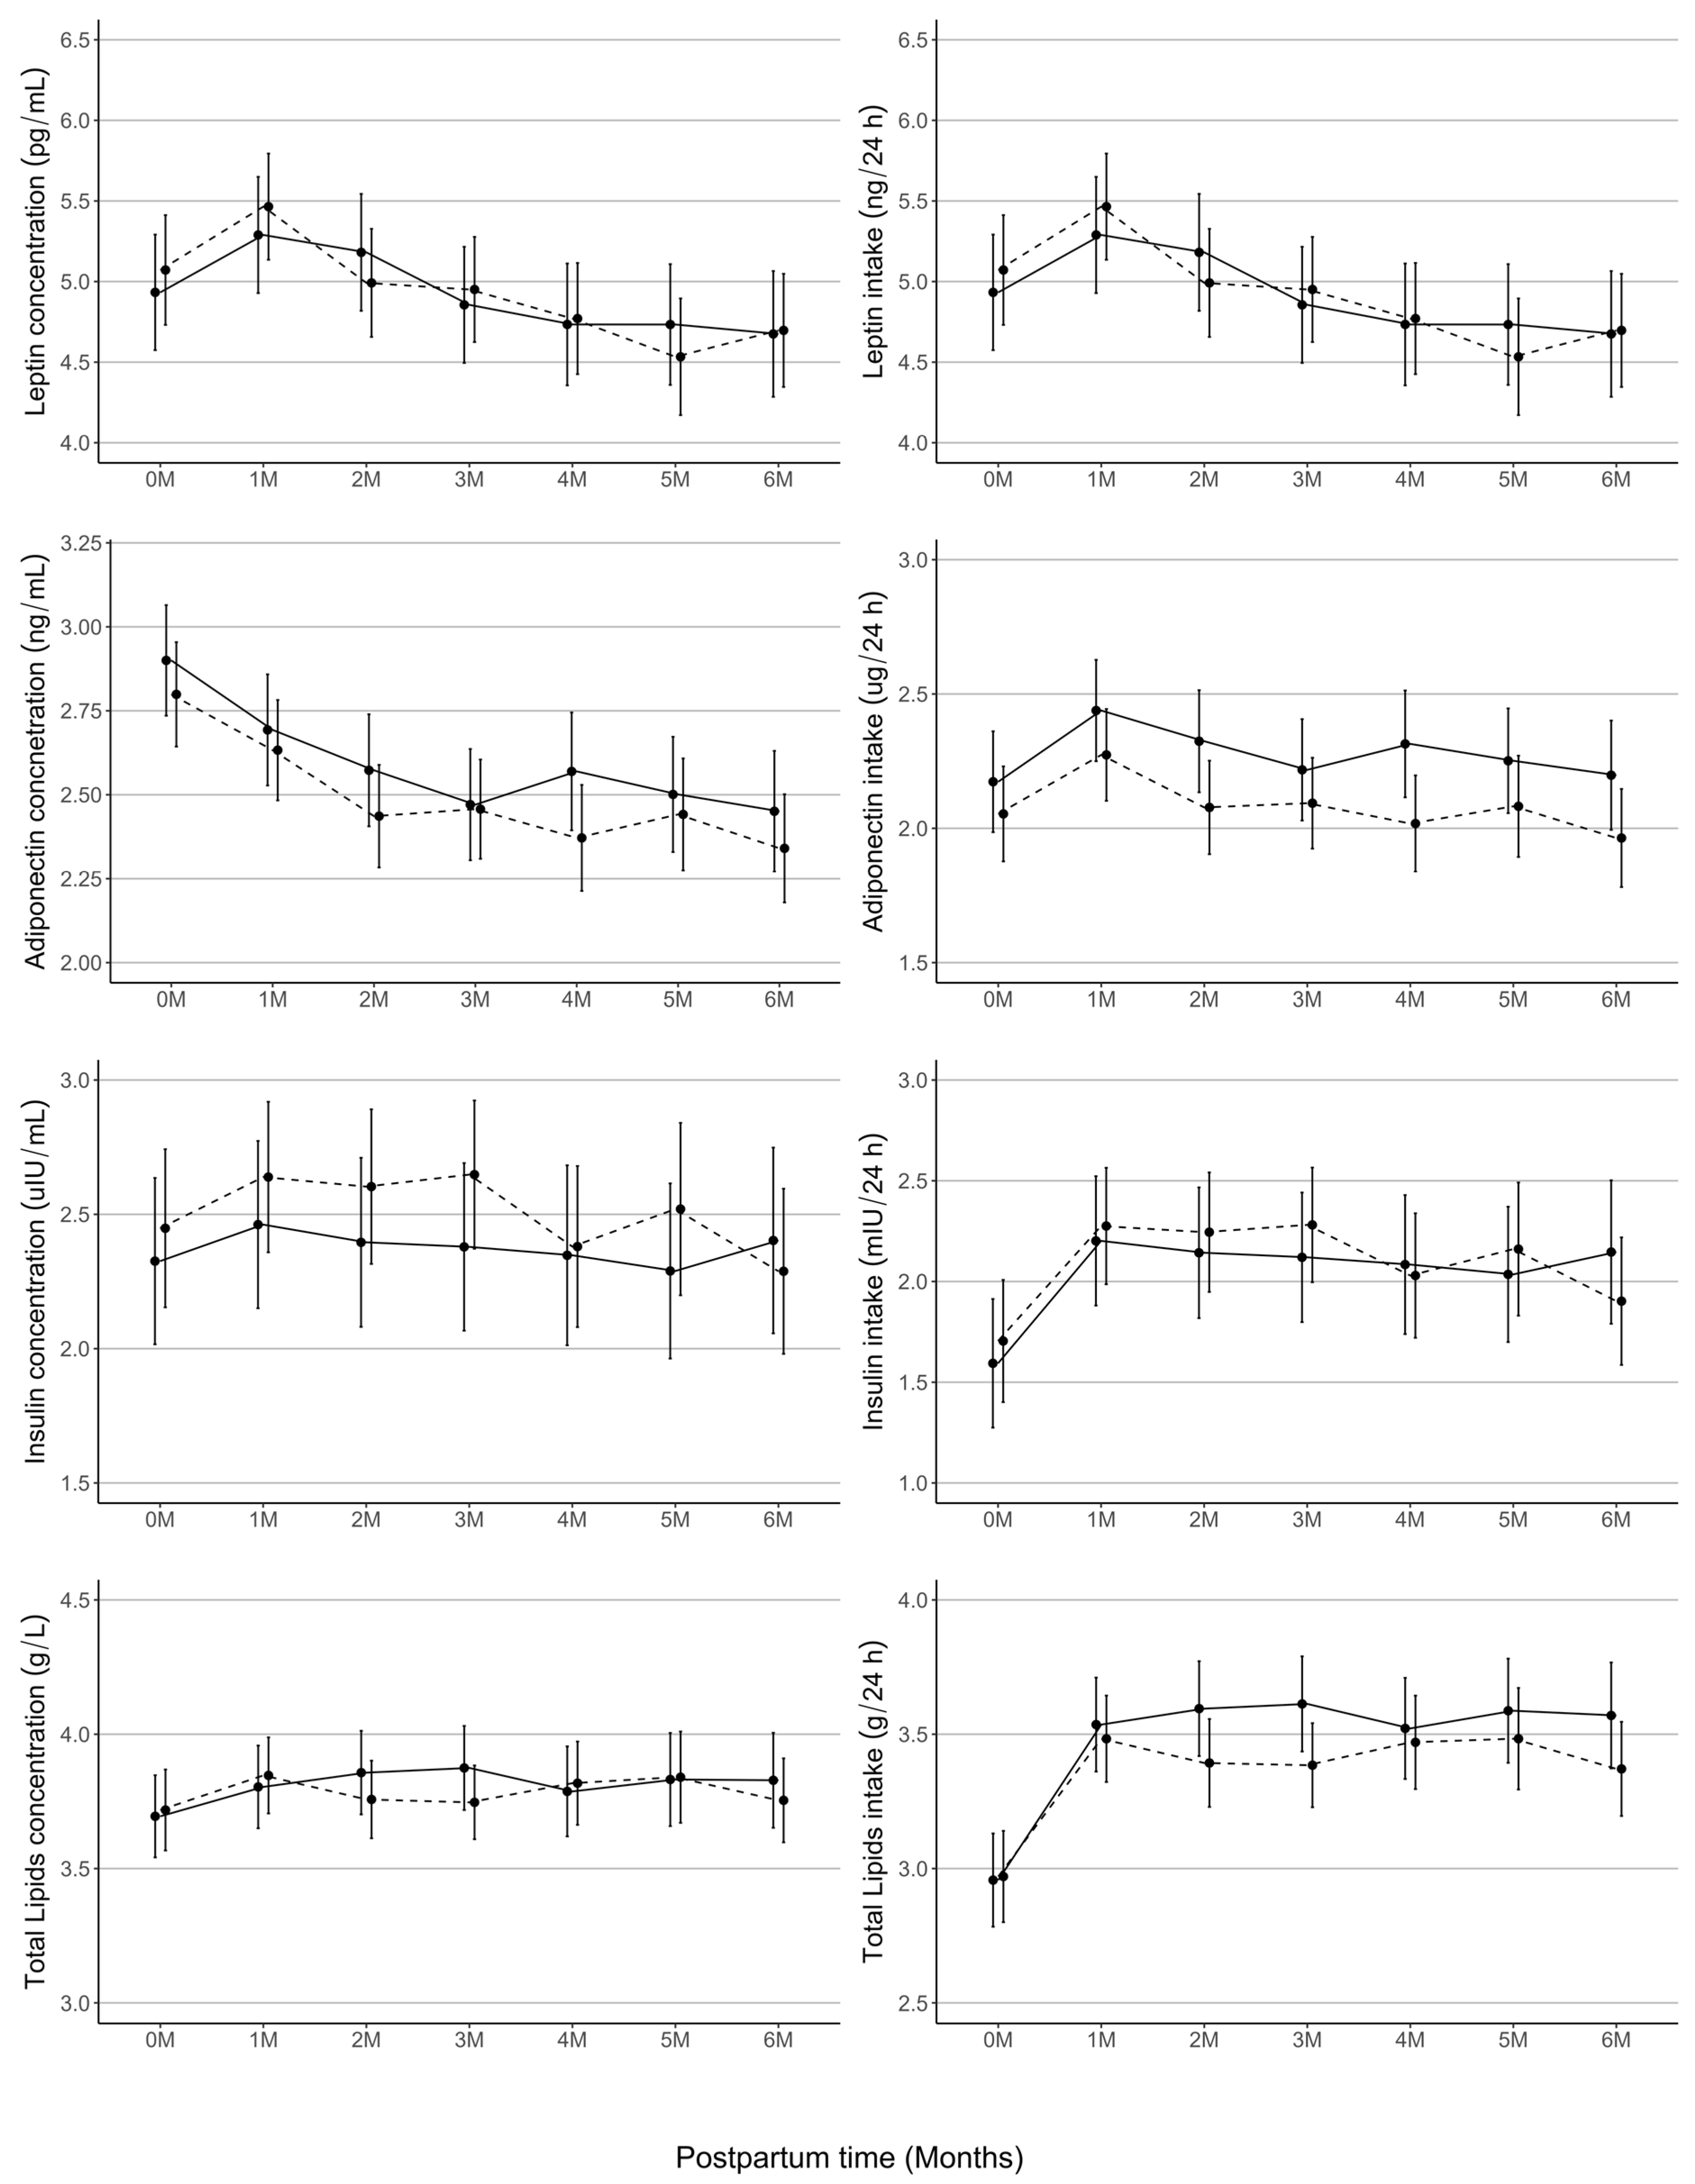
3.5. Human Milk Composition Does Not Differ by Infant Sex
4. Discussion
5. Conclusions
Supplementary Materials
Author Contributions
Funding
Institutional Review Board Statement
Informed Consent Statement
Data Availability Statement
Acknowledgments
Conflicts of Interest
Appendix A

| Contrast | Estimate | SE | df | t-Ratio | p-Value | Estimate | SE | df | t-Ratio | p-Value |
|---|---|---|---|---|---|---|---|---|---|---|
| Leptin concentration, (pg/mL) | Leptin intake, (ng/24 h) | |||||||||
| 0M–1M | 0.05 | 0.11 | 359.34 | 0.45 | 1.00 | −0.35 | 0.11 | 359.37 | −3.09 | 0.03 |
| 0M–2M | 0.36 | 0.12 | 359.10 | 3.11 | 0.02 | −0.04 | 0.12 | 359.13 | −0.38 | 0.70 |
| 0M–3M | 0.52 | 0.11 | 358.42 | 4.60 | 0.00 | 0.12 | 0.11 | 358.45 | 1.06 | 0.70 |
| 0M–4M | 0.68 | 0.12 | 360.79 | 5.68 | 0.00 | 0.28 | 0.12 | 360.83 | 2.29 | 0.20 |
| 0M–5M | 0.80 | 0.12 | 361.02 | 6.62 | 0.00 | 0.40 | 0.12 | 361.07 | 3.26 | 0.02 |
| 0M–6M | 0.74 | 0.12 | 362.62 | 5.98 | 0.00 | 0.35 | 0.13 | 362.68 | 2.78 | 0.07 |
| 1M–2M | 0.31 | 0.11 | 359.07 | 2.73 | 0.07 | 0.31 | 0.11 | 359.10 | 2.68 | 0.09 |
| 1M–3M | 0.47 | 0.11 | 358.72 | 4.23 | 0.00 | 0.47 | 0.11 | 358.74 | 4.21 | 0.00 |
| 1M–4M | 0.63 | 0.12 | 358.34 | 5.44 | 0.00 | 0.63 | 0.12 | 358.37 | 5.35 | 0.00 |
| 1M–5M | 0.75 | 0.12 | 359.46 | 6.37 | 0.00 | 0.75 | 0.12 | 359.49 | 6.28 | 0.00 |
| 1M–6M | 0.69 | 0.12 | 359.13 | 5.81 | 0.00 | 0.70 | 0.12 | 359.16 | 5.81 | 0.00 |
| 2M–3M | 0.16 | 0.11 | 358.98 | 1.43 | 0.93 | 0.17 | 0.11 | 359.00 | 1.45 | 0.70 |
| 2M–4M | 0.32 | 0.12 | 359.52 | 2.71 | 0.07 | 0.32 | 0.12 | 359.56 | 2.68 | 0.09 |
| 2M–5M | 0.44 | 0.12 | 359.68 | 3.67 | 0.00 | 0.44 | 0.12 | 359.72 | 3.63 | 0.01 |
| 2M–6M | 0.38 | 0.12 | 360.93 | 3.11 | 0.02 | 0.39 | 0.12 | 360.98 | 3.17 | 0.02 |
| 3M–4M | 0.16 | 0.12 | 360.43 | 1.40 | 0.93 | 0.16 | 0.12 | 360.47 | 1.34 | 0.70 |
| 3M–5M | 0.28 | 0.12 | 360.60 | 2.39 | 0.14 | 0.28 | 0.12 | 360.65 | 2.32 | 0.20 |
| 3M–6M | 0.22 | 0.12 | 360.82 | 1.84 | 0.47 | 0.23 | 0.12 | 360.87 | 1.87 | 0.50 |
| 4M–5M | 0.12 | 0.12 | 358.84 | 1.00 | 1.00 | 0.12 | 0.12 | 358.87 | 0.99 | 0.70 |
| 4M–6M | 0.06 | 0.12 | 359.80 | 0.48 | 1.00 | 0.07 | 0.12 | 359.83 | 0.56 | 0.70 |
| 5M–6M | −0.06 | 0.13 | 359.82 | −0.50 | 1.00 | −0.05 | 0.13 | 359.86 | −0.41 | 0.70 |
| Adiponectin concentration, (ng/mL) | Adiponectin intake, (µg/24 h) | |||||||||
| 0M–1M | 0.18 | 0.06 | 355.19 | 3.27 | 0.01 | −0.22 | 0.06 | 354.51 | −3.55 | 0.01 |
| 0M–2M | 0.35 | 0.06 | 354.96 | 5.97 | 0.00 | −0.06 | 0.06 | 354.28 | −0.91 | 1.00 |
| 0M–3M | 0.38 | 0.06 | 354.19 | 6.70 | 0.00 | −0.02 | 0.06 | 353.63 | −0.27 | 1.00 |
| 0M–4M | 0.39 | 0.06 | 357.03 | 6.41 | 0.00 | −0.02 | 0.06 | 356.03 | −0.26 | 1.00 |
| 0M–5M | 0.38 | 0.06 | 358.56 | 6.22 | 0.00 | −0.02 | 0.07 | 357.37 | −0.36 | 1.00 |
| 0M–6M | 0.46 | 0.06 | 360.72 | 7.34 | 0.00 | 0.06 | 0.07 | 359.20 | 0.97 | 1.00 |
| 1M–2M | 0.16 | 0.06 | 354.93 | 2.85 | 0.05 | 0.16 | 0.06 | 354.28 | 2.59 | 0.16 |
| 1M–3M | 0.20 | 0.06 | 354.39 | 3.54 | 0.01 | 0.20 | 0.06 | 353.84 | 3.31 | 0.02 |
| 1M–4M | 0.20 | 0.06 | 354.01 | 3.46 | 0.01 | 0.20 | 0.06 | 353.48 | 3.16 | 0.03 |
| 1M–5M | 0.19 | 0.06 | 356.42 | 3.27 | 0.01 | 0.19 | 0.06 | 355.55 | 3.00 | 0.05 |
| 1M–6M | 0.27 | 0.06 | 356.27 | 4.55 | 0.00 | 0.28 | 0.06 | 355.43 | 4.36 | 0.00 |
| 2M–3M | 0.04 | 0.06 | 354.75 | 0.62 | 0.95 | 0.04 | 0.06 | 354.13 | 0.65 | 1.00 |
| 2M–4M | 0.04 | 0.06 | 355.50 | 0.66 | 0.95 | 0.04 | 0.06 | 354.73 | 0.62 | 1.00 |
| 2M–5M | 0.03 | 0.06 | 356.74 | 0.53 | 0.95 | 0.03 | 0.07 | 355.79 | 0.50 | 1.00 |
| 2M–6M | 0.11 | 0.06 | 358.50 | 1.78 | 0.76 | 0.12 | 0.07 | 357.30 | 1.84 | 1.00 |
| 3M–4M | 0.00 | 0.06 | 356.60 | 0.07 | 0.95 | 0.00 | 0.06 | 355.68 | 0.00 | 1.00 |
| 3M–5M | 0.00 | 0.06 | 357.71 | −0.06 | 0.95 | −0.01 | 0.06 | 356.65 | −0.12 | 1.00 |
| 3M–6M | 0.07 | 0.06 | 358.19 | 1.23 | 0.95 | 0.08 | 0.06 | 357.06 | 1.26 | 1.00 |
| 4M–5M | −0.01 | 0.06 | 355.43 | −0.12 | 0.95 | −0.01 | 0.07 | 354.69 | −0.11 | 1.00 |
| 4M–6M | 0.07 | 0.06 | 356.87 | 1.12 | 0.95 | 0.08 | 0.07 | 355.89 | 1.22 | 1.00 |
| 5M–6M | 0.08 | 0.06 | 355.89 | 1.23 | 0.95 | 0.09 | 0.07 | 355.03 | 1.31 | 1.00 |
| Insulin concentration, (µIU/mL) | Insulin intake, (mIU/24 h) | |||||||||
| 0M–1M | −0.16 | 0.12 | 357.68 | −1.36 | 0.89 | −0.56 | 0.12 | 357.47 | −4.55 | 0.00 |
| 0M–2M | −0.11 | 0.12 | 357.56 | −0.91 | 0.89 | −0.52 | 0.13 | 357.33 | −4.06 | 0.00 |
| 0M–3M | −0.13 | 0.12 | 356.38 | −1.10 | 0.89 | −0.53 | 0.12 | 356.18 | −4.25 | 0.00 |
| 0M–4M | 0.03 | 0.13 | 360.72 | 0.26 | 0.89 | −0.37 | 0.13 | 360.40 | −2.80 | 0.09 |
| 0M–5M | −0.02 | 0.13 | 362.82 | −0.13 | 0.89 | −0.42 | 0.13 | 362.46 | −3.16 | 0.03 |
| 0M–6M | 0.06 | 0.13 | 366.14 | 0.49 | 0.89 | −0.32 | 0.14 | 365.69 | −2.37 | 0.29 |
| 1M–2M | 0.05 | 0.12 | 357.35 | 0.43 | 0.89 | 0.05 | 0.12 | 357.14 | 0.37 | 0.91 |
| 1M–3M | 0.03 | 0.12 | 356.38 | 0.25 | 0.89 | 0.03 | 0.12 | 356.21 | 0.26 | 0.91 |
| 1M–4M | 0.20 | 0.12 | 356.04 | 1.59 | 0.89 | 0.19 | 0.13 | 355.86 | 1.50 | 0.91 |
| 1M–5M | 0.15 | 0.13 | 359.63 | 1.16 | 0.89 | 0.14 | 0.13 | 359.36 | 1.09 | 0.91 |
| 1M–6M | 0.23 | 0.13 | 359.34 | 1.79 | 0.89 | 0.24 | 0.13 | 359.08 | 1.84 | 0.91 |
| 2M–3M | −0.02 | 0.12 | 357.05 | −0.18 | 0.89 | −0.01 | 0.12 | 356.85 | −0.11 | 0.91 |
| 2M–4M | 0.15 | 0.13 | 358.43 | 1.14 | 0.89 | 0.15 | 0.13 | 358.17 | 1.12 | 0.91 |
| 2M–5M | 0.09 | 0.13 | 360.27 | 0.73 | 0.89 | 0.10 | 0.13 | 359.96 | 0.72 | 0.91 |
| 2M–6M | 0.18 | 0.13 | 362.84 | 1.35 | 0.89 | 0.19 | 0.13 | 362.47 | 1.44 | 0.91 |
| 3M–4M | 0.17 | 0.12 | 359.95 | 1.36 | 0.89 | 0.16 | 0.13 | 359.66 | 1.26 | 0.91 |
| 3M–5M | 0.12 | 0.13 | 361.49 | 0.92 | 0.89 | 0.11 | 0.13 | 361.18 | 0.85 | 0.91 |
| 3M–6M | 0.20 | 0.13 | 362.19 | 1.55 | 0.89 | 0.21 | 0.13 | 361.85 | 1.59 | 0.91 |
| 4M–5M | −0.05 | 0.13 | 358.20 | −0.39 | 0.89 | −0.05 | 0.13 | 357.96 | −0.38 | 0.91 |
| 4M–6M | 0.03 | 0.13 | 360.52 | 0.23 | 0.89 | 0.05 | 0.14 | 360.20 | 0.35 | 0.91 |
| 5M–6M | 0.08 | 0.13 | 359.26 | 0.61 | 0.89 | 0.10 | 0.14 | 358.96 | 0.71 | 0.91 |
| Total lipid concentration, (g/L) | Total lipid intake, (g/24 h) | |||||||||
| 0M–1M | −0.12 | 0.07 | 360.59 | −1.80 | 0.99 | −0.52 | 0.07 | 355.64 | −7.39 | 0.00 |
| 0M–2M | −0.10 | 0.07 | 359.91 | −1.40 | 0.99 | −0.50 | 0.07 | 354.85 | −6.93 | 0.00 |
| 0M–3M | −0.10 | 0.07 | 358.98 | −1.49 | 0.99 | −0.50 | 0.07 | 354.07 | −7.08 | 0.00 |
| 0M–4M | −0.10 | 0.07 | 366.35 | −1.35 | 0.99 | −0.51 | 0.08 | 359.21 | −6.75 | 0.00 |
| 0M–5M | −0.13 | 0.08 | 368.71 | −1.72 | 0.99 | −0.54 | 0.08 | 360.11 | −6.98 | 0.00 |
| 0M–6M | −0.08 | 0.07 | 371.24 | −1.09 | 0.99 | −0.47 | 0.08 | 362.14 | −6.15 | 0.00 |
| 1M–2M | 0.02 | 0.07 | 357.98 | 0.37 | 0.99 | 0.02 | 0.07 | 353.97 | 0.31 | 0.96 |
| 1M–3M | 0.02 | 0.07 | 357.50 | 0.29 | 0.99 | 0.02 | 0.07 | 353.66 | 0.24 | 0.96 |
| 1M–4M | 0.02 | 0.07 | 356.34 | 0.34 | 0.99 | 0.01 | 0.07 | 352.44 | 0.17 | 0.96 |
| 1M–5M | −0.01 | 0.07 | 365.06 | −0.10 | 0.99 | −0.02 | 0.08 | 357.74 | −0.30 | 0.96 |
| 1M–6M | 0.04 | 0.07 | 361.09 | 0.57 | 0.99 | 0.05 | 0.07 | 355.34 | 0.63 | 0.96 |
| 2M–3M | −0.01 | 0.07 | 357.20 | −0.08 | 0.99 | 0.00 | 0.07 | 353.11 | −0.07 | 0.96 |
| 2M–4M | 0.00 | 0.07 | 360.98 | −0.02 | 0.99 | −0.01 | 0.07 | 355.41 | −0.12 | 0.96 |
| 2M–5M | −0.03 | 0.07 | 363.62 | −0.43 | 0.99 | −0.04 | 0.08 | 356.47 | −0.58 | 0.96 |
| 2M–6M | 0.02 | 0.07 | 365.81 | 0.22 | 0.99 | 0.02 | 0.08 | 358.31 | 0.33 | 0.96 |
| 3M–4M | 0.00 | 0.07 | 361.74 | 0.06 | 0.99 | 0.00 | 0.07 | 356.22 | −0.05 | 0.96 |
| 3M–5M | −0.03 | 0.07 | 364.64 | −0.37 | 0.99 | −0.04 | 0.08 | 357.39 | −0.52 | 0.96 |
| 3M–6M | 0.02 | 0.07 | 363.85 | 0.30 | 0.99 | 0.03 | 0.07 | 357.19 | 0.40 | 0.96 |
| 4M–5M | −0.03 | 0.08 | 363.48 | −0.41 | 0.99 | −0.04 | 0.08 | 356.49 | −0.46 | 0.96 |
| 4M–6M | 0.02 | 0.07 | 363.57 | 0.23 | 0.99 | 0.03 | 0.08 | 356.61 | 0.44 | 0.96 |
| 5M–6M | 0.05 | 0.08 | 365.59 | 0.62 | 0.99 | 0.07 | 0.08 | 357.48 | 0.87 | 0.96 |
| Maternal Predictor | Slope (SE) | 95% CI | p-Value 2 | Slope (SE) | 95% CI | p-Value 2 |
|---|---|---|---|---|---|---|
| Leptin (pg/mL) | Leptin intake (ng/24 h) | |||||
| BMI (kg/m2) | 0.12 (0.02) | 0.09–0.15 | <0.001 | 0.11 (0.02) | 0.08–0.15 | <0.001 |
| FFM (kg) | 0.05 (0.01) | 0.02–0.07 | 0.001 | 0.05 (0.01) | 0.02–0.07 | 0.001 |
| FFMI (kg/m2) | 0.20 (0.04) | 0.12–0.28 | <0.001 | 0.19 (0.04) | 0.12–0.27 | <0.001 |
| FM (kg) | 0.07 (0.01) | 0.05–0.09 | <0.001 | 0.06 (0.01) | 0.04–0.08 | <0.001 |
| FMI (kg/m2) | 0.20 (0.03) | 0.15–0.25 | <0.001 | 0.19 (0.03) | 0.14–0.24 | <0.001 |
| % FM | 0.09 (0.02) | 0.06–0.12 | <0.001 | 0.08 (0.02) | 0.05–0.12 | <0.001 |
| FM/FFM | 3.55 (0.65) | 2.28–4.8 | <0.001 | 3.26 (0.64) | 2.00–4.53 | <0.001 |
| Adiponectin (ng/mL) | Adiponectin (µg/24 h) | |||||
| BMI (kg/m2) | −0.01 (0.01) | −0.02–0.01 | 0.408 | −0.01 (0.01) | −0.03–0.01 | 0.210 |
| FFM (kg) | 0.01 (0.01) | −0.00–0.02 | 0.251 | 0.01 (0.01) | −0.01–0.02 | 0.461 |
| FFMI (kg/m2) | 0.01 (0.02) | −0.02–0.05 | 0.456 | 0.01 (0.02) | −0.03–0.05 | 0.719 |
| FM (kg) | −0.01 (0.00) | −0.02–0.00 | 0.111 | −0.01 (0.01) | −0.02–−0.00 | 0.044 |
| FMI (kg/m2) | −0.02 (0.01) | −0.05–0.00 | 0.073 | −0.04 (0.02) | −0.07–−0.00 | 0.028 |
| % FM | −0.02 (0.01) | −0.03–−0.01 | 0.004 | −0.03 (0.01) | −0.05–−0.01 | 0.001 |
| FM/FFM | −0.76 (0.28) | −1.30–−0.21 | 0.007 | −1.05 (0.33) | −1.71–−0.39 | 0.002 |
| Insulin (µIU/mL) | Insulin intake, (mIU/24 h) | |||||
| BMI (kg/m2) | 0.05 (0.01) | 0.03–0.08 | <0.001 | 0.05 (0.01) | 0.02–0.07 | <0.001 |
| FFM (kg) | 0.02 (0.01) | 0.01–0.04 | 0.009 | 0.02 (0.01) | 0.00–0.04 | 0.015 |
| FFMI (kg/m2) | 0.09 (0.03) | 0.04–0.15 | 0.001 | 0.09 (0.03) | 0.03–0.14 | 0.002 |
| FM (kg) | 0.03 (0.01) | 0.01–0.04 | <0.001 | 0.02 (0.01) | 0.01–0.04 | 0.001 |
| FMI (kg/m2) | 0.08 (0.02) | 0.04–0.12 | <0.001 | 0.07 (0.02) | 0.03–0.11 | 0.001 |
| % FM | 0.03 (0.01) | 0.01–0.06 | 0.004 | 0.03 (0.01) | 0.00–0.05 | 0.029 |
| FM/FFM | 1.33 (0.46) | 0.42–2.25 | 0.004 | 1.04 (0.48) | 0.11–1.98 | 0.029 |
| Total lipids (g/L) | Total lipid intake, (g/24 h) | |||||
| BMI (kg/m2) | 0.01 (0.01) | −0.00–0.02 | 0.228 | −0.00 (0.01) | −0.01–0.01 | 0.984 |
| FFM (kg) | 0.01 (0.00) | 0.00–0.01 | 0.036 | 0.01 (0.01) | −0.00–0.02 | 0.302 |
| FFMI (kg/m2) | 0.02 (0.01) | 0.00–0.04 | 0.030 | 0.02 (0.02) | −0.01–0.05 | 0.312 |
| FM (kg) | 0.00 (0.00) | −0.01–0.01 | 0.789 | −0.00 (0.00) | −0.01–0.00 | 0.385 |
| FMI (kg/m2) | 0.00 (0.01) | −0.01–0.02 | 0.868 | −0.01 (0.01) | −0.04–0.01 | 0.342 |
| % FM | −0.00 (0.00) | −0.01–0.01 | 0.399 | −0.01 (0.01) | −0.03–0.00 | 0.067 |
| FM/FFM | −0.19 (0.18) | −0.53–0.16 | 0.295 | −0.50 (0.25) | −1.00–−0.00 | 0.050 |
References
- Christian, P.; Smith, E.R.; Lee, S.E.; Vargas, A.J.; Bremer, A.A.; Raiten, D.J. The need to study human milk as a biological system. Am. J. Clin. Nutr. 2021, 113, 1063–1072. [Google Scholar] [CrossRef]
- Donovan, S.M.; Aghaeepour, N.; Andres, A.; Azad, M.B.; Becker, M.; Carlson, S.E.; Jarvinen, K.M.; Lin, W.; Lonnerdal, B.; Slupsky, C.M.; et al. Evidence for human milk as a biological system and recommendations for study design-a report from “Breastmilk Ecology: Genesis of infant nutrition (BEGIN)” working group 4. Am. J. Clin. Nutr. 2023, 117 (Suppl. S1), S61–S86. [Google Scholar] [CrossRef]
- Groer, M.W. Editorial on human milk as a biological system. J. Hum. Lact. 2023, 39, 191–193. [Google Scholar] [CrossRef]
- Gridneva, Z.; Rea, A.; Hepworth, A.R.; Ward, L.C.; Lai, C.T.; Hartmann, P.E.; Geddes, D.T. Relationships between breastfeeding patterns and maternal and infant body composition over the first 12 months of lactation. Nutrients 2018, 10, 45. [Google Scholar] [CrossRef]
- Sadr Dadres, G.; Whitaker, K.M.; Haapala, J.L.; Foster, L.; Smith, K.D.; Teague, A.M.; Jacobs, D.R., Jr.; Kharbanda, E.O.; McGovern, P.M.; Schoenfuss, T.C.; et al. Relationship of maternal weight status before, during, and after pregnancy with breast milk hormone concentrations. Obesity 2019, 27, 621–628. [Google Scholar] [CrossRef] [PubMed]
- Martin, L.J.; Woo, J.G.; Geraghty, S.R.; Altaye, M.; Davidson, B.S.; Banach, W.; Dolan, L.M.; Ruiz-Palacios, G.M.; Morrow, A.L. Adiponectin is present in human milk and is associated with maternal factors. Am. J. Clin. Nutr. 2006, 83, 1106–1111. [Google Scholar] [CrossRef]
- Ley, S.H.; Hanley, A.J.; Sermer, M.; Zinman, B.; O’Connor, D.L. Associations of prenatal metabolic abnormalities with insulin and adiponectin concentrations in human milk. Am. J. Clin. Nutr. 2012, 95, 867–874. [Google Scholar] [CrossRef]
- Siziba, L.P.; Lorenz, L.; Stahl, B.; Mank, M.; Marosvolgyi, T.; Decsi, T.; Rothenbacher, D.; Genuneit, J. Changes in human milk fatty acid composition during lactation: The Ulm SPATZ health study. Nutrients 2019, 11, 2842. [Google Scholar] [CrossRef] [PubMed]
- Daly, S.E.; Hartmann, P.E. Infant demand and milk supply. part 1: Infant demand and milk production in lactating women. J. Hum. Lact. 1995, 11, 21–26. [Google Scholar] [CrossRef]
- Fields, D.A.; Schneider, C.R.; Pavela, G. A narrative review of the associations between six bioactive components in breast milk and infant adiposity. Obesity 2016, 24, 1213–1221. [Google Scholar] [CrossRef] [PubMed]
- George, A.D.; Paul, S.; Wang, T.; Huynh, K.; Giles, C.; Mellett, N.; Duong, T.; Nguyen, A.; Geddes, D.; Mansell, T.; et al. Defining the lipid profiles of human milk, infant formula, and animal milk: Implications for infant feeding. Front. Nutr. 2023, 10, 1227340. [Google Scholar] [CrossRef] [PubMed]
- Bielicki, J.; Huch, R.; von Mandach, U. Time-course of leptin levels in term and preterm human milk. Eur. J. Endocrinol. 2004, 151, 271–276. [Google Scholar] [CrossRef] [PubMed]
- Ilcol, Y.O.; Hizli, Z.B.; Ozkan, T. Leptin concentration in breast milk and its relationship to duration of lactation and hormonal status. Int. Breastfeed. J. 2006, 1, 21. [Google Scholar] [CrossRef] [PubMed]
- Yu, X.; Rong, S.S.; Sun, X.; Ding, G.; Wan, W.; Zou, L.; Wu, S.; Li, M.; Wang, D. Associations of breast milk adiponectin, leptin, insulin and ghrelin with maternal characteristics and early infant growth: A longitudinal study. Br. J. Nutr. 2018, 120, 1380–1387. [Google Scholar] [CrossRef] [PubMed]
- Ozarda, Y.; Gunes, Y.; Tuncer, G.O. The concentration of adiponectin in breast milk is related to maternal hormonal and inflammatory status during 6 months of lactation. Clin. Chem. Lab. Med. 2012, 50, 911–917. [Google Scholar] [CrossRef] [PubMed]
- Leghi, G.E.; Netting, M.J.; Middleton, P.F.; Wlodek, M.E.; Geddes, D.T.; Muhlhausler, A.B.S. The impact of maternal obesity on human milk macronutrient composition: A systematic review and meta-analysis. Nutrients 2020, 12, 934. [Google Scholar] [CrossRef] [PubMed]
- Andreas, N.J.; Hyde, M.J.; Gale, C.; Parkinson, J.R.; Jeffries, S.; Holmes, E.; Modi, N. Effect of maternal body mass index on hormones in breast milk: A systematic review. PLoS ONE 2014, 9, e115043. [Google Scholar] [CrossRef] [PubMed]
- Hinde, K.; Foster, A.B.; Landis, L.M.; Rendina, D.; Oftedal, O.T.; Power, M.L. Daughter dearest: Sex-biased calcium in mother’s milk among rhesus macaques. Am. J. Phys. Anthropol. 2013, 151, 144–150. [Google Scholar] [CrossRef] [PubMed]
- Hinde, K. Richer milk for sons but more milk for daughters: Sex-biased investment during lactation varies with maternal life history in rhesus macaques. Am. J. Hum. Biol. 2009, 21, 512–519. [Google Scholar] [CrossRef]
- Hinde, K. First-time macaque mothers bias milk composition in favor of sons. Curr. Biol. 2007, 17, R958–R959. [Google Scholar] [CrossRef]
- Hinde, K.; Carpenter, A.J.; Clay, J.S.; Bradford, B.J. Holsteins favor heifers, not bulls: Biased milk production programmed during pregnancy as a function of fetal sex. PLoS ONE 2014, 9, e86169. [Google Scholar] [CrossRef]
- Galante, L.; Milan, A.M.; Reynolds, C.M.; Cameron-Smith, D.; Vickers, M.H.; Pundir, S. Sex-specific human milk composition: The role of infant sex in determining early life nutrition. Nutrients 2018, 10, 1194. [Google Scholar] [CrossRef]
- Khelouf, N.; Haoud, K.; Meziani, S.; Fizir, M.; Ghomari, F.N.; Khaled, M.B.; Kadi, N. Effect of infant’s gender and lactation period on biochemical and energy breast milk composition of lactating mothers from Algeria. J. Food Compos. Anal. 2023, 115, 104889. [Google Scholar] [CrossRef]
- Powe, C.E.; Knott, C.D.; Conklin-Brittain, N. Infant sex predicts breast milk energy content. Am. J. Hum. Biol. 2010, 22, 50–54. [Google Scholar] [CrossRef]
- Hahn, W.H.; Song, J.H.; Song, S.; Kang, N.M. Do gender and birth height of infant affect calorie of human milk? An association study between human milk macronutrient and various birth factors. J. Matern. Fetal Neonatal Med. 2017, 30, 1608–1612. [Google Scholar] [CrossRef]
- Quinn, E.A. No evidence for sex biases in milk macronutrients, energy, or breastfeeding frequency in a sample of Filipino mothers. Am. J. Phys. Anthropol. 2013, 152, 209–216. [Google Scholar] [CrossRef]
- Siziba, L.P.; Brenner, H.; Amitay, E.L.; Koenig, W.; Rothenbacher, D.; Genuneit, J. Potential sex differences in human milk leptin and their association with asthma and wheeze phenotypes: Results of the Ulm Birth Cohorts. Pediatr. Allergy Immunol. 2021, 32, 1663–1672. [Google Scholar] [CrossRef]
- Fields, D.A.; George, B.; Williams, M.; Whitaker, K.; Allison, D.B.; Teague, A.; Demerath, E.W. Associations between human breast milk hormones and adipocytokines and infant growth and body composition in the first 6 months of life. Pediatr. Obes. 2017, 12 (Suppl. S1), 78–85. [Google Scholar] [CrossRef]
- Chu, S.Y.; Callaghan, W.M.; Kim, S.Y.; Schmid, C.H.; Lau, J.; England, L.J.; Dietz, P.M. Maternal obesity and risk of gestational diabetes mellitus. Diabetes Care 2007, 30, 2070–2076. [Google Scholar] [CrossRef]
- Yao, D.; Chang, Q.; Wu, Q.J.; Gao, S.Y.; Zhao, H.; Liu, Y.S.; Jiang, Y.T.; Zhao, Y.H. Relationship between maternal central obesity and the risk of gestational diabetes mellitus: A systematic review and meta-analysis of cohort studies. J. Diabetes Res. 2020, 2020, 6303820. [Google Scholar] [CrossRef]
- Galante, L.; Lagstrom, H.; Vickers, M.H.; Reynolds, C.M.; Rautava, S.; Milan, A.M.; Cameron-Smith, D.; Pundir, S. Sexually dimorphic associations between maternal factors and human milk hormonal concentrations. Nutrients 2020, 12, 152. [Google Scholar] [CrossRef] [PubMed]
- Suwaydi, M.A.; Zhou, X.; Perrella, S.L.; Wlodek, M.E.; Lai, C.T.; Gridneva, Z.; Geddes, D.T. The Impact of Gestational Diabetes Mellitus on Human Milk Metabolic Hormones: A Systematic Review. Nutrients 2022, 14, 3620. [Google Scholar] [CrossRef] [PubMed]
- Suwaydi, M.A.; Wlodek, M.E.; Lai, C.T.; Prosser, S.A.; Geddes, D.T.; Perrella, S.L. Delayed secretory activation and low milk production in women with gestational diabetes: A case series. BMC Pregnancy Childbirth 2022, 22, 350. [Google Scholar] [CrossRef] [PubMed]
- Riddle, S.W.; Nommsen-Rivers, L.A. A Case Control Study of Diabetes During Pregnancy and Low Milk Supply. Breastfeed. Med. 2016, 11, 80–85. [Google Scholar] [CrossRef] [PubMed]
- Herskin, C.W.; Stage, E.; Barfred, C.; Emmersen, P.; Ladefoged Nichum, V.; Damm, P.; Mathiesen, E.R. Low prevalence of long-term breastfeeding among women with type 2 diabetes. J. Matern. Fetal Neonatal Med. 2016, 29, 2513–2518. [Google Scholar] [CrossRef] [PubMed]
- Gridneva, Z.; Kugananthan, S.; Rea, A.; Lai, C.T.; Ward, L.C.; Murray, K.; Hartmann, P.E.; Geddes, D.T. Human milk adiponectin and leptin and infant body composition over the first 12 months of lactation. Nutrients 2018, 10, 1125. [Google Scholar] [CrossRef] [PubMed]
- Cheema, A.S.; Stinson, L.F.; Rea, A.; Lai, C.T.; Payne, M.S.; Murray, K.; Geddes, D.T.; Gridneva, Z. Human milk lactose, insulin, and glucose relative to infant body composition during exclusive breastfeeding. Nutrients 2021, 13, 3724. [Google Scholar] [CrossRef] [PubMed]
- WHO. WHO Anthro Survey Analyser, 3.2.2; WHO: Geneva, Switzerland, 2011. [Google Scholar]
- Suwaydi, M.A.; Lai, C.T.; Rea, A.; Gridneva, Z.; Perrella, S.L.; Wlodek, M.E.; Geddes, D.T. Circadian variation in human milk hormones and macronutrients. Nutrients 2023, 15, 3729. [Google Scholar] [CrossRef] [PubMed]
- Meier, P.P.; Engstrom, J.L.; Zuleger, J.L.; Motykowski, J.E.; Vasan, U.; Meier, W.A.; Hartmann, P.E.; Williams, T.M. Accuracy of a user-friendly centrifuge for measuring creamatocrits on mothers’ milk in the clinical setting. Breastfeed. Med. 2006, 1, 79–87. [Google Scholar] [CrossRef]
- Kent, J.C.; Mitoulas, L.R.; Cregan, M.D.; Ramsay, D.T.; Doherty, D.A.; Hartmann, P.E. Volume and frequency of breastfeedings and fat content of breast milk throughout the day. Pediatrics 2006, 117, e387–e395. [Google Scholar] [CrossRef]
- Arthur, P.G.; Hartmann, P.E.; Smith, M. Measurement of the milk intake of breast-fed infants. J. Pediatr. Gastroenterol. Nutr. 1987, 6, 758–763. [Google Scholar] [CrossRef]
- Neville, M.C.; Keller, R.; Seacat, J.; Lutes, V.; Neifert, M.; Casey, C.; Allen, J.; Archer, P. Studies in human lactation: Milk volumes in lactating women during the onset of lactation and full lactation. Am. J. Clin. Nutr. 1988, 48, 1375–1386. [Google Scholar] [CrossRef] [PubMed]
- Kent, J.C.; Hepworth, A.R.; Sherriff, J.L.; Cox, D.B.; Mitoulas, L.R.; Hartmann, P.E. Longitudinal changes in breastfeeding patterns from 1 to 6 months of lactation. Breastfeed. Med. 2013, 8, 401–407. [Google Scholar] [CrossRef] [PubMed]
- Rios-Leyvraz, M.; Yao, Q. The volume of breast milk intake in infants and young children: A systematic review and meta-analysis. Breastfeed. Med. 2023, 18, 188–197. [Google Scholar] [CrossRef] [PubMed]
- R Core Team. R: A Language and Environment for Statistical Computing; R Foundation for Statistical Computing: Vienna, Austria, 2023. [Google Scholar]
- Bates, D.; Mächler, M.; Bolker, B.; Walker, S. Fitting Linear Mixed-Effects Models Usinglme4. J. Stat. Softw. 2015, 67, 1–48. [Google Scholar] [CrossRef]
- Kuznetsova, A.; Brockhoff, P.B.; Christensen, R.H.B. lmerTest Package: Tests in Linear Mixed Effects Models. J. Stat. Softw. 2017, 82, 1–26. [Google Scholar] [CrossRef]
- Lenth, R.; Singmann, H.; Love, J.; Buerkner, P.; Herve, M. Package “Emmeans”. 2018. Available online: https://rvlenth.github.io/emmeans/ (accessed on 25 December 2023).
- Wickham, H. ggplot2: Elegant Graphics for Data Analysis; Springer: New York, NY, USA, 2016. [Google Scholar]
- Kassambara, A. ggpubr: ‘ggplot2’ Based Publication Ready Plots, R Package Version 0.6.0. 2023. Available online: https://rpkgs.datanovia.com/ggpubr/ (accessed on 14 January 2024).
- Bronsky, J.; Mitrova, K.; Karpisek, M.; Mazoch, J.; Durilova, M.; Fisarkova, B.; Stechova, K.; Prusa, R.; Nevoral, J. Adiponectin, AFABP, and leptin in human breast milk during 12 months of lactation. J. Pediatr. Gastroenterol. Nutr. 2011, 52, 474–477. [Google Scholar] [CrossRef]
- Schuster, S.; Hechler, C.; Gebauer, C.; Kiess, W.; Kratzsch, J. Leptin in maternal serum and breast milk: Association with infants’ body weight gain in a longitudinal study over 6 months of lactation. Pediatr. Res. 2011, 70, 633–637. [Google Scholar] [CrossRef]
- Andreas, N.J.; Hyde, M.J.; Herbert, B.R.; Jeffries, S.; Santhakumaran, S.; Mandalia, S.; Holmes, E.; Modi, N. Impact of maternal BMI and sampling strategy on the concentration of leptin, insulin, ghrelin and resistin in breast milk across a single feed: A longitudinal cohort study. BMJ Open 2016, 6, e010778. [Google Scholar] [CrossRef]
- Perez-Perez, A.; Toro, A.; Vilarino-Garcia, T.; Maymo, J.; Guadix, P.; Duenas, J.L.; Fernandez-Sanchez, M.; Varone, C.; Sanchez-Margalet, V. Leptin action in normal and pathological pregnancies. J. Cell Mol. Med. 2018, 22, 716–727. [Google Scholar] [CrossRef]
- Smith-Kirwin, S.M.; O’Connor, D.M.; De Johnston, J.; Lancey, E.D.; Hassink, S.G.; Funanage, V.L. Leptin expression in human mammary epithelial cells and breast milk. J. Clin. Endocrinol. Metab. 1998, 83, 1810–1813. [Google Scholar] [CrossRef] [PubMed]
- Butte, N.F.; Hopkinson, J.M.; Nicolson, M.A. Leptin in human reproduction: Serum leptin levels in pregnant and lactating women. J. Clin. Endocrinol. Metab. 1997, 82, 585–589. [Google Scholar] [CrossRef] [PubMed]
- Gidrewicz, D.A.; Fenton, T.R. A systematic review and meta-analysis of the nutrient content of preterm and term breast milk. BMC Pediatr. 2014, 14, 216. [Google Scholar] [CrossRef] [PubMed]
- Saarela, T.; Kokkonen, J.; Koivisto, M. Macronutrient and energy contents of human milk fractions during the first six months of lactation. Acta Paediatr. 2005, 94, 1176–1181. [Google Scholar] [CrossRef] [PubMed]
- Mitoulas, L.R.; Kent, J.C.; Cox, D.B.; Owens, R.A.; Sherriff, J.L.; Hartmann, P.E. Variation in fat, lactose and protein in human milk over 24 h and throughout the first year of lactation. Br. J. Nutr. 2002, 88, 29–37. [Google Scholar] [CrossRef] [PubMed]
- Ladyman, S.R.; Brooks, V.L. Central actions of insulin during pregnancy and lactation. J. Neuroendocrinol. 2021, 33, e12946. [Google Scholar] [CrossRef] [PubMed]
- Pang, W.W.; Hartmann, P.E. Initiation of human lactation: Secretory differentiation and secretory activation. J. Mammary Gland. Biol. Neoplasia 2007, 12, 211–221. [Google Scholar] [CrossRef] [PubMed]
- Boss, M.; Gardner, H.; Hartmann, P. Normal human lactation: Closing the gap. F1000Research 2018, 7, 801. [Google Scholar] [CrossRef] [PubMed]
- Jenness, R. The composition of human milk. Semin. Perinatol. 1979, 3, 225–239. [Google Scholar]
- Daly, S.E.; Di Rosso, A.; Owens, R.A.; Hartmann, P.E. Degree of breast emptying explains changes in the fat content, but not fatty acid composition, of human milk. Exp. Physiol. 1993, 78, 741–755. [Google Scholar] [CrossRef]
- Kent, J.C.; Gardner, H.; Geddes, D.T. Breastmilk production in the first 4 weeks after birth of term infants. Nutrients 2016, 8, 756. [Google Scholar] [CrossRef] [PubMed]
- Sims, C.R.; Lipsmeyer, M.E.; Turner, D.E.; Andres, A. Human milk composition differs by maternal BMI in the first 9 months postpartum. Am. J. Clin. Nutr. 2020, 112, 548–557. [Google Scholar] [CrossRef] [PubMed]
- Kent, J.C.; Mitoulas, L.; Cox, D.B.; Owens, R.A.; Hartmann, P.E. Breast volume and milk production during extended lactation in women. Exp. Physiol. 1999, 84, 435–447. [Google Scholar] [CrossRef] [PubMed]
- Dewey, K.G.; Heinig, M.J.; Nommsen, L.A.; Lonnerdal, B. Maternal versus infant factors related to breast milk intake and residual milk volume: The DARLING study. Pediatrics 1991, 87, 829–837. [Google Scholar] [CrossRef] [PubMed]
- Gridneva, Z.; Rea, A.; Lai, C.T.; Tie, W.J.; Kugananthan, S.; Murray, K.; Hartmann, P.E.; Geddes, D.T. Development of visceral and subcutaneous-abdominal adipose tissue in breastfed infants during first year of lactation. Nutrients 2021, 13, 3294. [Google Scholar] [CrossRef] [PubMed]
- Gridneva, Z.; Rea, A.; Lai, C.T.; Tie, W.J.; Kugananthan, S.; Warden, A.H.; Perrella, S.L.; Murray, K.; Geddes, D.T. Human milk macronutrients and bioactive molecules and development of regional fat depots in western australian infants during the first 12 months of lactation. Life 2022, 12, 493. [Google Scholar] [CrossRef] [PubMed]
- Kon, I.Y.; Shilina, N.M.; Gmoshinskaya, M.V.; Ivanushkina, T.A. The study of breast milk IGF-1, leptin, ghrelin and adiponectin levels as possible reasons of high weight gain in breast-fed infants. Ann. Nutr. Metab. 2014, 65, 317–323. [Google Scholar] [CrossRef] [PubMed]
- George, A.D.; Gay, M.C.L.; Selvalatchmanan, J.; Torta, F.; Bendt, A.K.; Wenk, M.R.; Murray, K.; Wlodek, M.E.; Geddes, D.T. Healthy breastfeeding infants consume different quantities of milk fat globule membrane lipids. Nutrients 2021, 13, 2951. [Google Scholar] [CrossRef]
- Olga, L.; Vervoort, J.; van Diepen, J.A.; Gross, G.; Petry, C.J.; Prentice, P.M.; Chichlowski, M.; van Tol, E.A.F.; Hughes, I.A.; Dunger, D.B.; et al. Associations between breast milk intake volume, macronutrient intake and infant growth in a longitudinal birth cohort: The Cambridge Baby Growth and Breastfeeding Study (CBGS-BF). Br. J. Nutr. 2023, 130, 56–64. [Google Scholar] [CrossRef]
- Jensen, R.G. Lipids in human milk. Lipids 1999, 34, 1243–1271. [Google Scholar] [CrossRef]
- Suwaydi, M.A.; Gridneva, Z.; Perrella, S.L.; Wlodek, M.E.; Lai, C.T.; Geddes, D.T. Human milk metabolic hormones: Analytical methods and current understanding. Int. J. Mol. Sci. 2021, 22, 8708. [Google Scholar] [CrossRef]
- Daniel, A.I.; Shama, S.; Ismail, S.; Bourdon, C.; Kiss, A.; Mwangome, M.; Bandsma, R.H.J.; O’Connor, D.L. Maternal BMI is positively associated with human milk fat: A systematic review and meta-regression analysis. Am. J. Clin. Nutr. 2021, 113, 1009–1022. [Google Scholar] [CrossRef]
- Miralles, O.; Sanchez, J.; Palou, A.; Pico, C. A physiological role of breast milk leptin in body weight control in developing infants. Obesity 2006, 14, 1371–1377. [Google Scholar] [CrossRef]
- Christensen, S.H.; Lewis, J.I.; Larnkjaer, A.; Frokiaer, H.; Allen, L.H.; Molgaard, C.; Michaelsen, K.F. Associations between maternal adiposity and appetite-regulating hormones in human milk are mediated through maternal circulating concentrations and might affect infant outcomes. Front. Nutr. 2022, 9, 1025439. [Google Scholar] [CrossRef]
- Weyermann, M.; Beermann, C.; Brenner, H.; Rothenbacher, D. Adiponectin and leptin in maternal serum, cord blood, and breast milk. Clin. Chem. 2006, 52, 2095–2102. [Google Scholar] [CrossRef]
- Savino, F.; Lupica, M.M.; Benetti, S.; Petrucci, E.; Liguori, S.A.; Cordero Di Montezemolo, L. Adiponectin in breast milk: Relation to serum adiponectin concentration in lactating mothers and their infants. Acta Paediatr. 2012, 101, 1058–1062. [Google Scholar] [CrossRef]
- Arita, Y.; Kihara, S.; Ouchi, N.; Takahashi, M.; Maeda, K.; Miyagawa, J.; Hotta, K.; Shimomura, I.; Nakamura, T.; Miyaoka, K.; et al. Paradoxical decrease of an adipose-specific protein, adiponectin, in obesity. Biochem. Biophys. Res. Commun. 1999, 257, 79–83. [Google Scholar] [CrossRef] [PubMed]
- Bzikowska-Jura, A.; Sobieraj, P.; Szostak-Wegierek, D.; Wesolowska, A. Impact of infant and maternal factors on energy and macronutrient composition of human milk. Nutrients 2020, 12, 2591. [Google Scholar] [CrossRef]
- Italianer, M.F.; Naninck, E.F.G.; Roelants, J.A.; van der Horst, G.T.J.; Reiss, I.K.M.; Goudoever, J.B.V.; Joosten, K.F.M.; Chaves, I.; Vermeulen, M.J. Circadian variation in human milk composition, a systematic review. Nutrients 2020, 12, 2328. [Google Scholar] [CrossRef]
- Ballard, O.; Morrow, A.L. Human milk composition: Nutrients and bioactive factors. Pediatr. Clin. North. Am. 2013, 60, 49–74. [Google Scholar] [CrossRef]
- Honoré, K.D.; Bruun, S.; Möller, S.; Michaelsen, K.F.; Husby, S.; Zachariassen, G. Macronutrient content in human milk is not affected by infant’s sex. Proceedings 2023, 93, 18. [Google Scholar] [CrossRef]
- Mangel, L.; Morag, S.; Mandel, D.; Marom, R.; Moran-Lev, H.; Lubetzky, R. The effect of infant’s sex on human milk macronutrients content: An observational study. Breastfeed. Med. 2020, 15, 568–571. [Google Scholar] [CrossRef]
- Fischer Fumeaux, C.J.; Garcia-Rodenas, C.L.; De Castro, C.A.; Courtet-Compondu, M.C.; Thakkar, S.K.; Beauport, L.; Tolsa, J.F.; Affolter, M. Longitudinal analysis of macronutrient composition in preterm and term human milk: A prospective cohort study. Nutrients 2019, 11, 1525. [Google Scholar] [CrossRef]
- Fujita, M.; Roth, E.; Lo, Y.J.; Hurst, C.; Vollner, J.; Kendell, A. In poor families, mothers’ milk is richer for daughters than sons: A test of Trivers-Willard hypothesis in agropastoral settlements in Northern Kenya. Am. J. Phys. Anthropol. 2012, 149, 52–59. [Google Scholar] [CrossRef]
- Hosseini, M.; Valizadeh, E.; Hosseini, N.; Khatibshahidi, S.; Raeisi, S. The role of infant sex on human milk composition. Breastfeed. Med. 2020, 15, 341–346. [Google Scholar] [CrossRef]
- Thakkar, S.K.; Giuffrida, F.; Cristina, C.H.; De Castro, C.A.; Mukherjee, R.; Tran, L.A.; Steenhout, P.; Lee Le, Y.; Destaillats, F. Dynamics of human milk nutrient composition of women from Singapore with a special focus on lipids. Am. J. Hum. Biol. 2013, 25, 770–779. [Google Scholar] [CrossRef] [PubMed]
- Kaya, A.; Orbak, Z.; Polat, I.; Polat, H.; Gumusdere, M. Leptin and neuropeptide Y levels in newborns. J. Pediatr. Endocrinol. Metab. 2016, 29, 21–25. [Google Scholar] [CrossRef] [PubMed]
- Young, B.E.; Patinkin, Z.; Palmer, C.; de la Houssaye, B.; Barbour, L.A.; Hernandez, T.; Friedman, J.E.; Krebs, N.F. Human milk insulin is related to maternal plasma insulin and BMI: But other components of human milk do not differ by BMI. Eur. J. Clin. Nutr. 2017, 71, 1094–1100. [Google Scholar] [CrossRef]
- Chan, D.; Goruk, S.; Becker, A.B.; Subbarao, P.; Mandhane, P.J.; Turvey, S.E.; Lefebvre, D.; Sears, M.R.; Field, C.J.; Azad, M.B. Adiponectin, leptin and insulin in breast milk: Associations with maternal characteristics and infant body composition in the first year of life. Int. J. Obes. 2018, 42, 36–43. [Google Scholar] [CrossRef] [PubMed]
- Eckart, E.K.; Peck, J.D.; Kharbanda, E.O.; Nagel, E.M.; Fields, D.A.; Demerath, E.W. Infant sex differences in human milk intake and composition from 1- to 3-month post-delivery in a healthy United States cohort. Ann. Hum. Biol. 2021, 48, 455–465. [Google Scholar] [CrossRef]
- Weyermann, M.; Brenner, H.; Rothenbacher, D. Adipokines in human milk and risk of overweight in early childhood: A prospective cohort study. Epidemiology 2007, 18, 722–729. [Google Scholar] [CrossRef] [PubMed]
- Simon, L.; Borrego, P.; Darmaun, D.; Legrand, A.; Roze, J.C.; Chauty-Frondas, A. Effect of sex and gestational age on neonatal body composition. Br. J. Nutr. 2013, 109, 1105–1108. [Google Scholar] [CrossRef] [PubMed]
- Davis, S.M.; Kaar, J.L.; Ringham, B.M.; Hockett, C.W.; Glueck, D.H.; Dabelea, D. Sex differences in infant body composition emerge in the first 5 months of life. J. Pediatr. Endocrinol. Metab. 2019, 32, 1235–1239. [Google Scholar] [CrossRef] [PubMed]
- Rigo, J.; Nyamugabo, K.; Picaud, J.C.; Gerard, P.; Pieltain, C.; De Curtis, M. Reference values of body composition obtained by dual energy X-Ray absorptiometry in preterm and term Neonates. J. Pediatr. Gastroenterol. Nutr. 1998, 27, 184–190. [Google Scholar] [PubMed]
- Butte, N.F.; Hopkinson, J.M.; Wong, W.W.; Smith, E.O.; Ellis, K.J. Body composition during the first 2 years of life: An updated reference. Pediatr. Res. 2000, 47, 578–585. [Google Scholar] [CrossRef]
- Eriksson, B.; Lof, M.; Forsum, E. Body composition in full-term healthy infants measured with air displacement plethysmography at 1 and 12 weeks of age. Acta Paediatr. 2010, 99, 563–568. [Google Scholar] [CrossRef] [PubMed]
- Carberry, A.E.; Colditz, P.B.; Lingwood, B.E. Body composition from birth to 4.5 months in infants born to non-obese women. Pediatr. Res. 2010, 68, 84–88. [Google Scholar] [CrossRef]
| Baseline Characteristics n = 82 | Mean ± SD (Min–Max), or n (%) |
|---|---|
| Maternal age at birth (years) | 32.7 ± 5.0 (17.0–46.0) |
| Parity | |
| Primiparous | 20 (24.4%) |
| Multiparous | |
| 2 | 36 (43.9%) |
| 3 | 23 (28.7%) |
| 4 | 3 (3%) |
| Race | |
| Caucasian | 70 (85.4%) |
| Asian | 7 (8.5%) |
| Other | 5 (6.1%) |
| Infant gestational age (weeks) | 39.3 ± 1.2 (36.6–41.2) |
| Birth weight (kg) | 3.5 ± 0.4 (2.4–4.3) |
| Height (cm) | 50.9 ± 2.5 (45.0–59.0) |
| Mode of delivery | |
| Vaginal | 57 (72%) |
| Caesarean section | 25 (28%) |
| Infant sex 2 | |
| Male | 46 (54.8%) |
| Female | 38 (45.2%) |
| 24 h milk intake at 3 months (mL) 3 | 754.5 ± 193.6 (337.9–1304.9) |
| Breastfeeding mode at 1 week | |
| Exclusive | 75 (91.5%) |
| Mixed breastfeeding | 7 (8.5%) |
| Maternal Characteristics | 3 Months, n = 76 | 6 Months, n = 56 | p-Value |
|---|---|---|---|
| Weight (kg) | 71.6 ± 14.6 (47.5–119.8) | 70.1 ± 14.9 (47.4–121.6) | 0.60 2 |
| BMI (kg/m2) | 26.1 ± 5.0 (17.6–42.0) | 25.8 ± 5.5 (16.2–42.6) | 0.57 2 |
| FFM (kg) | 45.6 ± 7.5 (33.9–70.9) | 44.6 ± 6.7 (33.4–66.5) | 0.63 2 |
| FFMI (kg/m2) | 16.6 ± 2.4 (11.6–24.0) | 16.4 ± 2.4 (10.5–22.2) | 0.59 2 |
| FM (kg) | 26.0 ± 8.9 (13.2–53.9) | 25.5 ± 9.1 (12.0–57.6) | 0.92 2 |
| FMI (kg/m2) | 9.5 ± 3.2 (4.8–19.8) | 9.4 ± 3.4 (4.6–21.2) | 0.91 2 |
| %FM | 35.6 ± 5.7 (19.2–53.4) | 35.6 ± 5.5 (22.9–49.7) | 0.82 2 |
| FM/FFM | 0.6 ± 0.1 (0.2–1.1) | 0.6 ± 0.1 (0.3–1.0) | 0.68 3 |
| Infant Characteristics | 3 Months, n = 69 | 6 Months, n = 51 | |
| Height (cm) | 61.1 ± 2.4 (55.5–67.0) | 67.6 ± 2.6 (62.5–74.5) | <0.001 3 |
| Weight (kg) | 6.2 ± 0.8 (4.1–8.4) | 7.8 ± 1.0 (5.4–10.8) | <0.001 3 |
| BMI (kg/m2) | 16.5 ± 1.4 (12.3–19.9) | 16.9 ± 1.5 (13.0–21.4) | 0.07 3 |
| FFM (kg) | 4.6 ± 0.4 (3.8–5.9) | 5.4 ± 0.6 (4.1–7.2) | <0.001 3 |
| FFMI (kg/m2) | 15.1 ± 1.1 (13.2–17.6) | 16.0 ± 1.4 (13.0–19.4) | <0.001 3 |
| FM (kg) | 1.6 ± 0.3 (0.8–2.5) | 2.3 ± 0.4 (1.3–3.6) | <0.001 3 |
| FMI (kg/m2) | 5.3 ± 0.8 (3.0–7.5) | 6.9 ± 1.1 (3.9–9.7) | <0.001 3 |
| %FM | 25.9 ± 2.3 (18.0–31.1) | 29.9 ± 2.2 (22.0–33.7) | <0.001 2 |
| FM/FFM | 0.4 ± 0.0 (0.2–0.5) | 0.4 ± 0.0 (0.3–0.5) | <0.001 2 |
| BMIFA | −0.1 ± 0.9 (−3.4–2.0) | −0.2 ± 1.1 (−3.5–2.5) | 0.92 2 |
| LFA | 0.2 ± 1.1 (−3.1–2.8) | 0.4 ± 1.1 (−1.3–3.3) | 0.36 2 |
| WFA | 0.0 ± 0.9 (−2.8–2.5) | 0.1 ± 1.1 (−2.7–2.9) | 0.31 2 |
| WFL | −0.1 ± 1.0 (−3.6–2.5) | −0.1 ± 1.1 (−3.5–2.6) | 0.55 2 |
| Components | 2–5 Days n = 76 | 1 Month n = 79 | 2 Months n = 75 | 3 Months n = 78 | 4 Months n = 68 | 5 Months n = 59 | 6 Months n = 62 | p-Value 2 | p-Value 3 |
|---|---|---|---|---|---|---|---|---|---|
| Concentrations | |||||||||
| Leptin (pg/mL) | 485.9 ± 535.7, 294.8 (181.7–573.8) | 429.3 ± 421.8, 243.3 (166.1–573.4) | 329.9 ± 333.2, 200.0 (101.7–466.3) | 342.1 ± 415.6, 175.4 (78.9–477.0) | 280.0 ± 313.3, 116.3 (59.9–421.7) | 254.9 ± 285.3, 132.0 (62.5–369.3) | 250.6 ± 244.7, 152.9 (61.5–411.7) | <0.001 | <0.001 |
| Adiponectin (ng/mL) | 22.1 ± 19.2, 16.6 (12.8–22.8) | 15.2 ± 6.2, 14.4 (11.0–18.5) | 12.7 ± 4.7, 11.9 (9.5–15.6) | 12.3 ± 6.5, 11.3 (8.6–14.4) | 14.3 ± 16.9, 10.6 (8.0–14.3) | 13.2 ± 8.1, 11.2 (8.8–15.7) | 11.6 ± 5.5, 10.0 (7.7–14.6) | <0.001 | <0.001 |
| Insulin (µIU/mL) | 18.8 ± 32.5, 13.7 (5.3–20.2) | 15.6 ± 9.4, 15.0 (9.0–20.4) | 15.5 ± 10.8, 14.2 (8.9–21.0) | 14.9 ± 11.0, 12.6 (6.0–20.4) | 13.0 ± 12.0, 9.8 (6.1–18.1) | 15.5 ± 11.8, 13.3 (5.9–23.0) | 13.6 ± 16.2, 9.8 (3.6–16.1) | 0.03 | 0.8 |
| Total lipids (g/L) | 43.4 ± 14.9, 42.7 (31.7–52.0) | 48.1 ± 16.6, 44.5 (37.7–54.9) | 48.4 ± 16.3, 45.5 (37.3–57.7) | 50.8 ± 22.8, 48.4 (33.6–60.8) | 49.5 ± 20.9, 49.5 (34.4–61.7) | 51.7 ± 22.7, 49.1 (37.0–64.1) | 47.5 ± 20.5, 44.1 (34.0–58.1) | 0.48 | 1.0 |
| Intakes | |||||||||
| Leptin (ng/24 h) | 234.9 ± 259.0, 142.5 (87.8–277.4) | 309.5 ± 295.5, 182.0 (112.9–409.8) | 238.9 ± 237.6, 146.4 (85.5–322.0) | 243.4 ± 290.8, 111.9 (60.3–363.0) | 196.6 ± 208.6, 112.7 (57.1–295.2) | 182.9 ± 199.2, 112.6 (51.6–259.4) | 174.5 ± 168.1, 111.0 (48.0–261.0) | <0.001 | <0.001 |
| Adiponectin (µg/24 h) | 10.7 ± 9.3, 8.0 (6.2–11.0) | 11.6 ± 5.8, 10.0 (7.4–14.3) | 9.8 ± 4.6, 9.5 (6.6–12.2) | 9.5 ± 6.1, 8.6 (5.3–11.3) | 11.3 ± 15.2, 8.6 (5.5–10.8) | 10.2 ± 7.0, 8.6 (6.6–12.0) | 8.8 ± 5.2, 7.2 (5.3–10.8) | <0.001 | 0.001 |
| Insulin (mIU/24 h) | 9.1 ± 15.7, 6.6 (2.6–9.8) | 11.7 ± 7.6, 10.4 (6.3–15.3) | 11.5 ± 8.1, 10.4 (6.1–15.8) | 10.9 ± 8.1, 9.8 (4.4–13.9) | 10.0 ± 9.7, 7.7 (4.6–12.5) | 11.7 ± 8.8, 9.3 (4.2–18.1) | 9.8 ± 12.1, 6.3 (2.5–11.8) | <0.001 | 0.001 |
| Total lipids (g/24 h) | 21.0 ± 7.2, 20.6 (15.3–25.2) | 36.5 ± 16.0, 32.1 (25.1–43.3) | 36.7 ± 15.5, 35.9 (26.6–42.8) | 38.7 ± 20.3, 34.7 (23.8–45.7) | 38.1 ± 17.8, 33.5 (25.3–46.8) | 40.6 ± 21.0, 39.1 (29.5–46.0) | 35.3 ± 16.8, 35.3 (22.6–44.3) | <0.001 | <0.001 |
| Predictors | Leptin | Adiponectin | Insulin | Total Lipids | ||||||||||||
|---|---|---|---|---|---|---|---|---|---|---|---|---|---|---|---|---|
| Base Model | Adjusted Model | Base Model | Adjusted Model | Base Model | Adjusted Model | Base Model | Adjusted Model | |||||||||
| β (SE) | p-Value 2 | β (SE) | p-Value 3 | β (SE) | p-Value 2 | β (SE) | p-Value 3 | β (SE) | p-Value 2 | β (SE) | p-Value 3 | β (SE) | p-Value 2 | β (SE) | p-Value 3 | |
| Concentrations | ||||||||||||||||
| Intercept | 5.76 (0.13) | 3.87 (0.41) | 2.90 (0.05) | 3.13 (0.18) | 2.45 (0.10) | 1.42 (0.30) | 3.71 (0.05) | 3.74 (0.13) | ||||||||
| Month 1 | −0.09 (0.11) | 0.40 | −0.05 (0.11) | 1.0 | −0.26 (0.06) | <0.001 | −0.18 (0.06) | 0.007 | 0.08 (0.12) | 1.0 | 0.16 (0.12) | 1.0 | 0.11 (0.06) | 0.37 | 0.12 (0.07) | 0.8 |
| Month 2 | −0.42 (0.11) | <0.001 | −0.36 (0.12) | 0.01 | −0.42 (0.06) | <0.001 | −0.35 (0.06) | <0.001 | −0.01 (0.13) | 1.0 | 0.11 (0.12) | 1.0 | 0.12 (0.06) | 0.37 | 0.10 (0.07) | 1.0 |
| Month 3 | −0.64 (0.11) | <0.001 | −0.52 (0.11) | <0.001 | −0.48 (0.06) | <0.001 | −0.38 (0.06) | <0.001 | −0.06 (0.12) | 1.0 | 0.13 (0.12) | 1.0 | 0.12 (0.06) | 0.37 | 0.10 (0.07) | 1.0 |
| Month 4 | −0.75 (0.11) | <0.001 | −0.68 (0.12) | <0.001 | −0.47 (0.06) | <0.001 | −0.39 (0.06) | <0.001 | −0.21 (0.13) | 0.4 | −0.03 (0.13) | 1.0 | 0.10 (0.07) | 0.37 | 0.10 (0.07) | 1.0 |
| Month 5 | −0.88 (0.12) | <0.001 | −0.80 (0.12) | <0.001 | −0.45 (0.06) | <0.001 | −0.38 (0.06) | <0.001 | −0.10 (0.13) | 1.0 | 0.02 (0.13) | 1.0 | 0.12 (0.07) | 0.37 | 0.13 (0.08) | 0.8 |
| Month 6 | −0.81 (0.11) | <0.001 | −0.74 (0.12) | <0.001 | −0.54 (0.06) | <0.001 | −0.46 (0.06) | <0.001 | −0.33 (0.13) | 0.07 | −0.06 (0.13) | 1.0 | 0.06 (0.07) | 0.37 | 0.08 (0.07) | 1.0 |
| Intakes | ||||||||||||||||
| Intercept | 5.02 (0.13) | <0.001 | 3.22 (0.41) | <0.001 | 2.16 (0.06) | <0.001 | 2.49 (0.21) | <0.001 | 1.71 (0.11) | <0.001 | 0.78 (0.31) | 0.073 | 2.96 (0.06) | <0.001 | 3.10 (0.17) | <0.001 |
| Month 1 | 0.34 (0.11) | 0.005 | 0.38 (0.11) | 0.010 | 0.18 (0.06) | 0.015 | 0.24 (0.06) | <0.001 | 0.51 (0.12) | <0.001 | 0.59 (0.12) | <0.001 | 0.54 (0.07) | <0.001 | 0.55 (0.07) | <0.001 |
| Month 2 | 0.02 (0.11) | 0.854 | 0.07 (0.12) | 1.00 | 0.02 (0.06) | 1.00 | 0.08 (0.06) | 1.00 | 0.43 (0.13) | 0.004 | 0.54 (0.13) | <0.001 | 0.55 (0.07) | <0.001 | 0.53 (0.07) | <0.001 |
| Month 3 | −0.21 (0.11) | 0.098 | −0.09 (0.11) | 1.00 | −0.05 (0.06) | 1.00 | 0.04 (0.06) | 1.00 | 0.37 (0.12) | 0.011 | 0.56 (0.12) | <0.001 | 0.55 (0.07) | <0.001 | 0.53 (0.07) | <0.001 |
| Month 4 | −0.31 (0.11) | 0.018 | −0.25 (0.12) | 0.32 | −0.03 (0.06) | 1.00 | 0.05 (0.06) | 1.00 | 0.22 (0.13) | 0.18 | 0.40 (0.13) | 0.018 | 0.54 (0.07) | <0.001 | 0.54 (0.08) | <0.001 |
| Month 5 | −0.44 (0.12) | 0.001 | −0.37 (0.12) | 0.026 | −0.01 (0.06) | 1.00 | 0.05 (0.07) | 1.00 | 0.34 (0.13) | 0.03 | 0.45 (0.13) | 0.006 | 0.57 (0.07) | <0.001 | 0.57 (0.08) | <0.001 |
| Month 6 | −0.38 (0.12) | 0.004 | −0.32 (0.13) | 0.10 | −0.11 (0.06) | 0.34 | −0.04 (0.07) | 1.00 | 0.09 (0.13) | 0.51 | 0.35 (0.14) | 0.06 | 0.49 (0.07) | <0.001 | 0.50 (0.08) | <0.001 |
| Predictor | Slope (SE) | 95% CI | p-Value 2 | p-Value 3 |
|---|---|---|---|---|
| BMI (kg/m2) | ||||
| Leptin (ng/24 h) | −0.0009 (0.0006) | −0.0020–0.0003 | 0.146 | 0.019 |
| Adiponectin (µg/24 h) | 0.0300 (0.0247) | −0.0191–0.0791 | 0.229 | 0.042 4 |
| Insulin (mIU/24 h) | −0. 0019 (0.0222) | −0.0461–0.0422 | 0.931 | 0.027 4 |
| Total lipids (g/24 h) | 0.0321 (0.0103) | 0.0116–0.0526 | 0.002 | 0.105 |
| Milk intake (mL/24 h) | 0.0028 (0.0008) | 0.0012–0.0044 | 0.001 | 0.095 |
| FFM (kg) | ||||
| Leptin (ng/24 h) | −0.0003 (0.0002) | −0.0007–0.0001 | 0.158 | <0.001 4 |
| Adiponectin (µg/24 h) | 0.0091 (0.0081) | −0.0069–0.0251 | 0.262 | <0.001 4 |
| Insulin (mIU/24 h) | 0.0011 (0.0072) | −0.0133–0.0155 | 0.878 | <0.001 4 |
| Total lipids (g/24 h) | 0.0077 (0.0034) | 0.0008–0.0145 | 0.028 | <0.001 4 |
| Milk intake (mL/24 h) | 0.0010 (0.0003) | 0.0004–0.0015 | 0.002 | <0.001 4 |
| FFMI (kg/m2) | ||||
| Leptin (ng/24 h) | −0.0007 (0.0005) | −0.0016–0.0002 | 0.107 | <0.001 4 |
| Adiponectin (µg/24 h) | 0.0283 (0.0189) | −0.0092–0.0659 | 0.137 | <0.001 4 |
| Insulin (mIU/24 h) | 0.0009 (0.0171) | −0.0330–0.0349 | 0.957 | <0.001 4 |
| Total lipids (g/24 h) | 0.0236 (0.0080) | 0.0076–0.0395 | 0.004 | <0.001 4 |
| Milk intake (mL/24 h) | 0.0021 (0.0006) | 0.0008–0.0034 | 0.001 | <0.001 4 |
| FM (kg) | ||||
| Leptin (ng/24 h) | −0.0002 (0.0002) | −0.0006–0.0001 | 0.171 | 0.168 |
| Adiponectin (µg/24 h) | 0.0055 (0.0067) | −0.0079–0.0189 | 0.416 | 0.230 |
| Insulin (mIU/24 h) | −0.0005 (0.0060) | −0.0125–0.0115 | 0.937 | 0.193 |
| Total lipids (g/24 h) | 0.0072 (0.0028) | 0.0016–0.0129 | 0.013 | 0.415 |
| Milk intake (mL/24 h) | 0.0008 (0.0002) | 0.0004–0.0013 | 0.001 | 0.466 |
| FMI (kg/m2) | ||||
| Leptin (ng/24 h) | −0.0007 (0.0005) | −0.0016–0.0002 | 0.128 | 0.403 |
| Adiponectin (µg/24 h) | 0.0159 (0.0182) | −0.0203–0.0520 | 0.386 | 0.521 |
| Insulin (mIU/24 h) | −0.0037 (0.0163) | −0.0361–0.0287 | 0.820 | 0.461 |
| Total lipids (g/24 h) | 0.0219 (0.0076) | 0.0067–0.0370 | 0.005 | 0.882 |
| Milk intake (mL/24 h) | 0.0023 (0.0006) | 0.0010–0.0036 | 0.001 | 0.911 |
| %FM | ||||
| Leptin (ng/24 h) | −0.0016 (0.0010) | −0.0036–0.0004 | 0.123 | 0.055 |
| Adiponectin (µg/24 h) | 0.0305 (0.0415) | −0.0519–0.1129 | 0.463 | 0.039 5 |
| Insulin (mIU/24 h) | 0.0100 (0.0370) | −0.0636–0.0836 | 0.788 | 0.061 |
| Total lipids (g/24 h) | 0.0540 (0.0172) | 0.0198–0.0882 | 0.002 | 0.005 5 |
| Milk intake (mL/24 h) | 0.0055 (0.0014) | 0.0027–0.0083 | <0.001 | 0.004 5 |
| FM/FFM | ||||
| Leptin (ng/24 h) | −0.00003 (0.00002) | −0.00007–0.00001 | 0.136 | 0.039 5 |
| Adiponectin (µg/24 h) | 0.0006 (0.0008) | −0.0010–0.0021 | 0.455 | 0.028 5 |
| Insulin (mIU/24 h) | 0.0002 (0.0007) | −0.0012–0.0016 | 0.783 | 0.045 5 |
| Total lipids (g/24 h) | 0.0010 (0.0003) | 0.0004–0.0017 | 0.002 | 0.003 5 |
| Milk intake (mL/24 h) | 0.00010 (0.00003) | 0.00005–0.00015 | <0.001 | 0.003 5 |
| BMIFA | ||||
| Leptin (ng/24 h) | −0.0006 (0.0004) | −0.0014–0.0002 | 0.151 | 0.460 |
| Adiponectin (µg/24 h) | 0.0221 (0.0175) | −0.0126–0.0569 | 0.209 | 0.660 |
| Insulin (mIU/24 h) | −0.0013 (0.0157) | −0.0325–0.0300 | 0.936 | 0.507 |
| Total lipids (g/24 h) | 0.0234 (0.0073) | 0.0090–0.0378 | 0.002 | 0.941 |
| Milk intake (mL/24 h) | 0.0021 (0.0006) | 0.0010–0.0032 | <0.001 | 0.941 |
| LFA | ||||
| Leptin (ng/24 h) | −0.0002 (0.0005) | −0.0012–0.0008 | 0.711 | 0.490 |
| Adiponectin (µg/24 h) | 0.0107 (0.0208) | −0.0306–0.0520 | 0.609 | 0.566 |
| Insulin (mIU/24 h) | 0.0206 (0.0184) | −0.0158–0.0571 | 0.264 | 0.377 |
| Total lipids (g/24 h) | 0.0118 (0.0090) | −0.0060–0.0296 | 0.190 | 0.718 |
| Milk intake (mL/24 h) | 0.0016 (0.0007) | 0.0002–0.0030 | 0.030 | 0.830 |
| WFA | ||||
| Leptin (ng/24 h) | −0.0006 (0.0004) | −0.0014–0.0002 | 0.148 | 0.354 |
| Adiponectin (µg/24 h) | 0.0087 (0.0160) | −0.0231–0.0405 | 0.588 | 0.422 |
| Insulin (mIU/24 h) | −0.0025 (0.0142) | −0.0308–0.0258 | 0.861 | 0.393 |
| Total lipids (g/24 h) | 0.0155 (0.0067) | 0.0023–0.0288 | 0.022 | 0.649 |
| Milk intake (mL/24 h) | 0.0023 (0.0006) | 0.0011–0.0036 | <0.001 | 0.862 |
| WFL | ||||
| Leptin (ng/24 h) | −0.0006 (0.0004) | −0.0014–0.0003 | 0.184 | 0.606 |
| Adiponectin (µg/24 h) | 0.0261 (0.0182) | −0.0100–0.0622 | 0.155 | 0.858 |
| Insulin (mIU/24 h) | 0.0006 (0.0165) | −0.0321–0.0332 | 0.973 | 0.641 |
| Total lipids (g/24 h) | 0.0244 (0.0077) | 0.0092–0.0396 | 0.002 | 0.744 |
| Milk intake (mL/24 h) | 0.0019 (0.0006) | 0.0008–0.0031 | 0.001 | 0.803 |
Disclaimer/Publisher’s Note: The statements, opinions and data contained in all publications are solely those of the individual author(s) and contributor(s) and not of MDPI and/or the editor(s). MDPI and/or the editor(s) disclaim responsibility for any injury to people or property resulting from any ideas, methods, instructions or products referred to in the content. |
© 2024 by the authors. Licensee MDPI, Basel, Switzerland. This article is an open access article distributed under the terms and conditions of the Creative Commons Attribution (CC BY) license (https://creativecommons.org/licenses/by/4.0/).
Share and Cite
Suwaydi, M.A.; Lai, C.T.; Warden, A.H.; Perrella, S.L.; McEachran, J.L.; Wlodek, M.E.; Geddes, D.T.; Gridneva, Z. Investigation of Relationships between Intakes of Human Milk Total Lipids and Metabolic Hormones and Infant Sex and Body Composition. Nutrients 2024, 16, 2739. https://doi.org/10.3390/nu16162739
Suwaydi MA, Lai CT, Warden AH, Perrella SL, McEachran JL, Wlodek ME, Geddes DT, Gridneva Z. Investigation of Relationships between Intakes of Human Milk Total Lipids and Metabolic Hormones and Infant Sex and Body Composition. Nutrients. 2024; 16(16):2739. https://doi.org/10.3390/nu16162739
Chicago/Turabian StyleSuwaydi, Majed A., Ching Tat Lai, Ashleigh H. Warden, Sharon L. Perrella, Jacki L. McEachran, Mary E. Wlodek, Donna T. Geddes, and Zoya Gridneva. 2024. "Investigation of Relationships between Intakes of Human Milk Total Lipids and Metabolic Hormones and Infant Sex and Body Composition" Nutrients 16, no. 16: 2739. https://doi.org/10.3390/nu16162739
APA StyleSuwaydi, M. A., Lai, C. T., Warden, A. H., Perrella, S. L., McEachran, J. L., Wlodek, M. E., Geddes, D. T., & Gridneva, Z. (2024). Investigation of Relationships between Intakes of Human Milk Total Lipids and Metabolic Hormones and Infant Sex and Body Composition. Nutrients, 16(16), 2739. https://doi.org/10.3390/nu16162739