
What Do We Know about the Diets of Pacific Islander Adults in Papua New Guinea? A Scoping Review

 ,
,  , ,
, ,  , ,
, ,
Abstract
1. Introduction
2. Materials and Methods
2.1. Protocol and Registration
2.2. Inclusion Criteria
2.2.1. Participants
2.2.2. Concept
2.2.3. Context
2.3. Types of Sources
2.4. Search Strategy
2.5. Selection Process
2.6. Data Extraction and Charting
2.7. Synthesis of Results
3. Results
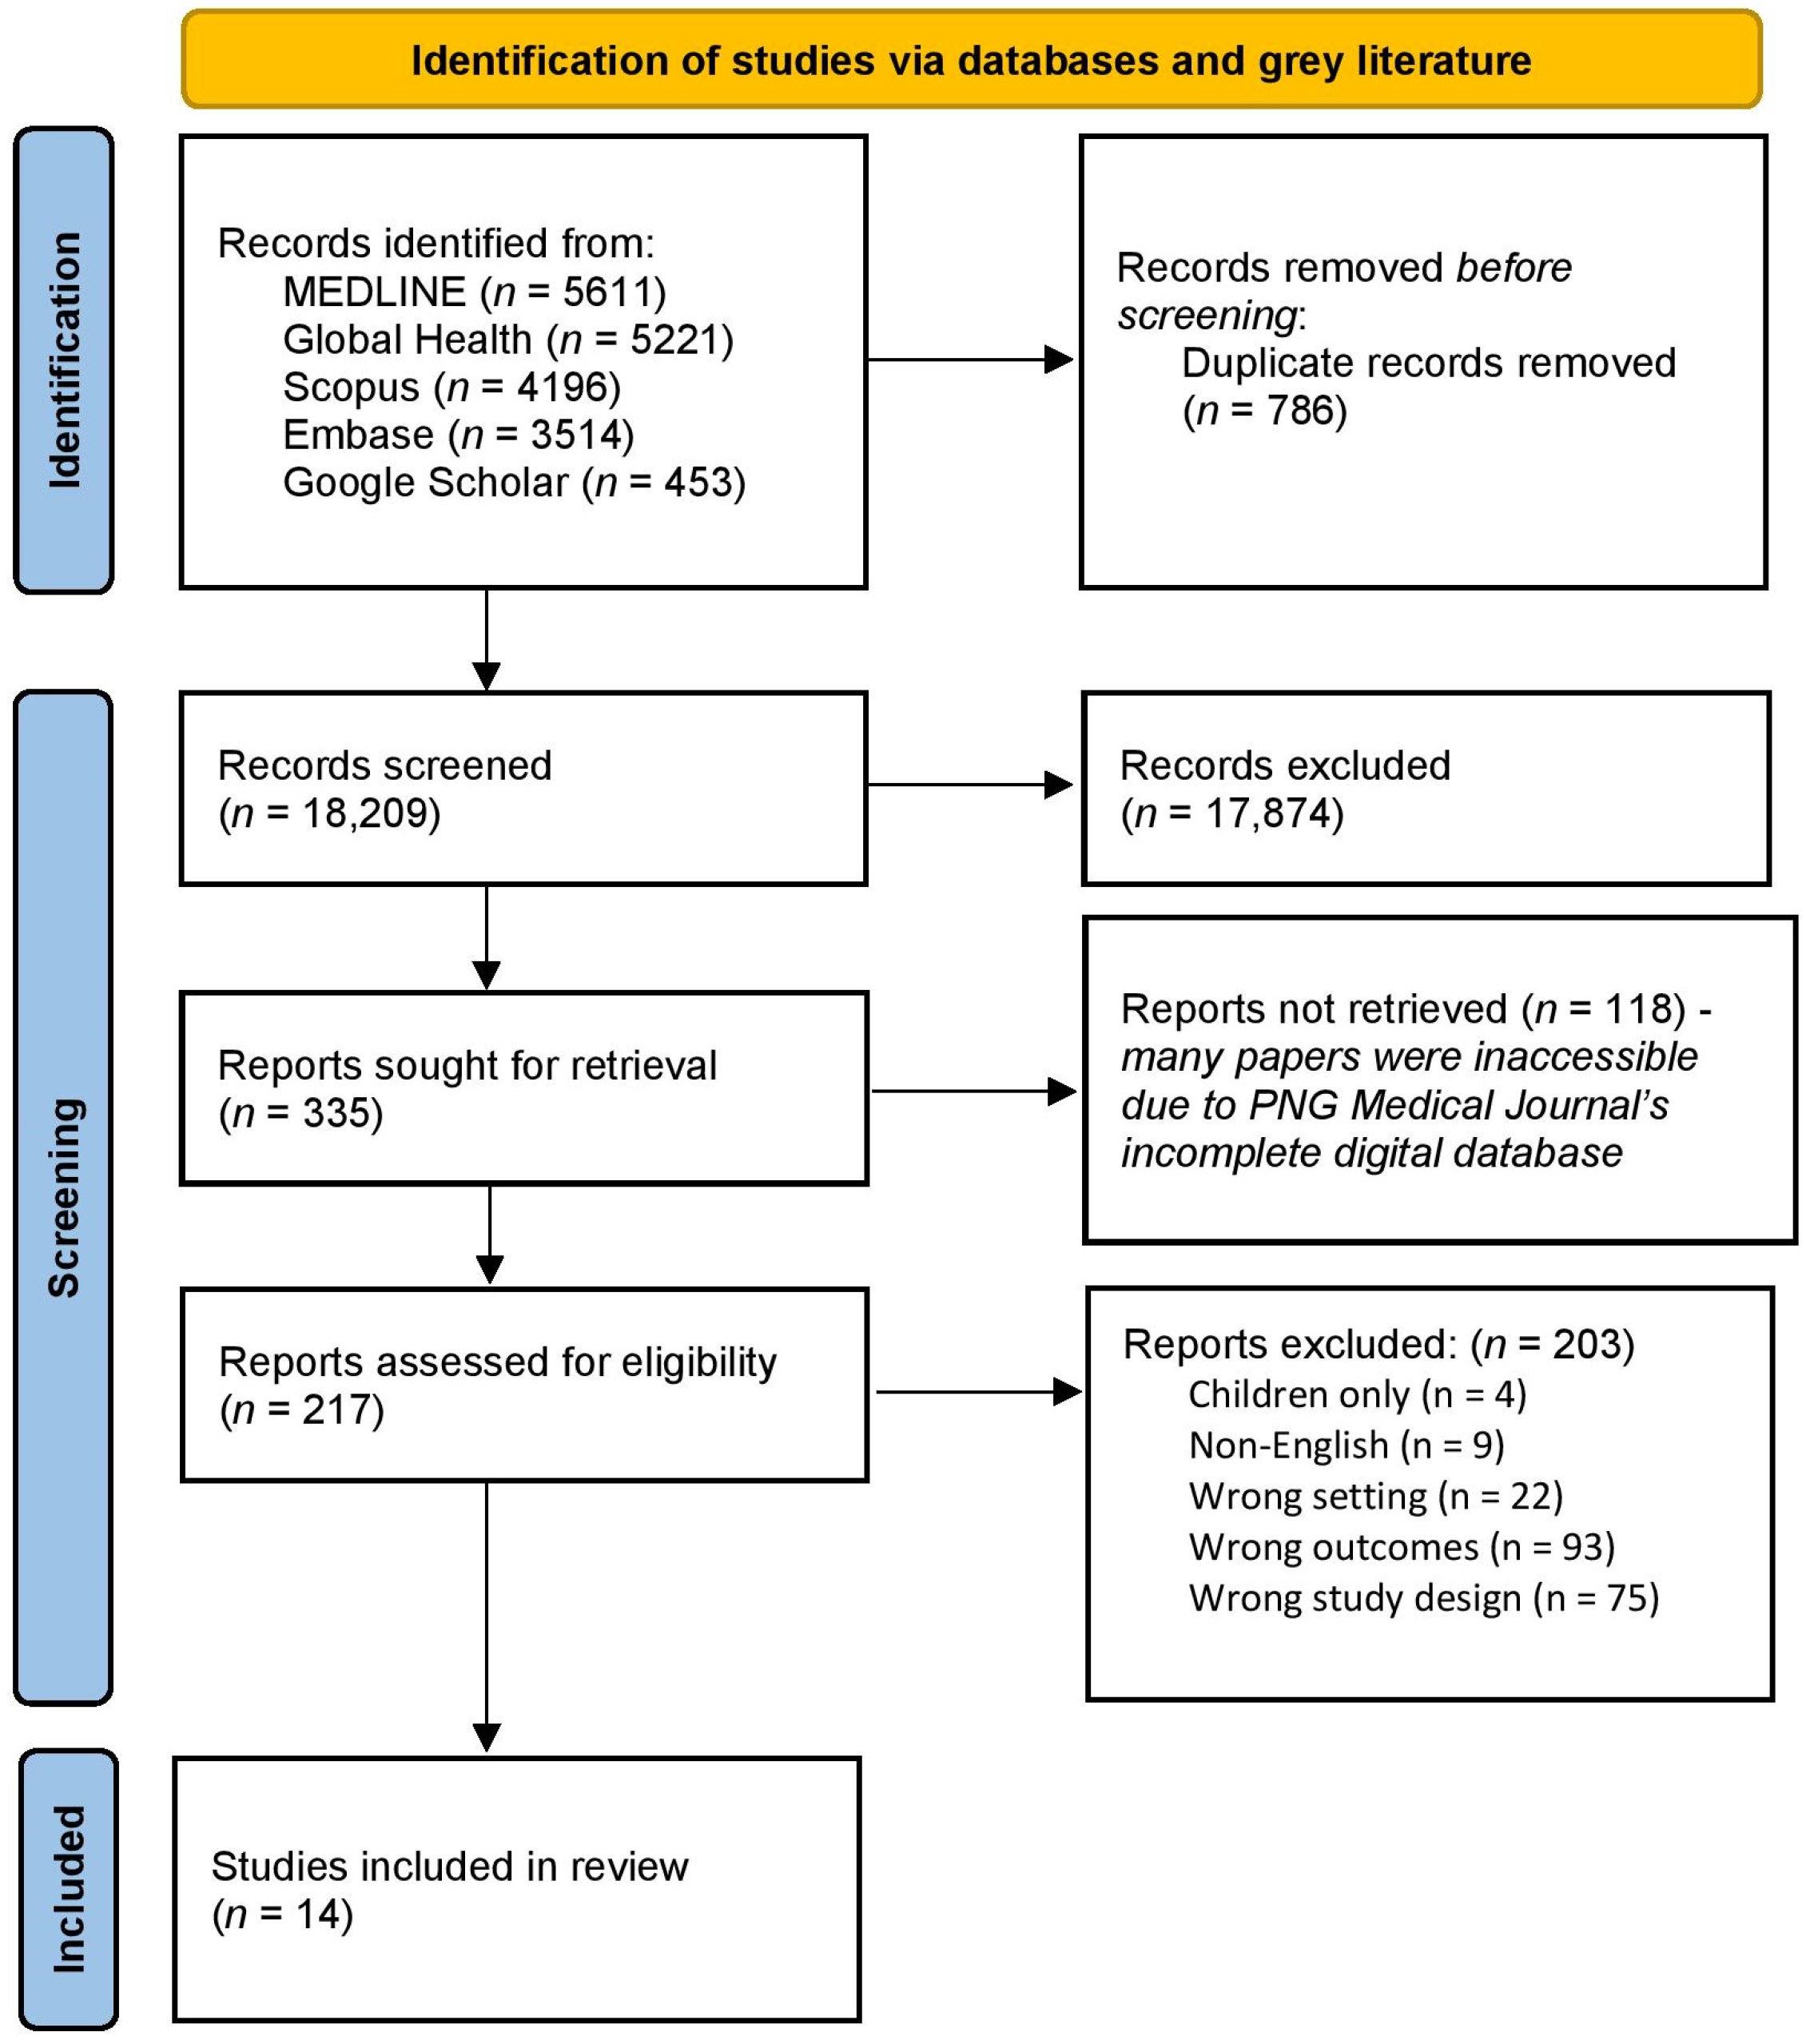
3.1. Search Results
3.2. Study Selection and Characteristics
3.3. Dietary Data
3.3.1. Energy
3.3.2. Fibre
3.3.3. Protein
3.3.4. Carbohydrate
3.3.5. Fat
3.3.6. Micronutrients
3.4. Food Sources of Energy and Protein
3.4.1. Contribution to Energy Intake
3.4.2. Contributions to Protein Intake
3.5. Socio-Cultural and Economic Factors of Eating
4. Discussion
5. Conclusions
Supplementary Materials
Author Contributions
Funding
Acknowledgments
Conflicts of Interest
References
- The World Bank. World Development Indicators. 2024. Available online: https://databank.worldbank.org/reports.aspx?source=2&country=PNG (accessed on 22 January 2023).
- Government of Papua New Guinea. National Health Plan 2021–2030. 1a Policies and Strategies; National Department of Health; Government of Papua New Guinea: Port Moresby, Papua New Guinea, 2021. [Google Scholar]
- University of Hawai‘i at Mānoa. Nutrition Transition of the Pacific. Available online: https://manoa.hawaii.edu/ctahr/pacificfoodguide/index.php/about-the-guide/nutrition-transition-of-the-pacific/#:~:text=Nutrition%20transition%20refers%20to%20the,Gordon%2DLarsen%2C%202004). (accessed on 30 January 2024).
- Walls, H.L.; Johnston, D.; Mazalale, J.; Chirwa, E.W. Why we are still failing to measure the nutrition transition. BMJ Glob. Health 2018, 3, e000657. [Google Scholar] [CrossRef]
- Schmidt, E.; Fang, P. Papua New Guinea agri-food trade and household consumption trends point towards dietary change and increased overweight and obesity prevalence. Glob. Health 2021, 17, 135. [Google Scholar] [CrossRef] [PubMed]
- Conn, C.; Camnmock, R.; Ford, K.; Faesen Kloet, G.; Nayar, S. Our people, our food, our planet: Sustainable food systems policy in the Pacific. Pac. Health 2020, 3, 20. [Google Scholar] [CrossRef]
- Rarau, P.; Vengiau, G.; Gouda, H.; Phuanukoonon, S.; Kevau, I.H.; Bullen, C.; Scragg, R.; Riley, I.; Marks, G.; Umezaki, M.; et al. Prevalence of non-communicable disease risk factors in three sites across Papua New Guinea: A cross-sectional study. BMJ Glob. Health 2017, 22, e000221. [Google Scholar] [CrossRef] [PubMed]
- World Bank. New World Bank Country Classifications by Income Level: 2022–2023. 2022. Available online: https://blogs.worldbank.org/en/opendata/new-world-bank-country-classifications-income-level-2022-2023 (accessed on 30 January 2024).
- World Health Organization. Global Status Report on Noncommunicable Diseases 2014; World Health Organization: Geneva, Switzerland, 2014. [Google Scholar]
- World Health Organization. Global Status Report on Noncommunicable Diseases 2010; World Health Organization: Geneva, Switzerland, 2011. [Google Scholar]
- World Health Organization. Noncommunicable Diseases. 2023. Available online: https://www.who.int/news-room/fact-sheets/detail/noncommunicable-diseases (accessed on 30 January 2024).
- World Cancer Research Fund. Mouth and Oral Cancers. Available online: https://www.wcrf.org/diet-activity-and-cancer/cancer-types/mouth-pharynx-larynx-cancers/#:~:text=Smoking%20(or%20the%20use%20of,of%20the%20mouth%20and%20pharynx (accessed on 18 March 2024).
- World Health Organization. Pacific Health Ministers Meetings. 2024. Available online: https://www.who.int/westernpacific/about/how-we-work/pacific-support/pacific-health-ministers-meetings (accessed on 29 January 2024).
- World Health Organization. The First 20 Years of the Journey towards the Vision of Healthy Islands in the Pacific. 2015. Available online: https://www.who.int/publications/i/item/9789290617150 (accessed on 5 May 2024).
- Papua New Guinea National Nutrition Policy 2016–2026. Available online: https://faolex.fao.org/docs/pdf/PNG182140.pdf (accessed on 8 September 2023).
- Department of Agriculture and Livestock. Papua New Guinea National Food Security Policy 2018–2027. Available online: https://faolex.fao.org/docs/pdf/png202059.pdf (accessed on 18 March 2024).
- Munn, Z.; Peters, M.D.J.; Stern, C.; Tufanaru, C.; McArthur, A.; Aromataris, E. Systematic review or scoping review? Guidance for authors when choosing between a systematic or scoping review approach. BMC Med. Res. Methodol. 2018, 181, 143. [Google Scholar] [CrossRef] [PubMed]
- Peters, M.D.J.; Marnie, C.; Tricco, A.C.; Pollock, D.; Munn, Z.; Alexander, L.; McInerney, P.; Godfrey, C.; Khalil, H. Updated methodological guidance for the conduct of scoping reviews. JBI Evid. Synth. 2020, 1810, 2119–2126. [Google Scholar] [CrossRef]
- Tricco, A.C.; Lillie, E.; Zarin, W.; O’Brien, K.K.; Colquhoun, H.; Levac, D.; Moher, D.; Peters, M.D.; Horsley, T.; Weeks, L.; et al. PRISMA Extension for Scoping Reviews (PRISMA-ScR): Checklist and Explanation. Ann. Intern. Med. 2018, 1697, 467–473. [Google Scholar] [CrossRef]
- Page, M.J.; E McKenzie, J.; Bossuyt, P.M.; Boutron, I.; Hoffmann, T.C.; Mulrow, C.D.; Shamseer, L.; Tetzlaff, J.M.; A Akl, E.; E Brennan, S.; et al. The PRISMA 2020 statement: An updated guideline for reporting systematic reviews. BMJ 2021, 372, n71. [Google Scholar] [CrossRef]
- Arksey, H.; O’Malley, L. Scoping studies: Towards a methodological framework. Int. J. Soc. Res. Methodol. 2005, 81, 19–32. [Google Scholar] [CrossRef]
- Reid, L.H.; Gajdusek, D.C. Nutrition in the kuru region. 2. A nutritional evaluation of traditional Fore diet in Moke village in 1957. Acta Trop. 1969, 26, 331–345. [Google Scholar]
- Sinnet, P.F.; Whyte, H.M. Epidemiological Studies in a Highland Population of New Guinea: Environment, Culture, and Health Status. Hum. Ecol. 1973, 1, 245–277. [Google Scholar] [CrossRef]
- Harvey, P.W.; Heywood, P.F. Twenty-five years of dietary change in Simbu province, Papua New Guinea. Ecol. Food Nutr. 1983, 131, 27–35. [Google Scholar] [CrossRef]
- Ohtsuka, R.; Inaoka, T.; Kawabe, T.; Suzuki, T.; Hongo, T.; Akimichi, T. Diversity and Change of Food-Consumption and Nutrient Intake among the Gidra in Lowland Papua. Ecol. Food Nutr. 1985, 164, 339–350. [Google Scholar] [CrossRef]
- Ulijaszek, S.J.; Hyndman, D.C.; Lourie, J.A.; Pumuye, A. Mining, Modernization and Dietary Change among the Wopkaimin of Papua-New-Guinea. Ecol. Food Nutr. 1987, 202, 143–156. [Google Scholar] [CrossRef]
- Shack, K.W.; Grivetti, L.E.; Dewey, K.G. Cash Cropping, Subsistence Agriculture and Nutritional Status among Mothers and Children in Lowland Papua New Guinea. Soc. Sci. Med. 1990, 311, 61–68. [Google Scholar] [CrossRef] [PubMed]
- Grossman, L.S. Diet, Income, and Subsistence in an Eastern Highland Village, Papua-New-Guinea. Ecol. Food Nutr. 1991, 263, 235–253. [Google Scholar] [CrossRef]
- Ulijaszek, S.J. Dietary and nutrient intakes of 25 Ningerum (New Guinea) adult males at two times of the year. Am. J. Hum. Biol. 1992, 44, 469–479. [Google Scholar] [CrossRef] [PubMed]
- Hodge, A.M.; Montgomery, J.; Dowse, G.K.; Mavo, B.; Watt, T.; Alpers, M.P.; Zimmet, P.Z. Diet in an urban Papua New Guinea population with high levels of cardiovascular risk factors. Ecol. Food Nutr. 1996, 354, 311–324. [Google Scholar] [CrossRef]
- Muntwiler, M.; Shelton, R.M. Survey of nutrition and protein intake in rural families in Eastern Highlands Province. In Food Security for Papua New Guinea, Proceedings of the Papua New Guinea Food and Nutrition 2000 Conference, Lae, Papua New Guinea, 26–30 June 2000; Australian Centre for International Agricultural Research: Canberra, Australia, 2000. [Google Scholar]
- Yamauchi, T. Impact of microenvironment on food security and nutritional adaptation in the Tari basin. In Food Security for Papua New Guinea, Proceedings of the Papua New Guinea Food and Nutrition 2000 Conference, Lae, Papua New Guinea, 26–30 June 2000; Australian Centre for International Agricultural Research: Canberra, Australia, 2000. [Google Scholar]
- Yamauchi, T.; Umezaki, M.; Ohtsuka, R. Influence of urbanisation on physical activity and dietary changes in Huli-speaking population: A comparative study of village dwellers and migrants in urban settlements. Br. J. Nutr. 2001, 851, 65–73. [Google Scholar] [CrossRef]
- Morita, A.; Natsuhara, K.; Tomitsuka, E.; Odani, S.; Baba, J.; Tadokoro, K.; Igai, K.; Greenhill, A.R.; Horwood, P.F.; Soli, K.W.; et al. Development, validation, and use of a semi-quantitative food frequency questionnaire for assessing protein intake in Papua New Guinean Highlanders. Am. J. Hum. Biol. 2015, 273, 349–357. [Google Scholar] [CrossRef]
- Goris, J.M.; Zomerdijk, N.; Temple, V.J. Nutritional status and dietary diversity of Kamea in Gulf Province, Papua New Guineas. Asia Pac. J. Clin. Nutr. 2017, 264, 665–670. [Google Scholar]
- Hodges, K.; Fysh, C.F.; Rienits, K. New Guinea and Papuan food composition tables. In Report of the New Guinea Nutrition Survey Expedition; A.H. Pettifer, Government Printer: Sydney, Australia, 1947; pp. 269–280. [Google Scholar]
- Platt, B.S. Tables of representative values of foods commonly used in tropical countries. In Tables of Representative Values of Foods Commonly Used in Tropical Countries; Ind Med Gaz: Calcutta, India, 1962; p. 302. [Google Scholar]
- Hipsley, E.H.; Clements, F.W. Report of the New Guinea Nutrition Survey Expedition; A.H. Pettifer, Government Printer: Sydney, Australia, 1947. [Google Scholar]
- Hipsley, E.H.; Kirk, N.E. Studies of Dietary Intake and the Expenditure of Energy by New Guineans; South Pacific Commission: Noumea, New Caledonia, 1965. [Google Scholar]
- McCance, R.; Widdowson, E. The Composition of Foods-Medical Research Council Special; Report Series; The Royal Society of Chemistry, Cambridge and the Food Standards Agency: London, UK, 1960; p. 290. [Google Scholar]
- Osmond, A. Tables of Composition of Australian Foods; Australian Institute of Anatomy: Canberra, Australia, 1948. Available online: https://copiesdirect.nla.gov.au/items/import?source=cat&sourcevalue=1419315 (accessed on 8 September 2023).
- FAO/USDHEW. Food Composition Table for Use in East Asia; Food and Agriculture Organization of the United Nations: Rome, Italy, 1972. [Google Scholar]
- Norgan, N.; Durnin, J.; Ferro-Luzzi, A. The Composition of Some New Guinea Foods. Papua N. Guin. Agric. J. 1979, 30, 25–39. [Google Scholar]
- Bailey, K. Composition of New Guinea Highland Foods; Trop Geogr Med.: Newark, NJ, USA, 1968; Available online: https://www.medscape.com/ (accessed on 8 September 2023).
- Murai, M.; Miller, C.D.; Pen, F. Some Tropical South Pacific Island Foods: Description, History, Use, Composition, and Nutritive Value; University of Hawaii: Honolulu, HI, USA, 1958. [Google Scholar]
- Cresta, M.; Allegrini, M.; Casadei, E.; Gallorini, M.; Lanzola, E.; Panatta, G. Benin: Nutritional considerations on trace elements in the diet. Food Nutr. 1976, 22, 8–18. [Google Scholar]
- Resources Council. Standard Tables of Food Composition in Japan, 4th ed.; Science and Technology Agency: Tokyo, Japan, 1982. [Google Scholar]
- Gormican, A. Inorganic elements in foods used in hospital menus. J. Am. Diet. Assoc. 1970, 56, 397–403. [Google Scholar] [CrossRef] [PubMed]
- Dornstreich, M.D. An Ecological Study of Gadio Enga (New Guinea) Subsistence; Columbia University: New York, NY, USA, 1973. [Google Scholar]
- Groos, A.; Ulijaszek, S.; Heywood, P. Food Tables for Use in Papua New Guinea; Institute of Medical Research: Madang, Papua New Guinea, 1986; unpublished manuscript. [Google Scholar]
- National Institute of Arthritis, M.; Diseases, D.; Leung, W.-T.W.; Butrum, R.R.; Chang, F.H. Food Composition Table for Use in East Asia; National Institutes of Health: Bethesda, MD, USA, 1973. [Google Scholar]
- Peters, F. Chemical composition of South Pacific foods. Qual. Plant. Et Mater. Veg. 1959, 5, 313–343. [Google Scholar] [CrossRef]
- Department of Community Services and Health. NUTTAB 90 Nutrient Data Table for Use in Australia; Australian Government Publishing Service: Canberra, Australia, 1990. [Google Scholar]
- Hongo, T.; Ohtsuka, R. Nutrient composition of Papua New Guinea foods. Man Cult. Ocean. 1993, 9, 103–125. [Google Scholar]
- Umezaki, M.; Yamauchi, T.; Ohtsuka, R. Diet among the Huli in Papua New Guinea Highlands when they were influenced by the extended rainy period. Ecol. Food Nutr. 1998, 375, 409–427. [Google Scholar] [CrossRef]
- Umezaki, M.; Natsuhara, K.; Ohtsuka, R. Protein content and amino acid scores of sweet potatoes in Papua New Guinea Highlands. Ecol. Food Nutr. 2001, 405, 471–480. [Google Scholar] [CrossRef]
- Dignan, C.B.B.; Kumar, S.; Aalbersberg, W. The Pacific Islands Food Composition Tables; FAO: Rome, Italy, 2004; 135p. [Google Scholar]
- Food Standards Australia New Zealand. Australian Food, Supplement & Nutrient Database 2007. Available online: https://www.foodstandards.gov.au/science-data/monitoringnutrients/ausnut/ausnut2007 (accessed on 24 April 2024).
- Japanese Ministry of Education, Culture, Sports, Science and Technology. Standard Tables of Food Composition in Japan. 2005. Available online: https://www.mext.go.jp/en/policy/science_technology/policy/title01/detail01/1374030.htm (accessed on 24 April 2024).
- National Health and Medical Research Council. Nutrient Refernece Values for Australia and New Zealand. Available online: https://www.eatforhealth.gov.au/nutrient-reference-values/chronic-disease/macronutrient-balance (accessed on 28 March 2024).
- Centers for Disease Control and Prevention. Poor Nutrition. 2022. Available online: https://www.cdc.gov/chronicdisease/resources/publications/factsheets/nutrition.htm#:~:text=Adults%20who%20eat%20a%20healthy,these%20conditions%20and%20avoid%20complications (accessed on 7 November 2023).
- Vengiau, G. Nutrition Transition in Papua New Guinea (PNG): An Assessment of the Nutrition Transition for Three Diverse Populations, Including the Contributing Factors, Food Insecurity, and Health Risks University of Queensland; The University of Queensland: St Lucia, Australia, 2019. [Google Scholar]
- Rarau, P.; Guo, S.; Baptista, S.N.; Pulford, J.; McPake, B.; Oldenburg, B. Prevalence of non-communicable diseases and their risk factors in Papua New Guinea: A systematic review. SAGE Open Med. 2020, 8, 2050312120973842. [Google Scholar] [CrossRef]
- Peng, W.; Zhang, L.; Wen, F.; Tang, X.; Zeng, L.; Chen, J.; Galea, G.; Wen, D.; Wang, Y. Trends and disparities in non-communicable diseases in the Western Pacific region. Lancet Reg Health West Pac. 2023, 43, 100938. [Google Scholar] [CrossRef]
- World Health Organization. For the Future towards the Healthiest and Safest Region. 2020. Available online: https://iris.who.int/bitstream/handle/10665/330703/WPR-2020-RDO-001-eng.pdf?sequence=1 (accessed on 9 May 2024).
- United Nations. The 17 Goals. Available online: https://sdgs.un.org/goals (accessed on 9 May 2024).
- Perna, M.; Hewlings, S. Saturated Fatty Acid Chain Length and Risk of Cardiovascular Disease: A Systematic Review. Nutrients 2022, 151, 30. [Google Scholar] [CrossRef] [PubMed]
- Rarau, P.; Pulford, J.; Gouda, H.; Phuanukoonon, S.; Bullen, C.; Scragg, R.; Pham, B.N.; McPake, B.; Oldenburg, B. Socio-economic status and behavioural and cardiovascular risk factors in Papua New Guinea: A cross-sectional survey. PLoS ONE 2019, 141, e0211068. [Google Scholar]
- Gobal Nutrition Report. Country Nutrition Profiles. 2024. Available online: https://globalnutritionreport.org/resources/nutrition-profiles/oceania/melanesia/papua-new-guinea/#:~:text=28.9%25%20of%20adult%20(aged%2018,women%20and%2030.4%25%20for%20men (accessed on 29 January 2024).
- Ministry of Health. National Policy on Health Promotion For Papua New Guinea. Available online: https://docplayer.net/22960586-National-policy-on-health-promotion-for-papua-new-guinea.html (accessed on 22 March 2024).
- Atoloye, A.T.; Savoie-Roskos, M.R.; Guenther, P.M.; Durward, C.M. Effectiveness of Expanded Food and Nutrition Education Program in Changing Nutrition-Related Outcomes Among Adults With Low Income: A Systematic Review. J. Nutr. Educ. Behav. 2021, 538, 691–705. [Google Scholar] [CrossRef]
- Andrew, M.; Barker, P.J. Lessons learned on School Agriculture and Nutrition in Papua New Guinea; Institute of National Affairs: Port Moresby, Papua New Guinea, 2022. [Google Scholar] [CrossRef]
- Food and Agriculture Organisation of the United Nations. Food-Based Dietary Guidelines. Available online: https://www.fao.org/nutrition/education/food-based-dietary-guidelines (accessed on 12 December 2023).
- World Health Organization Regional Office for the Western Pacific. Development of Food-Based Dietary Guidelines for the Western Pacific Region: The Shift from Nutrients and Food Groups to Food Availability, Traditional Cuisine and Modern Foods in Relation to Emerging Chronic Noncommunicable Diseases; World Health Organization: Geneva, Switzerland, 1999. [Google Scholar]
- Chen, J.; Bertrand, S.; Galy, O.; Raubenheimer, D.; Allman-Farinelli, M.; Caillaud, C. The Design and Development of a Food Composition Database for an Electronic Tool to Assess Food Intake in New Caledonian Families. Nutrients 2021, 135, 1668. [Google Scholar] [CrossRef]
- Chang, H.; Villano, R.; Irving, D.; Kewa, L.; Mais, A. Understanding Consumer Preferences for Sweetpotato in Papua New Guinea. Australas. Agribus. Perspect. 2017, 204, 59–77. [Google Scholar]

| First Author, Publication Year, Ref | Study Design | Region/Setting | Population | Data Collection Date | Dietary Assessment Method(s) | Interview Language | Data Source for Foods | Data Reported |
|---|---|---|---|---|---|---|---|---|
| Reid, 1969, [22] | NR. | Highlands. Kuru Region, Moke Village, Eastern Highlands Province. | All ages and genders; Individuals (n = 38); Lactating (n = 2); Pregnant (n = 1); Breastfed (n = 1). Households (n = 3); Household #1 (n = 15); Household #2 (n = 10); Household #3 (n = 13). | 1957. | Daily Survey of Diet by Household: 5–7 d household food weighed. Individual Daily Food Consumption: 1 household, for 1 d. The investigator stayed with members of household #3 for the whole day and weighed all the cooked food eaten by each person. | NR. | PNG [36] and foods commonly used in tropical countries [37]. | Energy/Nutrients. Foods, Context. |
| Sinnett, 1973, [23] | Cross-sectional. | Highlands. Murapin tribal community on the hamlet of Tukisenta (Western Highlands). | All ages and genders; Diet survey conducted on individuals (n = 90) < 16 y (n = 45); 16–65 y (n = 45); Average daily dietary intake reported for (n = 45) adults. Males (n = 23; aged 19–66 y); Females (n = 22; aged 16–60 y). | October 1966 to April 1967. | Each household visited 2 times per d (morning and evening meals). All items of food consumed by each individual were weighed for 7 consecutive days. Food eaten away from the house was assessed by weighing a similar portion of the item. | NR. | PNG [38,39], UK [40] and Australia [41]. | Energy/Nutrients. Foods, Context. |
| Harvey, 1983, [24] | NR. | Highlands. Yobakogl Village, Simbu Province. | All ages and genders; Households (n = 12); Individuals (n = 67); Adult male (n = 17); Adult female (n = 14); Lactating (n = 5). Both genders 15–19 y; (n = 6); 10–14 y (n = 6); 5–9 y (n = 12); 3–4 y (n = 2); 1–2 y (n = 5). | March 1981. | Each household observed for 5–6 consecutive days by one of seven assistants. Individual intakes were assessed by weighing food consumed and food recalls. | Five assistants able to communicate in the local Sinasina language. | FAO/U.S Department of Health Education and Welfare [42], PNG [43] and foods commonly used in tropical countries [37]. | Energy/Nutrients. Foods, Context. |
| Ohtsuka, 1985, [25] | NR. | Southern. Rual (Northern), Wonie (Inland), Ume (Riverine), and Dorogori (Coastal). | Villages (n = 4) Both genders; Individuals (n = 132); Rual (1981) (n = 26); Wonie (1971) (n = 26); Wonie (1981) (n = 22); Ume (1981) (n = 27); Dorogori (1981) (n = 31). | Wonie 1971 (dry season) 1972 (wet season). Four villages in 1981 Rual, Wonie, Ume and Dorogori (dry season). | Each survey recorded amounts of food consumed by 6–8 selected households for 12 (1971–72) and 14 consecutive days (1981). All foods stored in each household were weighed twice (morning and evening). | NR. | Eight food composition tables including PNG and the South Pacific, UK, East Asia and Japan [36,40,42,44,45,46,47,48]. | Energy/Nutrients. Foods. |
| Ulijaszek, 1987, [26] | NR | Southern. Wopkaimin, Western (Fly River) Province. 1975 (Bakonabip hamlet and Tambik and Ulatem hunting shelters). 1984 Atemkit hamlet and Bultem II. | Both genders; 1975: residents varied from 15 to 30, but on one occasion 78 people were present (ritual feast); 1984: all individuals. | 1975 and 1984. | 1975 hamlet food consumption survey: 47 intake d (male); 47 intake d (female). 1984 weighed dietary intakes 5 d on all individuals in Atemkit hamlet and randomly selected households in Bultem II: 43 intake d (male); 60 intake d (females). Recalls of foods in the absence of recorders. | NR. | PNG [43,49]. | Energy/Nutrients. Foods, Context. |
| Shack, 1990, [27] | Cross sectional. | Momase. Settlers from Grass Country, Wosera/Maprik and Middle Sepik to Gavien, East Sepik Province. | Children and mothers; Families from three ethnic origins within Gavien that had a preschool age child (between 2–6 y) in the family. Total families (n = 56); Grass Country (n = 20); Wosera (n = 18); Middle Sepik (n = 18). | November 1985 to September 1986. | 24 h recall and frequency of consumption of 16 foods selected to represent a typical diet. Weighed food intakes by a modified method of ‘child following’ determined for a subsample of children and used to verify the accuracy of 24 h recalls. The food frequency list was prepared in PNG and reviewed by the East Sepik Provincial Nutrition Group. | Tok Pisin. | PNG [50]. | Energy/Nutrients. Foods, Context. |
| Grossman, 1991, [28] | NR. | Highlands. Kapanara Village, Kainantu District, Eastern Highlands Province. | Households (n = 13); Individuals (n = 45); Male (n = 23); <10 y (n = 3); 10–14 y (n = 3); Unmarried adult over 15 y (n = 5); Married Adult (n = 10); Over 55 y (n = 2); Female (n = 22); <10 y (n = 1); 10–14 y (n = 5); Unmarried adult over 15 y (n = 2); Married Adult (n = 13); Over 55 y (n = 1); “Actual amounts” 4 households were part of the food frequency survey. | February to December 1977. | Food frequency interview, considering all foods from previous day. Adults provided dietary data for themselves and children for 69 random/d over 11 m. Children also questioned to confirm the information on meals. Information was also collected on “actual amounts” eaten from a smaller sample of households for 2 consecutive days each month (March to August). Visits were made for all meals during these 2 days. Each cooked food item served to each individual was weighed, including leftovers. | Tok Pisin and interpreters. | NR. | Foods, Context. |
| Ulijaszek, 1992, [29] | NR. | Southern. Hukim Village, Ningerum, North Fly District, Western (Fly River) Province. | Adult male (n = 25) aged 18 and 40 y. | May and November 1984. | Two 5d WFR 6m in-between (wet and wetter season). All food weighed after cooking. Each individual had their own record book. Weights of missing items were estimated by recall using food models. Food eaten outside the home was recorded by weighing where possible, but more often by recall. | NR. | PNG [43], East Asia [51] and South Pacific [52]. | Energy/Nutrients. Foods. |
| Hodge, 1996, [30] | Case-control. | Southern. Wanigela people of Kori, Port Moresby, National Capital District. | Adults (n = 285) over 25 y. | August 1991. | 24 h recall performed before the questionnaire to identify foods consumed (not in questionnaire). Quantitative FFQ of 87 food and beverage items (allowed for variations in intake associated with season and pay period) from previous 12 m. | NR | NUTTAB 90 nutrient database [53] supplemented with additional information on local food items provided by the Australian Centre for International Agriculture Research, South Pacific Commission and the Papua New Guinea Institute of Medical Research. When data was unavailable, published data was used for similar foods or nutrient analysis performed. | Energy/Nutrients. Foods, Context. |
| Muntweiler, 2000, [31] | NR. | Highlands. Kainantu and Okapa District. Misapi, Tokai Purosa, Karu 1, Kokopi, Konaka and Norikori villages (Eastern Highlands Province). | Both genders; Households (n = 73); (average 6 people per household, 3 adults, 1 school age; 2 below school age per household). Households used as the base unit rather than families as family members do not always live and eat in the same house. | June 1999. | The Agricultural Development Program Nutrition Survey (baseline). Interview conducted in the house with the senior woman from each household and husbands assisted. Questionnaires covered nutrition and protein consumption. Field observations. Following the interview, the house, garden inspected for the types of food crops. | Tok Pisin with discussions in the local languages. | NA. | Foods, Context. |
| Yamauchi, 2000, [32] | NR. | Highlands. Flat wetland and dry hilly areas of Tari Basin, Southern Highland Province. | Married adults; both genders; Total individuals (n = 27); Flat (n = 13; n = 3 of these lactating); Hilly (n = 14; n = 1 of these lactating). | June to September 1994. | All foods consumed by each individual throughout the day were weighed before cooking. Participants asked in the morning about the types and amounts of foods consumed during the previous night. | Tok Pisin and interpreter. | Samples of kauaku and green leaves analysed. Other foods PNG and surrounding countries [54,55]. | Energy/Nutrients. |
| Yamauchi, 2001, [33] | NR. | Highlands and Southern. Huli, Tari Basin, Southern Highland Province and Migrants from Tari Basin to Port Moresby, National Capital District. | Married adults (n = 56); Rural villagers (n = 27); Male (n = 15); Female (n = 12; including n = 4 lactating). Urban migrants (n = 29); Male (n = 14); Female (n = 15; including n = 6 lactating). All urban subjects were born and grew up in their homeland in the Tari basin. | July to September 1994 and July to September in 1995. | All foods consumed throughout the day were weighed before cooking. Participants asked in the morning about the types and amounts of foods consumed during the previous night. | Tok Pisin with interpreter. | Samples of kauaku and green leaves analysed. Other foods from PNG and surrounding countries [54,55]. | Energy/Nutrients. Context. |
| Morita, 2015, [34] | NR. | Highlands. Frigano (Eastern Highlands Province), Wenani (Tari Basin, Hela Province) and Levani (Levani Valley, Hela Province). | Adults (n = 107); Male: Frigano (n = 13); Wenani (n = 15); Levani (n = 30); Female: Frigano (n = 16); Wenani (n = 13); Levani (n = 20). | February and March 2012–2013. | Semi-quantitative 32-item FFQ. Face-to-face interviews about consumption frequency per day, week or month. Open-ended response questions used for snacks. WFR to evaluate the validity of the FFQ-estimated quantity of an individual’s protein intake. | NR. | PNG [56,57], Australia [58] and Japan [59]. | Energy/Nutrients. Foods, Context. |
| Goris, 2017, [35] | Cross-sectional. | Southern. Kamea, Gulf Province. | Households enrolled in the study (n = 70); Infants 0–59 m (n = 69); Children 6–12 y (n = 151); Non-pregnant women (n = 79) from (n = 10) villages in Kotidanga Local Level Government. | March to April 2015. | Validated dietary diversity questionnaire, defined as the number of unique foods consumed by household members over a period of time. | NR. | NA. | Foods. |
| First Author, Publication Year, Ref | Region | Setting or Year | Gender | Energy (Mean kJ ± SD) | Fibre (g/day) | Protein (g/day ± SD; %E) | Carbohydrate (g/day ± SD; %E) | Fat (g/day ± SD; %E) | Number of Micronutrients Reported |
|---|---|---|---|---|---|---|---|---|---|
| Reid, 1969, [22] | Highlands | Eastern Highlands | Female ◊ | 14,171/day § | - | 38 | - | - | 3 a |
| Lactating ◊ | 15,054/day § | - | 59 | - | - | 3 a | |||
| Household #1 (n = 15) | 329,126/study period § | 935 g/study period | 3 a | ||||||
| Household #2 (n = 10) | 464,089/study period § | 1352 g/study period | 3 a | ||||||
| Household #3 (n = 13) | 343,615/study period § | 1185 g/study period | 3 a | ||||||
| Sinnett, 1971, [23] | Highlands | Western Highlands | Male | 9623/day § | - | 25 | 540 | 6 | - |
| Female † | 7406/day §† | - | 20 | 410 | 7 | - | |||
| Harvey, 1983, [24] | Highlands | Simbu Region 1981 | Male | 9791 ± 1632/day § | - | 43 ± 8; 6%E | - | - | - |
| Female | 7799 ± 1807/day § | - | 36 ± 10; 6%E | - | - | - | |||
| Lactating | 7962 ± 870/day § | 38 ± 7; 6%E | |||||||
| Ohtsuka, 1985, [25] | Southern | Rual 1981 | Male | 14,866/day § | 13 | 54 | 776 | 20 | - |
| Wonie 1971 | 13,903/day § | 16 | 48 | 663 | 41 | - | |||
| Wonie 1981 | 14,853/day § | 17 | 68 | 785 | 10 | - | |||
| Ume 1981 | 12,468/day § | 12 | 68 | 555 | 54 | - | |||
| Dorogori 1981 | 13,477/day § | 10 | 73 | 664 | 25 | - | |||
| Ulijaszek, 1987, [26] | Southern | 1975 (n = 47 days intake) | Male | 5700 (3760–14,600) i | - | 32 (15–72) i | - | 3 (1–10) i | 5 b |
| Non-working 1984 (n = 32 days intake) | 7480 (5050–10,930) i | - | 30 (12–49) i | - | 6 (2–32) i | 5 b | |||
| Working 1984 (n = 11 days intake) | 9370 (6740–10,910) i | - | 40 (31–60) i | - | 22 (11–38) i | 5 b | |||
| 1975 (n = 47 days intake) | Female | 5630 (3490–9920) i | 29 (15–50) i | 3 (1–6) i | 5 b | ||||
| Non-working 1984 (n = 33 days intake) | 6240 (4840–8990) i | 27 (16–52) i | 14 (4–40) i | 5 b | |||||
| Working 1984 (n = 27 days intake) | 7300 (9350–9600) i | 36 (28–43) i | 16 (11–35) i | 5 b | |||||
| Shack, 1990, [27] | Momase | Grass Country | Female | 11,820 ± 3699/day § | - | 54 ± 29 | - | - | - |
| Wosera | 10,330 ± 3494/day § | - | 57 ± 41 | - | - | - | |||
| Middle Sepik | 9652 ± 4163/day § | - | 66 ± 47 | - | - | - | |||
| Ulijaszek, 1992, [29] | Southern | Rural (Wet) | Male | 8660 ± 2680/day ! | - | 18 ± 5; 3%E | 473 ± 126 | 12 ± 9 | 7 c |
| Rural (Wetter) | 8880 ± 2730/day ! | - | 20 ± 7; 4%E | 478 ± 124 | 15 ± 11 | 7 c | |||
| Hodge, 1996, [30] | Southern | Urban (Port Morsby) | Male | 11,500 ± 400/day | 22 ± 9 | 96 ± 32; 14%E | 427 ± 159; 59%E | 71 ± 28; 23%E | - |
| Female | 10,500 ± 400/day | 21 ± 8 | 93 ± 34; 15%E | 385 ± 155; 58%E | 65 ± 27; 23%E | - | |||
| Yamauchi, 2000, [32] | Highlands | Flat | Male | 15,040 ± 2940/day | - | 55 ± 24 | - | 18 ± 19 | - |
| Female | 13,270 ± 2220/day | - | 70 ± 22 62 ± 21 ‡ | - | 31 ± 29 | - | |||
| Hilly | Male | 9720 ± 3550/day | - | 43 ± 35 | - | 18 ± 24 | - | ||
| Female | 9140 ± 1570/day | - | 37 ± 21 34 ± 17 ‡ | - | 16 ± 18 | - | |||
| Yamauchi, 2001, [33] | Highlands | Rural | Male | 12,230 ± 4200/day | - | 49 ± 30 | - | 18 ± 21 | - |
| Female | 10,530 ± 2350/day | - | 48 ± 23 ‡ | - | 23 ± 24 | - | |||
| Southern | Urban (Port Moresby) | Male | 11,650 ± 2750/day | - | 73 ± 21 | - | 82 ± 48 | - | |
| Female | 9620 ± 2650/day | - | 65 ± 28 ‡ | - | 84 ± 36 | - | |||
| Morita, 2015, [34] | Highlands | Frigano | Male | - | - | 58 (34–71) ii | - | - | - |
| Female | - | - | 40 (27–54) ii | - | - | - | |||
| Wenani | Male | - | - | 40 (25–60) ii | - | - | - | ||
| Female | - | - | 42 (28–59) ii | - | - | - | |||
| Levani | Male | - | - | 31 (28–39) ii | - | - | - | ||
| Female | - | - | 27 (21–34) ii | - | - | - |
| First Author, Publication Year, Ref | Region | Population | Food Sources Contributing to Energy | Food Sources Contributing to Protein | Additional Information on Food Sources | Socio-Cultural and Economic Context of Eating |
|---|---|---|---|---|---|---|
| Reid, 1969, [22] | Highlands (Eastern) | Household #1; Day 3 | Top 2 foods contributing to energy (kJ) § Kaukau: 53,375, sugarcane: 6330. | Top 2 foods contributing to protein (g) Kaukau: 77, pitpit (succulent core of a thick-stemmed grass): 60. | “Pigs are plentiful and usually eaten for several meals, at least once a month, and often more frequently”, “gardens are large and always productive”. | Two main meals per day (morning and evening). Mumu (social gatherings). |
| Household #1; Day 4 | Kaukau: 39,856, sugarcane: 13,209. | Kaukau: 57, ne and ebia (green leaf vegetable): 57. | ||||
| Sinnet, 1972, [23] | Highlands (Western) | Adults | Diet consisted almost entirely of kaukau, carbohydrate providing over 90%E. | NR | Fourteen separate varieties of kaukau were consumed by subjects during the survey. | Two main meals per day (morning and evening). Evening meal is a time when family assembles, and friends visit. Influence of cash cropping (cash economy) Social changes in response to European contact. |
| Harvey, 1983, [24] | Highlands (Simbu) | Adults (1981) | Top 3 food sources (%E) Kaukau: 53, all trade store foods: 26, cereals and grains: 22 | Top 3 food sources (%E) Kaukau: 34, all trade store foods: 35, cereals and grains: 25. | The mean number of pigs husbanded by sample households = 4 per year. 51 different varieties of kaukau in the gardens of sample households. Mean daily intake (g) reported as male, female, respectively, for select foods Kaukau: 1107; 875, dark green leaves: 125; 102, pumpkin: 18; 32, corn: 42; 44, rice: 181; 117, flour: 42; 61, tinned fish: 30; 27, sugarcane: 37; 18, pig: 12; 15. | Influence of cash cropping (cash economy). |
| Ohtsuka, 1985, [25] | Southern Rual (Northern) | Male (1981) | Top 5 food categories contributing to energy intake (kJ) §/day Wild plants: 950, sago: 8000, garden crops: 4079, purchased plants: 858, coconut: 423. | Top 5 food categories contributing to protein intake (g)/day Purchased animals: 55, land animals: 17, garden crops: 12. wild plants: 9, aquatic animals: 8. | NR | NR |
| Wonie (Inland) | Male (1971) | Sago: 7644, garden crops: 3841, coconut: 1326, land animals: 586, wild plants: 490. | Purchased animals: 48, land animals: 30, garden crops: 10, sago: 3, coconut: 3. | NR | NR | |
| Wonie (Inland) | Male (1981) | Garden crops: 6657, sago: 6489, purchased plants: 904, land animals: 749, coconut: 42. | Purchased animals: 68, land animals: 36, garden crops: 23, Purchased plants: 6, coconut 3. | NR | NR | |
| Ume (Riverine) | Male (1981) | Garden crops: 5176, sago: 2460, purchased plants: 2247, coconut: 1745, aquatic animals: 397. | Purchased animals: 68, garden crops: 17, land animals: 16, aquatic animals: 15, purchased plants: 13. | NR | NR | |
| Dorogori (Coastal) | Male (1981) | Purchased plants: 5548, garden crops: 5088, sago: 874, coconut: 812, purchased animals: 544. | Purchased animals: 73, purchased plants: 22, aquatic animals: 21, garden crops: 17, land animals: 4. | NR | NR | |
| Ulijaszek, 1987, [26] | Southern (Western) | Bakonabip hamlet 1975 | Proportion (%) of dietary energy from foods (top 2) Taro: 67, traditionally reared or hunted animals: 22. | Proportion (%) of dietary protein from foods (top 2) Traditionally reared or hunted animals: 47, taro: 40. | Proportion (%) of dietary energy All plant sources: 78, all animal sources: 22, all store foods: 0 Proportion of dietary protein All plant sources: 53, all animal sources: 47, all store foods: 0. | Influence of cash cropping (cash economy). |
| Atemkit hamlet 1984 | Kaukau: 46, taro: 35. | Kaukau: 34, traditionally reared or hunted animals: 25. | Proportion (%) of dietary energy All plant sources: 96, all animal sources: 4, all store foods: 0 Proportion of dietary protein All plant sources: 75, all animal sources: 25, all store foods: 0. | |||
| Bultem II workers 1984 | Rice: 22, taro and kaukau: 13. | Tinned meat and fish: 24, rice: 14. | Proportion (%) of dietary energy All plant sources: 80, all store foods: 64, all animal sources: 20 Proportion (%) of dietary protein All store foods: 71, all animal sources: 61, all plant sources: 39. “Western” or imported foods contributed 64% of the energy intake in workers diets and 38% in the diets of workers’ wives”. | |||
| Atemkit hamlet 1984 | Taro: 45, kaukau: 36. | Variety of nuts, fruits and dark leafy greens: 36, taro: 26. | Proportion (%) of dietary energy All plant sources: 99, all animal sources: 1, all store foods: 0 Proportion (%) of dietary protein All plant sources: 91, all animal sources: 9, all store foods: 0 | |||
| Bultem II husbands working 1984 | Taro: 31, rice: 28. | Rice: 22, Variety of nuts, fruits and dark leafy greens: 20. | Proportion (%) of dietary energy All plant sources: 90, all store foods: 38, all animal sources: 10 Proportion (%) of dietary protein All plant sources: 63, all store foods: 43, all animal sources: 37. | |||
| Shack, 1990, [27] | Momase | Mothers | NR | NR | Food frequency scores †. Results reported as: Grass Country; Wosera; Middle Sepik Fish (fresh, dried, tinned): 9; 10; 10, rice: 3; 3; 4, coconut: 7; 10; 8, yams + kaukau: 4; 11; 7, greens: 10; 12; 12, sago: 6; 6; 9. | Influence of cash cropping (cash economy) |
| Grossman, 1991, [28] | Highlands (Eastern) | Household Sample | NR | NR | Most frequently consumed foods, household sample; % of meals in which food is consumed (top 3) Kaukau: 90; pumpkin: 17; enriched rice: 17. Frequency of consumption of food groups, % of meals in which foods appeared Subsistence All subsistence crops: 95 Garden greens: 23, legumes: 12. Purchased Rice, canned fish, canned beef: 19, animal protein: 22, cereal and grains: 20, energy-dense and protein-rich foods: 26. | Two main meals per day (morning and evening). “Villagers ate an average of 2.8 different foods per meal; the morning meal contained an average of 2 foods and the second meal consisted of 3.6 items”. Influence of cash cropping (cash economy). |
| Ulijaszek, 1992, [29] | Southern (Western) | Adult Males | Proportion of total energy during wet: wetter times of the year (%) Sago: 27:35, plantain: 40:35, starchy roots and tubers: 24:16, rice and wheat products: 2:5, nuts: 3:3, green leafy vegetables: 1:0, all animal foods: 2:5 | NR | Pig was shared among kin and only constituted a very small part of the diet. | NR |
| Hodge, 1996, [30] | Southern (Port Moresby) | Wanigela people of Kori | Percentage contributed by major food sources to energy (%) Cooked banana: 11, white rice: 10, cassava: 7, white bread or roll 6, fish 5, kaukau 4. | Percentage contributed by major food sources to protein (%) Fresh fish: 28, tinned mackerel: 4, tinned corned beef: 4. | Percentage contributed by major food sources to carbohydrate (%) Cooked banana: 17, white rice: 15, cassava: 11, white bread or roll 7, kaukau 6. | Influence of cash cropping (cash economy). Older generations have retained a traditional diet compared to younger generations. |
| Muntwiler, 2000, [31] | Highlands (Eastern) | Households | NR | Sources of protein foods Winged beans; peanuts; Maggi noodles; lamb flaps; mushroom; wild animals; pig meat; tinned fish; chicken; insects; tinned meat. | % of households Types of foods eaten at breakfast Kaukau: 52, kaukau and greens: 47, sugarcane: 10, pumpkin: 7, corn: 6, tea: 6, taro: 3, potato: 3, beans: 3, chicken: 3, other: 4, nothing: 3. Types of foods eaten at lunch nothing: 63, kaukau: 27, kaukau and greens: 7, sugarcane: 5, sweet banana: 5, fruits: 3, insects: 1. Types of foods eaten at dinner Kaukau and greens: 78, corn: 21, kaukau: 15, potato: 11, rice: 10, tea: 4, chicken: 3, Maggi noodles: 3, pumpkin: 3, banana: 3, taro: 3, other: 9. | Two main meals per day (morning and evening). |
| Yamauchi, 2001, [33] | Highlands and Southern | Huli, Tari Basin, Southern Highland Province and Migrants from Tari Basin to Port Moresby, National Capital District | NR | NR | NR | Influence of cash cropping (cash economy). |
| Morita, 2015, [34] | Highlands | Frigano | NR | Median (IQR) protein intake (g) reported by male/female Animal sources: 8 (5–18): 9 (5–14), vegetable sources: 37 (29–62): 31 (22–40), root crops: 8 (4–13): 5 (4–7), green leaves: 5 (3–7): 4 (2–6), rice: 6 (2–16): 4 (1–8), bakery: 5 (1–10): 5 (2–10). | NR | Influence of cash cropping (cash economy). |
| Wenani | NR | Animal sources: 7 (2–20): 6 (2–9), vegetable sources: 32 (24–40): 38 (23–49), root crops: 15 (13–17): 15 (14–19), green leaves: 3 (2–5): 3 (2–3), rice: 3 (1–7): 4 (1–6), bakery: 2 (1–9): 3 (1–6). | NR | |||
| Levani | NR | Animal sources: 4 (2–8): 5 (1–9), vegetable sources: 26 (23–31): 21 (15–27), root crops: 16 (14–20): 12 (10–15), green leaves: 2 (1–5): 1 (0–3), rice: 3 (1–5): 2 (1–3), bakery: 0 (0–0): (0–0). | ||||
| Goris, 2017, [35] | Southern (Gulf) | Infants, Children, and non-pregnant women | NR | NR | % of households consuming the food group White roots and tubers: 100, dark green leafy vegetables: 100, betel nut, tobacco: 86, oils, fats, butter, coconut: 74, vegetables, tubers fruits that are yellow or orange: 41, legumes, nuts, seeds: 29, flesh meat: 29, grubs, snails or insects: 7, other fruits or vegetables: 6, eggs: 6, fish (tinned): 6, foods made from grains: 4, sugary foods: 3, organ meat: 0, milk (powder), cheese, yoghurt products: 0. | NR |
Disclaimer/Publisher’s Note: The statements, opinions and data contained in all publications are solely those of the individual author(s) and contributor(s) and not of MDPI and/or the editor(s). MDPI and/or the editor(s) disclaim responsibility for any injury to people or property resulting from any ideas, methods, instructions or products referred to in the content. |
© 2024 by the authors. Licensee MDPI, Basel, Switzerland. This article is an open access article distributed under the terms and conditions of the Creative Commons Attribution (CC BY) license (https://creativecommons.org/licenses/by/4.0/).
Share and Cite
Davies, A.; Chen, J.; Peters, H.; Lamond, A.; Rangan, A.; Allman-Farinelli, M.; Porykali, S.; Oge, R.; Nogua, H.; Porykali, B. What Do We Know about the Diets of Pacific Islander Adults in Papua New Guinea? A Scoping Review. Nutrients 2024, 16, 1472. https://doi.org/10.3390/nu16101472
Davies A, Chen J, Peters H, Lamond A, Rangan A, Allman-Farinelli M, Porykali S, Oge R, Nogua H, Porykali B. What Do We Know about the Diets of Pacific Islander Adults in Papua New Guinea? A Scoping Review. Nutrients. 2024; 16(10):1472. https://doi.org/10.3390/nu16101472
Chicago/Turabian StyleDavies, Alyse, Juliana Chen, Hannah Peters, Alex Lamond, Anna Rangan, Margaret Allman-Farinelli, Shelina Porykali, Robin Oge, Hans Nogua, and Bobby Porykali. 2024. "What Do We Know about the Diets of Pacific Islander Adults in Papua New Guinea? A Scoping Review" Nutrients 16, no. 10: 1472. https://doi.org/10.3390/nu16101472
APA StyleDavies, A., Chen, J., Peters, H., Lamond, A., Rangan, A., Allman-Farinelli, M., Porykali, S., Oge, R., Nogua, H., & Porykali, B. (2024). What Do We Know about the Diets of Pacific Islander Adults in Papua New Guinea? A Scoping Review. Nutrients, 16(10), 1472. https://doi.org/10.3390/nu16101472