
School Feeding to Improve Cognitive Performance in Disadvantaged Children: A 3-Arm Parallel Controlled Trial in Northwest Pakistan

 , , , and
Abstract
1. Introduction
2. Materials and Methods
2.1. Ethics and Trial Registration
2.2. Sample Size
2.3. Recruitment
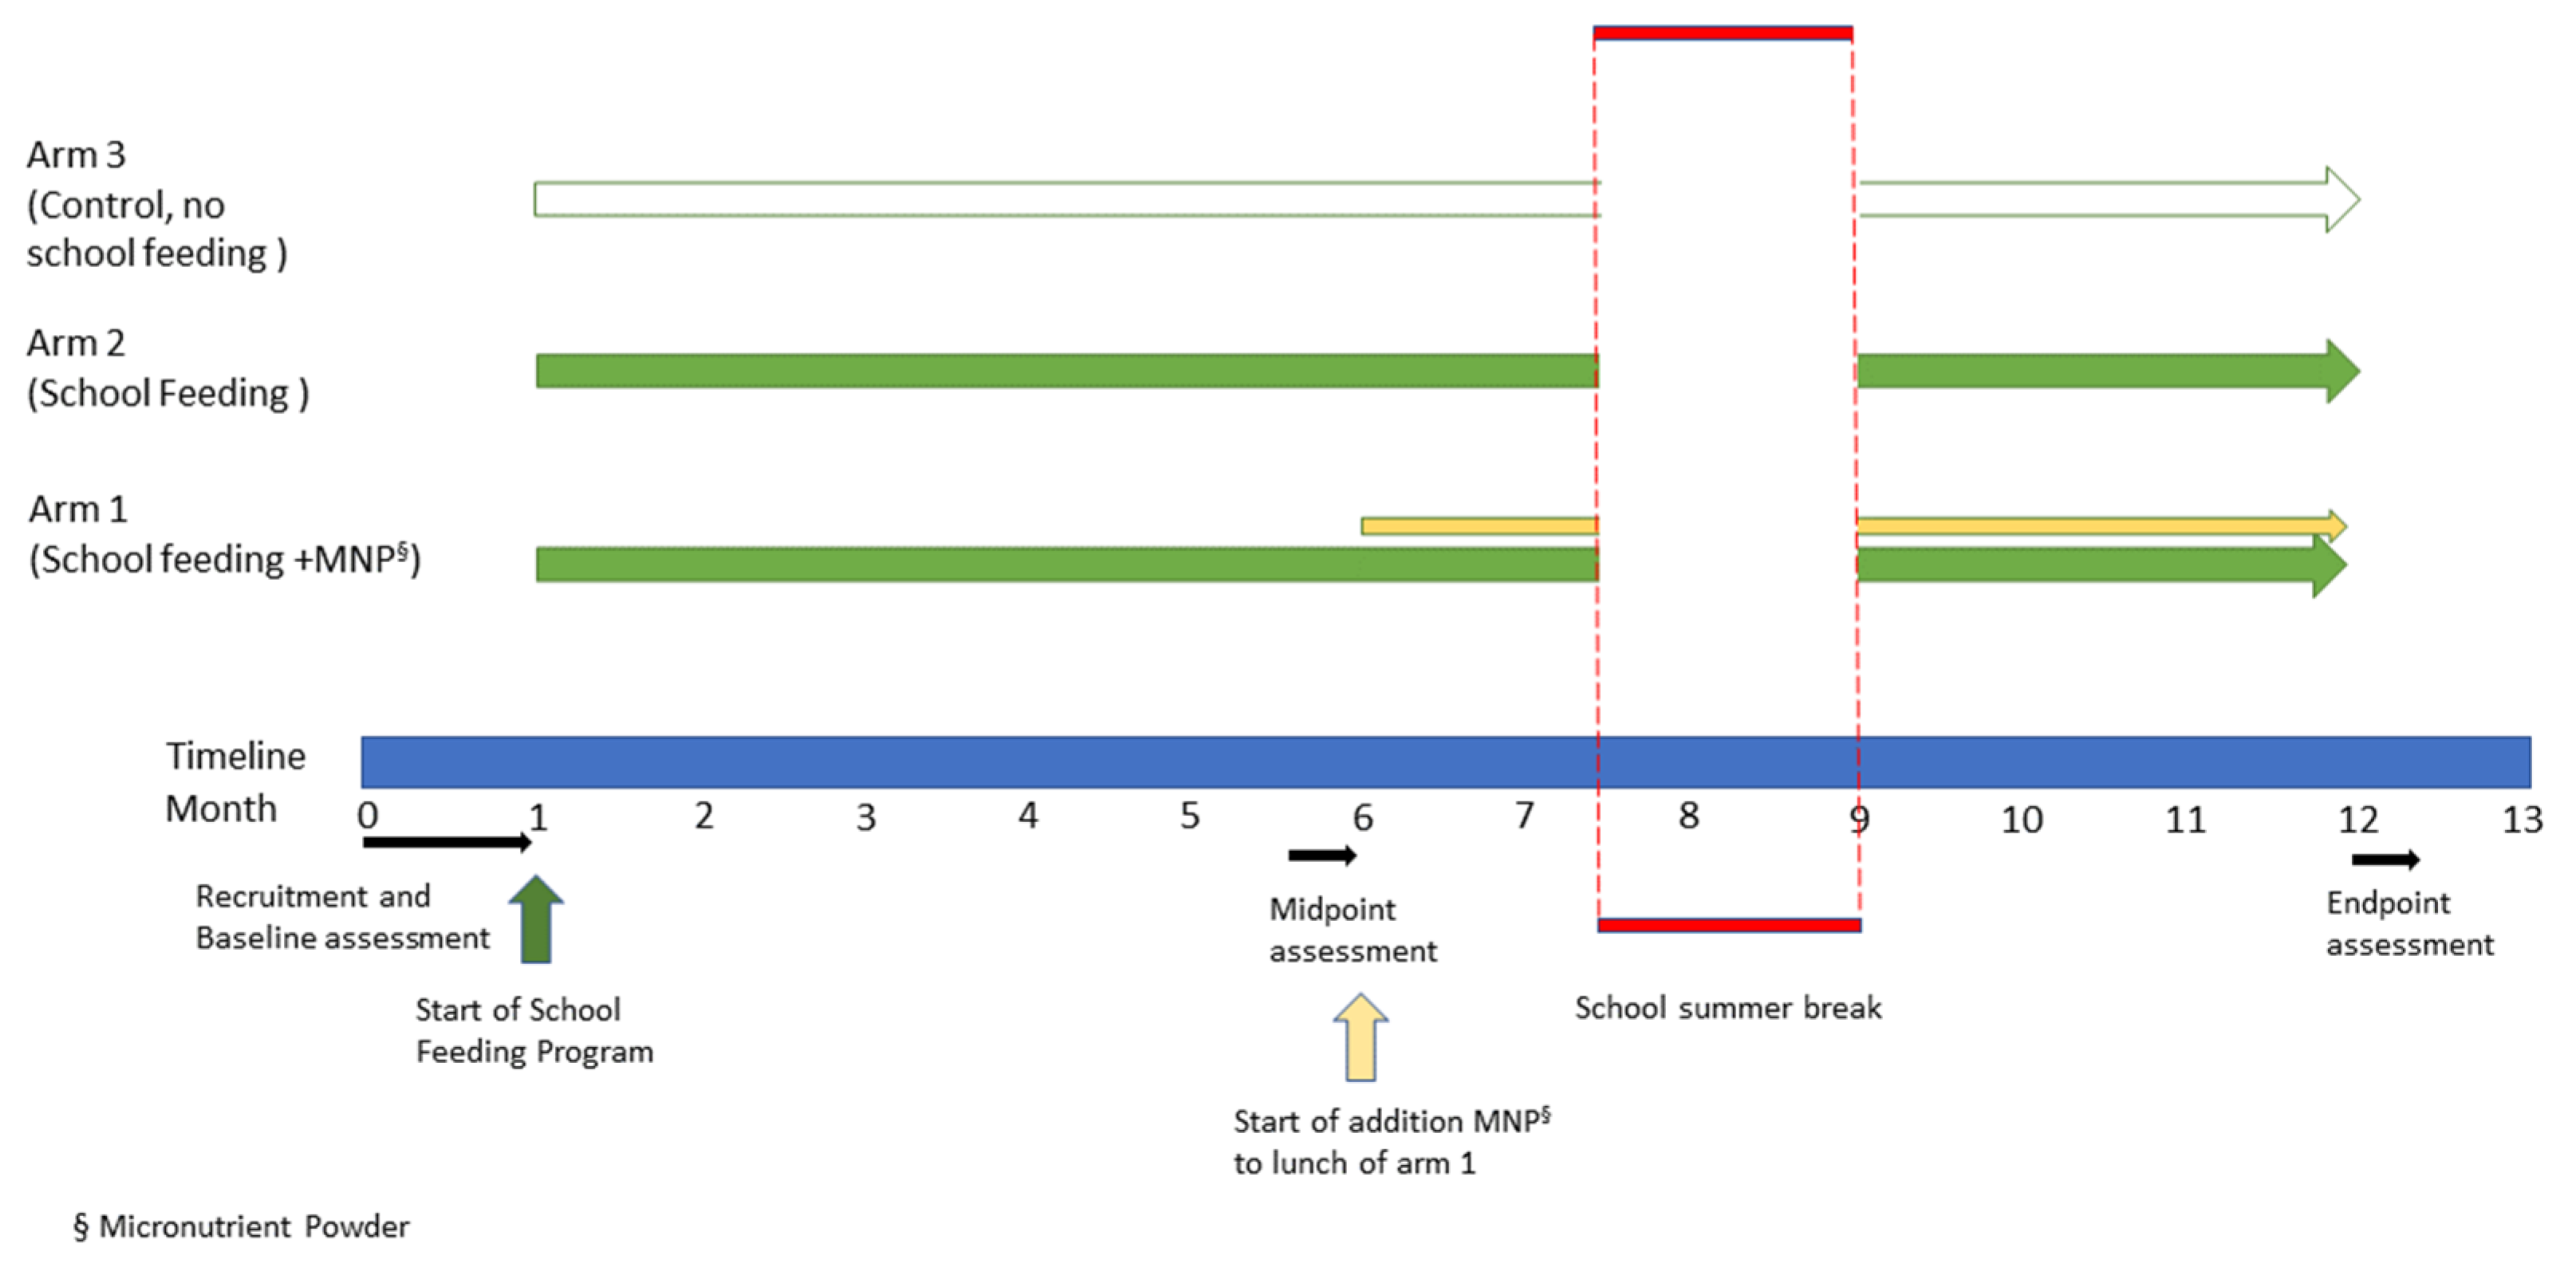
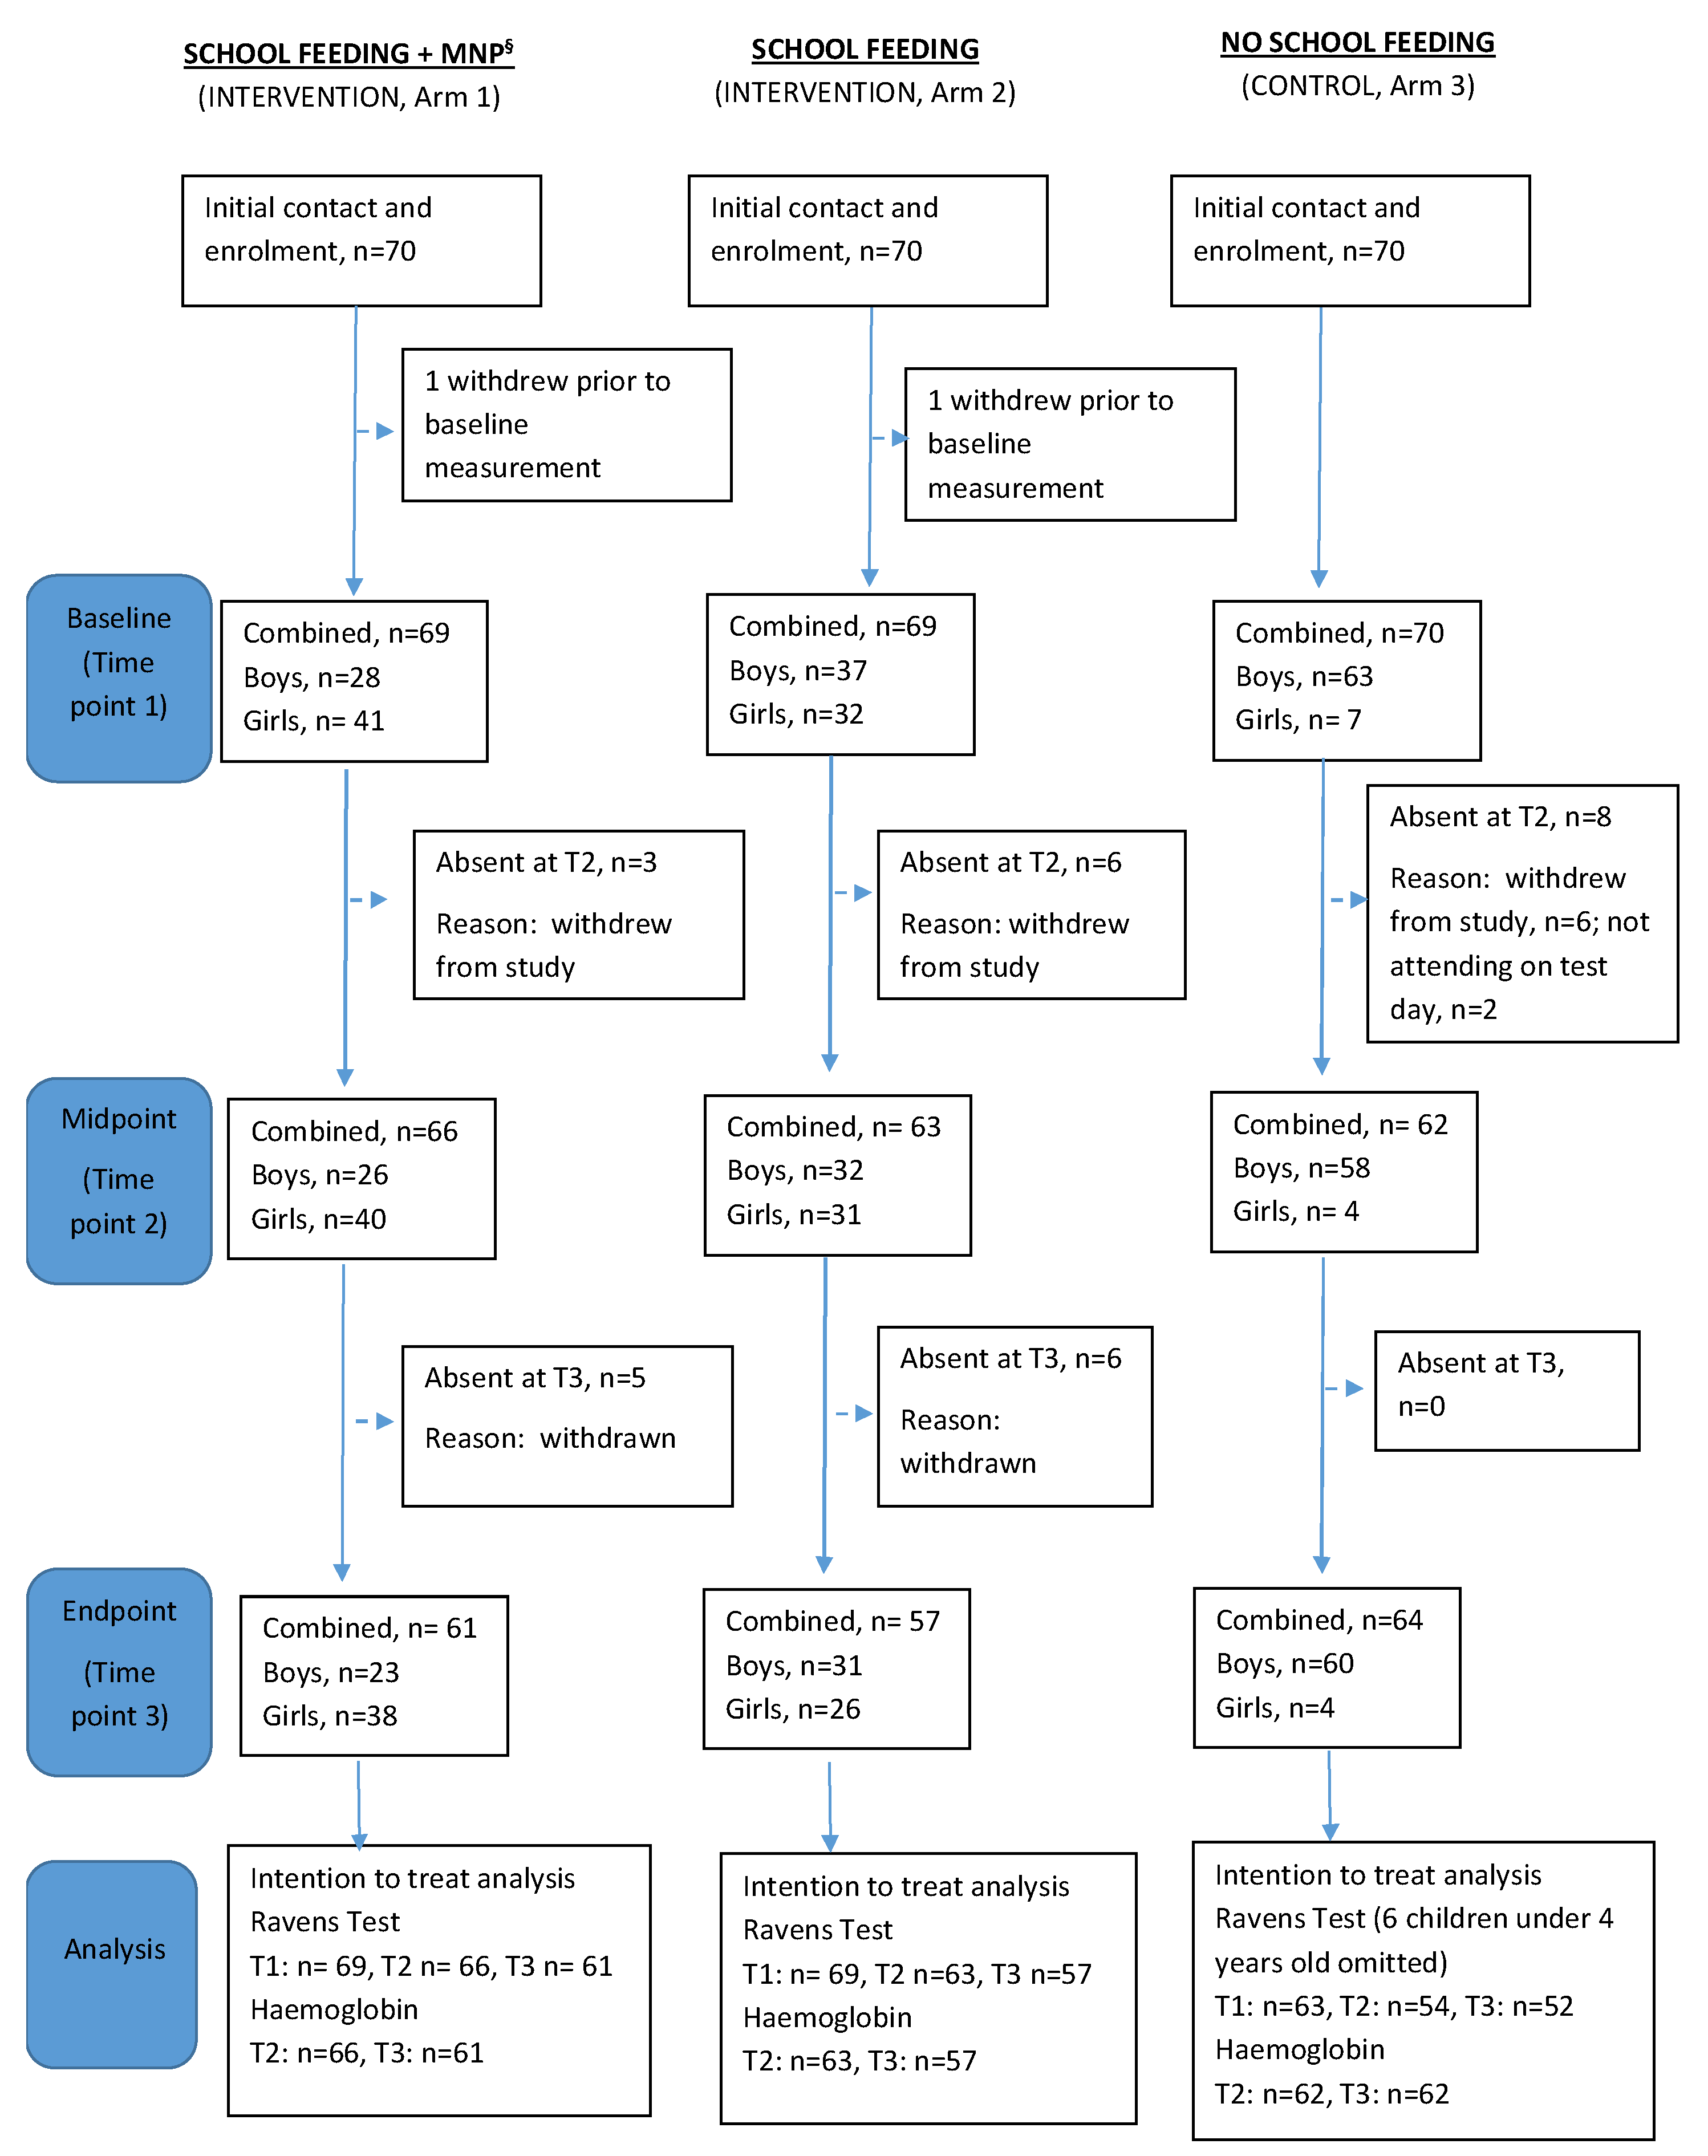
2.4. Study Design
2.5. Intervention and Context
2.6. Primary Outcome Measure
2.7. Secondary Outcome Measure
2.8. Statistical Analyses
3. Results
3.1. Baseline Characteristics
3.2. Effects of Intervention on Cognitive Function, Measured Using RCPM
3.3. Effects of Intervention on Haemoglobin
4. Discussion
Strengths and Limitations
5. Conclusions
Author Contributions
Funding
Institutional Review Board Statement
Informed Consent Statement
Data Availability Statement
Acknowledgments
Conflicts of Interest
References
- Lu, C.; Black, M.M.; Richter, L.M. Risk of poor development in young children in low-income and middle-income countries: An estimation and analysis at the global, regional, and country level. Lancet Glob. Health 2016, 4, e916–e922. [Google Scholar] [CrossRef] [PubMed]
- Daelmans, B.; Darmstadt, G.L.; Lombardi, J.; Black, M.M.; Britto, P.R.; Lye, S.; Dua, T.; Bhutta, Z.Q.A.; Richter, L.M.; Development, L.E.C. Early childhood development: The foundation of sustainable development. Lancet 2017, 389, 9–11. [Google Scholar] [CrossRef] [PubMed]
- Grantham-McGregor, S.; Cheung, Y.B.; Cueto, S.; Glewwe, P.; Richter, L.; Strupp, B.; Grp, I.C.D.S. Child development in developing countries 1-Developmental potential in the first 5 years for children in developing countries. Lancet 2007, 369, 60–70. [Google Scholar] [CrossRef] [PubMed]
- Richter, L.M.; Daelmans, B.; Lombardi, J.; Heymann, J.; Boo, F.L.; Behrman, J.R.; Lu, C.L.; Lucas, J.E.; Perez-Escamilla, R.; Dua, T.; et al. Investing in the foundation of sustainable development: Pathways to scale up for early childhood development. Lancet 2017, 389, 103–118. [Google Scholar] [CrossRef] [PubMed]
- Lam, L.F.; Lawlis, T.R. Feeding the brain-The effects of micronutrient interventions on cognitive performance among school-aged children: A systematic review of randomized controlled trials. Clin. Nutr. 2017, 36, 1007–1014. [Google Scholar] [CrossRef] [PubMed]
- Von Grebmer, K.; Bernstein, J.; Mukerji, R.; Patterson, F.; Wiemers, M.; Chéilleachair, R.N.; Foley, C.; Gitter, S.; Ekstrom, K.; Fritschel, H. Global Hunger Index: Food Systems Transformation and Local Governance; Welt Hunger Hilfe CONCERNWorldwide: Bonn/Dublin, Ireland, 2022; Available online: https://www.globalhungerindex.org/pdf/en/2022.pdf (accessed on 22 March 2023).
- United Nations. Global Sustainable Development Goals Indicators Database. 2021. Available online: https://unstats.un.org/sdgs/indicators/database/ (accessed on 22 March 2023).
- UNICEF. National Nutrition Survey 2018. Key Findings Report. 2019. Available online: https://www.unicef.org/pakistan/media/1951/file/Final%20Key%20Findings%20Report%202019.pdf (accessed on 22 March 2023).
- Bundy, D.; Silva, N.D.; Horton, S.; Jamison, D.T.; Patton, G.C.; Schultz, L.; Galloway, R.; Bing Wu, K.; Azzopardi, P.; Kennedy, E.; et al. Re-Imagining School Feeding: A High-Return Investment in Human Capital and Local Economies; License: Creative Commons Attribution CC BY 3.0 IGO; World Bank: Washington, DC, USA, 2018. [Google Scholar]
- Wang, D.Q.; Fawzi, W.W. Impacts of school feeding on educational and health outcomes of school-age children and adolescents in low- and middle-income countries: Protocol for a systematic review and meta-analysis. Syst. Rev.-Lond. 2020, 9, 55. [Google Scholar] [CrossRef]
- Jomaa, L.H.; McDonnell, E.; Probart, C. School feeding programs in developing countries: Impacts on children’s health and educational outcomes. Nutr. Rev. 2011, 69, 83–98. [Google Scholar] [CrossRef]
- World Food Program. The Impact of School Feeding Programmes; 2019. Available online: https://www.wfp.org/publications/impact-school-feeding-programmes (accessed on 8 February 2021).
- Greenhalgh, T.; Kristjansson, E.; Robinson, V. Realist review to understand the efficacy of school feeding programmes. BMJ-Brit. Med. J. 2007, 335, 858–861. [Google Scholar] [CrossRef]
- Allen, L.H. Interventions for Micronutrient Deficiency Control in Developing Countries: Past, Present and Future. J. Nutr. 2003, 133, 3875S–3878S. [Google Scholar] [CrossRef]
- WHO. Guideline: Use of Multiple Micronutrient Powders for Home Fortification of Foods Consumed by Infants and Children 6–23 Months of Age; WHO: Geneva, Switzerland, 2011. [Google Scholar]
- De-Regil, L.M.; Jefferds, M.E.D.; Peña-Rosas, J.P. Point-of-use fortification of foods with micronutrient powders containing iron in children of preschool and school-age. Cochrane Database Syst. Rev. 2017, 2017, CD009666. [Google Scholar] [CrossRef]
- Tam, E.; Keats, E.C.; Rind, F.; Das, J.K.; Bhutta; Zulfiqar, A. Micronutrient Supplementation and Fortification Interventions on Health and Development Outcomes among Children Under-Five in Low- and Middle-Income Countries: A Systematic Review and Meta-Analysis. Nutrients 2020, 12, 289. [Google Scholar] [CrossRef]
- Grillenberger, M.; Neumann, C.G.; Murphy, S.P.; Bwibo, N.O.; Weiss, R.E.; Jiang, L.; Hautvast, J.G.; West, C.E. Intake of micronutrients high in animal-source foods is associated with better growth in rural Kenyan school children. Br. J. Nutr. 2006, 95, 379–390. [Google Scholar] [CrossRef]
- Hall, A.G.; Ngu, T.; Nga, H.T.; Quyen, P.N.; Hong Anh, P.T.; King, J.C. An Animal-Source Food Supplement Increases Micronutrient Intakes and Iron Status among Reproductive-Age Women in Rural Vietnam. J. Nutr. 2017, 147, 1200–1207. [Google Scholar] [CrossRef]
- Pakistan Bureau of Statistics. 2017. Available online: https://www.pbs.gov.pk/content/final-results-census-2017-0 (accessed on 23 February 2023).
- WHO. Nutrient Requirements and Dietary Guidelines. Available online: https://apps.who.int/nutrition/publications/nutrient/en/index.html (accessed on 22 March 2023).
- World Health Organization. WHO Anthro (Version 3.2.2, January 2011). Available online: https://www.who.int/tools/child-growth-standards/software (accessed on 23 February 2023).
- World Health Organisation; Multicentre Growth Reference Study Group. WHO Child Growth Standards. Length, Height for-Age, Weightfor-Age, Weight-for-Length and Body Mass Index-for Age. Methods and Development. 2006. Available online: https://www.who.int/childgrowth/standards/Technical_report.pdf (accessed on 23 February 2023).
- Raven, J.C. Guide to Using the Coloured Progressive Matrices Sets A, Ab, B. (Revised Order, 1956); H.K. Lewis: London, UK, 1965. [Google Scholar]
- Raven, J. Raven progressive matrices. In Handbook of Nonverbal Assessment; Springer: Berlin/Heidelberg, Germany, 2003; pp. 223–237. [Google Scholar]
- Soofi, S.B.; Hussain, I.; Mehboob, N.; Hussain, M.; Bhatti, Z.; Khan, S.; Hasan, S.; Bhutta, Z.A. Impoverished Rural Districts of Pakistan: An Independent Evaluation of Impact on Educational and Cognitive Outcomes in Sindh Province, Pakistan. IDS Bull. 2013, 44, 48–56. [Google Scholar] [CrossRef]
- Raven, J. The Raven’s Matrices: Change and stability over culture and time. Cogn. Psychol. 2000, 41, 1–48. [Google Scholar] [CrossRef]
- Courchesne, V.; Meilleur, A.A.S.; Poulin-Lord, M.P.; Dawson, M.; Soulieres, I. Autistic children at risk of being underestimated: School-based pilot study of a strength-informed assessment. Mol. Autism. 2015, 6, 12. [Google Scholar] [CrossRef]
- Sinclair, J.; Bottoms, L.; Dillon, S.; Allan, R.; Shadwell, G.; Butters, B. Effects of Montmorency Tart Cherry and Blueberry Juice on Cardiometabolic and Other Health-Related Outcomes: A Three-Arm Placebo Randomized Controlled Trial. Int. J. Environ. Res. Public Health 2022, 19, 5317. [Google Scholar] [CrossRef]
- Cotton, S.M.; Kiely, P.M.; Crewther, D.P.; Thomson, B.; Laycock, R.; Crewther, S.G. A normative and reliability study for the Raven’s Coloured Progressive Matrices for primary school aged children from Victoria, Australia. Pers. Individ. Differ. 2005, 39, 647–659. [Google Scholar] [CrossRef]
- Black, M.M. Micronutrient deficiencies and cognitive functioning. J. Nutr. 2003, 133, 3927s–3931s. [Google Scholar] [CrossRef]
- Yang, L.; Liu, J.M.; Ye, R.W.; Hong, S.X.; Zheng, J.C.; Ren, A.G. Correlation on hemoglobin concentration and the development of cognition among pre-school children. Zhonghua Liu Xing Bing Xue Za Zhi 2010, 31, 389–393. [Google Scholar]
- Neumann, C.G.; Murphy, S.P.; Gewa, C.; Grillenberger, M.; Bwibo, N.O. Meat Supplementation Improves Growth, Cognitive, and Behavioral Outcomes in Kenyan Children. J. Nutr. 2007, 137, 1119–1123. [Google Scholar] [CrossRef] [PubMed]
- Eilander, A.; Gera, T.; Sachdev, H.S.; Transler, C.; van der Knaap, H.C.; Kok, F.J.; Osendarp, S.J. Multiple micronutrient supplementation for improving cognitive performance in children: Systematic review of randomized controlled trials. Am. J. Clin. Nutr. 2009, 91, 115–130. [Google Scholar] [CrossRef] [PubMed]
- Lee, R.; Singh, L.; van Liefde, D.; Callaghan-Gillespie, M.; Steiner-Asiedu, M.; Saalia, K.; Edwards, C.; Serena, A.; Hershey, T.; Manary, M.J. Milk Powder Added to a School Meal Increases Cognitive Test Scores in Ghanaian Children. J. Nutr. 2018, 148, 1177–1184. [Google Scholar] [CrossRef] [PubMed]
- Murphy, S.P.; Gewa, C.; Liang, L.-J.; Grillenberger, M.; Bwibo, N.O.; Neumann, C.G. School Snacks Containing Animal Source Foods Improve Dietary Quality for Children in Rural Kenya. J. Nutr. 2003, 133, 3950S–3956S. [Google Scholar] [CrossRef]


| Nutrients ¶ | Amount per Serving | Contribution to Daily Intake Recommendation (%) § |
|---|---|---|
| Energy (kcal) | 593 | 27.2–48.4 |
| Fat (g) | 38 | 44.7–110.0 |
| Protein (g) | 10 | 24.4–61.7 |
| Carbohydrates (g) | 57 | NA |
| Vitamin A (µg RAE) | 0 | - |
| Iron (mg) | 1 | 3.4–7.9 |
| Zinc (mg) | 2 | 11.7–20.8 |
| Calcium (mg) | 8 | 0.2–1.3 |
| Iodine (µg) | 3 | 2.5–3.3 |
| Copper (mg) | 1 | NA |
| Folic acid (µg) | 39 | 9.8–19.5 |
| Nutrient | Amount/0.4 g | Nutrient Source | Contribution to Daily Intake Recommendation (%) § |
|---|---|---|---|
| Vit A RE | 500 μg | Vitamin A palmitate 250,000 IU/g (beadlet) or Vitamin A acetate 325,000 IU/g (beadlet) | 80–125% |
| Vitamin D3 | 5 μg | Dry vitamin D3 100,000 IU/g (CWS or beadlet) | 100% |
| Vit. E TE | 7 mg | Dry vitamin E acetate 500 IU/g (CWS) | 70–140% |
| Vit. K1 | 60 μg | Dry vitamin K1 (5% CWS) | 109–300% |
| Vitamin B1 | 0.9 mg | Thiamine mononitrate | 75–150% |
| Vitamin B2 | 0.9 mg | Riboflavin fine powder or riboflavin 5 phosphate | 69–150-% |
| Vitamin B6 | 1 mg | Pyridoxine hydrochloride | 77–160% |
| Vitamin B12 | 1.8 μg | Cyanocobalamin (1% or 0.1%) | 75–150% |
| Niacin | 12 mg | Niacinamide | 75–150% |
| Folic acid | 180 μg * | Folic acid | 75–150% |
| Vitamin C | 30 mg | Ascorbic acid fine powder | 75–100% |
| Iron | 12.5 mg | NaFeEDTA (2.5 mg) + Ferric pyrophosphate micronized (difference) or coated ferrous fumarate | 43–99% |
| Zinc | 5.6 mg | Zinc sulphate or Zinc gluconate | 33–58% |
| Copper | 0.6 mg | Copper gluconate or Copper sulphate | NA |
| Iodine | 120 μg | Potassium iodide | 30.0–60.0 |
| Baseline (T1) Characteristic | School Feeding (n = 69) | School Feeding + MNP (n = 69) | No School Feeding (n = 63) |
|---|---|---|---|
| Age (years) mean (SD) Age range (years) | 8.5 (1.9) 5.0–12.0 | 7.9 (1.6) 5.0–12.0 | 5.1 (0.9) 4.0–6.0 |
| Sex, N (%) Male Female | 37 (54%) 32 (46%) | 28 (41%) 41 (59%) | 56 (89%) 7 (11%) |
| Mass (Kgs), mean (SD) | 27.3 (7.08) | 24.7 (5.00) | 20.6 (2.54) ¶ |
| Height (cm), mean (SD) | 126.4 (9.76) | 122.3 (9.69) | 117.8 (7.26) |
| MUAC (cm), mean (SD) | 17.8 (1.64) | 18.5 (7.87) | 16.1 (1.09) |
| Weight for age z-score §, mean (SD) Total number wasted (%) % Mild (z-score −1.0 to −1.9) % Moderate (z-score −2.0 to −2.9) % Severe (z-score ≤ −3.0) | 0.0 (1.30) 10 (23) 80 20 0 | −0.24 (1.32) 17 (29) 65 29 6 | 0.19 (0.77) ¶ 4 (6) 75 25 0 |
| Height for age z-score, mean (SD) Total number stunted (%) % Mild (z=score −1.0 to −1.9) % Moderate (z-score −2.0 to −2.9) % Severe (z-score ≤ −3.0) | −1.05 (1.79) 32 (49) 34 41 25 | −0.99 (1.77) 33 (49) 33 77 53 | 0.78 (1.26) 3 (5) 67 33 0 |
| BMI for age z-score, mean (SD) | 0.12 (1.48) | 0.08 (1.61) | −0.47 (0.95) ¶ |
| School Feeding | School Feeding + MNP * | No School Feeding | |||||||
|---|---|---|---|---|---|---|---|---|---|
| n | Mean | SD | n | Mean | SD | n | Mean | SD | |
| RCPM (T1) | 69 | 12.38 | 5.17 | 69 | 10.65 | 4.89 | 63 | 8.62 | 4.24 |
| RCPM (T2) | 63 | 14.27 | 5.34 | 66 | 11.15 | 4.62 | 54 | 9.33 | 3.99 |
| RCPM (T3) | 57 | 15.04 | 6.82 | 61 | 13.54 | 5.15 | 52 | 10.08 | 3.23 |
| School Feeding | School Feeding + MNP * | No School Feeding | |||||||
|---|---|---|---|---|---|---|---|---|---|
| n | Mean | SD | n | Mean | SD | n | Mean | SD | |
| Haemoglobin (g/dL) (T2) | 63 | 11.56 | 0.77 | 66 | 11.42 | 0.76 | 62 | 11.58 | 0.86 |
| Haemoglobin (g/dL) (T3) | 57 | 11.39 | 0.84 | 61 | 11.45 | 1.24 | 62 | 11.33 | 1.15 |
Disclaimer/Publisher’s Note: The statements, opinions and data contained in all publications are solely those of the individual author(s) and contributor(s) and not of MDPI and/or the editor(s). MDPI and/or the editor(s) disclaim responsibility for any injury to people or property resulting from any ideas, methods, instructions or products referred to in the content. |
© 2023 by the authors. Licensee MDPI, Basel, Switzerland. This article is an open access article distributed under the terms and conditions of the Creative Commons Attribution (CC BY) license (https://creativecommons.org/licenses/by/4.0/).
Share and Cite
Lowe, N.M.; Qualter, P.; Sinclair, J.K.; Gupta, S.; Zaman, M. School Feeding to Improve Cognitive Performance in Disadvantaged Children: A 3-Arm Parallel Controlled Trial in Northwest Pakistan. Nutrients 2023, 15, 1768. https://doi.org/10.3390/nu15071768
Lowe NM, Qualter P, Sinclair JK, Gupta S, Zaman M. School Feeding to Improve Cognitive Performance in Disadvantaged Children: A 3-Arm Parallel Controlled Trial in Northwest Pakistan. Nutrients. 2023; 15(7):1768. https://doi.org/10.3390/nu15071768
Chicago/Turabian StyleLowe, Nicola M., Pamela Qualter, Jonathan K. Sinclair, Swarnim Gupta, and Mukhtiar Zaman. 2023. "School Feeding to Improve Cognitive Performance in Disadvantaged Children: A 3-Arm Parallel Controlled Trial in Northwest Pakistan" Nutrients 15, no. 7: 1768. https://doi.org/10.3390/nu15071768
APA StyleLowe, N. M., Qualter, P., Sinclair, J. K., Gupta, S., & Zaman, M. (2023). School Feeding to Improve Cognitive Performance in Disadvantaged Children: A 3-Arm Parallel Controlled Trial in Northwest Pakistan. Nutrients, 15(7), 1768. https://doi.org/10.3390/nu15071768