
Fucosylated Human Milk Oligosaccharides during the First 12 Postnatal Weeks Are Associated with Better Executive Functions in Toddlers

 , , and
Abstract
1. Introduction
2. Materials and Methods
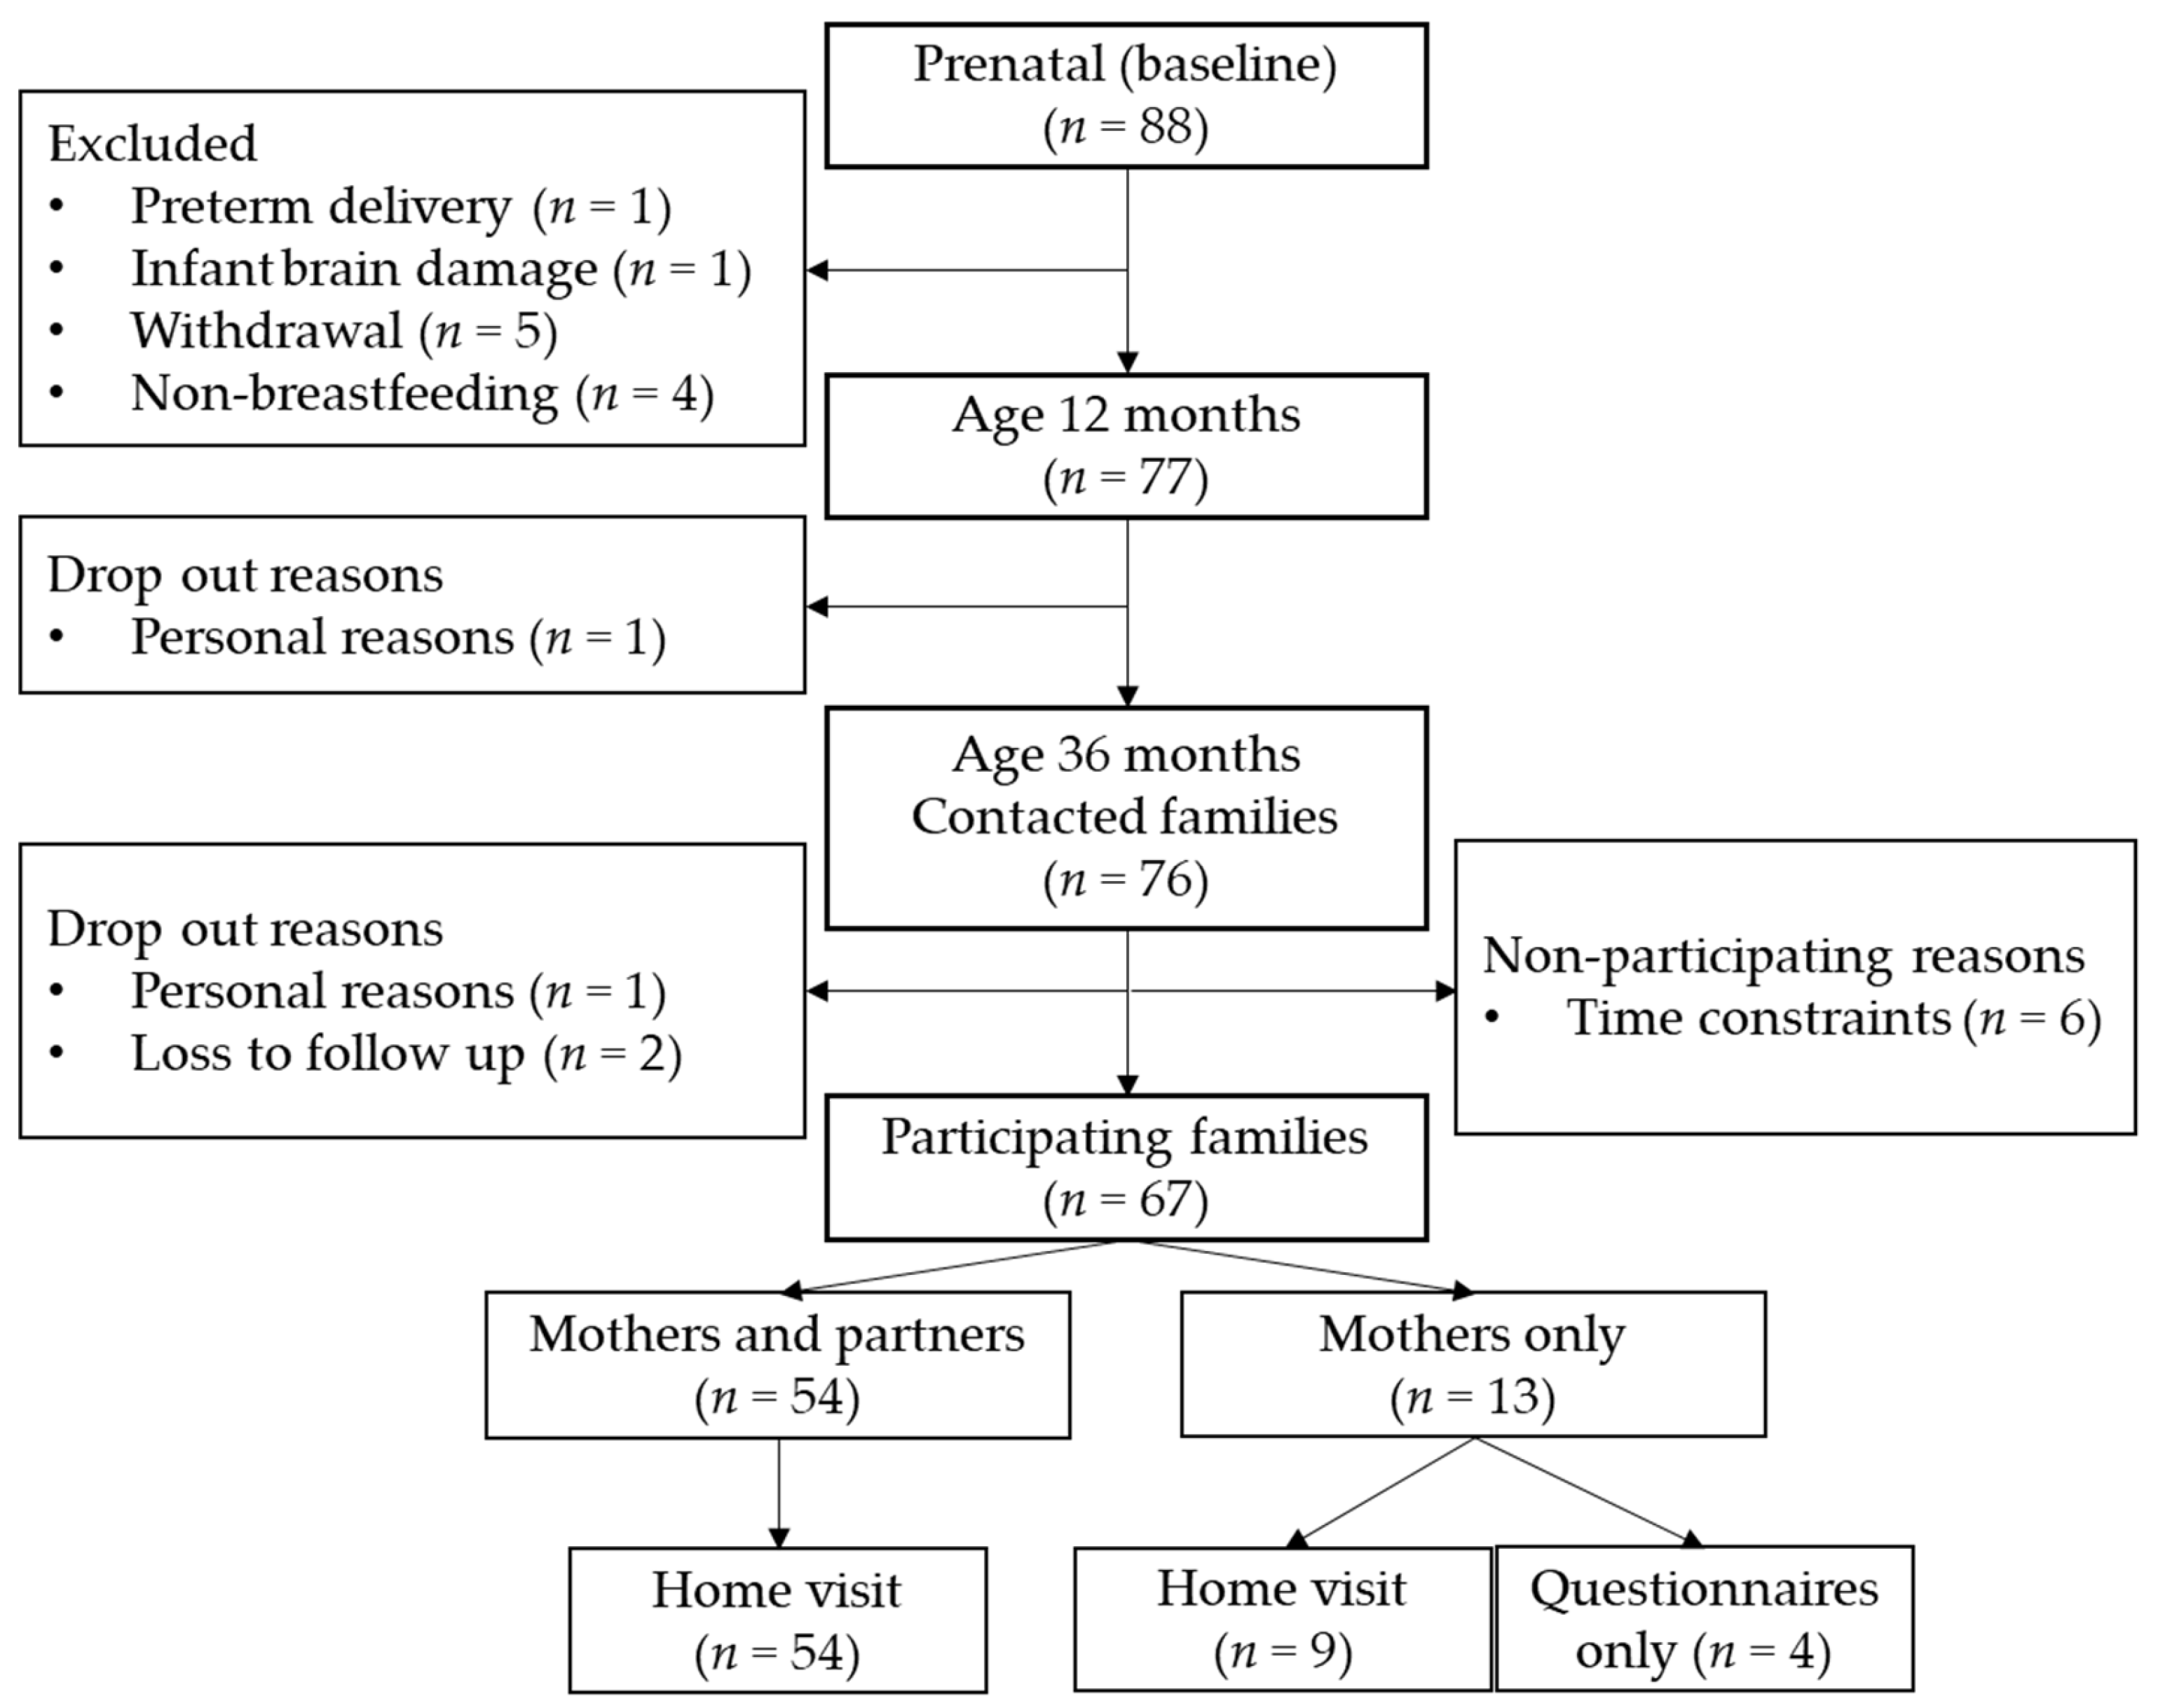
2.1. Participants
2.2. Procedure
2.3. HMOs
2.4. Executive Functions
2.5. Inhibitory Control Tasks
2.6. Scoring of Inhibitory Control Tasks
2.7. Confounders
2.8. Missing Data
2.9. Statistical Analyses
2.10. Exploratory Analyses
2.10.1. Clinically Relevant Executive Function Problems
2.10.2. Individual HMOs and Individual Time Points
3. Results
3.1. Descriptives of Study Population Characteristics and Study Variables

| Characteristics | % | n |
|---|---|---|
| Child sex | ||
| Girl | 49.2 | 31 |
| Boy | 50.8 | 32 |
| Maternal educational level | ||
| Low | 0 | 0 |
| Middle | 14.5 | 9 |
| High | 85.5 | 53 |
| Missing | 1.6 | 1 |
| Age (±SD) | n | |
| Gestational age (weeks) | 39.8 (±1.6) | 63 |
| Child age (months) | 37.6 (±1.1) | 63 |
| Maternal age (years) 1 | 34.5 (±3.6) | 63 |
| Partner age (years) 1 | 35.9 (±4.1) | 47 |
| Breastfeeding | % | n | ||
|---|---|---|---|---|
| Exclusive breastfeeding (2 weeks) | 86 | 54 | ||
| Exclusive breastfeeding (6 weeks) | 89 | 56 | ||
| Exclusive breastfeeding (12 weeks) | 78 | 49 | ||
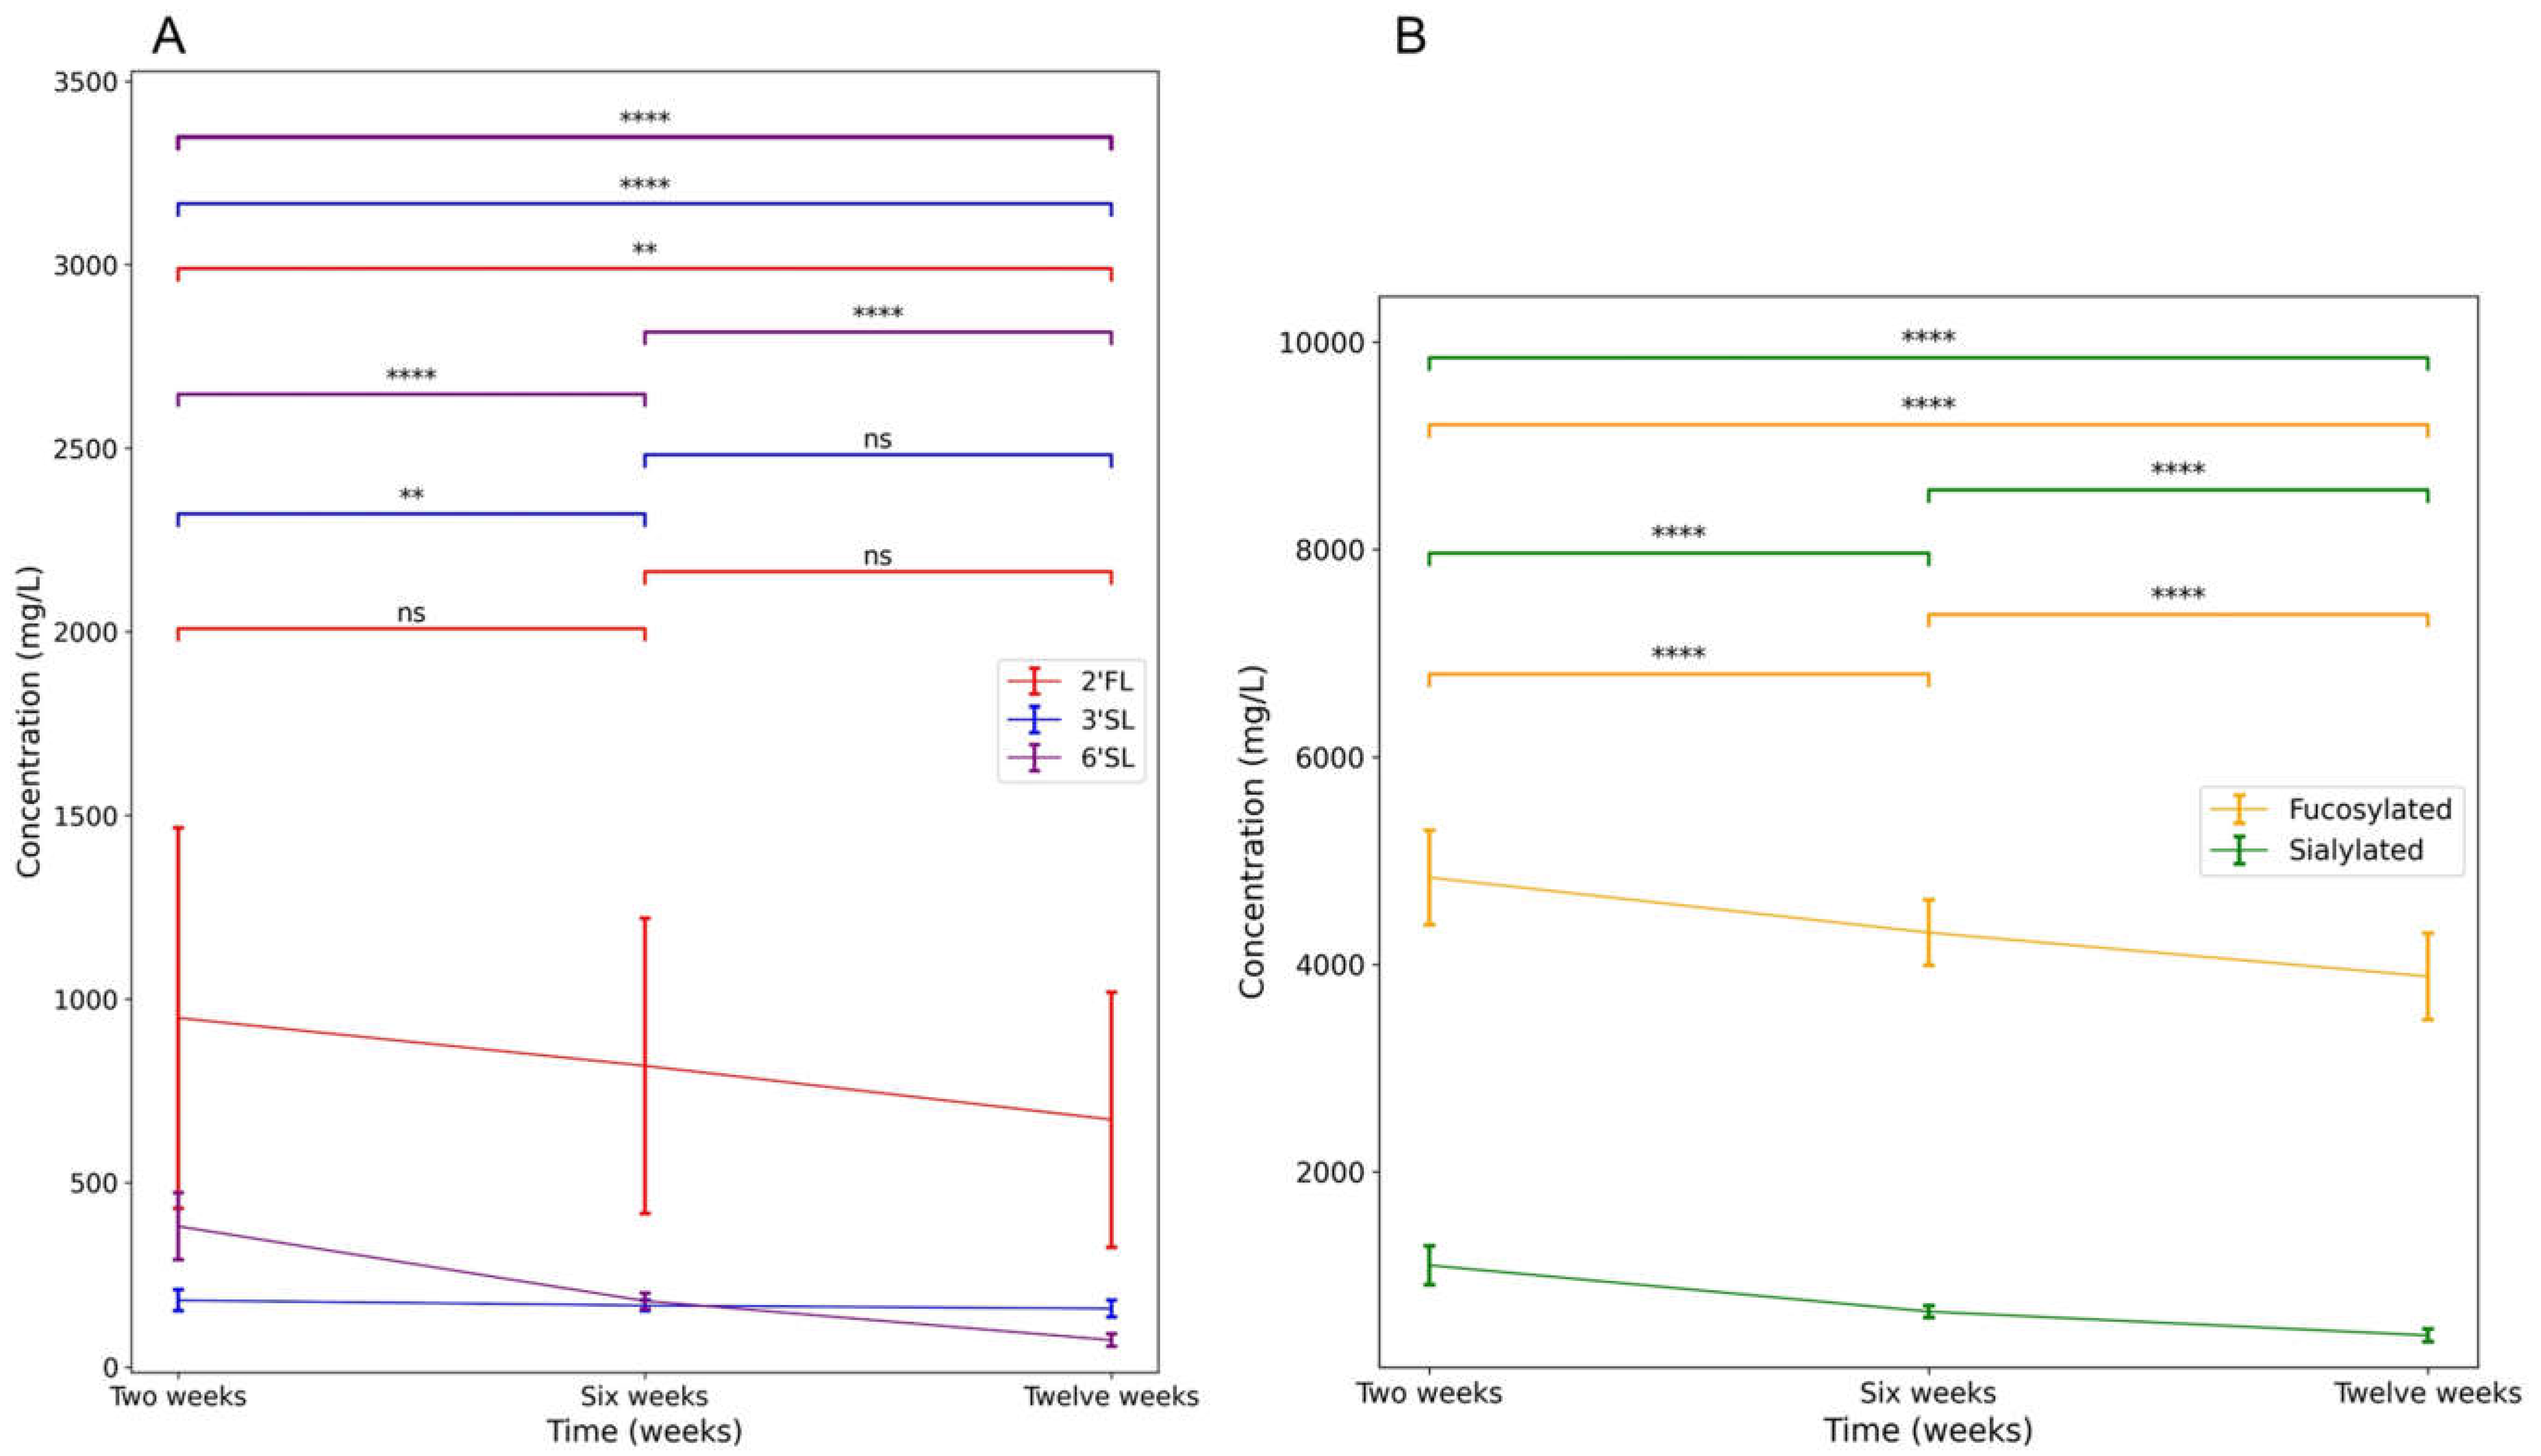
| HMO levels | Mean concentration (g/L) (±SD) 1 | n | Estimated daily intake for exclusively breastfed infants (g) (±SD) 2 | n |
| 2′FL 2 weeks | 0.95 (±0.52) a | 60 | 0.45 (±0.24) | 43 |
| 2′FL 6 weeks | 0.82 (±0.41) ab | 58 | 0.47 (±0.24) | 44 |
| 2′FL 12 weeks | 0.67 (±0.35) b | 54 | 0.41 (±0.23) | 45 |
| 3′SL 2 weeks | 0.18 (±0.03) a | 60 | 0.08 (±0.01) | 43 |
| 3′SL 6 weeks | 0.17 (±0.01) b | 58 | 0.10 (±0.01) | 44 |
| 3′SL 12 weeks | 0.16 (±0.02) b | 54 | 0.10 (±0.01) | 45 |
| 6′SL 2 weeks | 0.38 (±0.09) a | 60 | 0.18 (±0.04) | 43 |
| 6′SL 6 weeks | 0.18 (±0.02) b | 58 | 0.11 (±0.01) | 44 |
| 6′SL 12 weeks | 0.07 (±0.02) c | 54 | 0.04 (±0.01) | 45 |
| Fucosylated HMOs 2 weeks | 4.84 (±0.46) a | 60 | 2.31 (±0.18) | 43 |
| Fucosylated HMOs 6 weeks | 4.31 (±0.32) b | 58 | 2.49 (±0.19) | 44 |
| Fucosylated HMOs 12 weeks | 3.88 (±0.42) c | 54 | 2.45 (±0.29) | 45 |
| Sialylated HMOs 2 weeks | 1.10 (±0.19) a | 60 | 0.52 (±0.07) | 43 |
| Sialylated HMOs 6 weeks | 0.66 (±0.06) b | 57 | 0.38 (±0.04) | 44 |
| Sialylated HMOs 12 weeks | 0.43 (±0.06) c | 54 | 0.27 (±0.03) | 45 |
| Behaviour | Score (±SD) | n | ||
| Executive functions questionnaires | ||||
| BRIEF-P mother | 95.0 (±15.8) | 63 | ||
| BRIEF-P partner | 97.4 (±18.1) | 49 | ||
| REEF mother | 146.4 (±32.6) | 62 | ||
| REEF partner | 144.9 (±28.0) | 48 | ||
| BRIEF-A mother | 108.2 (±19.7) | 62 | ||
| BRIEF-A partner | 108.3 (±16.0) | 43 | ||
| Inhibitory control tasks | ||||
| Flanker | 1.3 (±0.7) | 45 | ||
| Whisper | 1.8 (±0.3) | 59 | ||
| Gift Wrap | 2.1 (±0.9) | 59 | ||
| Gift Delay (seconds) | 77.0 (±28.2) | 59 | ||

3.2. Correlations
3.2.1. Correlations between Executive Function and Inhibitory Control Measures
3.2.2. Correlations between Main HMOs of Interest and Behavioural Measures
3.2.3. Correlations between Potential Confounding Variables and Executive Functions Measures
3.3. Main Analyses
3.3.1. Analyses with Exclusively Breastfed Infants Only
3.3.2. Analyses Including Partially Breastfed Infants
3.4. Exploratory Analyses
3.4.1. Clinically Relevant Executive Function Problems
3.4.2. Individual HMOs and Individual Time Points
4. Discussion
5. Conclusions
Supplementary Materials
Author Contributions
Funding
Institutional Review Board Statement
Informed Consent Statement
Data Availability Statement
Acknowledgments
Conflicts of Interest
References
- De Weerth, C.; Aatsinki, A.-K.; Azad, M.B.; Bartol, F.F.; Bode, L.; Collado, M.C.; Dettmer, A.M.; Field, C.J.; Guilfoyle, M.; Hinde, K.; et al. Human Milk: From Complex Tailored Nutrition to Bioactive Impact on Child Cognition and Behavior. Crit. Rev. Food Sci. Nutr. 2022. online ahead of print. [Google Scholar] [CrossRef] [PubMed]
- Victora, C.G.; Bahl, R.; Barros, A.J.D.; França, G.V.A.; Horton, S.; Krasevec, J.; Murch, S.; Sankar, M.J.; Walker, N.; Rollins, N.C.; et al. Breastfeeding in the 21st Century: Epidemiology, Mechanisms, and Lifelong Effect. Lancet 2016, 387, 475–490. [Google Scholar] [CrossRef] [PubMed]
- Hou, L.; Li, X.; Yan, P.; Li, Y.; Wu, Y.; Yang, Q.; Shi, X.; Ge, L.; Yang, K. Impact of the Duration of Breastfeeding on the Intelligence of Children: A Systematic Review with Network Meta-Analysis. Breastfeed. Med. 2021, 16, 687–696. [Google Scholar] [CrossRef] [PubMed]
- Bartol, F.F.; Wiley, A.A.; George, A.F.; Miller, D.J.; Bagnell, C.A. Physiology and Endocrinology Symposium: Postnatal Reproductive Development and the Lactocrine Hypothesis. J. Anim. Sci. 2017, 95, 2200–2210. [Google Scholar] [CrossRef] [PubMed]
- Liu, H.; Radlowski, E.C.; Conrad, M.S.; Li, Y.; Dilger, R.N.; Johnson, R.W. Early Supplementation of Phospholipids and Gangliosides Affects Brain and Cognitive Development in Neonatal Piglets. J. Nutr. 2014, 144, 1903–1909. [Google Scholar] [CrossRef] [PubMed]
- Bartol, F.F.; Wiley, A.A.; Bagnell, C.A. Epigenetic Programming of Porcine Endometrial Function and the Lactocrine Hypothesis. Reprod. Domest. Anim. 2008, 43, 273–279. [Google Scholar] [CrossRef]
- Bode, L. Human Milk Oligosaccharides: Every Baby Needs a Sugar Mama. Glycobiology 2012, 22, 1147–1162. [Google Scholar] [CrossRef]
- Wang, B. Molecular Mechanism Underlying Sialic Acid as an Essential Nutrient for Brain Development and Cognition. Adv. Nutr. 2012, 3, 465S–472S. [Google Scholar] [CrossRef]
- Oliveros, E.; Martín, M.J.; Torres-Espínola, F.J.; Segura-Moreno, T.; Ramírez, M.; Santos, A.; Buck, R.; Rueda, R.; Escudero, M.; Catena, A.; et al. Human Milk Levels of 2′-Fucosyllactose and 6′-Sialyllactose Are Positively Associated with Infant Neurodevelopment and Are Not Impacted by Maternal BMI or Diabetic Status. J. Nutr. Food Sci. 2021, 4, 24. [Google Scholar]
- Berger, P.K.; Plows, J.F.; Jones, R.B.; Alderete, T.L.; Yonemitsu, C.; Poulsen, M.; Ryoo, J.H.; Peterson, B.S.; Bode, L.; Goran, M.I. Human Milk Oligosaccharide 2′-Fucosyllactose Links Feedings at 1 Month to Cognitive Development at 24 Months in Infants of Normal and Overweight Mothers. PLoS ONE 2020, 15, e0228323. [Google Scholar] [CrossRef]
- Cho, S.; Zhu, Z.; Li, T.; Baluyot, K.; Howell, B.R.; Hazlett, H.C.; Elison, J.T.; Hauser, J.; Sprenger, N.; Wu, D.; et al. Human Milk 3′-Sialyllactose Is Positively Associated with Language Development during Infancy. Am. J. Clin. Nutr. 2021, 114, 588–597. [Google Scholar] [CrossRef]
- Jorgensen, J.M.; Young, R.; Ashorn, P.; Ashorn, U.; Chaima, D.; Davis, J.C.C.; Goonatilleke, E.; Kumwenda, C.; Lebrilla, C.B.; Maleta, K.; et al. Associations of Human Milk Oligosaccharides and Bioactive Proteins with Infant Growth and Development among Malawian Mother-Infant Dyads. Am. J. Clin. Nutr. 2021, 113, 209–220. [Google Scholar] [CrossRef]
- Tonon, K.M.; Miranda, A.; Abrão, A.C.F.V.; de Morais, M.B.; Morais, T.B. Validation and Application of a Method for the Simultaneous Absolute Quantification of 16 Neutral and Acidic Human Milk Oligosaccharides by Graphitized Carbon Liquid Chromatography—Electrospray Ionization—Mass Spectrometry. Food Chem. 2019, 274, 691–697. [Google Scholar] [CrossRef]
- Bode, L.; Jantscher-Krenn, E. Structure-Function Relationships of Human Milk Oligosaccharides. Adv. Nutr. 2012, 3, 383S–391S. [Google Scholar] [CrossRef]
- Soyyilmaz, B.; Mikš, M.H.; Röhrig, C.H.; Matwiejuk, M.; Meszaros-matwiejuk, A.; Vigsnæs, L.K. The Mean of Milk: A Review of Human Milk Oligosaccharide Concentrations throughout Lactation. Nutrients 2021, 13, 2737. [Google Scholar] [CrossRef]
- Thum, C.; Wall, C.R.; Weiss, G.A.; Wang, W.; Szeto, I.M.Y.; Day, L. Changes in Hmo Concentrations throughout Lactation: Influencing Factors, Health Effects and Opportunities. Nutrients 2021, 13, 2272. [Google Scholar] [CrossRef]
- Borewicz, K.; Gu, F.; Saccenti, E.; Hechler, C.; Beijers, R.; de Weerth, C.; van Leeuwen, S.S.; Schols, H.A.; Smidt, H. The Association between Breastmilk Oligosaccharides and Faecal Microbiota in Healthy Breastfed Infants at Two, Six, and Twelve Weeks of Age. Sci. Rep. 2020, 10, 4270. [Google Scholar] [CrossRef]
- Thurl, S.; Munzert, M.; Boehm, G.; Matthews, C.; Stahl, B. Systematic Review of the Concentrations of Oligosaccharides in Human Milk. Nutr. Rev. 2017, 75, 920. [Google Scholar] [CrossRef]
- De Weerth, C. Do Bacteria Shape Our Development? Crosstalk between Intestinal Microbiota and HPA Axis. Neurosci. Biobehav. Rev. 2017, 83, 458–471. [Google Scholar] [CrossRef]
- Cryan, J.F.; O’riordan, K.J.; Cowan, C.S.M.; Sandhu, K.V.; Bastiaanssen, T.F.S.; Boehme, M.; Codagnone, M.G.; Cussotto, S.; Fulling, C.; Golubeva, A.V.; et al. The Microbiota-Gut-Brain Axis. Physiol. Rev. 2019, 99, 1877–2013. [Google Scholar] [CrossRef]
- Bode, L. The Functional Biology of Human Milk Oligosaccharides. Early Hum. Dev. 2015, 91, 619–622. [Google Scholar] [CrossRef] [PubMed]
- Totten, S.M.; Zivkovic, A.M.; Wu, S.; Ngyuen, U.; Freeman, S.L.; Ruhaak, L.R.; Darboe, M.K.; German, J.B.; Prentice, A.M.; Lebrilla, C.B. Comprehensive Profiles of Human Milk Oligosaccharides Yield Highly Sensitive and Specific Markers for Determining Secretor Status in Lactating Mothers. J. Proteome Res. 2012, 11, 6124–6133. [Google Scholar] [CrossRef] [PubMed]
- Underwood, M.A.; German, J.B.; Lebrilla, C.B.; Mills, D.A. Bifidobacterium Longum Subspecies Infantis: Champion Colonizer of the Infant Gut. Pediatr. Res. 2014, 77, 229–235. [Google Scholar] [CrossRef] [PubMed]
- Dalile, B.; Van Oudenhove, L.; Vervliet, B.; Verbeke, K. The Role of Short-Chain Fatty Acids in Microbiota–Gut–Brain Communication. Nat. Rev. Gastroenterol. Hepatol. 2019, 16, 461–478. [Google Scholar] [CrossRef]
- Docq, S.; Spoelder, M.; Wang, W.; Homberg, J.R. The Protective and Long-Lasting Effects of Human Milk Oligosaccharides on Cognition in Mammals. Nutrients 2020, 12, 3572. [Google Scholar] [CrossRef]
- Fleming, S.A.; Mudd, A.T.; Hauser, J.; Yan, J.; Metairon, S.; Steiner, P.; Donovan, S.M.; Dilger, R.N. Dietary Oligofructose Alone or in Combination with 2′-Fucosyllactose Differentially Improves Recognition Memory and Hippocampal MRNA Expression. Nutrients 2020, 12, 2131. [Google Scholar] [CrossRef]
- Fleming, S.A.; Mudd, A.T.; Hauser, J.; Yan, J.; Metairon, S.; Steiner, P.; Donovan, S.M.; Dilger, R.N. Human and Bovine Milk Oligosaccharides Elicit Improved Recognition Memory Concurrent with Alterations in Regional Brain Volumes and Hippocampal MRNA Expression. Front. Neurosci. 2020, 14, 770. [Google Scholar] [CrossRef]
- Obelitz-Ryom, K.; Bering, S.B.; Overgaard, S.H.; Eskildsen, S.F.; Ringgaard, S.; Olesen, J.L.; Skovgaard, K.; Pankratova, S.; Wang, B.; Brunse, A.; et al. Bovine Milk Oligosaccharides with Sialyllactose Improves Cognition in Preterm Pigs. Nutrients 2019, 11, 1335. [Google Scholar] [CrossRef]
- Wang, B.; Yu, B.; Karim, M.; Hu, H.; Sun, Y.; McGreevy, P.; Petocz, P.; Held, S.; Brand-Miller, J. Dietary Sialic Acid Supplementation Improves Learning and Memory in Piglets. Am. J. Clin. Nutr. 2007, 85, 561–569. [Google Scholar] [CrossRef]
- Oliveros, E.; Vázquez, E.; Barranco, A.; Ramírez, M.; Gruart, A.; Delgado-García, J.M.; Buck, R.; Rueda, R.; Martín, M.J. Sialic Acid and Sialylated Oligosaccharide Supplementation during Lactation Improves Learning and Memory in Rats. Nutrients 2018, 10, 1519. [Google Scholar] [CrossRef]
- Oliveros, E.; Ramirez, M.; Vazquez, E.; Barranco, A.; Gruart, A.; Delgado-Garcia, J.M.; Buck, R.; Rueda, R.; Martin, M.J. Oral Supplementation of 2′-Fucosyllactose during Lactation Improves Memory and Learning in Rats. J. Nutr. Biochem. 2016, 31, 20–27. [Google Scholar] [CrossRef]
- Berger, B.; Porta, N.; Foata, F.; Grathwohl, D.; Delley, M.; Moine, D.; Charpagne, A.; Siegwald, L.; Descombes, P.; Alliet, P.; et al. Linking Human Milk Oligosaccharides, Infant Fecal Community Types, and Later Risk to Require Antibiotics. MBio 2020, 1, e03196-19. [Google Scholar] [CrossRef]
- Vázquez, E.; Barranco, A.; Ramírez, M.; Gruart, A.; Delgado-García, J.M.; Martínez-Lara, E.; Blanco, S.; Martín, M.J.; Castanys, E.; Buck, R.; et al. Effects of a Human Milk Oligosaccharide, 2′-Fucosyllactose, on Hippocampal Long-Term Potentiation and Learning Capabilities in Rodents. J. Nutr. Biochem. 2015, 26, 455–465. [Google Scholar] [CrossRef]
- Krug, M.; Wagner, M.; Staak, S.; Smalla, K.H. Fucose and Fucose-Containing Sugar Epitopes Enhance Hippocampal Long-Term Potentiation in the Freely Moving Rat. Brain Res. 1994, 643, 130–135. [Google Scholar] [CrossRef]
- Matthies, H.; Staak, S.; Krug, M. Fucose and Fucosyllactose Enhance In-Vitro Hippocampal Long-Term Potentiation. Brain Res. 1996, 725, 276–280. [Google Scholar] [CrossRef]
- Hauser, J.; Pisa, E.; Arias Vásquez, A.; Tomasi, F.; Traversa, A.; Chiodi, V.; Martin, F.P.; Sprenger, N.; Lukjancenko, O.; Zollinger, A.; et al. Sialylated Human Milk Oligosaccharides Program Cognitive Development through a Non-Genomic Transmission Mode. Mol. Psychiatry 2021, 26, 2854–2871. [Google Scholar] [CrossRef]
- Wang, B. Sialic Acid Is an Essential Nutrient for Brain Development and Cognition. Annu. Rev. Nutr. 2009, 29, 177–222. [Google Scholar] [CrossRef]
- Schnaar, R.L.; Gerardy-Schahn, R.; Hildebrandt, H. Sialic Acids in the Brain: Gangliosides and Polysialic Acid in Nervous System Development, Stability, Disease, and Regeneration. Physiol. Rev. 2014, 94, 461–518. [Google Scholar] [CrossRef]
- Cook, F.; Giallo, R.; Hiscock, H.; Mensah, F.; Sanchez, K.; Reilly, S. Infant Regulation and Child Mental Health Concerns: A Longitudinal Study. Pediatrics 2019, 143, 20180977. [Google Scholar] [CrossRef]
- Montroy, J.J.; Bowles, R.P.; Skibbe, L.E.; McClelland, M.M.; Morrison, F.J. The Development of Self-Regulation across Early Childhood. Dev. Psychol. 2016, 52, 1744. [Google Scholar] [CrossRef]
- Hechler, C.; Beijers, R.; Riksen-Walraven, J.M.; de Weerth, C. Are Cortisol Concentrations in Human Breast Milk Associated with Infant Crying? Dev. Psychobiol. 2018, 60, 639–650. [Google Scholar] [CrossRef] [PubMed]
- Hechler, C.; Beijers, R.; Riksen-Walraven, M.; de Weerth, C. Prenatal Predictors of Postnatal Quality of Caregiving Behavior in Mothers and Fathers. Parenting 2019, 19, 101–119. [Google Scholar] [CrossRef]
- Willemsen, Y.; Beijers, R.; Arias Vasquez, A.; de Weerth, C. Do Breastfeeding History and Diet Quality Predict Inhibitory Control at Preschool Age? Nutrients 2021, 13, 2752. [Google Scholar] [CrossRef] [PubMed]
- Gu, F.; Kate, G.A.T.; Arts, I.C.W.; Penders, J.; Thijs, C.; Lindner, C.; Nauta, A.; Van Leusen, E.; Van Leeuwen, S.S.; Schols, H.A. Combining HPAEC-PAD, PGC-LC-MS, and 1D 1H NMR to Investigate Metabolic Fates of Human Milk Oligosaccharides in 1-Month-Old Infants: A Pilot Study. J. Agric. Food Chem. 2021, 69, 6495–6509. [Google Scholar] [CrossRef] [PubMed]
- Gu, F.; Wang, S.; Beijers, R.; De Weerth, C.; Schols, H.A. Structure-Specific and Individual-Dependent Metabolization of Human Milk Oligosaccharides in Infants: A Longitudinal Birth Cohort Study. J. Agric. Food Chem. 2021, 69, 6186–6199. [Google Scholar] [CrossRef]
- Institute of Medicine (U.S.). Subcommittee on Nutrition during Lactation. In Nutrition during Lactation; National Academy Press: Washington, DC, USA, 1992. [Google Scholar]
- Sherman, E.M.S.; Brooks, B.L. Behavior Rating Inventory of Executive Function—Preschool Version (BRIEF-P): Test Review and Clinical Guidelines for Use. Child Neuropsychol. 2010, 16, 503–519. [Google Scholar] [CrossRef]
- Nilsen, E.S.; Huyder, V.; McAuley, T.; Liebermann, D. Ratings of Everyday Executive Functioning (REEF): A Parent-Report Measure of Preschoolers’ Executive Functioning Skills. Psychol. Assess. 2017, 29, 50–64. [Google Scholar] [CrossRef]
- Anderson, P.J.; Reidy, N. Assessing Executive Function in Preschoolers. Neuropsychol. Rev. 2012, 22, 345–360. [Google Scholar] [CrossRef]
- Eriksen, B.A.; Eriksen, C.W. Effects of Noise Letters upon the Identification of a Target Letter in a Nonsearch Task. Percept. Psychophys. 1974, 16, 143–149. [Google Scholar] [CrossRef]
- Kochanska, G.; Murray, K.; Jacques, T.Y.; Koenig, A.L.; Vandegeest, K.A. Inhibitory Control in Young Children and Its Role in Emerging Internalization. Child Dev. 1996, 67, 490–507. [Google Scholar] [CrossRef]
- Beijers, R.; Riksen-Walraven, M.; Putnam, S.; de Jong, M.; de Weerth, C. Early Non-Parental Care and Toddler Behaviour Problems: Links with Temperamental Negative Affectivity and Inhibitory Control. Early Child. Res. Q. 2013, 28, 714–722. [Google Scholar] [CrossRef]
- Reed, M.A.; Pien, D.L.; Rothbart, M.K. Inhibitory Self-Control in Preschool Children. Merrill. Palmer. Q. 1984, 30, 131–147. [Google Scholar]
- Cinelli, C.; Forney, A.; Pearl, J. A Crash Course in Good and Bad Controls. Sociol. Methods Res. 2021. [Google Scholar] [CrossRef]
- Han, S.M.; Derraik, J.G.B.; Binia, A.; Sprenger, N.; Vickers, M.H.; Cutfield, W.S. Maternal and Infant Factors Influencing Human Milk Oligosaccharide Composition: Beyond Maternal Genetics. J. Nutr. 2021, 151, 1383–1393. [Google Scholar] [CrossRef]
- Yang, S.; Platt, R.W.; Kramer, M.S. Variation in Child Cognitive Ability by Week of Gestation among Healthy Term Births. Am. J. Epidemiol. 2010, 171, 399–406. [Google Scholar] [CrossRef]
- Ardila, A.; Rosselli, M.; Matute, E.; Guajardo, S. The Influence of the Parents’ Educational Level on the Development of Executive Functions. Dev. Neuropsychol. 2005, 28, 539–560. [Google Scholar] [CrossRef]
- Kao, K.; Nayak, S.; Doan, S.N.; Tarullo, A.R. Relations Between Parent EF and Child EF: The Role of Socioeconomic Status and Parenting on Executive Functioning in Early Childhood. Transl. Issues Psychol. Sci. 2018, 4, 122–137. [Google Scholar] [CrossRef]
- Roth, R.M.; Gioia, G.A. Behavior Rating Inventory of Executive Function—Adult Version. Psychol. Assess. Resour. 2005. [Google Scholar]
- Samuel, T.M.; Binia, A.; de Castro, C.A.; Thakkar, S.K.; Billeaud, C.; Agosti, M.; Al-Jashi, I.; Costeira, M.J.; Marchini, G.; Martínez-Costa, C.; et al. Impact of Maternal Characteristics on Human Milk Oligosaccharide Composition over the First 4 Months of Lactation in a Cohort of Healthy European Mothers. Sci. Rep. 2019, 9, 11767. [Google Scholar] [CrossRef]
- Ahlqvist, V.H.; Ekström, L.D.; Jónsson-Bachmann, E.; Tynelius, P.; Madley-Dowd, P.; Neovius, M.; Magnusson, C.; Berglind, D. Caesarean Section and Its Relationship to Offspring General Cognitive Ability: A Registry-Based Cohort Study of Half a Million Young Male Adults. Evid. Based. Ment. Health 2022, 25, 7–14. [Google Scholar] [CrossRef]
- Cheng, E.R.; Poehlmann-Tynan, J.; Mullahy, J.; Witt, W.P. Cumulative Social Risk Exposure, Infant Birthweight, and Cognitive Delay in Infancy. Acad. Pediatr. 2014, 14, 581. [Google Scholar] [CrossRef] [PubMed]
- Hack, M.; Klein, N.K.; Taylor, H.G. Long-Term Developmental Outcomes of Low Birth Weight Infants. Futur. Child. 1995, 5, 176–196. [Google Scholar] [CrossRef]
- Van Buuren, S. Mice: Multivariate Imputation by Chained Equations. J. Stat. Softw. 2011, 45, 3. [Google Scholar] [CrossRef]
- Pruessner, J.C.; Kirschbaum, C.; Meinlschmid, G.; Hellhammer, D.H. Two Formulas for Computation of the Area under the Curve Represent Measures of Total Hormone Concentration versus Time-Dependent Change. Psychoneuroendocrinology 2003, 28, 916–931. [Google Scholar] [CrossRef]
- Blaine, B. Winsorizing. In The SAGE Encyclopedia of Educational Research, Measurement, and Evaluation; SAGE Publications, Inc.: Thousand Oaks, CA, USA, 2018. [Google Scholar]
- Cohen, J. Statistical Power Analysis for the Behavioral Sciences, 2nd ed.; Lawrence Erlbaum Associates: Hillsdale, NJ, USA, 1988. [Google Scholar]
- Wright, M.N.; Ziegler, A. Ranger: A Fast Implementation of Random Forests for High Dimensional Data in C++ and R. J. Stat. Softw. 2015, 77, 1–17. [Google Scholar] [CrossRef]
- Mundfrom, D.; Perrett, J.; Schaffer, J.R.; Piccone, A.; Roozeboom, M. Bonferroni Adjustments in Tests for Regression Coefficients. Mult. Linear Regres. Viewp. 2006, 32, 1. [Google Scholar]
- Vazquez, E.; Barranco, A.; Ramirez, M.; Gruart, A.; Delgado-Garcia, J.M.; Jimenez, M.L.; Buck, R.; Rueda, R. Dietary 2′-Fucosyllactose Enhances Operant Conditioning and Long-Term Potentiation via Gut-Brain Communication through the Vagus Nerve in Rodents. PLoS ONE 2016, 11, e0166070. [Google Scholar] [CrossRef]
- Kuntz, S.; Kunz, C.; Borsch, C.; Vazquez, E.; Buck, R.; Reutzel, M.; Eckert, G.P.; Rudloff, S. Metabolic Fate and Distribution of 2′-Fucosyllactose: Direct Influence on Gut Microbial Activity but Not on Brain. Mol. Nutr. Food Res. 2019, 63, 1900035. [Google Scholar] [CrossRef]
- Sakanaka, M.; Hansen, M.E.; Gotoh, A.; Katoh, T.; Yoshida, K.; Odamaki, T.; Yachi, H.; Sugiyama, Y.; Kurihara, S.; Hirose, J.; et al. Evolutionary Adaptation in Fucosyllactose Uptake Systems Supports Bifidobacteria-Infant Symbiosis. Sci. Adv. 2019, 5, 8. [Google Scholar] [CrossRef]
- Ojima, M.N.; Asao, Y.; Nakajima, A.; Katoh, T.; Kitaoka, M.; Gotoh, A.; Hirose, J.; Urashima, T.; Fukiya, S.; Yokota, A.; et al. Diversification of a Fucosyllactose Transporter within the Genus Bifidobacterium. Appl. Environ. Microbiol. 2022, 88, 2. [Google Scholar] [CrossRef]
- Matsuki, T.; Yahagi, K.; Mori, H.; Matsumoto, H.; Hara, T.; Tajima, S.; Ogawa, E.; Kodama, H.; Yamamoto, K.; Yamada, T.; et al. A Key Genetic Factor for Fucosyllactose Utilization Affects Infant Gut Microbiota Development. Nat. Commun. 2016, 7, 11939. [Google Scholar] [CrossRef]
- Planbureau, S.e.C.; Roeters, A. Looking after the Household and Family Care. In Time Use in The Netherlands, 2nd ed.; The Netherlands Institute for Social Research: Hague, The Netherlands, 2019. [Google Scholar]
- Liu, F.; Li, P.; Chen, M.; Luo, Y.; Prabhakar, M.; Zheng, H.; He, Y.; Qi, Q.; Long, H.; Zhang, Y.; et al. Fructooligosaccharide (FOS) and Galactooligosaccharide (GOS) Increase Bifidobacterium but Reduce Butyrate Producing Bacteria with Adverse Glycemic Metabolism in Healthy Young Population. Sci. Rep. 2017, 7, 11789. [Google Scholar] [CrossRef]
- Borewicz, K.; Suarez-Diez, M.; Hechler, C.; Beijers, R.; de Weerth, C.; Arts, I.; Penders, J.; Thijs, C.; Nauta, A.; Lindner, C.; et al. The Effect of Prebiotic Fortified Infant Formulas on Microbiota Composition and Dynamics in Early Life. Sci. Rep. 2019, 9, 2434. [Google Scholar] [CrossRef]
- Pisa, E.; Martire, A.; Chiodi, V.; Traversa, A.; Caputo, V.; Hauser, J.; Macrì, S. Exposure to 3′sialyllactose-poor Milk during Lactation Impairs Cognitive Capabilities in Adulthood. Nutrients 2021, 13, 4191. [Google Scholar] [CrossRef]
- Fleming, S.A.; Chichlowski, M.; Berg, B.M.; Donovan, S.M.; Dilger, R.N. Dietary Sialyllactose Does Not Influence Measures of Recognition Memory or Diurnal Activity in the Young Pig. Nutrients 2018, 10, 395. [Google Scholar] [CrossRef]
- Mudd, A.T.; Fleming, S.A.; Labhart, B.; Chichlowski, M.; Berg, B.M.; Donovan, S.M.; Dilger, R.N. Dietary Sialyllactose Influences Sialic Acid Concentrations in the Prefrontal Cortex and Magnetic Resonance Imaging Measures in Corpus Callosum of Young Pigs. Nutrients 2017, 9, 1297. [Google Scholar] [CrossRef]
- Jacobi, S.K.; Yatsunenko, T.; Li, D.; Dasgupta, S.; Yu, R.K.; Berg, B.M.; Chichlowski, M.; Odle, J. Dietary Isomers of Sialyllactose Increase Ganglioside Sialic Acid Concentrations in the Corpus Callosum and Cerebellum and Modulate the Colonic Microbiota of Formula-Fed Piglets. J. Nutr. 2016, 146, 200–208. [Google Scholar] [CrossRef]
- Martorell, R. Improved Nutrition in the First 1000 Days and Adult Human Capital and Health. Am. J. Hum. Biol. 2017, 29, e22952. [Google Scholar] [CrossRef]
- Hodel, A.S.; Senich, K.L.; Jokinen, C.; Sasson, O.; Morris, A.R.; Thomas, K.M. Early Executive Function Differences in Infants Born Moderate-to-Late Preterm. Early Hum. Dev. 2017, 113, 23–30. [Google Scholar] [CrossRef]
- Copeland, A.; Silver, E.; Korja, R.; Lehtola, S.J.; Merisaari, H.; Saukko, E.; Sinisalo, S.; Saunavaara, J.; Lähdesmäki, T.; Parkkola, R.; et al. Infant and Child MRI: A Review of Scanning Procedures. Front. Neurosci. 2021, 15, 632. [Google Scholar] [CrossRef]
- Rankin, M.W.; Jimenez, E.Y.; Caraco, M.; Collinson, M.; Lostetter, L.; DuPont, T.L. Validation of Test Weighing Protocol to Estimate Enteral Feeding Volumes in Preterm Infants. J. Pediatr. 2016, 178, 108–112. [Google Scholar] [CrossRef] [PubMed]
- Haase, B.; Barreira, J.; Murphy, P.K.; Mueller, M.; Rhodes, J. The Development of an Accurate Test Weighing Technique for Preterm and High-Risk Hospitalized Infants. Breastfeed. Med. 2009, 4, 151–156. [Google Scholar] [CrossRef] [PubMed]


| BRIEF-P Mother | BRIEF-P Partner | REEF Mother | REEF Partner | BRIEF-A Mother | BRIEF-A Partner | Flanker | Whisper | Gift Wrap | Gift Delay | |
|---|---|---|---|---|---|---|---|---|---|---|
| BRIEF-P Mother | - | |||||||||
| BRIEF-P Partner | 0.51 *** | - | ||||||||
| REEF Mother | 0.38 ** | 0.23 | - | |||||||
| REEF Partner | 0.03 | 0.08 | 0.30 * | - | ||||||
| BRIEF-A Mother | 0.34 ** | 0.26 | −0.14 | −0.06 | - | |||||
| BRIEF-A Partner | 0.34 * | 0.50 ** | 0.13 | 0.05 | 0.54 *** | - | ||||
| Flanker | 0.07 | 0.23 | 0.15 | 0.23 | −0.02 | 0.25 | - | |||
| Whisper | 0.00 | −0.17 | 0.00 | 0.04 | −0.06 | −0.21 | 0.04 | - | ||
| Gift Wrap | −0.03 | −0.02 | 0.29 * | 0.18 | −0.24 | −0.02 | 0.10 | −0.07 | - | |
| Gift Delay | 0.10 | 0.00 | 0.37 ** | 0.15 | −0.32 * | −0.23 | 0.19 | 0.12 | 0.21 | - |
| 2′FL (2 w) | 2′FL (6 w) | 2′FL (12 w) | 3′SL (2 w) | 3′SL (6 w) | 3′SL (12 w) | 6′SL (2 w) | 6′SL (6 w) | 6′SL (12 w) | Fuc HMOs (2 w) | Fuc HMOs (6 w) | Fuc HMOs (12 w) | Sial HMOs (2 w) | Sial HMOs (6 w) | Sial HMOs (12 w) | |
|---|---|---|---|---|---|---|---|---|---|---|---|---|---|---|---|
| 2′FL (2 w) | - | ||||||||||||||
| 2′FL (6 w) | 0.26 | ||||||||||||||
| 2′FL (12 w) | 0.30 * | 0.14 | |||||||||||||
| 3′SL (2 w) | 0.08 | −0.08 | −0.17 | ||||||||||||
| 3′SL (6 w) | 0.02 | 0.25 | −0.24 | −0.30 * | |||||||||||
| 3′SL (12 w) | 0.08 | −0.07 | 0.37 ** | −0.64 *** | −0.42 ** | ||||||||||
| 6′SL (2 w) | 0.19 | −0.12 | −0.03 | 0.08 | −0.04 | −0.07 | |||||||||
| 6′SL (6 w) | −0.13 | 0.18 | −0.13 | −0.17 | −0.03 | 0.14 | −0.39 ** | ||||||||
| 6′SL (12 w) | −0.12 | −0.09 | 0.17 | −0.10 | 0.24 | −0.03 | −0.64 *** | −0.27 * | |||||||
| Fuc HMOs (2 w) | 0.66 *** | 0.43 ** | 0.34 * | 0.28 * | −0.03 | −0.10 | 0.06 | −0.10 | 0.00 | ||||||
| Fuc HMOs (6 w) | 0.29 * | 0.85 *** | 0.30 * | −0.20 | 0.42 ** | −0.08 | −0.03 | 0.20 | −0.19 | 0.33 * | |||||
| Fuc HMOs (12 w) | 0.34 * | 0.01 | 0.73 *** | −0.21 | −0.25 | 0.40 ** | −0.01 | −0.15 | 0.15 | 0.14 | 0.05 | ||||
| Sial HMOs (2 w) | 0.25 | −0.09 | −0.05 | 0.41 ** | −0.03 | −0.29 * | 0.71 *** | −0.30 * | −0.51 *** | 0.39 ** | −0.06 | −0.04 | |||
| Sial HMOs (6 w) | −0.37 ** | 0.22 | −0.20 | −0.29 * | 0.47 *** | −0.13 | −0.24 | 0.48 *** | −0.10 | −0.45 ** | 0.41 ** | −0.38 ** | −0.43 ** | ||
| Sial HMOs (12 w) | 0.09 | −0.11 | 0.32 * | −0.46 *** | −0.26 | 0.77 *** | −0.25 | −0.14 | 0.36 ** | −0.10 | −0.20 | 0.47 *** | −0.45 *** | −0.30 * | - |
| BRIEF-P by Mother | REEF by Mother | Inhibitory Control Composite | |
|---|---|---|---|
| AUC of 2’FL | 0.00 | 0.16 | 0.04 |
| AUC of 3’SL | 0.20 | −0.12 | −0.06 |
| AUC of 6’SL | 0.14 | −0.16 | −0.13 |
| AUC of Fucosylated HMOs | −0.17 | 0.21 | 0.14 |
| AUC of Sialylated HMOs | −0.31 * | 0.03 | −0.09 |
| BRIEF-P Mother | REEF Mother | Inhibitory Control Composite | Gestational Age | Mother Educational Level | BRIEF-A Mother | |
|---|---|---|---|---|---|---|
| BRIEF-P Mother | - | |||||
| REEF Mother | 0.33 ** | - | ||||
| Inhibitory control composite | 0.07 | 0.34 ** | - | |||
| Gestational age | −0.01 | −0.07 | −0.05 | - | ||
| Mother educational level | −0.04 | 0.18 | 0.17 | −0.02 | - | |
| BRIEF-A Mother | 0.30 * | −0.07 | 0.32 * | 0.07 | 0 | - |
| Effect | Estimate (95% CI) | Standard Error | p-Value |
|---|---|---|---|
| BRIEF-P Model 1 | |||
| Intercept | 147.65 (47.08–248.21) ** | 49.76 | 0.005 |
| 2′FL | −0.34 (−2.07–1.40) | 0.86 | 0.70 |
| 6′SL | −39.22 (−85.79–7.35) | 23.04 | 0.10 |
| 3′SL | −29.15 (−118.13–59.83) | 44.03 | 0.51 |
| BRIEF-A | 0.15 (−0.048–0.35) | 0.10 | 0.13 |
| BRIEF-P Model 2 | |||
| Intercept | 108.24 (22.69–193.78) * | 42.36 | 0.015 |
| Fucosylated HMOs | −0.18 (−1.45–1.08) | 0.63 | 0.77 |
| Sialylated HMOs | −7.88 (−28.30–12.53) | 10.11 | 0.44 |
| BRIEF-A | 0.18 (−0.02–0.38) | 0.10 | 0.08 |
| REEF Model 1 | |||
| Intercept | 264.44 (33.40–495.48) * | 114.40 | 0.03 |
| 2′FL | 5.21 (0.84–9.57) * | 2.16 | 0.02 |
| 6′SL | −14.33 (−131.61–102.96) | 58.08 | 0.81 |
| 3′SL | −138.79 (−360.91–83.34) | 109.99 | 0.21 |
| REEF Model 2 | |||
| Intercept | 122.34 (−76.57–321.26) | 98.57 | 0.22 |
| Fucosylated HMOs | 3.43 (0.30–6.56) * | 1.55 | 0.03 |
| Sialylated HMOs | −15.75 (−66.45–34.95) | 25.12 | 0.53 |
| Inhibitory control Model 1 | |||
| Intercept | 1.31 (−2.53–5.15) | 1.90 | 0.49 |
| 2′FL | 0.01 (−0.05–0.08) | 0.03 | 0.70 |
| 6′SL | −0.37 (−2.15–1.41) | 0.88 | 0.68 |
| 3′SL | 0.10 (−3.29–3.50) | 1.68 | 0.95 |
| BRIEF-A | −0.01 (−0.02–−0.002) * | 0.004 | 0.02 |
| Inhibitory control Model 2 | |||
| Intercept | 2.24 (−0.82–5.30) | 1.52 | 0.15 |
| Fucosylated HMOs | 0.02 (−0.02–0.07) | 0.02 | 0.27 |
| Sialylated HMOs | −0.47 (−1.20–0.26) | 0.36 | 0.20 |
| BRIEF-A | −0.01 (−0.02–−0.002) * | 0.004 | 0.01 |
| Effect | Estimate (95% CI) | Standard Error | p-Value |
|---|---|---|---|
| BRIEF-P Model 1 | |||
| Intercept | 19.90 (−10.91–61.23) | 17.45 | 0.27 |
| 2′FL | −0.03 (−0.63–0.47) | 0.26 | 0.91 |
| 6′SL | −10.36 (−26.00–1.86) | 6.80 | 0.15 |
| 3′SL | −12.84 (−44.72–11.80) | 13.73 | 0.36 |
| BRIEF-A | 0.03 (−0.02–0.10) | 0.03 | 0.29 |
| BRIEF-P Model 2 | |||
| Intercept | 1.68 (−22.06–24.82) | 11.53 | 0.89 |
| Fucosylated HMOs | −0.04 (−0.42–0.27) | 0.16 | 0.79 |
| Sialylated HMOs | −1.16 (−7.71–5.07) | 3.14 | 0.72 |
| BRIEF-A | 0.03 (−0.01–0.09) | 0.02 | 0.18 |
Disclaimer/Publisher’s Note: The statements, opinions and data contained in all publications are solely those of the individual author(s) and contributor(s) and not of MDPI and/or the editor(s). MDPI and/or the editor(s) disclaim responsibility for any injury to people or property resulting from any ideas, methods, instructions or products referred to in the content. |
© 2023 by the authors. Licensee MDPI, Basel, Switzerland. This article is an open access article distributed under the terms and conditions of the Creative Commons Attribution (CC BY) license (https://creativecommons.org/licenses/by/4.0/).
Share and Cite
Willemsen, Y.; Beijers, R.; Gu, F.; Vasquez, A.A.; Schols, H.A.; de Weerth, C. Fucosylated Human Milk Oligosaccharides during the First 12 Postnatal Weeks Are Associated with Better Executive Functions in Toddlers. Nutrients 2023, 15, 1463. https://doi.org/10.3390/nu15061463
Willemsen Y, Beijers R, Gu F, Vasquez AA, Schols HA, de Weerth C. Fucosylated Human Milk Oligosaccharides during the First 12 Postnatal Weeks Are Associated with Better Executive Functions in Toddlers. Nutrients. 2023; 15(6):1463. https://doi.org/10.3390/nu15061463
Chicago/Turabian StyleWillemsen, Yvonne, Roseriet Beijers, Fangjie Gu, Alejandro Arias Vasquez, Henk Arie Schols, and Carolina de Weerth. 2023. "Fucosylated Human Milk Oligosaccharides during the First 12 Postnatal Weeks Are Associated with Better Executive Functions in Toddlers" Nutrients 15, no. 6: 1463. https://doi.org/10.3390/nu15061463
APA StyleWillemsen, Y., Beijers, R., Gu, F., Vasquez, A. A., Schols, H. A., & de Weerth, C. (2023). Fucosylated Human Milk Oligosaccharides during the First 12 Postnatal Weeks Are Associated with Better Executive Functions in Toddlers. Nutrients, 15(6), 1463. https://doi.org/10.3390/nu15061463