

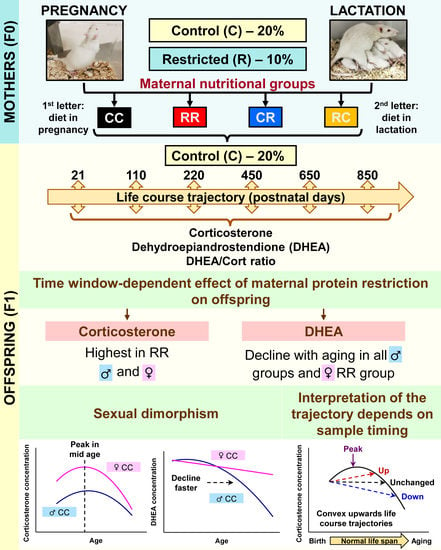
Developmental Programming-Aging Interactions Have Sex-Specific and Developmental Stage of Exposure Outcomes on Life Course Circulating Corticosterone and Dehydroepiandrosterone (DHEA) Concentrations in Rats Exposed to Maternal Protein-Restricted Diets

 ,
,
Abstract
1. Introduction
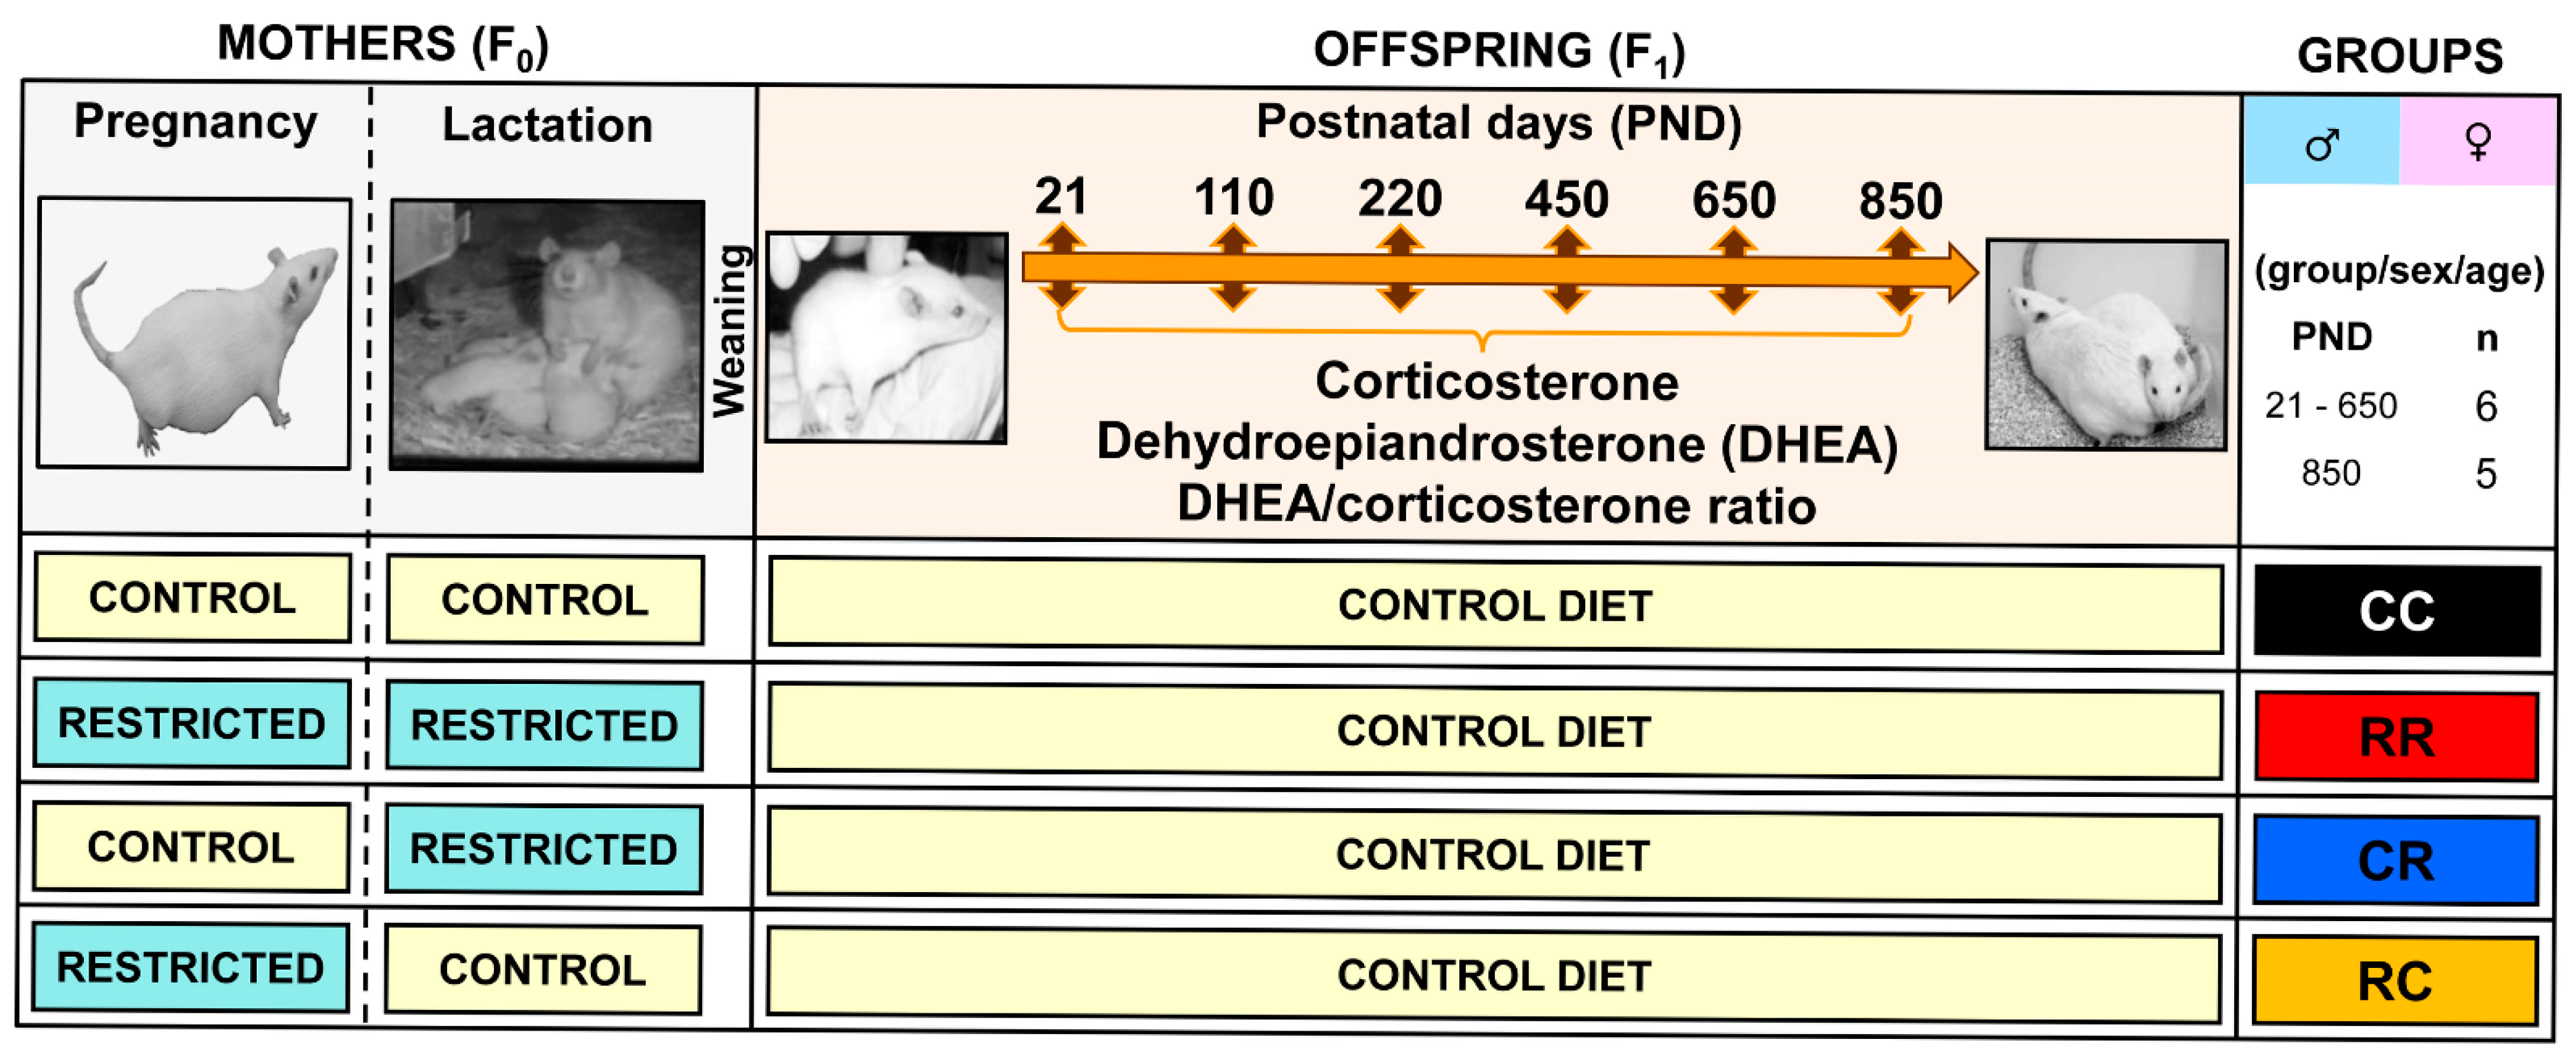
2. Methods
2.1. Animal Care and Maintenance
2.2. Steroid Measurements
2.3. Statistical Analysis
3. Results
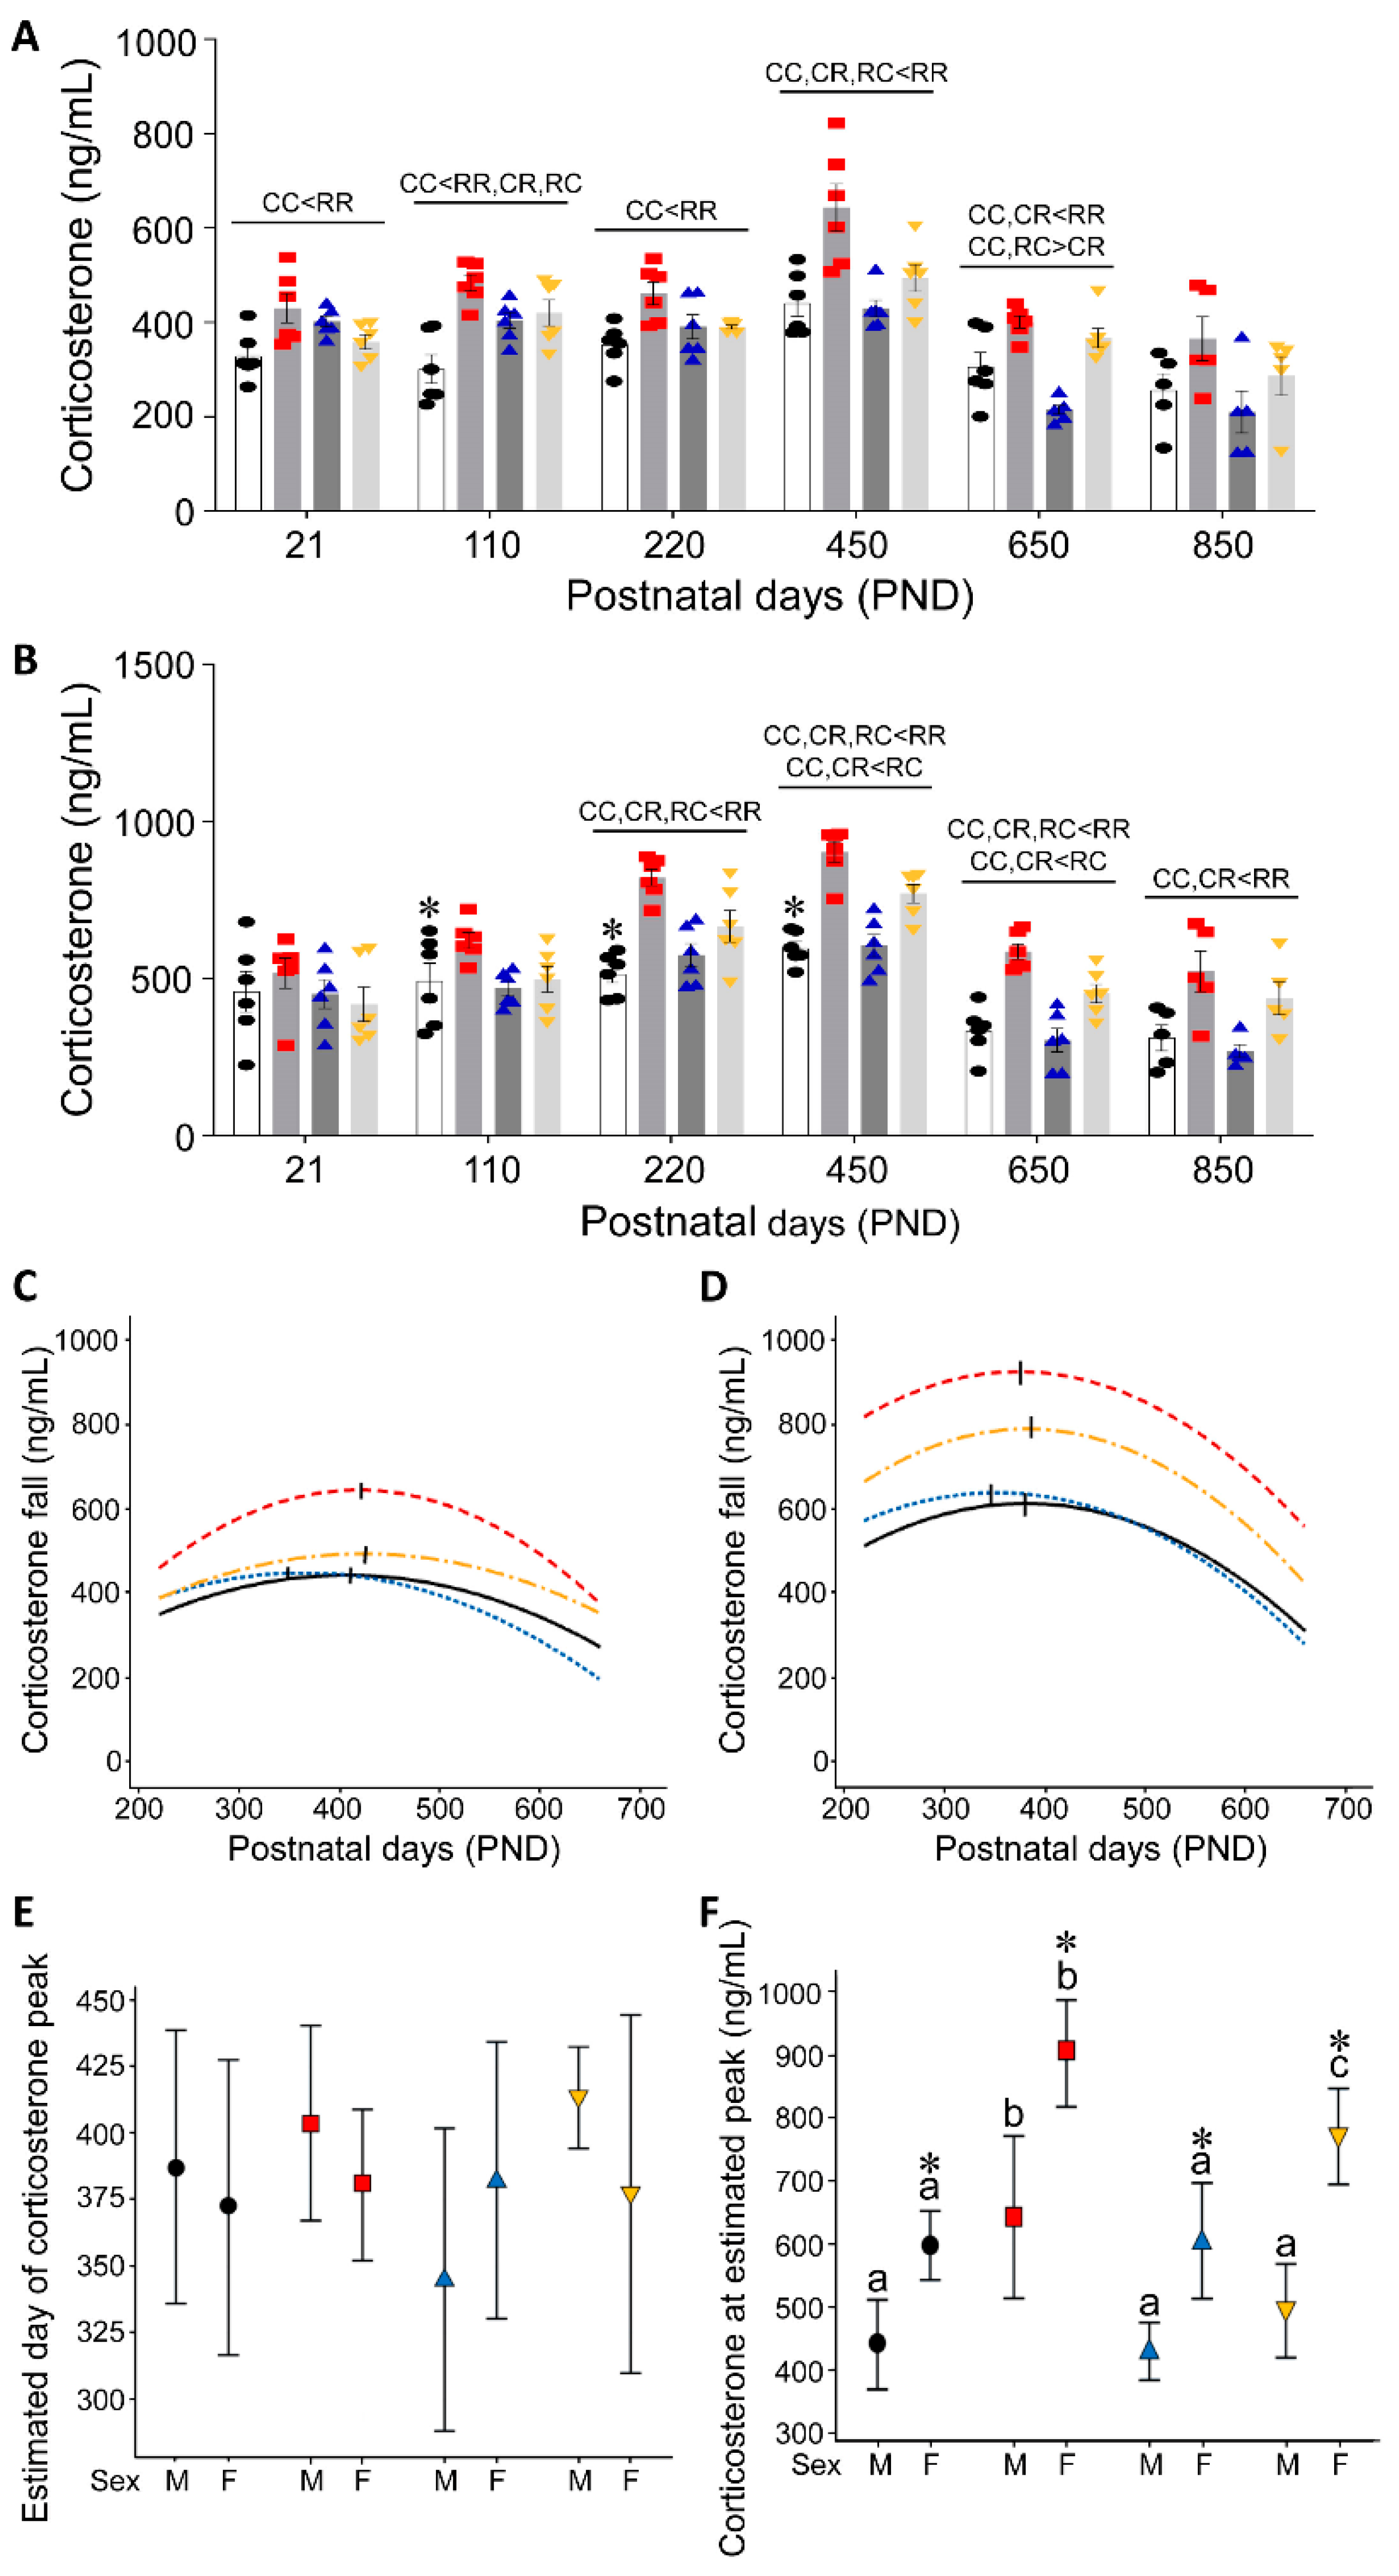
3.1. Effect of Timing of Maternal Dietary Challenge on Aging Trajectory of Offspring Serum Corticosterone
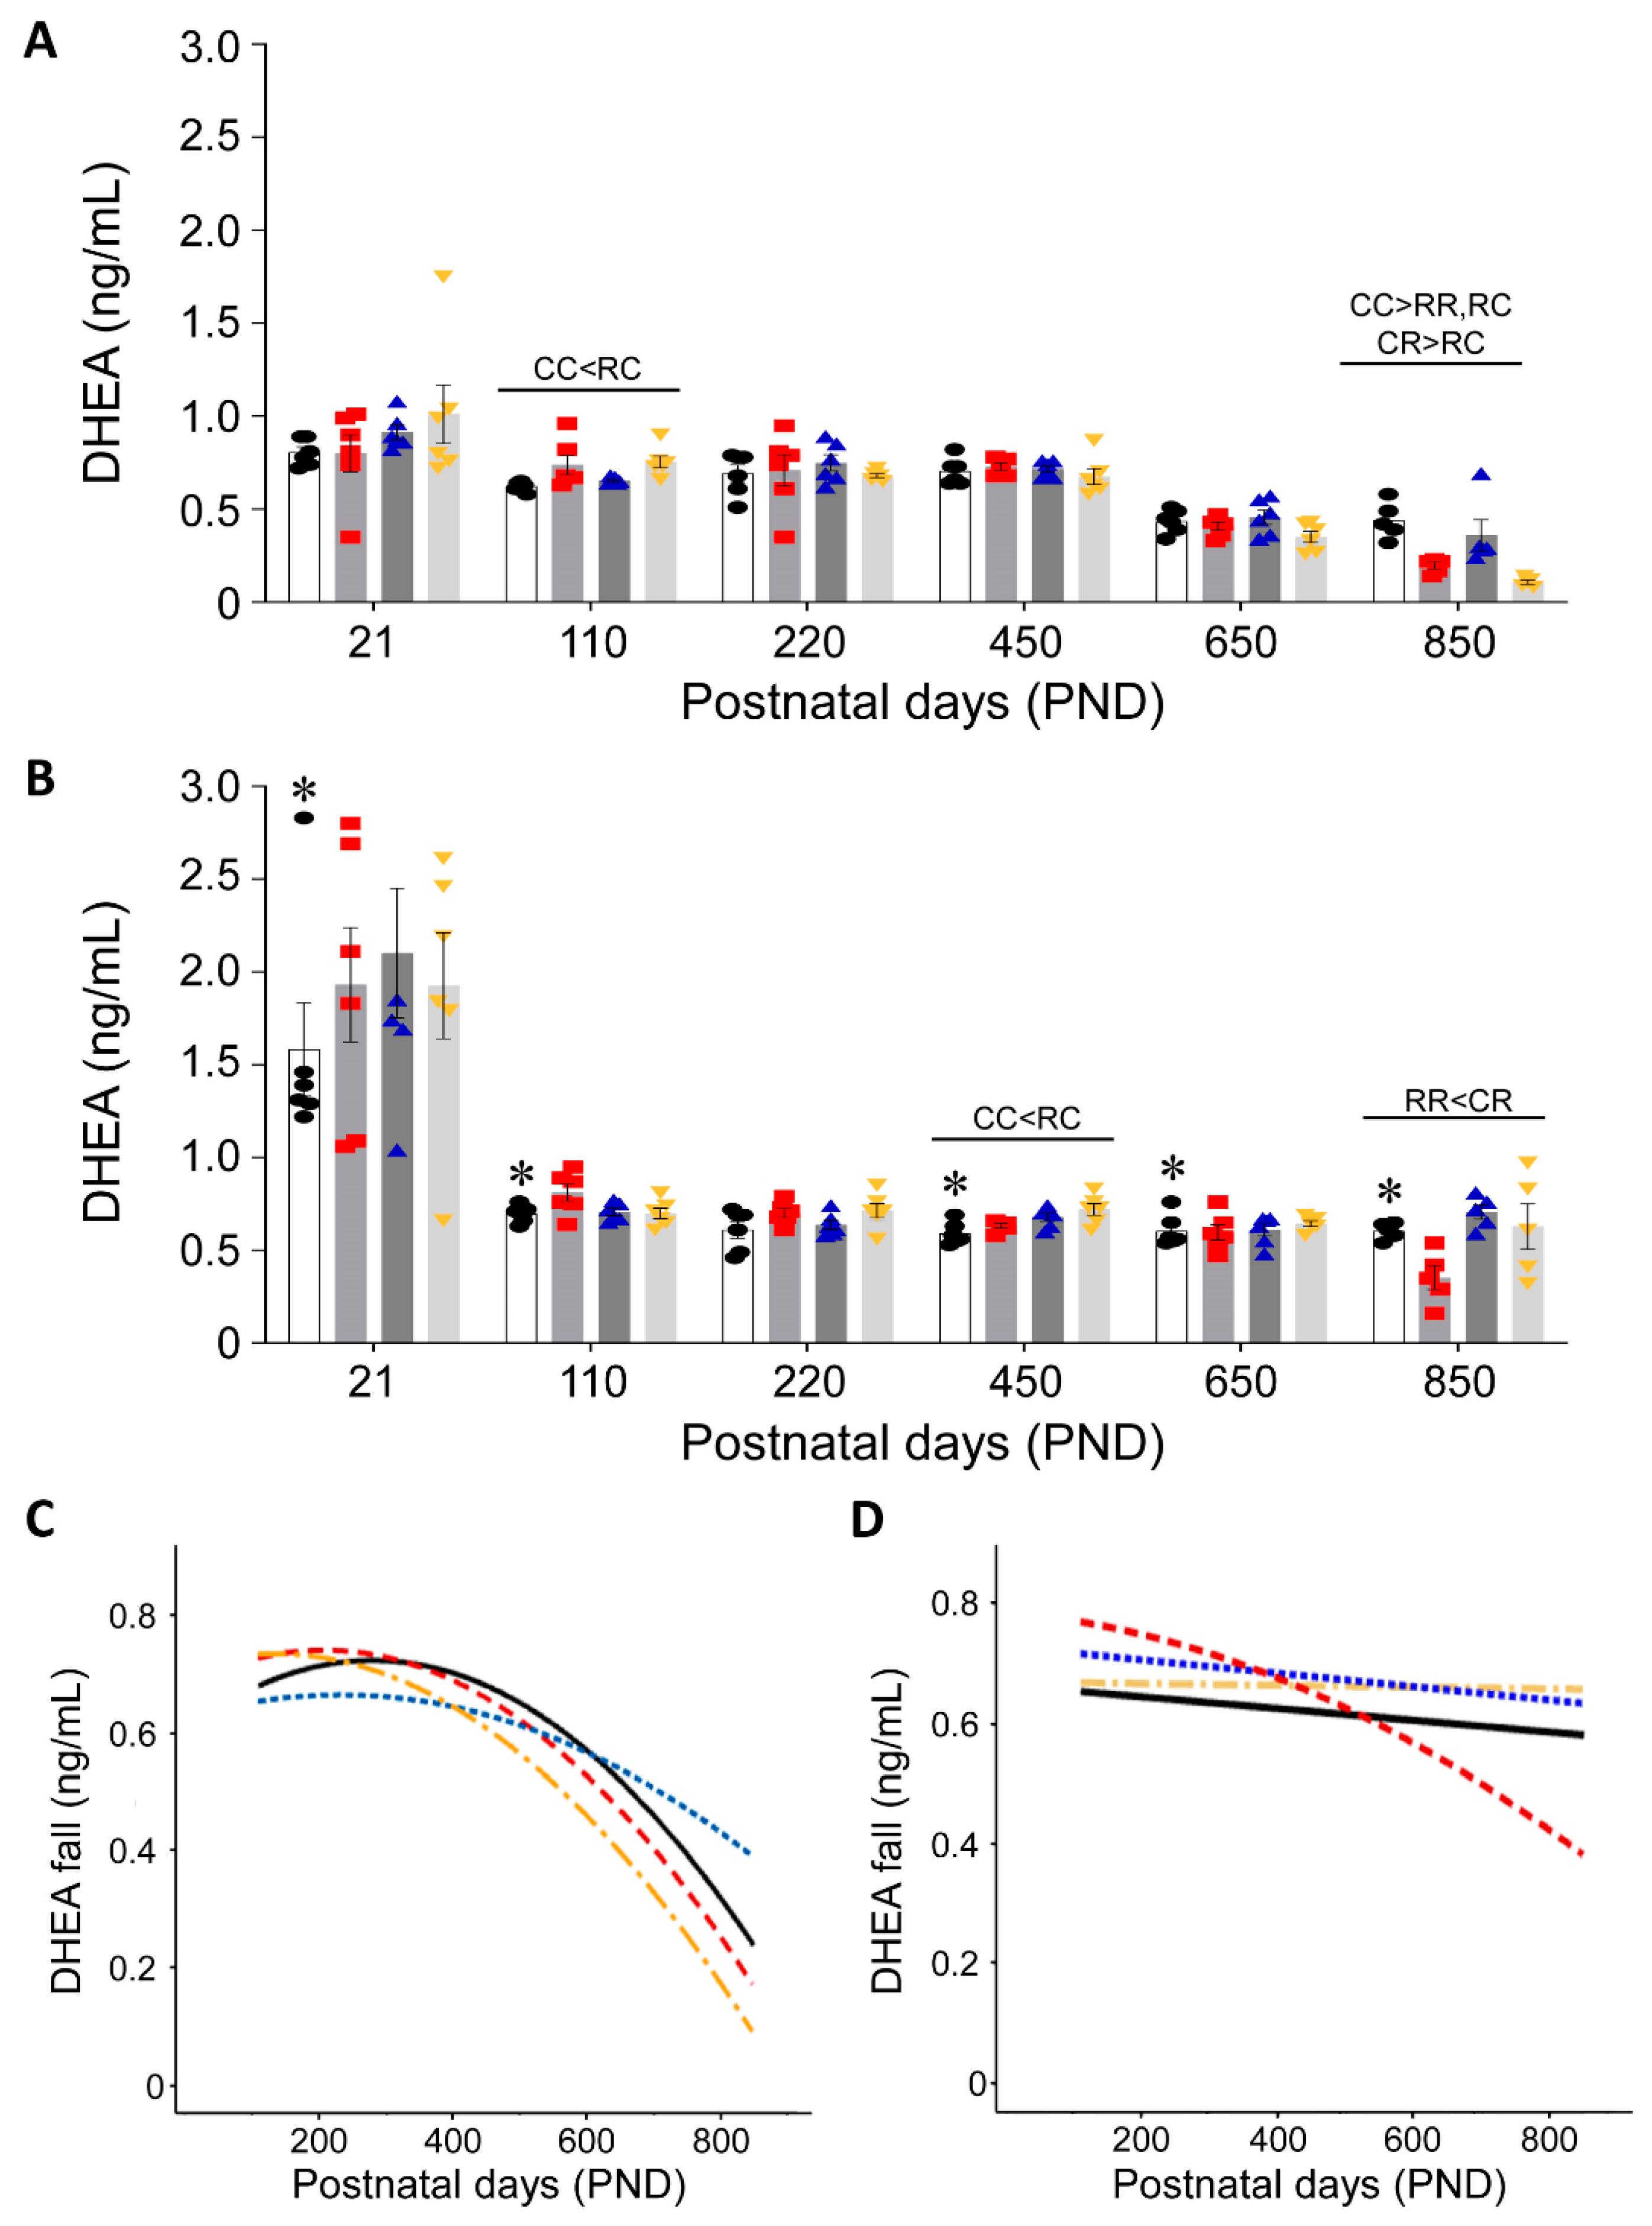
3.2. Effect of Timing of Maternal Dietary Challenge on Aging Trajectory of Offspring Serum DHEA
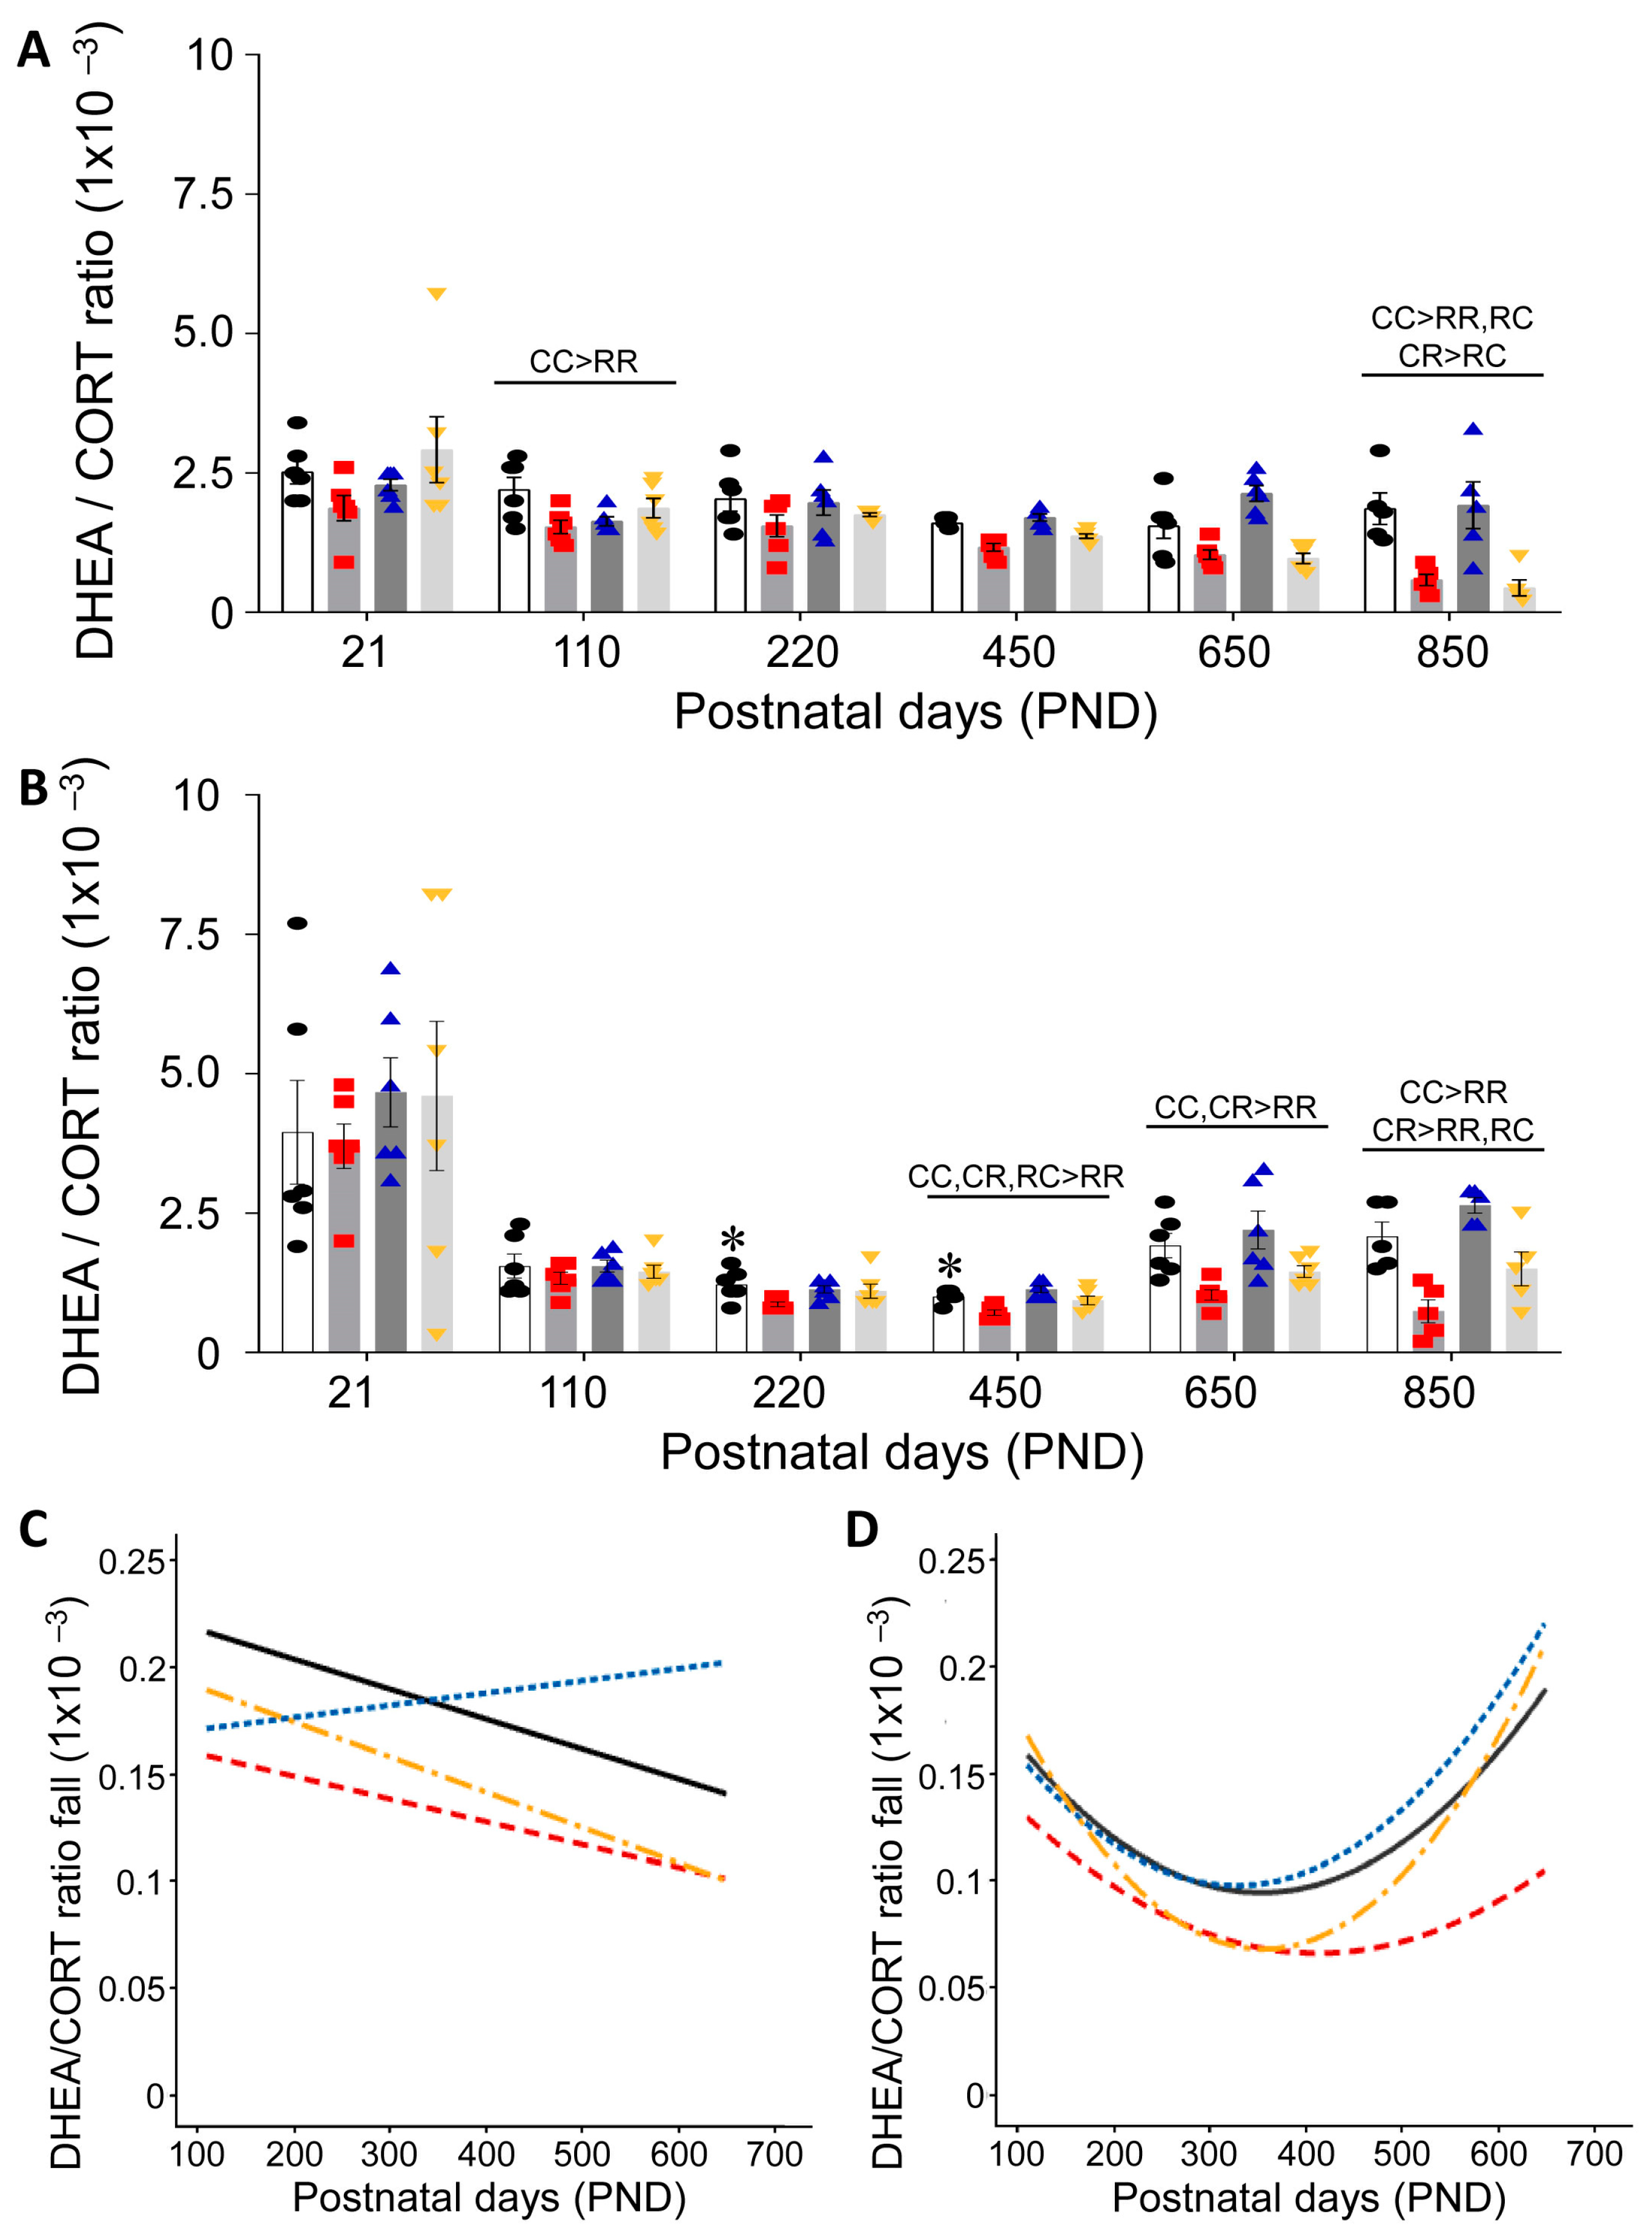
3.3. Effect of Timing of Maternal Dietary Challenge on Aging Trajectory of Offspring Serum DHEA:CORT
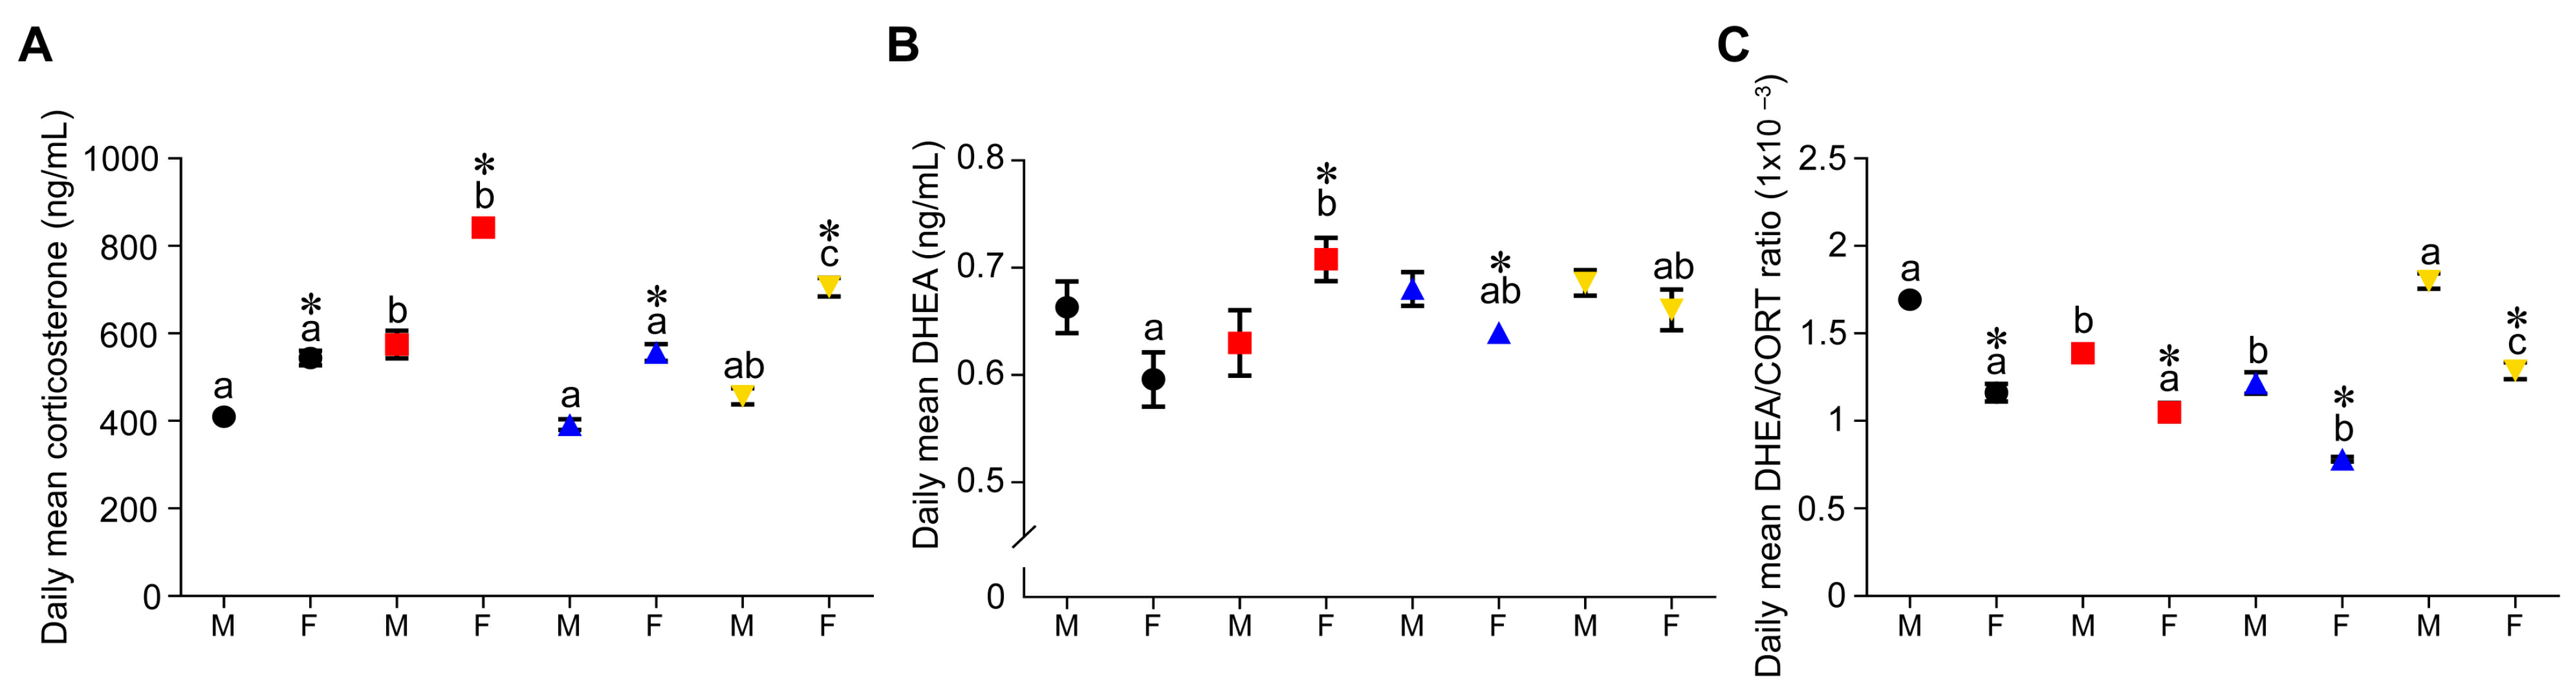
3.4. Effect of Timing of Maternal Dietary Challenge on Daily Mean Corticosterone, DHEA and DHEA:CORT Ratio
4. Discussion
4.1. Need for Studies That Address Life-Course Programming of Circulating Glucocorticoids
4.2. Criteria for Studies That Address Life-Course Programming of Circulating Glucocorticoids
4.3. Chronobiology of the HPAA System and Importance of Blood Sampling Time
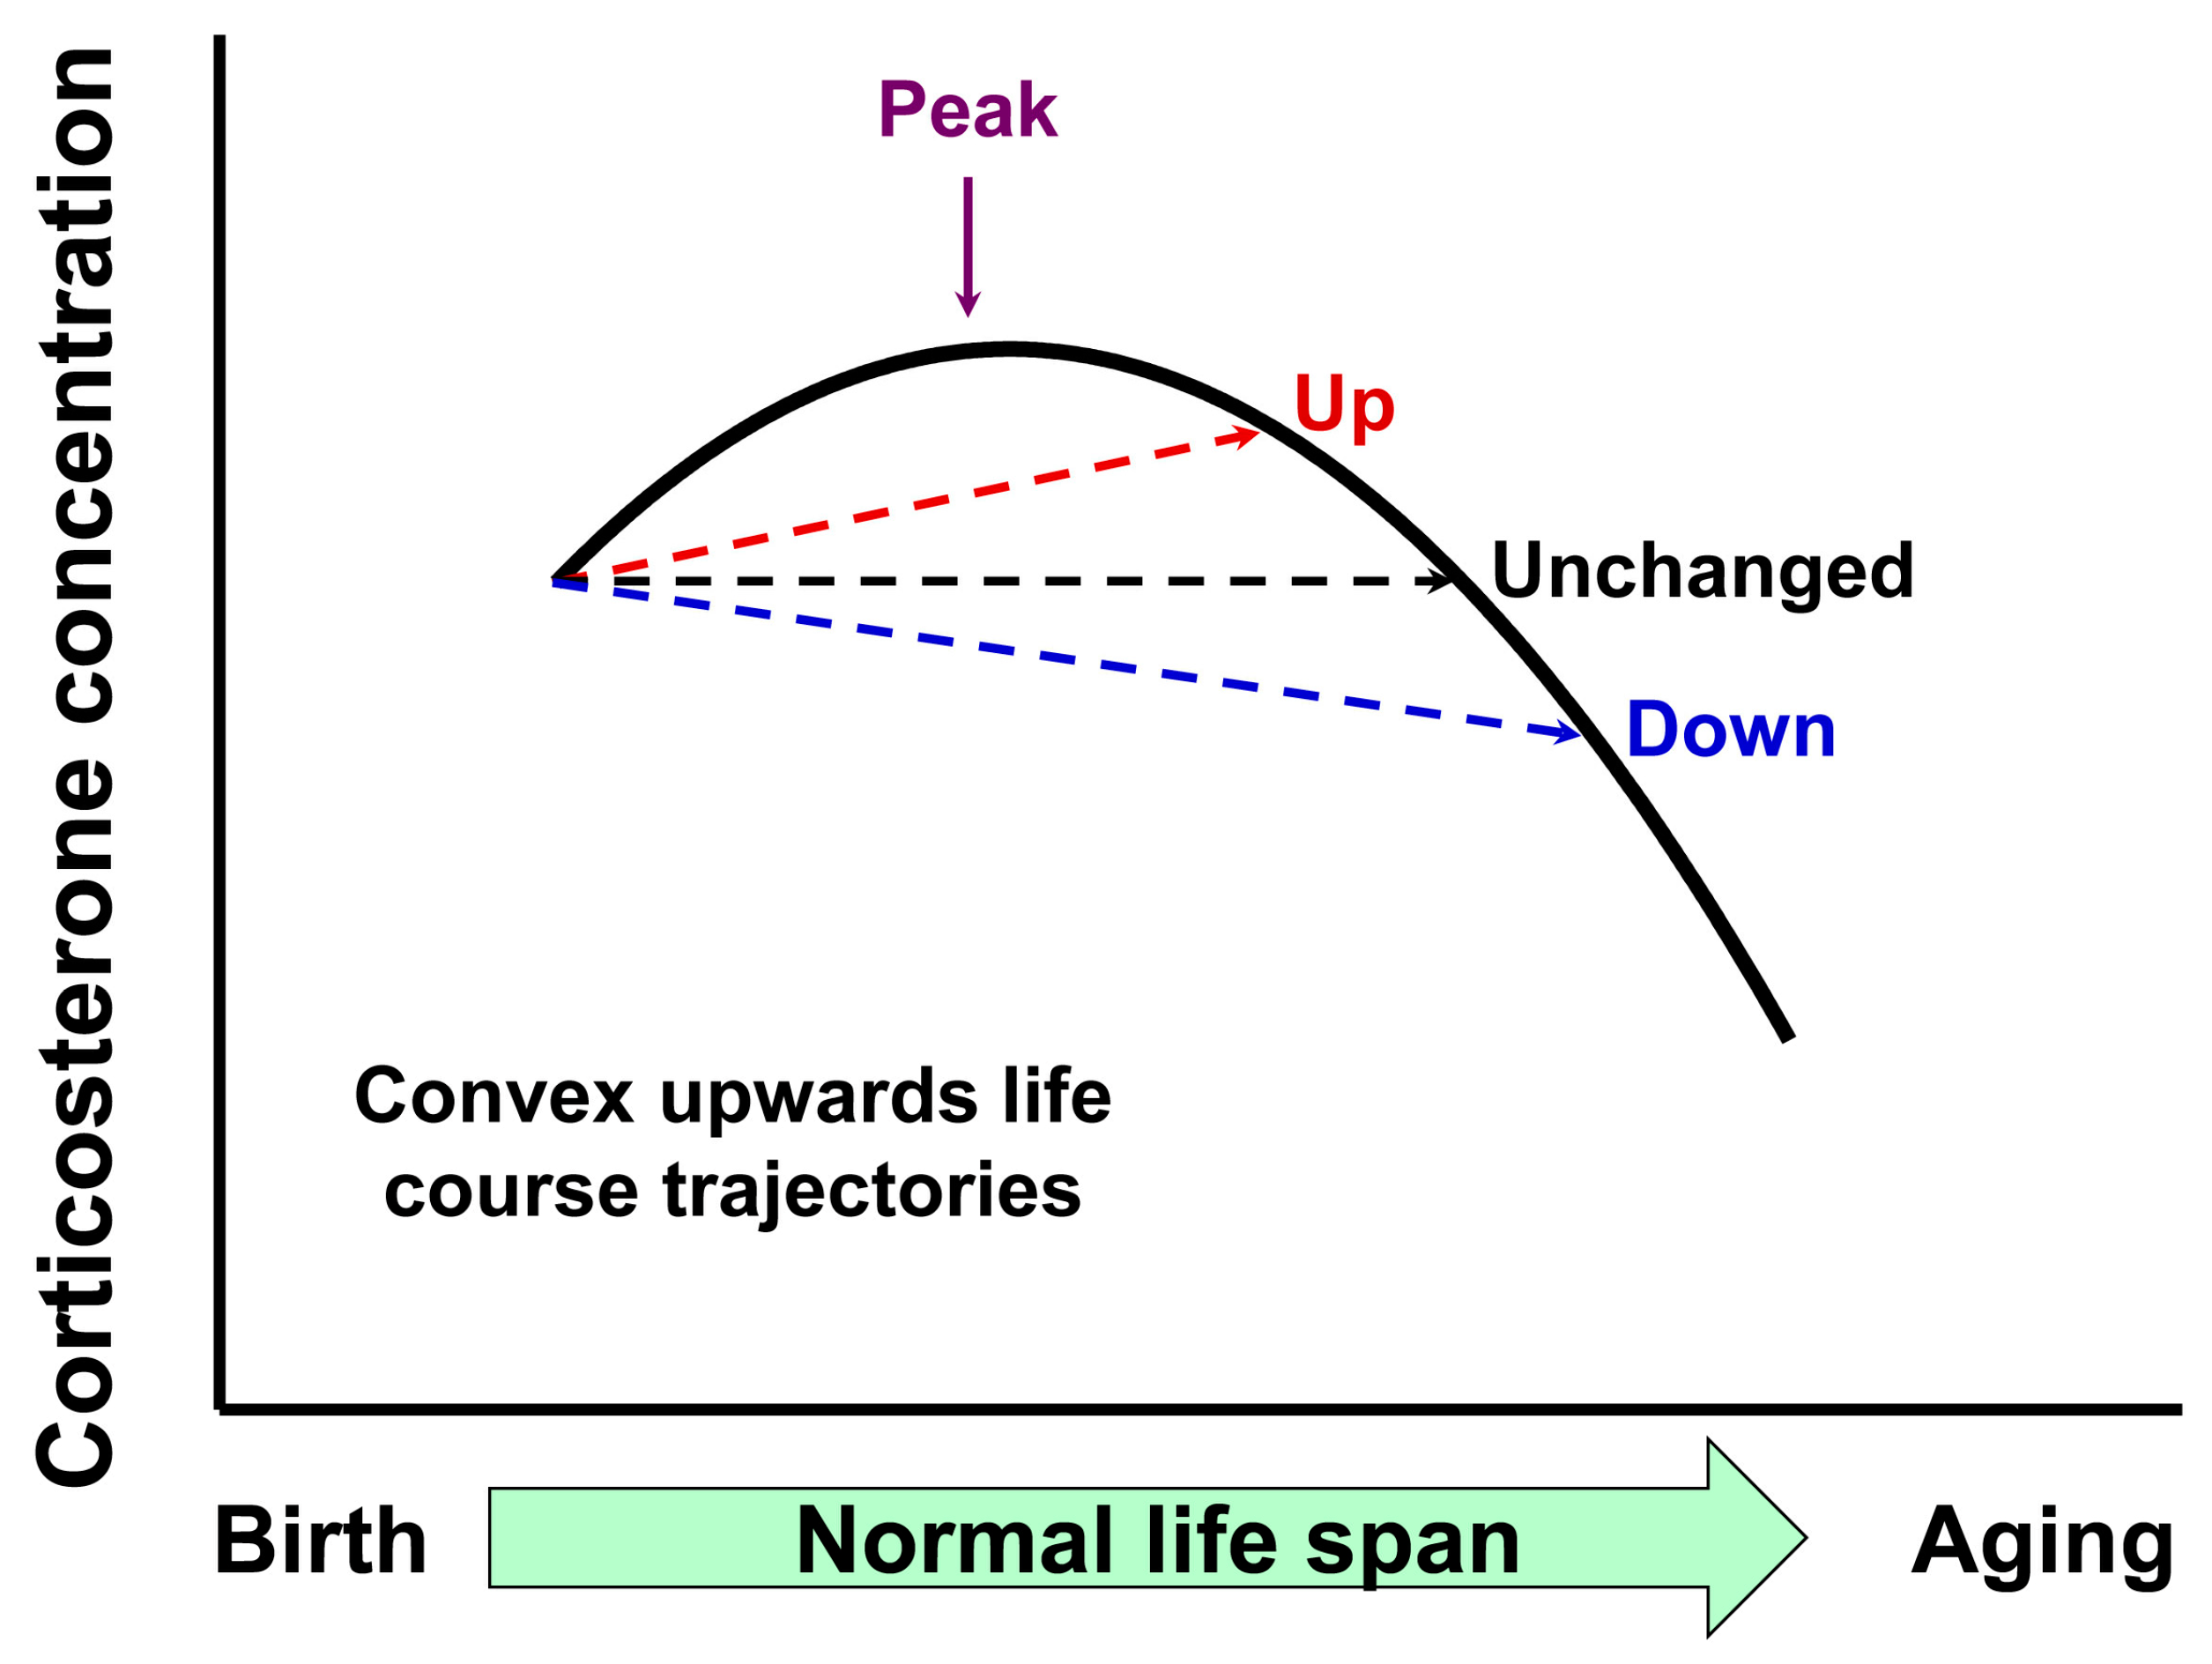
4.4. Potential Mechanisms Responsible for the Fall in Corticosterone in the Second Half of Life
4.5. Mechanism Responsible for Different Corticosterone Concentrations in the Different Programming Outcomes
4.6. Differences in Corticosterone and DHEA Life-Course Trajectories and Metabolic Consequences for the Health Span
5. Conclusions and Implications
Author Contributions
Funding
Institutional Review Board Statement
Informed Consent Statement
Data Availability Statement
Conflicts of Interest
References
- Clegg, A.; Hassan-Smith, Z. Frailty and the endocrine system. Lancet Diabetes Endocrinol. 2018, 6, 743–752. [Google Scholar] [CrossRef]
- Adekunbi, D.A.; Li, C.; Nathanielsz, P.W.; Salmon, A.B. Age and sex modify cellular proliferation responses to oxidative stress and glucocorticoid challenges in baboon cells. GeroScience 2021, 43, 2067. [Google Scholar] [CrossRef]
- Antoniou-Tsigkos, A.; Zapanti, E.; Ghizzoni, L.; Mastorakos, G. Adrenal Androgens. Folia Endocrinol. Jpn. 2019, 44, 822, 858–884. [Google Scholar]
- Meikle, A.; Daynes, R.; Araneo, B. Adrenal androgen secretion and biologic effects. Endocrinol. Metab. Clin. North Am. 1991, 20, 381–400. [Google Scholar] [CrossRef]
- Gabai, G.; Mongillo, P.; Giaretta, E.; Marinelli, L. Do Dehydroepiandrosterone (DHEA) and Its Sulfate (DHEAS) Play a Role in the Stress Response in Domestic Animals? Front. Vet. Sci. 2020, 7, 1–15. [Google Scholar] [CrossRef]
- Zambrano, E.; Reyes-Castro, L.A.; Nathanielsz, P.W. Aging, glucocorticoids and developmental programming. Age 2015, 37, 9774. [Google Scholar] [CrossRef]
- Yang, S.; Gerow, K.G.; Huber, H.F.; Considine, M.M.; Li, C.; Mattern, V.; Comuzzie, A.G.; Ford, S.P.; Nathanielsz, P.W. A decline in female baboon hypothalamo-pituitary-adrenal axis activity anticipates aging. Aging Albany NY 2017, 9, 1375. [Google Scholar] [CrossRef]
- Willis, E.L.; Wolf, R.F.; White, G.L.; McFarlane, D. Age- and gender-associated changes in the concentrations of serum TGF-1β, DHEA-S and IGF-1 in healthy captive baboons (Papio hamadryas anubis). Gen. Comp Endocrinol. 2014, 195, 21–27. [Google Scholar] [CrossRef]
- Willis, E.L.; Eberle, R.; Wolf, R.F.; White, G.L.; McFarlane, D. The effects of age and cytomegalovirus on markers of inflammation and lymphocyte populations in captive baboons. PLoS ONE 2014, 9, e107167. [Google Scholar] [CrossRef]
- Arnaldi, G.; Angeli, A.; Atkinson, A.B.; Bertagna, X.; Cavagnini, F.; Chrousos, G.P.; Fava, G.A.; Findling, J.W.; Gaillard, R.C.; Grossman, A.B. Diagnosis and complications of Cushing’s syndrome: A consensus statemen. J. Clin. Endocrinol. Metab. 2003, 88, 5593–5602. [Google Scholar] [CrossRef]
- Løvås, K.; Husebye, E.S. Addison’s diseas. Lancet 2005, 365, 2058–2061. [Google Scholar] [CrossRef] [PubMed]
- Grimley Evans, J.; Malouf, R.; Huppert, F.; Van Niekerk, J.K. Dehydroepiandrosterone (DHEA) supplementation for cognitive function in healthy elderly peopl Cochrane database. Syst. Rev. 2006, 2006, CD006221. [Google Scholar]
- Maggio, M.; De Vita, F.; Fisichella, A.; Colizzi, E.; Provenzano, S.; Lauretani, F.; Luci, M.; Ceresini, G.; Dall’Aglio, E.; Caffarra, P.; et al. DHEA and cognitive function in the elderly. J. Steroid Biochem. Mol. Biol. 2015, 145, 281–292. [Google Scholar] [CrossRef]
- Charlton, M.; Angulo, P.; Chalasani, N.; Merriman, R.; Viker, K.; Charatcharoenwitthaya, P.; Sanderson, S.; Gawrieh, S.; Krishnan, A.; Lindor, K. Low circulating levels of dehydroepiandrosterone in histologically advanced nonalcoholic fatty liver diseas. Hepatology 2008, 47, 484–492. [Google Scholar] [CrossRef] [PubMed]
- Zambrano, E.; Rodriguez-Gonzalez, G.L.; Guzman, C.; Garcia-Becerra, R.; Boeck, L.; Diaz, L.; Menjivar, M.; Larrea, F.; Nathanielsz, P.W. A maternal low protein diet during pregnancy and lactation in the rat impairs male reproductive development. J. Physiol. 2005, 563, 275–284. [Google Scholar] [CrossRef]
- Tarry-Adkins, J.L.; Aiken, C.E.; Ashmore, T.J.; Fernandez-Twinn, D.S.; Chen, J.-H.; Ozanne, S.E. A suboptimal maternal diet combined with accelerated postnatal growth results in an altered aging profile in the thymus of male rats. FASEB J. 2019, 33, 239–253. [Google Scholar] [CrossRef] [PubMed]
- Khorram, O.; Keen-Rinehart, E.; Chuang TDer Ross, M.G.; Desai, M. Maternal undernutrition induces premature reproductive senescence in adult female rat offspring. Fertil. Steril. 2015, 103, 291–298.e2. [Google Scholar] [CrossRef]
- Tarry-Adkins, J.L.; Fernandez-Twinn, D.S.; Chen, J.H.; Hargreaves, I.P.; Neergheen, V.; Aiken, C.E.; Ozanne, S.E. Poor maternal nutrition and accelerated postnatal growth induces an accelerated aging phenotype and oxidative stress in skeletal muscle of male rats. DMM Dis. Model Mech. 2016, 9, 1221–1229. [Google Scholar] [CrossRef]
- Bellinger, L.; Langley-Evans, S.C. Fetal programming of appetite by exposure to a maternal low-protein diet in the ra. Clin. Sci. 2005, 109, 413–420. [Google Scholar] [CrossRef]
- Goyal, R.; Van-Wickle, J.; Goyal, D.; Longo, L.D. Antenatal maternal low protein diet: ACE-2 in the mouse lung and sexually dimorphic programming of hypertensio. BMC Physiol. 2015, 15, 2. [Google Scholar] [CrossRef]
- Blesson, C.S.; Schutt, A.K.; Balakrishnan, M.P.; Pautler, R.G.; Pedersen, S.E.; Sarkar, P.; Gonzales, D.; Zhu, G.; Marini, J.C.; Chacko, S.K.; et al. Novel lean type 2 diabetic rat model using gestational low-protein programming. Am. J. Obstet. Gynecol. 2016, 214, 540.e1–540.e7. [Google Scholar]
- Folguieri, M.S.; Franco, A.T.B.; Vieira, A.S.; Gontijo, J.A.R.; Boer, P.A. Transcriptome and morphological analysis on the heart in gestational protein-restricted aging male rat offspring. Front cell Dev. Biol. 2022, 10, 892322. [Google Scholar] [CrossRef]
- Fernandes, M.S.; Pedroza, A.A.; de Andrade Silva, S.C.; de Lemos, M.D.; Bernardo, E.M.; Pereira, A.R.; Dos Santos, T.M.; Lagranha, C. Undernutrition during development modulates endoplasmic reticulum stress genes in the hippocampus of juvenile rats: Involvement of oxidative stress. Brain Res. 2022, 1797, 148098. [Google Scholar] [CrossRef] [PubMed]
- García-Ortuño, L.E.; Barrera-Chimal, J.; Pérez-Villalva, R.; Ortega-Trejo, J.A.; Luna-Bolaños, E.; Lima-Posada, I.; Sánchez-Navarro, A.; Reyes-Castro, L.; Gamba, G.; Zambrano, E.; et al. Resilience to acute kidney injury in offspring of maternal protein restriction. Am. J. Physiol. Renal Physiol. 2019, 317, F1637–F1648. [Google Scholar] [CrossRef] [PubMed]
- Bautista, C.J.; Bautista, R.J.; Montaño, S.; Reyes-Castro, L.A.; Rodriguez-Peña, O.N.; Ibáñez, C.A.; Nathanielsz, P.W.; Zambrano, E. Effects of maternal protein restriction during pregnancy and lactation on milk composition and offspring development. Br. J. Nutr. 2019, 122, 141–151. [Google Scholar] [CrossRef] [PubMed]
- Reyes-Castro, L.A.; Padilla-Gómez, E.; Parga-Martínez, N.J.; Castro-Rodríguez, D.C.; Quirarte, G.L.; Díaz-Cintra, S.; Nathanielsz, P.W.; Zambrano, E. Hippocampal mechanisms in impaired spatial learning and memory in male offspring of rats fed a low-protein isocaloric diet in pregnancy and/or lactation. Hippocampus 2018, 28, 18–30. [Google Scholar] [CrossRef] [PubMed]
- Calzada, L.; Morales, A.; Sosa-Larios, T.C.; Reyes-Castro, L.A.; Rodríguez-González, G.L.; Rodríguez-Mata, V.; Zambrano, E.; Morimoto, S. Maternal protein restriction during gestation impairs female offspring pancreas development in the rat. Nutr. Res. 2016, 36, 855–862. [Google Scholar] [CrossRef]
- Martin-Gronert, M.S.; Fernandez-Twinn, D.S.; Bushell, M.; Siddle, K.; Ozanne, S.E. Cell-autonomous programming of rat adipose tissue insulin signalling proteins by maternal nutrition. Diabetologia 2016, 59, 1266–1275. [Google Scholar] [CrossRef]
- Chen, J.H.; Martin-Gronert, M.S.; Tarry-Adkins, J.; Ozanne, S.E. Maternal protein restriction affects postnatal growth and the expression of key proteins involved in lifespan regulation in mice. PLoS ONE 2009, 4., e4950. [Google Scholar] [CrossRef]
- Fernandez-Twinn, D.S.; Ekizoglou, S.; Wayman, A.; Petry, C.J.; Ozanne, S.E. Maternal low-protein diet programs cardiac beta-adrenergic response and signaling in 3-mo-old male offspring. Am. J. Physiol. Regul. Integr. Comp Physiol. 2006, 291, R429–R436. [Google Scholar] [CrossRef]
- Aiken, C.E.; Tarry-Adkins, J.L.; Ozanne, S.E. Transgenerational developmental programming of ovarian reserve. Sci. Rep. 2015, 5, 16175. [Google Scholar] [CrossRef] [PubMed]
- Rodríguez-González, G.L.; Reyes-Castro, L.A.; Vega, C.C.; Boeck, L.; Ibáñez, C.; Nathanielsz, P.W.; Larrea, F.; Zambrano, E. Accelerated aging of reproductive capacity in male rat offspring of protein-restricted mothers is associated with increased testicular and sperm oxidative stress. Age 2014, 36, 9721. [Google Scholar] [CrossRef] [PubMed]
- Rodríguez-González, G.L.; Reyes-Castro, L.A.; Bautista, C.J.; Beltrán, A.A.; Ibanez, C.A.; Vega, C.C.; Lomas-Soria, C.; Castro-Rodríguez, D.C.; Elías-López, A.L.; Nathanielsz, P.W.; et al. Maternal obesity accelerates rat offspring metabolic aging in a sex dependent manner. J. Physiol. 2019, 597, 5549–5563. [Google Scholar] [CrossRef] [PubMed]
- Rodríguez-González, G.L.; De Los Santos, S.; Méndez-Sánchez, D.; Reyes-Castro, L.A.; Ibáñez, C.A.; Canto, P.; Zambrano, E. High-Fat Diet Consumption by Male Rat Offspring of Obese Mothers Exacerbates Adipose Tissue Hypertrophy and Metabolic Alterations in Adult Life. Br. J. Nutr. 2022, 22, 1–29. [Google Scholar] [CrossRef] [PubMed]
- Sato, K.; Iemitsu, M.; Aizawa, K.; Mesaki, N.; Fujita, S. Increased muscular dehydroepiandrosterone levels are associated with improved hyperglycemia in obese rats. Am. J. Physiol.—Endocrinol. Metab. 2011, 301, 274–280. [Google Scholar] [CrossRef]
- Andrade, S.; Silveira, S.L.; Gomez, R.; Barros, H.M.T.; Ribeiro, M.F.M. Gender differences of acute and chronic administration of dehydroepiandrosterone in rats submitted to the forced swimming test. Prog. Neuro-Psychopharmacol. Biol. Psychiatry 2007, 31, 613–621. [Google Scholar] [CrossRef] [PubMed]
- Dodds, R.M.; Syddall, H.E.; Cooper, R.; Benzeval, M.; Deary, I.J.; Dennison, E.M.; Der, G.; Gale, C.R.; Inskip, H.M.; Jagger, C.; et al. Grip strength across the life course: Normative data from twelve British studies. PLoS ONE 2014, 9, e113637. [Google Scholar] [CrossRef] [PubMed]
- López-Otín, C.; Blasco, M.A.; Partridge, L.; Serrano, M.; Kroemer, G. The hallmarks of aging. Cell 2013, 153, 1194–1217. [Google Scholar] [CrossRef]
- Cheng, C.J.; Gelfond, J.A.L.; Strong, R.; Nelson, J.F. Genetically heterogeneous mice exhibit a female survival advantage that is age- and site-specific: Results from a large multi-site study. Aging Cell 2019, 18, e12905. [Google Scholar] [CrossRef]
- Poston, L.; Godfrey, K.M.; Gluckman, P.D.; Hanson, M.A. (Eds.) Developmental Origins of Health and Disease, 2nd ed.; Cambridge University Press (CUP): Cambridge, UK, 2022; 320p. [Google Scholar]
- Nathanielsz, P.W. Life Before Birth: The Challenges of Fetal Development, 2nd ed.; Life Course Health Press, LLC: San Antonio, TX, USA, 2022; Available online: https://www.lifecoursehealthpress.com/ (accessed on 22 February 2021).
- Aiken, C.E.; Tarry-Adkins, J.L.; Spiroski, A.M.; Nuzzo, A.M.; Ashmore, T.J.; Rolfo, A.; Sutherland, M.J.; Camm, E.J.; Giussani, D.A.; Ozanne, S.E. Chronic gestational hypoxia accelerates ovarian aging and lowers ovarian reserve in next-generation adult rats. FASEB J. 2019, 33, 7758–7766. [Google Scholar] [CrossRef]
- Roseboom, T.J.; Limesand, S.; Thornburg, K.; Harding, J. Epidemiological evidence for the developmental origins of health and disease: Effects of prenatal undernutrition in humans. J. Endocrinol. 2019, 242, T135–T144. [Google Scholar] [CrossRef] [PubMed]
- Kalsbeek, A.; van Heerikhuize, J.J.; Wortel, J.; Buijs, R.M. A diurnal rhythm of stimulatory input to the hypothalamo–pituitary–adrenal system as revealed by timed intrahypothalamic administration of the vasopressin V1Antagonist. J. Neurosci. 1996, 16, 5555–5565. [Google Scholar] [CrossRef] [PubMed]
- Honnebier, M.B.O.M.; Jenkins, S.L.; Nathanielsz, P.W. Circadian timekeeping during pregnancy: Endogenous phase relationships between maternal plasma hormones and the maternal body temperature rhythm in pregnant rhesus monkeys. Endocrinology 1992, 131, 2051–2058. [Google Scholar] [CrossRef] [PubMed]
- Urbanski, H.F.; Sorwell, K.G. Age-related changes in neuroendocrine rhythmic function in the rhesus macaque. Age 2012, 34, 1111–1121. [Google Scholar] [CrossRef] [PubMed]
- Walsh, S.W.; Ducsay, C.A.; Novy, M.J. Circadian hormonal interactions among the mother, fetus, and amniotic fluid. Am. J. Obstet. Gynecol. 1984, 150, 745–753. [Google Scholar] [CrossRef]
- Takeshita, R.S.C.; Edler, M.K.; Meindl, R.S.; Sherwood, C.C.; Hopkins, W.D.; Raghanti, M.A. Age, adrenal steroids, and cognitive functioning in captive chimpanzees (Pan troglodytes). Peer J. 2022, 10, e14323. [Google Scholar] [CrossRef] [PubMed]
- Labrie, F.; Martel, C.; Balser, J. Wide distribution of the serum dehydroepiandrosterone and sex steroid levels in postmenopausal women: Role of the ovary? Menopause 2011, 18, 30–43. [Google Scholar] [CrossRef]
- McNelis, J.C.; Manolopoulos, K.N.; Gathercole, L.L.; Bujalska, I.J.; Stewart, P.M.; Tomlinson, J.W.; Arlt, W. Dehydroepiandrosterone exerts antiglucocorticoid action on human preadipocyte proliferation, differentiation, and glucose uptake. Am. J. Physiol. Endocrinol. Metab. 2013, 305, E1134–E1144. [Google Scholar] [CrossRef]
- Balazs, Z.; Schweizer, R.A.S.; Frey, F.J.; Rohner-Jeanrenaud, F.; Odermatt, A. DHEA induces 11 -HSD2 by acting on CCAAT/enhancer-binding proteins. J. Am. Soc. Nephrol. 2008, 19, 92–101. [Google Scholar] [CrossRef]
- Kimonides, V.G.; Khatibi, N.H.; Svendsen, C.N.; Sofroniew, M.V.; Herbert, J. Dehydroepiandrosterone (DHEA) and DHEA-sulfate (DHEAS) protect hippocampal neurons against excitatory amino acid-induced neurotoxicity. Proc. Natl. Acad. Sci. USA 1998, 95, 1852–1857. [Google Scholar] [CrossRef]
- Kamin, H.S.; Kertes, D.A. Cortisol and DHEA in development and psychopathology. Horm. Behav. 2017, 89, 69–85. [Google Scholar] [CrossRef]
- Popplewell, P.Y.; Azhar, S. Effects of aging on cholesterol content and cholesterol metabolizing enzymes in the rat adrenal gland. Endocrinology 1987, 121, 64–73. [Google Scholar] [CrossRef] [PubMed]
- Malamed, S.; Carsia, R.V. Aging of the rat adrenocortical cell: Response to ACTH and cyclic AMP in vitro. J. Gerontol 1983, 38, 130–136. [Google Scholar] [CrossRef] [PubMed]
- Hu, Z.; Shen, W.J.; Cortez, Y.; Tang, X.; Liu, L.F.; Kraemer, F.B.; Azhar, S. Hormonal Regulation of MicroRNA Expression in Steroid Producing Cells of the Ovary, Testis and Adrenal Gland. PLoS ONE 2013, 8, e78040. [Google Scholar] [CrossRef] [PubMed]
- Guzman, C.; Cabrera, R.; Cardenas, M.; Larrea, F.; Nathanielsz, P.W.; Zambrano, E. Protein restriction during fetal and neonatal development in the rat alters reproductive function and accelerates reproductive ageing in female progeny. J. Physiol. 2006, 572 Pt 1, 97–108. [Google Scholar] [CrossRef]
- Zhang, T.Y.; Labonté, B.; Wen, X.L.; Turecki, G.; Meaney, M.J. Epigenetic mechanisms for the early environmental regulation of hippocampal glucocorticoid receptor gene expression in rodents and humans. Neuropsychopharmacology 2013, 38, 111–123. [Google Scholar] [CrossRef]
- Zoubovsky, S.P.; Williams, M.T.; Hoseus, S.; Tumukuntala, S.; Riesenberg, A.; Schulkin, J.; Vorhees, C.V.; Campbell, K.; Lim, H.W.; Muglia, L.J. Neurobehavioral abnormalities following prenatal psychosocial stress are differentially modulated by maternal environment. Transl. Psychiatry 2022, 12, 22. [Google Scholar] [CrossRef]
- Reyes-Castro, L.A.; Rodriguez, J.S.; Rodriguez-Gonzalez, G.L.; Chavira, R.; Bautista, C.J.; McDonald, T.J.; Nathanielsz, P.W.; Zambrano, E. Pre- and/or postnatal protein restriction developmentally programs affect and risk assessment behaviors in adult male rats. Behav. Brain Res. 2012, 227, 324–329. [Google Scholar] [CrossRef]
- Reyes-Castro, L.A.; Rodriguez, J.S.; Charco, R.; Bautista, C.J.; Larrea, F.; Nathanielsz, P.W.; Zambrano, E. Maternal protein restriction in the rat during pregnancy and/or lactation alters cognitive and anxiety behaviors of female offspring. Int. J. Dev. Neurosci. 2012, 30, 39–45. [Google Scholar] [CrossRef]
- Salzmann, C.; Otis, M.; Long, H.; Roberge, C.; Gallo-Payet, N.; Walker, C.D. Inhibition of steroidogenic response to adrenocorticotropin by leptin: Implications for the adrenal response to maternal separation in neonatal rats. Endocrinology 2004, 145, 1810–1822. [Google Scholar] [CrossRef]
- Lashansky, G.; Saenger, P.; Fishman, K.; Gautier, T.; Mayes, D.; Berg, G.; Martino-Nardi, J.D.; Reiter, E. Normative data for adrenal steroidogenesis in a healthy pediatric population: Age- and sex-related changes after adrenocorticotropin stimulation. J. Clin. Endocrinol. Metab. 1991, 73, 674–686. [Google Scholar] [CrossRef] [PubMed]
- Puppala, S.; Li, C.; Glenn, J.P.; Saxena, R.; Gawrieh, S.; Quinn, A.; Palarczyk, J.; Dick, E.J., Jr.; Nathanielsz, P.W.; Cox, L.A. Primate fetal hepatic responses to maternal obesity: Epigenetic signalling pathways and lipid accumulation. J. Physiol. 2018, 596, 5823–5837. [Google Scholar] [CrossRef] [PubMed]
- Orentreich, N.; Brind, J.L.; Rizer, R.L.; Vogelman, J.H. Age Changes and Sex Differences in Serum Dehydroepiandrosterone Sulfate Concentrations throughout Adulthood. J. Clin. Endocrinol. Metab. 1984, 59, 551–555. [Google Scholar] [CrossRef]
- Zhai, G.; Teumer, A.; Stolk, L.; Perry, J.R.B.; Vandenput, L. Eight Common Genetic Variants Associated with Serum DHEAS Levels Suggest a Key Role in Ageing Mechanisms. PLoS Genet. 2011, 7, 1002025. [Google Scholar] [CrossRef]
- Lapp, H.E.; Bartlett, A.A.; Hunter, R.G. Stress and glucocorticoid receptor regulation of mitochondrial gene expression. J. Mol. Endocrinol. 2019, 62, R121–R128. [Google Scholar] [CrossRef] [PubMed]
- Mattison, J.A.; Lane, M.A.; Roth, G.S.; Ingram, D.K. Calorie restriction in rhesus monkeys. Exp. Gerontol. 2003, 38, 35–46. [Google Scholar] [CrossRef] [PubMed]
- Gruver-Yates, A.L.; Cidlowski, J.A. Tissue-Specific Actions of Glucocorticoids on Apoptosis: A Double-Edged Sword. Cells 2013, 2, 202–223. [Google Scholar] [CrossRef]
- Sinha, R.A.; Singh, B.K.; Yen, P.M. Reciprocal crosstalk between autophagic and endocrine signaling in metabolic homeostasis. Endocr. Rev. 2017, 38, 69–102. [Google Scholar] [CrossRef]
- Woods, C.P.; Hazlehurst, J.M.; Tomlinson, J.W. Glucocorticoids and non-alcoholic fatty liver disease. J. Steroid. Biochem. Mol. Biol. 2015, 154, 94–103. [Google Scholar] [CrossRef]


Disclaimer/Publisher’s Note: The statements, opinions and data contained in all publications are solely those of the individual author(s) and contributor(s) and not of MDPI and/or the editor(s). MDPI and/or the editor(s) disclaim responsibility for any injury to people or property resulting from any ideas, methods, instructions or products referred to in the content. |
© 2023 by the authors. Licensee MDPI, Basel, Switzerland. This article is an open access article distributed under the terms and conditions of the Creative Commons Attribution (CC BY) license (https://creativecommons.org/licenses/by/4.0/).
Share and Cite
Zambrano, E.; Reyes-Castro, L.A.; Rodríguez-González, G.L.; Chavira, R.; Lomas-Soria, C.; Gerow, K.G.; Nathanielsz, P.W. Developmental Programming-Aging Interactions Have Sex-Specific and Developmental Stage of Exposure Outcomes on Life Course Circulating Corticosterone and Dehydroepiandrosterone (DHEA) Concentrations in Rats Exposed to Maternal Protein-Restricted Diets. Nutrients 2023, 15, 1239. https://doi.org/10.3390/nu15051239
Zambrano E, Reyes-Castro LA, Rodríguez-González GL, Chavira R, Lomas-Soria C, Gerow KG, Nathanielsz PW. Developmental Programming-Aging Interactions Have Sex-Specific and Developmental Stage of Exposure Outcomes on Life Course Circulating Corticosterone and Dehydroepiandrosterone (DHEA) Concentrations in Rats Exposed to Maternal Protein-Restricted Diets. Nutrients. 2023; 15(5):1239. https://doi.org/10.3390/nu15051239
Chicago/Turabian StyleZambrano, Elena, Luis A. Reyes-Castro, Guadalupe L. Rodríguez-González, Roberto Chavira, Consuelo Lomas-Soria, Kenneth G. Gerow, and Peter W. Nathanielsz. 2023. "Developmental Programming-Aging Interactions Have Sex-Specific and Developmental Stage of Exposure Outcomes on Life Course Circulating Corticosterone and Dehydroepiandrosterone (DHEA) Concentrations in Rats Exposed to Maternal Protein-Restricted Diets" Nutrients 15, no. 5: 1239. https://doi.org/10.3390/nu15051239
APA StyleZambrano, E., Reyes-Castro, L. A., Rodríguez-González, G. L., Chavira, R., Lomas-Soria, C., Gerow, K. G., & Nathanielsz, P. W. (2023). Developmental Programming-Aging Interactions Have Sex-Specific and Developmental Stage of Exposure Outcomes on Life Course Circulating Corticosterone and Dehydroepiandrosterone (DHEA) Concentrations in Rats Exposed to Maternal Protein-Restricted Diets. Nutrients, 15(5), 1239. https://doi.org/10.3390/nu15051239