
Comparable Hemodilution with Hypertonic Glucose in Patients with and without Type-2 Diabetes Mellitus during Hemodialysis

 , , , and
Abstract
1. Introduction
2. Materials and Methods
2.1. Subjects
2.2. Protocol
2.3. Glucose Dilution
2.4. Data Analysis
2.5. Statistics
3. Results
4. Discussion
5. Conclusions
Author Contributions
Funding
Institutional Review Board Statement
Informed Consent Statement
Data Availability Statement
Conflicts of Interest
References
- Nguyen, M.K.; Kurtz, I. Determinants of plasma water sodium concentration as reflected in the Edelman equation: Role of osmotic and Gibbs-Donnan equilibrium. Am. J. Physiol. Renal. Physiol. 2004, 286, F828–F837. [Google Scholar] [CrossRef] [PubMed]
- Alberti, K.G.M.M. Screening and diagnosis of prediabetes: Where are we headed? Diabetes Obes. Metab. 2007, 9, 12–16. [Google Scholar] [CrossRef] [PubMed]
- Palumbo, P.; Ditlevsen, S.; Bertuzzi, A.; De Gaetano, A. Mathematical modeling of the glucose–insulin system: A review. Math. Biosci. 2013, 244, 69–81. [Google Scholar] [CrossRef] [PubMed]
- Hecking, M.; Kainz, A.; Werzowa, J.; Haidinger, M.; Döller, D.; Tura, A.; Karaboyas, A.; Hörl, W.H.; Wolzt, M.; Sharif, A.; et al. Glucose Metabolism after Renal Transplantation. Diabetes Care 2013, 36, 2763–2771. [Google Scholar] [CrossRef]
- Bergrem, H.A.; Valderhaug, T.G.; Hartmann, A.; Bergrem, H.; Hjelmesæth, J.; Jenssen, T. Glucose tolerance before and after renal transplantation. Nephrol. Dial. Transplant. 2010, 25, 985–992. [Google Scholar] [CrossRef]
- Bergrem, H.A.; Valderhaug, T.G.; Hartmann, A.; Hjelmesæth, J.; Leivestad, T.; Bergrem, H.; Jenssen, T.; Hjelmesaeth, J. Undiagnosed Diabetes in Kidney Transplant Candidates: A Case-Finding Strategy. Clin. J. Am. Soc. Nephrol. 2010, 5, 616–622. [Google Scholar] [CrossRef]
- Nette, R.W.; Krepel, H.P.; Meiracker, A.H.V.D.; Weimar, W.; Zietse, R. Specific effect of the infusion of glucose on blood volume during haemodialysis. Nephrol. Dial. Transplant. 2002, 17, 1275–1280. [Google Scholar] [CrossRef]
- Niemczyk, L.; Schneditz, D.; Wojtecka, A.; Szamotulska, K.; Smoszna, J.; Niemczyk, S. Glucose tolerance in patients with and without type 2 diabetes mellitus during hemodialysis. Diabetes Res. Clin. Pract. 2021, 173, 108694. [Google Scholar] [CrossRef]
- Schneditz, D.; Niemczyk, S.; Sauseng, N.; Bachler, I.; Zierler, E.; Lackner, H.K.; Hafner-Giessauf, H. Osmotic and Hemodynamic Effects of Hypertonic Glucose During Hemodialysis. ASAIO J. 2017, 63, 824–831. [Google Scholar] [CrossRef]
- Schneditz, D.; Niemczyk, L.; Niemczyk, S. Modeling of insulin secretion and insulin mass balance during hemodialysis in patients with and without type 2 diabetes. Biocybern. Biomed. Eng. 2021, 41, 391–401. [Google Scholar] [CrossRef]
- Rick, W. Glucose-Toleranz-Teste. In Klinische Chemie und Mikroskopie, 3rd ed.; Springer: Berlin/Heidelberg, Germany, 1974; pp. 182–186. [Google Scholar]
- Hahn, R.G.; Nyström, T. Plasma Volume Expansion Resulting from Intravenous Glucose Tolerance Test. Comput. Math. Methods Med. 2011, 2011, 965075. [Google Scholar] [CrossRef] [PubMed]
- Godsland, I.F.; Walton, C. Maximizing the success rate of minimal model insulin sensitivity measurement in humans: The importance of basal glucose levels. Clin. Sci. 2001, 101, 1–9. [Google Scholar] [CrossRef]
- Schneditz, D.; Pogglitsch, H.; Horina, J.; Binswanger, U. A blood protein monitor for the continuous measurement of blood volume changes during hemodialysis. Kidney Int. 1990, 38, 342–346. [Google Scholar] [CrossRef]
- Thompson, H.K., Jr.; Starmer, C.F.; Whalen, R.E.; McIntosh, H.D. Indicator Transit Time Considered as a Gamma Variate. Circ. Res. 1964, 14, 502–515. [Google Scholar] [CrossRef] [PubMed]
- Hödlmoser, S.; Carrero, J.J.; Kurnikowski, A.; Fu, E.L.; Swartling, O.; Winkelmayer, W.C.; Schernhammer, E.S.; Hecking, M. Kidney Function, Kidney Replacement Therapy, and Mortality in Men and Women. Kidney Int. Rep. 2021, 7, 444–454. [Google Scholar] [CrossRef] [PubMed]
- Kobayashi, S.; Maesato, K.; Moriya, H.; Ohtake, T.; Ikeda, T. Insulin resistance in patients with chronic kidney disease. Am. J. Kidney Dis. 2005, 45, 275–280. [Google Scholar] [CrossRef]
- Hung, A.M.; Ikizler, T.A. Factors determining insulin resistance in chronic hemodialysis patients. Contrib. Nephrol. 2011, 171, 127–134. [Google Scholar] [CrossRef]
- Kron, J.; Schneditz, D.; Leimbach, T.; Aign, S.; Kron, S. A Simple and Feasible Method to Determine Absolute Blood Volume in Hemodialysis Patients in Clinical Practice. Blood Purif. 2014, 38, 180–187. [Google Scholar] [CrossRef]
- Schneditz, D.; Kenner, T.; Heimel, H.; Stabinger, H. A sound-speed sensor for the measurement of total protein concentration in disposable, blood-perfused tubes. J. Acoust. Soc. Am. 1989, 86, 2073–2080. [Google Scholar] [CrossRef]
- Stefanidis, I.; Stiller, S.; Ikonomov, V.; Mann, H. Sodium and body fluid homeostasis in profiling hemodialysis treatment. Int. J. Artif. Organs 2002, 25, 421–428. [Google Scholar] [CrossRef]
- Akcahuseyin, E.; Nette, R.W.; Vincent, H.H.; van Duyl, W.A.; Krepel, H.; Weimar, W.; Zietse, R. Simulation study of the intercompartmental fluid shifts during hemodialysis. ASAIO J. 2000, 46, 81–94. [Google Scholar] [CrossRef] [PubMed]
- Brummelhuis, W.J.; van Geest, R.J.; van Schelven, L.J.; Boer, W.H. Sodium Profiling, But Not Cool Dialysate, Increases the Absolute Plasma Refill Rate During Hemodialysis. ASAIO J. 2009, 55, 575–580. [Google Scholar] [CrossRef] [PubMed]
- Scharfetter, H.; Wirnsberger, G.; Hutten, H.; Holzer, H. Development and Critical Evaluation of an Improved Comprehensive Multicompartment Model for the Exchange Processes during Hemodialysis. Biomed. Tech. 1995, 40, 54–63. [Google Scholar] [CrossRef] [PubMed]
- Baron, A.D. Hemodynamic actions of insulin. Am. J. Physiol. Metab. 1994, 267, E187–E202. [Google Scholar] [CrossRef] [PubMed]
- Russell, R.D.; Hu, D.; Greenaway, T.; Sharman, J.E.; Rattigan, S.; Richards, S.M.; Keske, M.A. Oral glucose challenge impairs skeletal muscle microvascular blood flow in healthy people. Am. J. Physiol. Endocrinol. Metab. 2018, 315, E307–E315. [Google Scholar] [CrossRef] [PubMed]
- Niemczyk, L.; Romejko, K.; Szamotulska, K.; Schneditz, D.; Niemczyk, S. Changes of Hemodynamic Parameters after Intradialytic Glucose Injection. Nutrients 2023, 15, 437. [Google Scholar] [CrossRef]
- Niemczyk, L.; Buszko, K.; Schneditz, D.; Wojtecka, A.; Romejko, K.; Saracyn, M.; Niemczyk, S. Cardiovascular Response to Intravenous Glucose Injection during Hemodialysis with Assessment of Entropy Alterations. Nutrients 2022, 14, 5362. [Google Scholar] [CrossRef] [PubMed]
- Shimizu, K.; Kurosawa, T.; Sanjo, T. Effect of Hyperosmolality on Vasopressin Secretion in Intradialytic Hypotension: A Mechanistic Study. Am. J. Kidney Dis. 2008, 52, 294–304. [Google Scholar] [CrossRef]
- Mischi, M.; Boer, J.A.D.; Korsten, H.H.M. On the physical and stochastic representation of an indicator dilution curve as a gamma variate. Physiol. Meas. 2008, 29, 281–294. [Google Scholar] [CrossRef]
- Dasselaar, J.J.; de Jong, P.E.; Huisman, R.M.; Franssen, C.F. Effect of High and Low Ultrafiltration Volume during Hemodialysis on Relative Blood Volume. ASAIO J. 2006, 52, 169–173. [Google Scholar] [CrossRef]


| Variable (Unit) | With (n = 14) | Without (n = 20) | p |
|---|---|---|---|
| Female (number, percentage) | 6 (43%) | 6 (30%) | 0.49 |
| Age (years) | 70.6 ± 7.9 | 55.1 ± 13.4 | <0.001 |
| Height (cm) | 168.4 ± 9.6 | 169.3 ± 8.5 | 0.79 |
| Dry body mass (kg) | 83.7 ± 15.1 | 78.6 ± 19.2 | 0.41 |
| BMI (kg.m−2) | 29.5 ± 4.3 | 27.3 ± 5.7 | 0.24 |
| Total body water (L) | 39.7 ± 7.7 | 39.7 ± 8.3 | 0.97 |
| Extracellular volume (L) | 20.9 ± 4.3 | 18.9 ± 3.7 | 0.16 |
| Intracellular volume (L) | 18.8 ± 3.8 | 20.9 ± 4.9 | 0.19 |
| Fat mass (kg) | 34.2 ± 9.9 | 27.8 ± 12.7 | 0.12 |
| Relative fat mass (%) | 39.0 ± 9.2 | 32.8 ± 10.1 | 0.08 |
| Relative lean tissue mass (%) | 41.3 ± 8.8 | 52.6 ± 12.0 | <0.01 |
| Volume excess (L) | 4.6 ± 3.3 | 1.9 ± 2.3 | <0.01 |
| Ultrafiltration volume (L) | 2.5 ± 1.0 | 2.4 ± 0.9 | 0.85 |
| Ultrafiltration rate (L/h) | 0.3 ± 0.0 | 0.3 ± 0.0 | 0.11 |
| Hematocrit (%) | 34.6 ± 4.4 | 35.1 ± 2.7 | 0.71 |
| Infusion volume (mL) | 104.6 ± 18.9 | 98.2 ± 24.1 | 0.41 |
| Baseline glucose (mmol/L) | 7.2 (5.3,11.1) | 5.4 (5.0,5.9) | <0.05 |
| Baseline insulin (pmol/L) | 72.3 (49.4,90.2) | 83.9 (47.1,124.0) | 0.36 |
| Insulin resistance | 3.6 (2.9,4.5) | 3.2 (1.9,5.6) | 0.62 |
| ß-cell function | 61.0 (40.2,97.8) | 148.1 (92.0,189.4) | <0.05 |
| Insulin sensitivity | 27.8 (22.5,35.0) | 31.2 (17.8,51.4) | 0.62 |
| Glucose disposition | 0.4 (0.2,1.2) | 0.2 (0.1,0.6) | 0.21 |
| Variable (Unit) | With (n = 14) | Without (n = 20) | p |
|---|---|---|---|
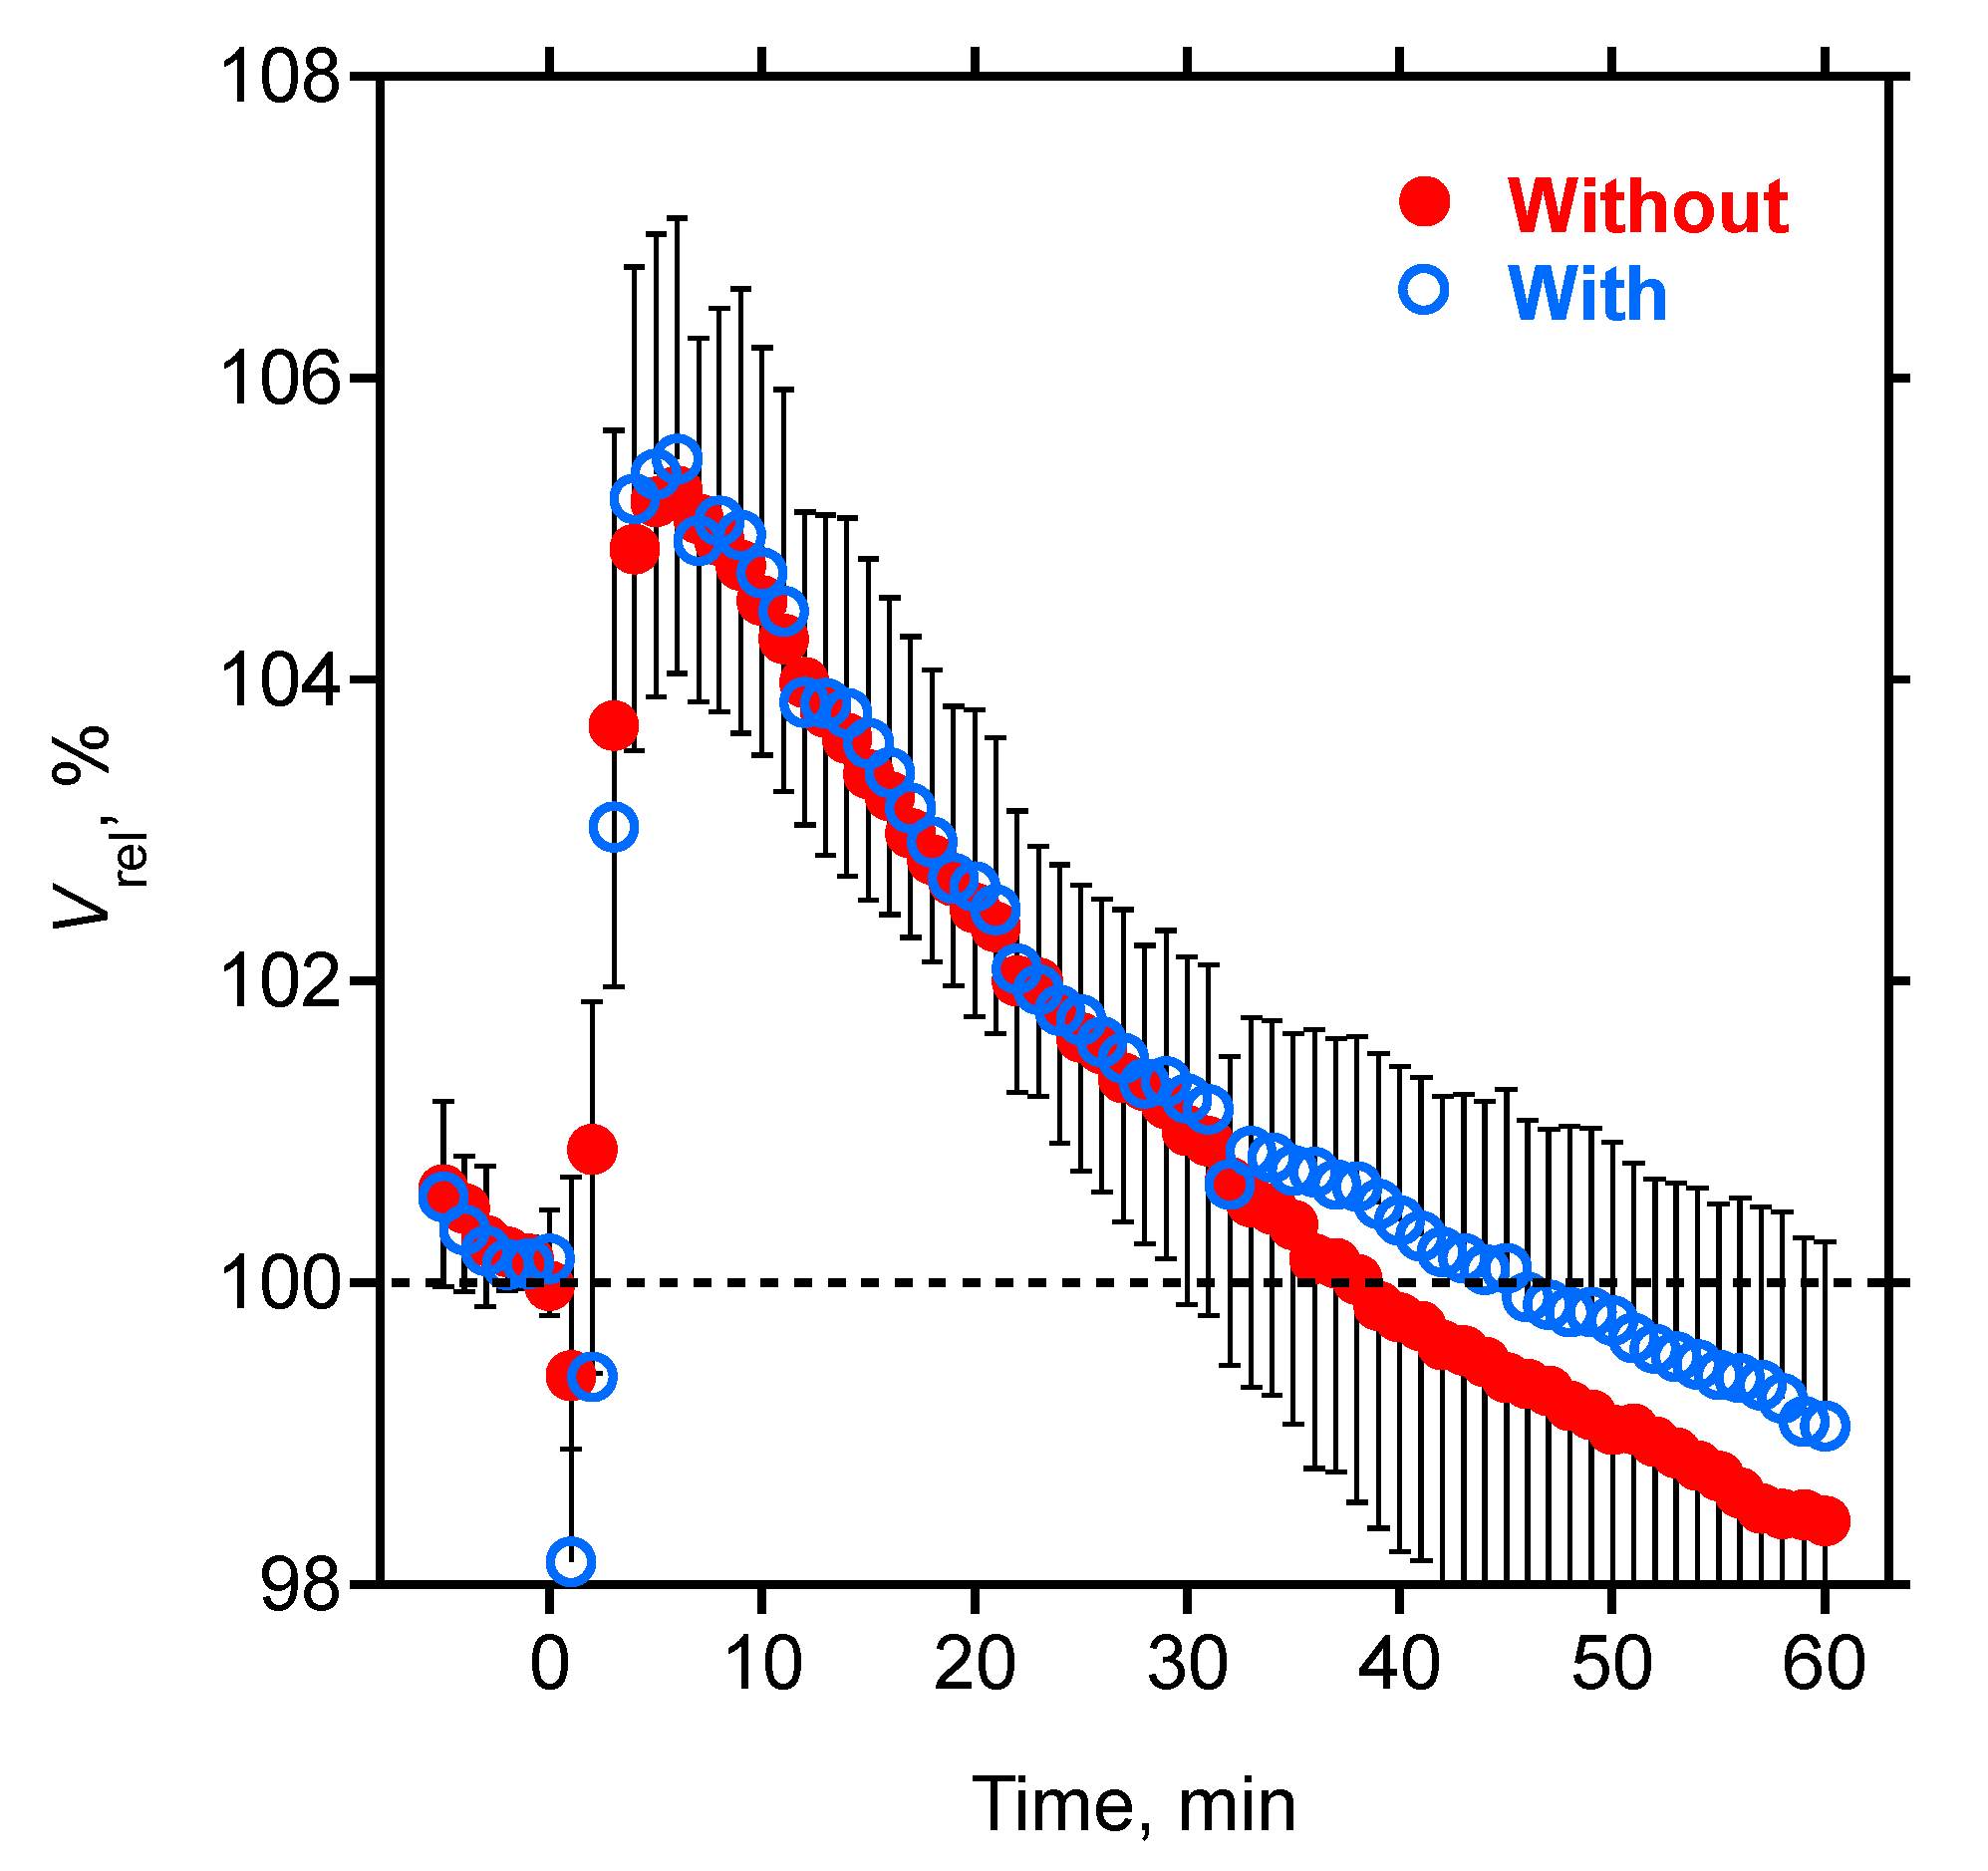
| Vrel at t = 0, (%) | 100.1 (100.0,100.3) | 100.0 (99.9,100.1) | 0.11 |
| Vrel at t = 6, (%) | 105.5 ± 1.6 *** | 105.3 ± 1.2 *** | 0.67 |
| Vrel at t = 10, (%) | 104.7 ± 1.5 *** | 104.5 ± 1.0 *** | 0.67 |
| Vrel at t = 20, (%) | 102.6 ± 1.2 *** | 102.5 ± 0.7 *** | 0.67 |
| Vrel at t = 30, (%) | 101.2 ± 0.9 * | 101.0 ± 1.1* | 0.57 |
| Vrel at t = 40, (%) | 100.4 ± 1.0 | 99.8 ± 1.6 | 0.19 |
| Vrel at t = 50, (%) | 99.7 ± 1.2 | 99.0 ± 2.0 | 0.22 |
| Vrel at t = 60, (%) | 99.1 ± 1.2 * | 98.4 ± 2.4 *** | 0.37 |
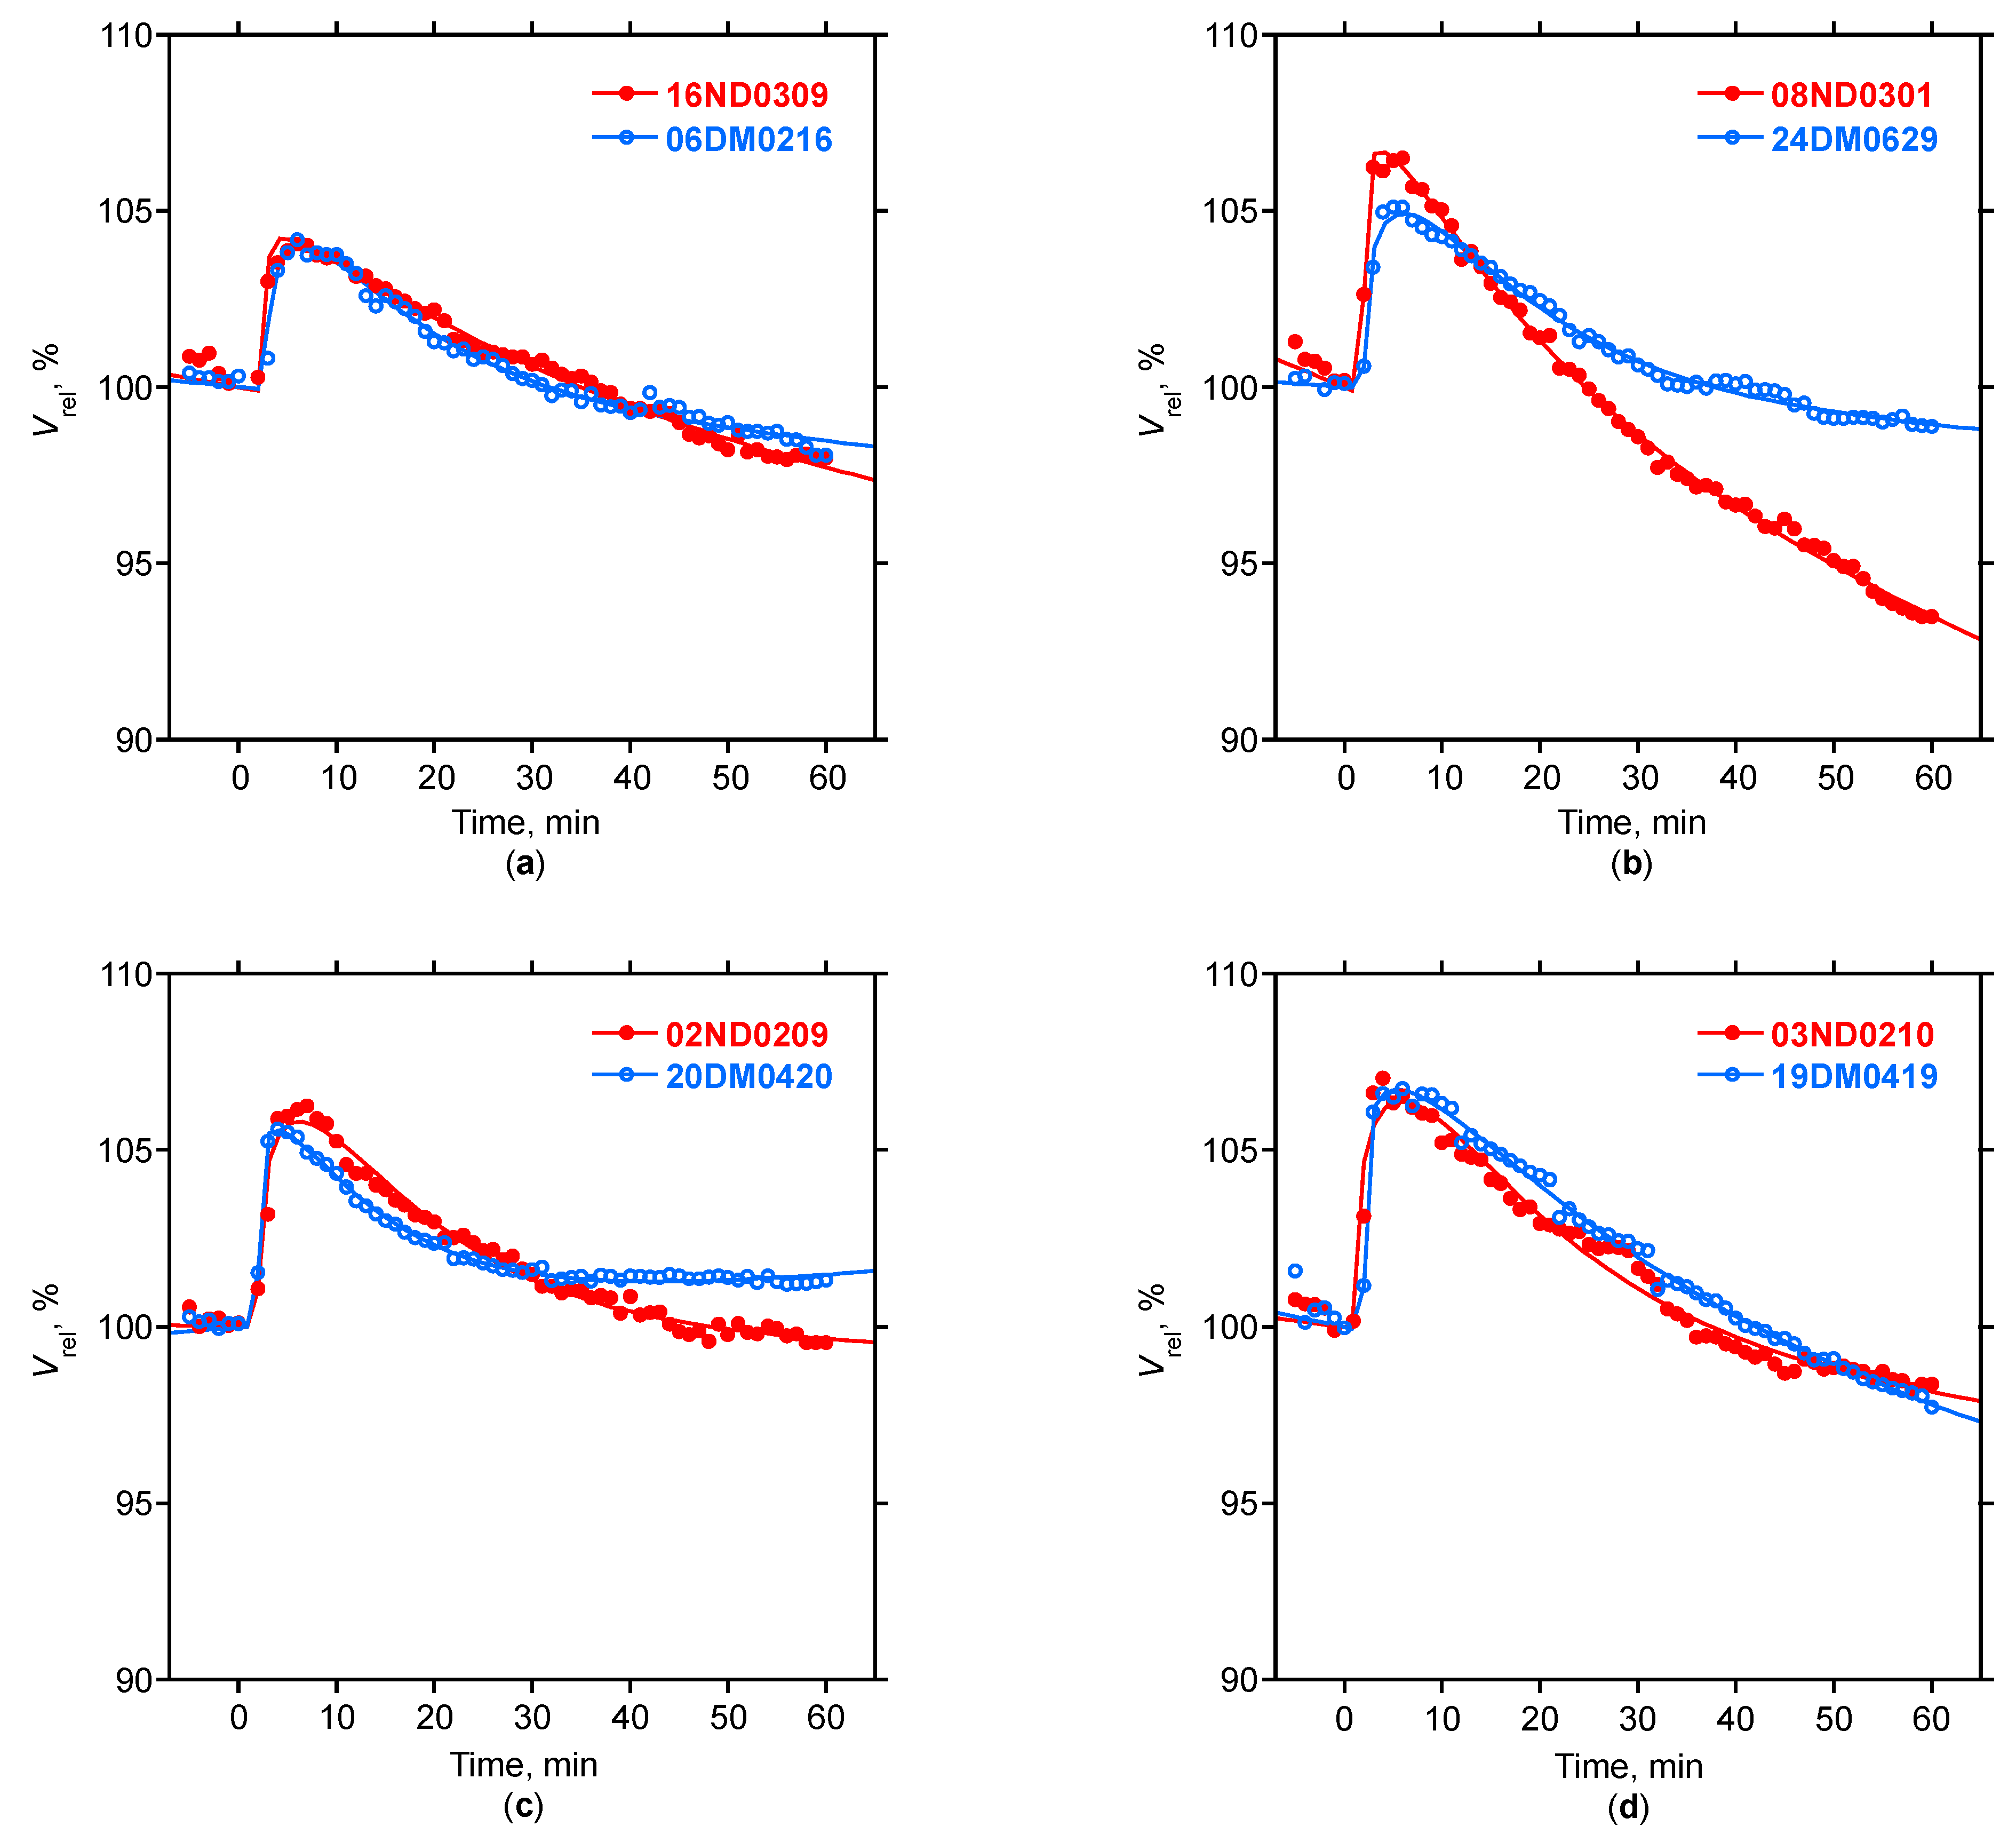
| Model: Pearson r | 0.99 (0.98,1.00) | 0.99 (0.99,1.00) | 0.96 |
| Model: Delay, δ (min) | 2.56 ± 0.65 | 2.33 ± 0.97 | 0.45 |
| Model: Parameter A | 5.47 ± 1.60 | 5.10 ± 1.40 | 0.47 |
| Model: Parameter α | 0.15 (0.11,0.28) | 0.19 (0.11,0.29) | 0.55 |
| Model: Parameter ß | 14.96 (11.46,22.62) | 16.42 (12.04,25.85) | 0.58 |
| Model: Parameter k | 0.03 ± 0.03 | 0.04 ± 0.04 | 0.40 |
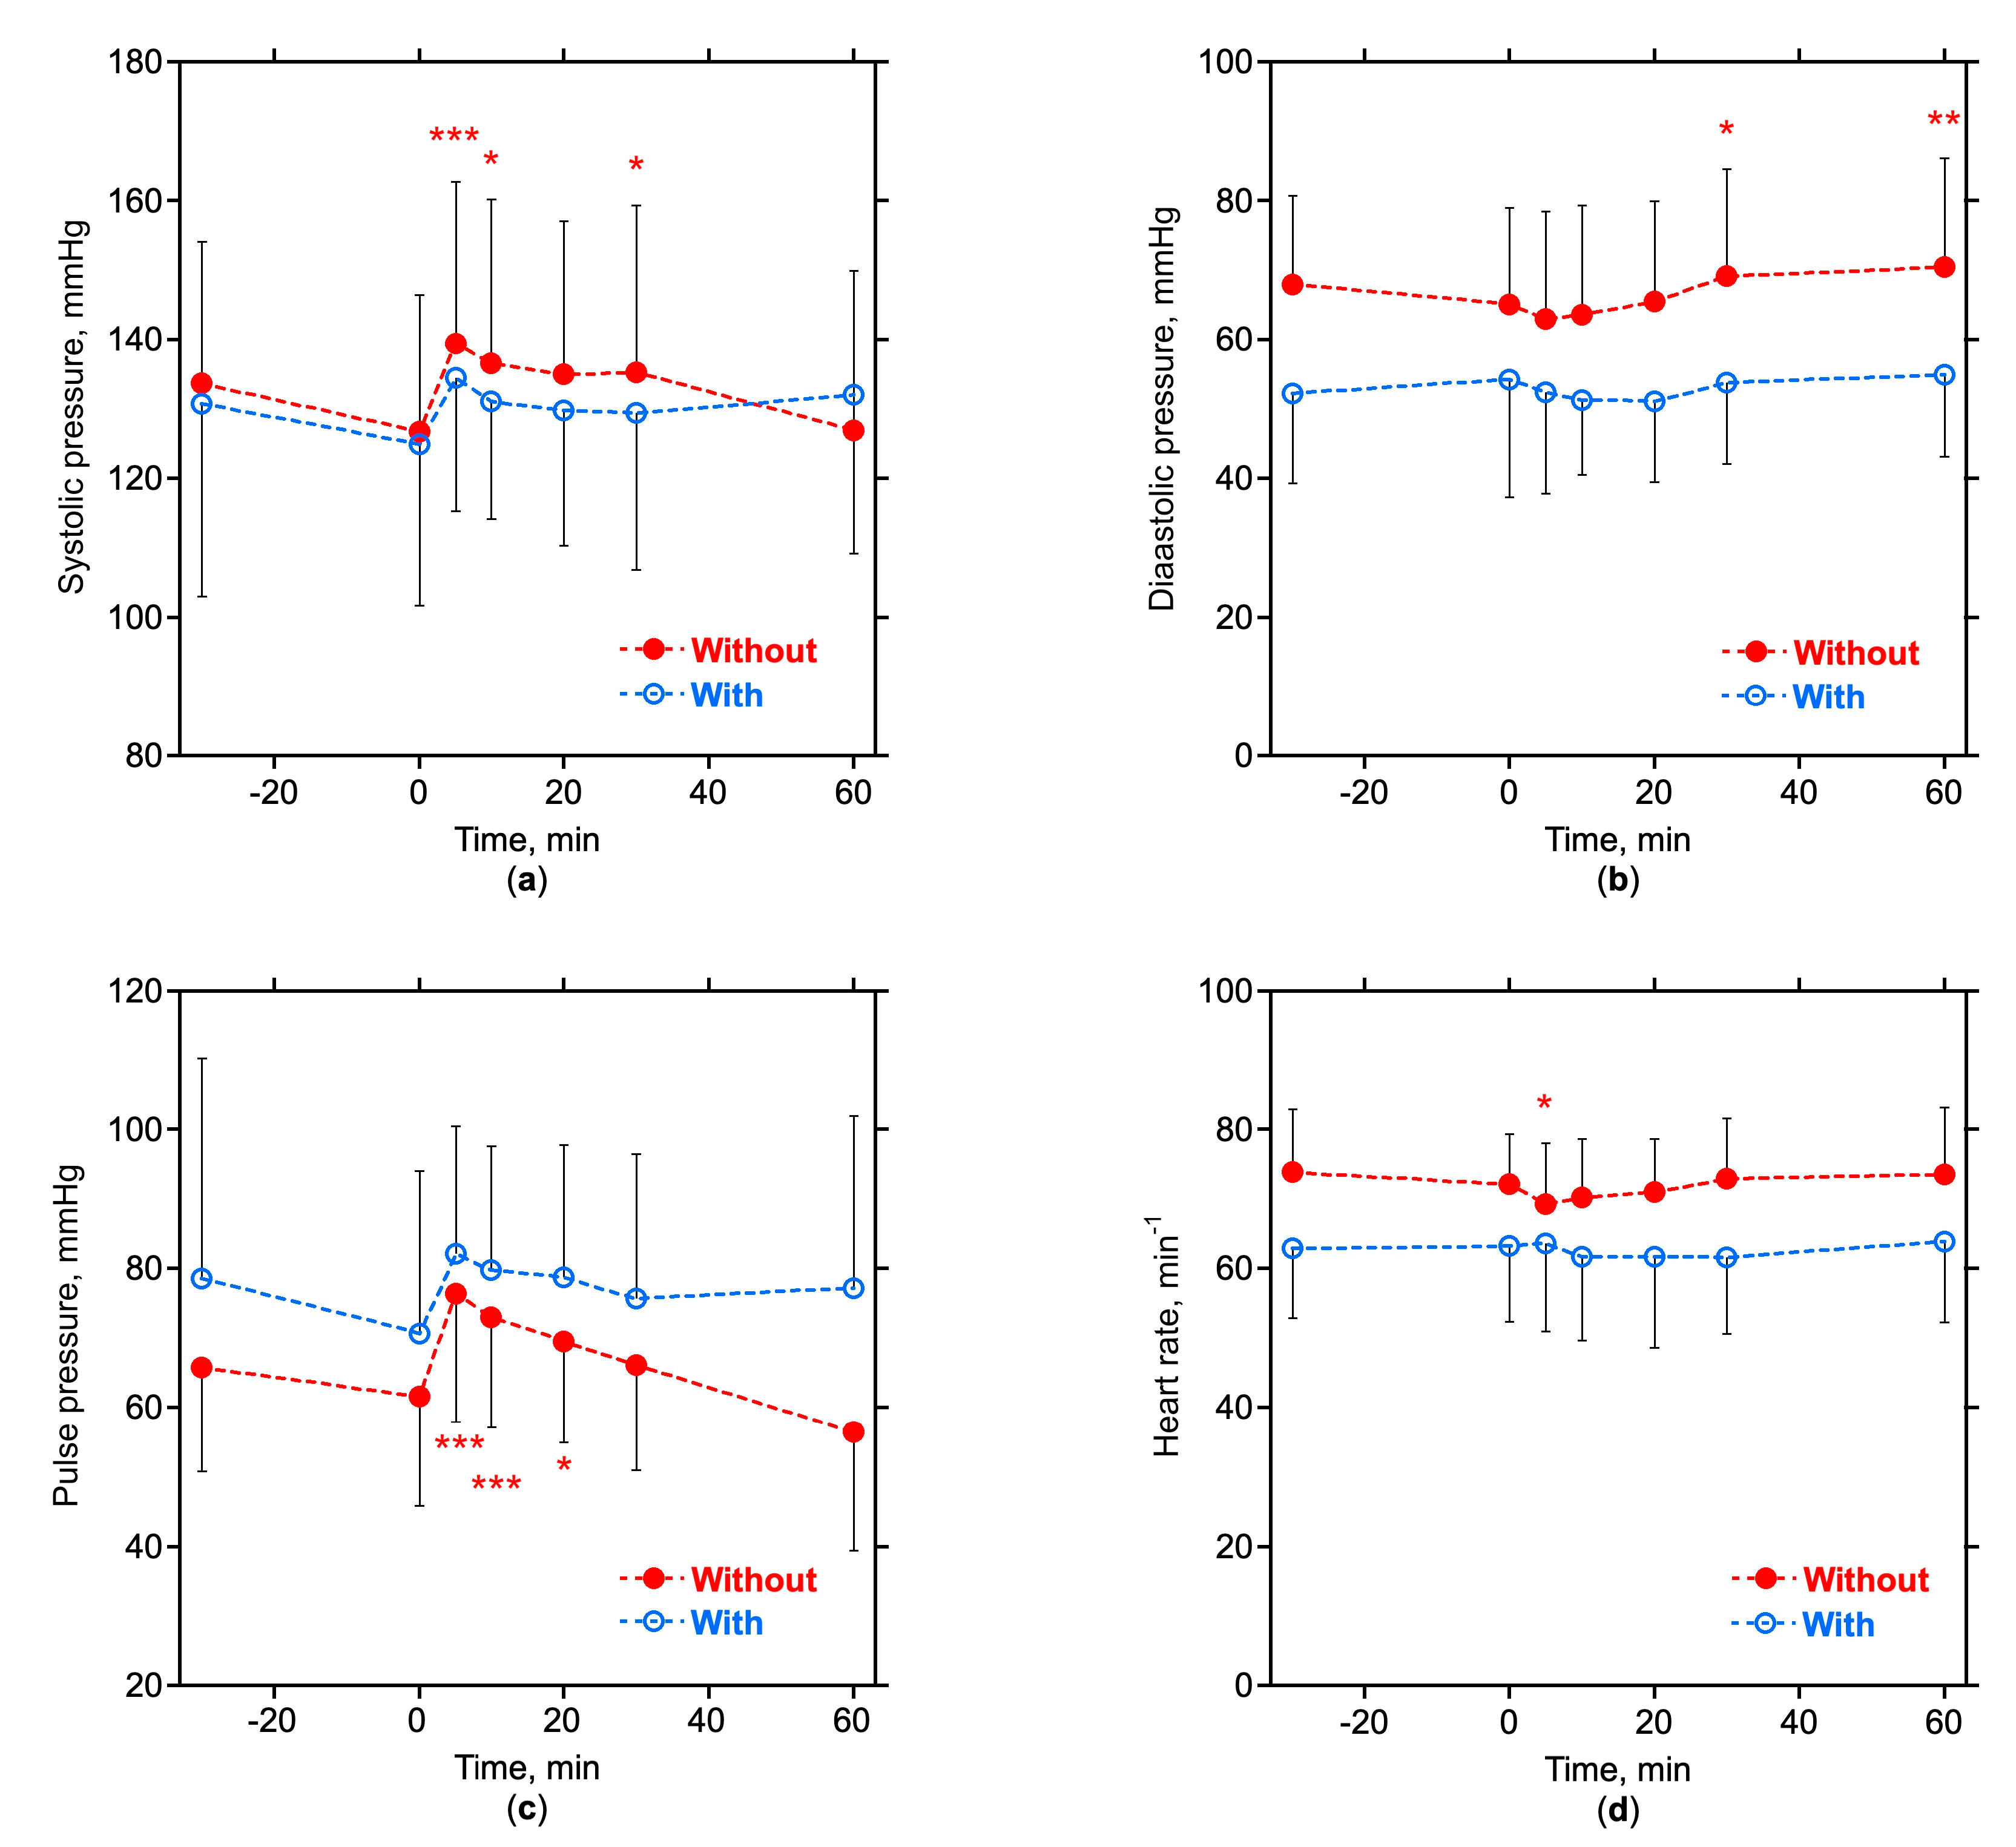
| Systolic pressure at t = 0, (mmHg) | 124.9 ± 23.2 | 126.7 ± 19.8 | 0.81 |
| Diastolic pressure at t = 0, (mmHg) | 54.2 ± 16.9 | 65.1 ± 13.9 | <0.05 |
| Pulse pressure at t = 0, (mmHg) | 70.6 ± 23.4 | 61.6 ± 15.8 | 0.22 |
| Heart rate at t = 0, (min−1) | 63.2 ± 10.8 | 71.6 ± 6.9 | <0.01 |
| Variable | Vrel,6 | δ | A | α | ß | k |
|---|---|---|---|---|---|---|
| Age | −0.12 | 0.08 | 0.01 | −0.09 | 0.05 | −0.21 |
| Height | −0.29 | 0.24 | −0.36 * | 0.07 | 0.04 | −0.10 |
| Dry body mass | 0.40 * | 0.29 | 0.20 | 0.13 | −0.15 | 0.07 |
| Body mass index | 0.62 *** | 0.21 | 0.44 ** | 0.10 | −0.19 | 0.14 |
| Fat mass | 0.65 *** | 0.21 | 0.47 ** | 0.16 | −0.33 | 0.07 |
| Relative fat mass | 0.73 *** | 0.16 | 0.63 *** | 0.06 | −0.40 * | 0.03 |
| Relative lean tissue mass | −0.58 *** | −0.14 | −0.50 ** | −0.11 | 0.37 * | 0.07 |
| Volume excess | −0.63 *** | 0.03 | −0.54 *** | 0.11 | 0.15 | −0.29 |
| Ultrafiltration volume | −0.02 | 0.29 | 0.02 | −0.09 | 0.26 | 0.33 |
| Ultrafiltration rate | −0.11 | 0.28 | −0.21 | −0.19 | 0.19 | −0.06 |
| Baseline glucose | 0.15 | 0.05 | 0.12 | 0.23 | −0.29 | 0.07 |
| Baseline insulin | 0.58 *** | 0.24 | 0.57 *** | −0.16 | −0.11 | 0.37 * |
| Insulin resistance | 0.55 *** | 0.23 | 0.53 *** | −0.04 | −0.21 | 0.35 * |
| ß-cell function | 0.31 | 0.12 | 0.33 | −0.29 | 0.12 | 0.23 |
| Insulin sensitivity | −0.55 *** | −0.23 | −0.53 *** | 0.04 | 0.21 | −0.35 * |
| Glucose disposition | −0.53 *** | −0.22 | −0.54 *** | 0.20 | 0.06 | −0.36 * |
| Vrel,6 | 1.00 | −0.03 | 0.88 *** | 0.05 | −0.31 | 0.13 |
| δ | −0.03 | 1.00 | 0.16 | −0.68 *** | 0.32 | 0.12 |
| A | 0.88 *** | 0.16 | 1.00 | −0.25 | −0.20 | 0.27 |
| α | 0.05 | −0.68 *** | −0.25 | 1.00 | −0.57 *** | −0.16 |
| ß | −0.31 | 0.32 | −0.20 | −0.57 *** | 1.00 | 0.27 |
Disclaimer/Publisher’s Note: The statements, opinions and data contained in all publications are solely those of the individual author(s) and contributor(s) and not of MDPI and/or the editor(s). MDPI and/or the editor(s) disclaim responsibility for any injury to people or property resulting from any ideas, methods, instructions or products referred to in the content. |
© 2023 by the authors. Licensee MDPI, Basel, Switzerland. This article is an open access article distributed under the terms and conditions of the Creative Commons Attribution (CC BY) license (https://creativecommons.org/licenses/by/4.0/).
Share and Cite
Schneditz, D.; Niemczyk, L.; Wojtecka, A.; Szamotulska, K.; Niemczyk, S. Comparable Hemodilution with Hypertonic Glucose in Patients with and without Type-2 Diabetes Mellitus during Hemodialysis. Nutrients 2023, 15, 536. https://doi.org/10.3390/nu15030536
Schneditz D, Niemczyk L, Wojtecka A, Szamotulska K, Niemczyk S. Comparable Hemodilution with Hypertonic Glucose in Patients with and without Type-2 Diabetes Mellitus during Hemodialysis. Nutrients. 2023; 15(3):536. https://doi.org/10.3390/nu15030536
Chicago/Turabian StyleSchneditz, Daniel, Longin Niemczyk, Anna Wojtecka, Katarzyna Szamotulska, and Stanisław Niemczyk. 2023. "Comparable Hemodilution with Hypertonic Glucose in Patients with and without Type-2 Diabetes Mellitus during Hemodialysis" Nutrients 15, no. 3: 536. https://doi.org/10.3390/nu15030536
APA StyleSchneditz, D., Niemczyk, L., Wojtecka, A., Szamotulska, K., & Niemczyk, S. (2023). Comparable Hemodilution with Hypertonic Glucose in Patients with and without Type-2 Diabetes Mellitus during Hemodialysis. Nutrients, 15(3), 536. https://doi.org/10.3390/nu15030536