
Association between Vitamin B and Obesity in Middle-Aged and Older Chinese Adults


Abstract
1. Introduction
2. Methods
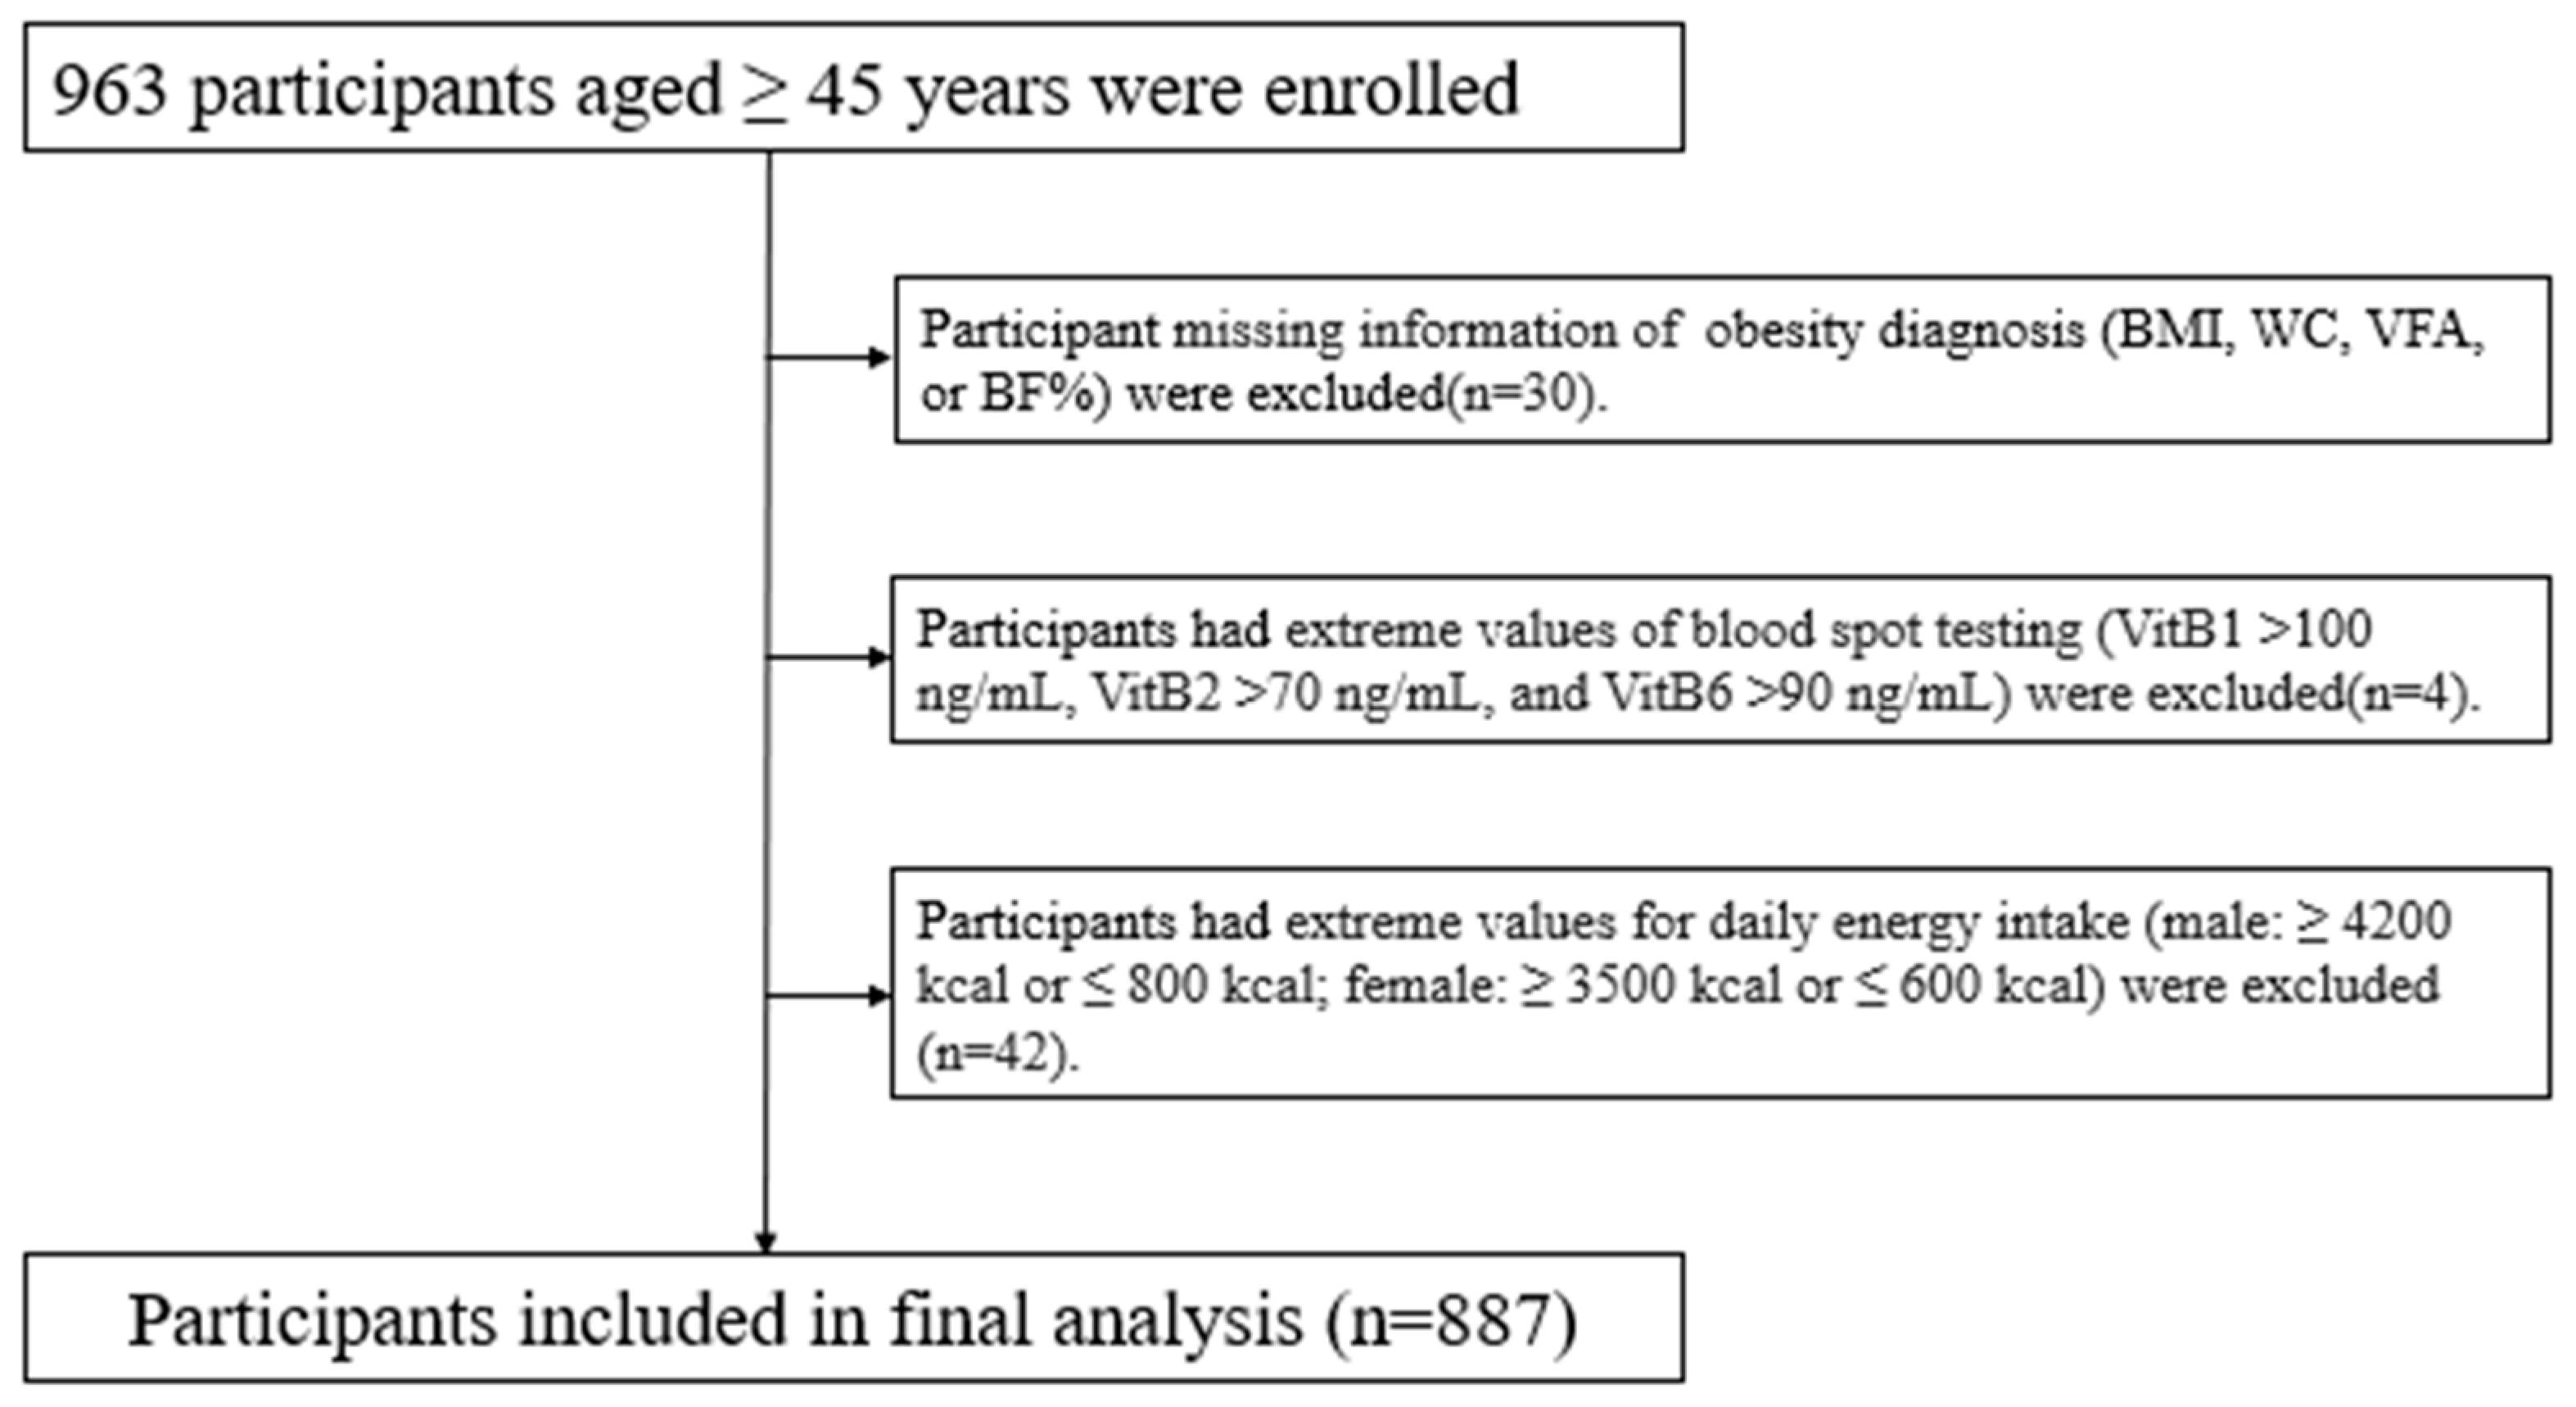
2.1. Participants
2.2. Dry Blood Spot Collection and Laboratory Testing
2.3. Body Composition and Obesity Ascertainment
2.4. Covariates
2.5. Statistical Analysis
3. Results
3.1. Participants’ Characteristics
3.2. Vitamin B Concentrations under Different Definitions of Obesity
3.3. The Relationships between Blood Vitamin B and Four Measurements of Obesity
3.4. Secondary Analysis
3.5. Discussion
3.6. Strength and Limitation
4. Conclusions
Supplementary Materials
Author Contributions
Funding
Institutional Review Board Statement
Informed Consent Statement
Data Availability Statement
Acknowledgments
Conflicts of Interest
References
- Bluher, M. Obesity: Global epidemiology and pathogenesis. Nat. Rev. Endocrinol. 2019, 15, 288–298. [Google Scholar] [CrossRef] [PubMed]
- Kelly, T.; Yang, W.; Chen, C.S.; Reynolds, K.; He, J. Global burden of obesity in 2005 and projections to 2030. Int. J. Obes. 2008, 32, 1431–1437. [Google Scholar] [CrossRef]
- Thomas-Valdés, S.; Tostes, M.d.G.V.; Anunciação, P.C.; da Silva, B.P.; Sant’Ana, H.M.P. Association between vitamin deficiency and metabolic disorders related to obesity. Crit. Rev. Food Sci. Nutr. 2017, 57, 3332–3343. [Google Scholar] [CrossRef] [PubMed]
- Depeint, F.; Bruce, W.R.; Shangari, N.; Mehta, R.; O’Brien, P.J. Mitochondrial function and toxicity: Role of the B vitamin family on mitochondrial energy metabolism. Chem.-Biol. Interact. 2006, 163, 94–112. [Google Scholar] [CrossRef] [PubMed]
- Suwannasom, N.; Kao, I.; Pruß, A.; Georgieva, R.; Bäumler, H. Riboflavin: The Health Benefits of a Forgotten Natural Vitamin. Int. J. Mol. Sci. 2020, 21, 950. [Google Scholar] [CrossRef] [PubMed]
- Mascolo, E.; Vernì, F. Vitamin B6 and Diabetes: Relationship and Molecular Mechanisms. Int. J. Mol. Sci. 2020, 21, 3669. [Google Scholar] [CrossRef]
- Boachie, J.; Adaikalakoteswari, A.; Samavat, J.; Saravanan, P. Low Vitamin B12 and Lipid Metabolism: Evidence from Pre-Clinical and Clinical Studies. Nutrients 2020, 12, 1925. [Google Scholar] [CrossRef]
- Li, Z.; Gueant-Rodriguez, R.-M.; Quilliot, D.; Sirveaux, M.-A.; Meyre, D.; Gueant, J.-L.; Brunaud, L. Folate and vitamin B12 status is associated with insulin resistance and metabolic syndrome in morbid obesity. Clin. Nutr. 2018, 37, 1700–1706. [Google Scholar] [CrossRef]
- Mlodzik-Czyzewska, M.A.; Malinowska, A.M.; Chmurzynska, A. Low folate intake and serum levels are associated with higher body mass index and abdominal fat accumulation: A case control study. Nutr. J. 2020, 19, 53. [Google Scholar] [CrossRef]
- Wiebe, N.; Field, C.J.; Tonelli, M. A systematic review of the vitamin B12, folate and homocysteine triad across body mass index. Obes. Rev. 2018, 19, 1608–1618. [Google Scholar] [CrossRef]
- Ibrahim, G.R.; Shah, I.; Gariballa, S.; Yasin, J.; Barker, J.; Salman Ashraf, S. Significantly Elevated Levels of Plasma Nicotinamide, Pyridoxal, and Pyridoxamine Phosphate Levels in Obese Emirati Population: A Cross-Sectional Study. Molecules 2020, 25, 3932. [Google Scholar] [CrossRef]
- World Health Organization. Obesity and Overweight: World Health Organization; 2015. [Internet] [Cited 4 June, 2015]. Available online: https://www.who.int/en/news-room/fact-sheets/detail/obesity-and-overweight (accessed on 9 January 2023).
- World Health Organization. Obesity: Preventing and Managing the Global Epidemic; Report of a WHO consultation; World Health Organization Technical Report Series; World Health Organization: Geneva, Switzerland, 2000; p. 894. [Google Scholar]
- Paik, J.M.; Rosen, H.N.; Katz, J.N.; Rosner, B.A.; Rimm, E.B.; Gordon, C.M.; Curhan, G.C. BMI, Waist Circumference, and Risk of Incident Vertebral Fracture in Women. Obesity 2019, 27, 1513–1519. [Google Scholar] [CrossRef]
- Elffers, T.W.; de Mutsert, R.; Lamb, H.J.; de Roos, A.; Willems van Dijk, K.; Rosendaal, F.R.; Jukema, J.W.; Trompet, S. Body fat distribution, in particular visceral fat, is associated with cardiometabolic risk factors in obese women. PLoS ONE 2017, 12, e0185403. [Google Scholar] [CrossRef] [PubMed]
- Freuer, D.; Linseisen, J.; O’Mara, T.A.; Leitzmann, M.; Baurecht, H.; Baumeister, S.-E.; Meisinger, C. Body Fat Distribution and Risk of Breast, Endometrial, and Ovarian Cancer: A Two-Sample Mendelian Randomization Study. Cancers 2021, 13, 5053. [Google Scholar] [CrossRef] [PubMed]
- Koster, A.; Murphy, R.A.; Eiriksdottir, G.; Aspelund, T.; Sigurdsson, S.; Lang, T.F.; Gudnason, V.; Launer, L.J.; Harris, T.B. Fat distribution and mortality: The AGES-Reykjavik Study. Obesity 2015, 23, 893–897. [Google Scholar] [CrossRef]
- Tungtrongchitr, R.; Pongpaew, P.; Tongboonchoo, C.; Vudhivai, N.; Changbumrung, S.; Tungtrongchitr, A.; Phonrat, B.; Viroonudomphol, D.; Pooudong, S.; Schelp, F.P. Serum homocysteine, B12 and folic acid concentration in Thai overweight and obese subjects. Int. J. Vitam. Nutr. Res. 2003, 73, 8–14. [Google Scholar] [CrossRef] [PubMed]
- Baltaci, D.; Deler, M.H.; Turker, Y.; Ermis, F.; Iliev, D.; Velioglu, U. Evaluation of serum Vitamin B12 level and related nutritional status among apparently healthy obese female individuals. Niger. J. Clin. Pract. 2017, 20, 99–105. [Google Scholar] [CrossRef]
- Gunanti, I.R.; Marks, G.C.; Al-Mamun, A.; Long, K.Z. Low serum vitamin B-12 and folate concentrations and low thiamin and riboflavin intakes are inversely associated with greater adiposity in Mexican American children. J. Nutr. 2014, 144, 2027–2033. [Google Scholar] [CrossRef]
- Lin, Y.; Zhang, X.; He, R.; Xiao, J.; Wang, Y.; Peng, H.; Ye, S.; Su, Z. The Invention Relates to a Multivitamin Detection Method and Detection System in Dry Blood Spots. China Patent CN201711481553.3, 29 December 2017. [Google Scholar]
- Zeng, Q.; Li, N.; Pan, X.-F.; Chen, L.; Pan, A. Clinical management and treatment of obesity in China. Lancet Diabetes Endocrinol. 2021, 9, 393–405. [Google Scholar] [CrossRef]
- Bao, Y.; Lu, J.; Wang, C.; Atherosclerosis, M.J. Optimal waist circumference cutoffs for abdominal obesity in Chinese—ScienceDirect. Atherosclerosis 2008, 201, 378–384. [Google Scholar] [CrossRef] [PubMed]
- Feng, H.; Wang, X.; Zhao, T.; Mao, L.; Hui, Y.; Fan, X.; Lin, L.; Zhao, W.; Jiang, K.; Wang, B.; et al. Myopenic obesity determined by visceral fat area strongly predicts long-term mortality in cirrhosis. Clin. Nutr. 2021, 40, 1983–1989. [Google Scholar] [CrossRef]
- Li, L.; Wang, C.; Bao, Y.; Peng, L.; Gu, H.; Jia, W. Optimal body fat percentage cut-offs for obesity in Chinese adults. Clin. Exp. Pharmacol. Physiol. 2012, 39, 393–398. [Google Scholar] [CrossRef] [PubMed]
- World Health Organization. WHO Guidelines on Physical Activity and Sedentary Behaviour; World Health Organization: Geneva, Switzerland, 2020. [Google Scholar]
- Sechi, G.; Sechi, E.; Fois, C.; Kumar, N. Advances in clinical determinants and neurological manifestations of B vitamin deficiency in adults. Nutr. Rev. 2016, 74, 281–300. [Google Scholar] [CrossRef] [PubMed]
- Mahabir, S.; Ettinger, S.; Johnson, L.; Baer, D.J.; Clevidence, B.A.; Hartman, T.J.; Taylor, P.R. Measures of adiposity and body fat distribution in relation to serum folate levels in postmenopausal women in a feeding study. Eur. J. Clin. Nutr. 2008, 62, 644–650. [Google Scholar] [CrossRef] [PubMed]
- Lee, M.-R.; Jung, S.M. Serum Folate Related to Five Measurements of Obesity and High-Sensitivity C-Reactive Protein in Korean Adults. Nutrients 2022, 14, 3461. [Google Scholar] [CrossRef]
- Tardy, A.L.; Pouteau, E.; Marquez, D.; Yilmaz, C.; Scholey, A. Vitamins and Minerals for Energy, Fatigue and Cognition: A Narrative Review of the Biochemical and Clinical Evidence. Nutrients 2020, 12, 228. [Google Scholar] [CrossRef]
- Piquereau, J.; Boitard, S.E.; Ventura-Clapier, R.; Mericskay, M. Metabolic Therapy of Heart Failure: Is There a Future for B Vitamins? Int. J. Mol. Sci. 2021, 23, 30. [Google Scholar] [CrossRef]
- Ma, Y.; Zhang, Y.; Zhang, H.; Wang, H.; Elmhadi, M. Thiamine Alleviates High-Concentrate-Diet-Induced Oxidative Stress, Apoptosis, and Protects the Rumen Epithelial Barrier Function in Goats. Front. Vet. Sci. 2021, 8, 663698. [Google Scholar] [CrossRef]
- Mazur-Bialy, A.I.; Pocheć, E. Vitamin B2 deficiency enhances the pro-inflammatory activity of adipocyte, consequences for insulin resistance and metabolic syndrome development. Life Sci. 2017, 178, 9–16. [Google Scholar] [CrossRef]
- Ueland, P.M.; McCann, A.; Midttun, Ø.; Ulvik, A. Inflammation, vitamin B6 and related pathways. Mol. Aspects. Med. 2017, 53, 10–27. [Google Scholar] [CrossRef] [PubMed]
- Buettner, R.; Bettermann, I.; Hechtl, C.; Gäbele, E.; Hellerbrand, C.; Schölmerich, J.; Bollheimer, L.C. Dietary folic acid activates AMPK and improves insulin resistance and hepatic inflammation in dietary rodent models of the metabolic syndrome. Horm. Metab. Res. 2010, 42, 769–774. [Google Scholar] [CrossRef] [PubMed]
- Couto, M.R.; Gonçalves, P.; Catarino, T.; Araújo, J.R.; Correia-Branco, A.; Martel, F. The effect of oxidative stress upon the intestinal uptake of folic acid: In vitro studies with Caco-2 cells. Cell Biol. Toxicol. 2012, 28, 369–381. [Google Scholar] [CrossRef] [PubMed]
- Wang, Z.; Pini, M.; Yao, T.; Zhou, Z.; Sun, C.; Fantuzzi, G.; Song, Z. Homocysteine suppresses lipolysis in adipocytes by activating the AMPK pathway. Am. J. Physiol. Endocrinol. Metab. 2011, 301, E703–E712. [Google Scholar] [CrossRef]
- Chiang, E.-P.; Smith, D.E.; Selhub, J.; Dallal, G.; Wang, Y.-C.; Roubenoff, R. Inflammation causes tissue-specific depletion of vitamin B6. Arthritis Res. Ther. 2005, 7, R1254–R1262. [Google Scholar] [CrossRef]


| Method of Examination of Body Composition | |
|---|---|
| Method | Body composition |
| Physical examination | height, waist circumference, blood pressure |
| Bioelectrical impedance analysis | weight, body fat percentage, visceral fat area |
| Diagnosis of obesity | |
| Obesity indicators | Diagnosis |
| BMI | BMI ≥ 28 kg/m2 |
| Waist circumference (WC) | male: ≥ 90 cm; female: ≥ 85 cm |
| Visceral fat area (VFA) | VFA > 100 cm |
| Body fat percentage (BF%) | male: ≥ 25%; female: ≥ 35% |
| Variables | |
|---|---|
| Age, years, mean (SD) | 60.77 (6.33) |
| Female (%) | 831 (93.69) |
| Marital status, n (%) | |
| Married | 781 (88.05) |
| Other a | 106 (11.95) |
| Educational level, n (%) | |
| Primary school and below | 77 (8.68) |
| Middle school and high school | 697 (78.58) |
| College or above | 113 (12.74) |
| Annual household income per capita, n (%) | |
| <20,000 CNY | 229 (25.82) |
| 20,000–40,000 CNY | 421 (47.46) |
| >40,000 CNY | 237 (26.72) |
| Smoking, n (%) | |
| Never or former smoker | 854 (96.28) |
| Current smoker | 33 (3.72) |
| Alcohol intake, n (%) | |
| Never or former drinker | 740 (83.43) |
| Current drinker | 147 (16.57) |
| Meeting physical activity recommendation, n (%) | 727 (81.96) |
| Chronic diseases, n (%) | 495 (55.81) |
| Retired, n (%) | 721 (81.29) |
| General obesity b, n (%) | 76 (8.57) |
| Central obesity c, n (%) | 299 (33.71) |
| Obesity (VFA) d, n (%) | 465 (52.42) |
| Obesity (BF%) e, n (%) | 431 (48.59) |
| General Obesity a | Central Obesity b | Obesity (VFA) c | Obesity (BF%) d | |||||
|---|---|---|---|---|---|---|---|---|
| No | Yes | No | Yes | No | Yes | No | Yes | |
| VB1 (ng/mL) | 3.2 (2.6, 4.4) | 3.0 (2.5, 4.23) | 3.4 (2.6, 4.5) | 2.9 (2.5, 4.2) * | 3.6 (2.7, 4.5) | 3 (2.5, 4.3) * | 3.6 (2.7, 4.5) | 2.9 (2.5, 4.2) * |
| VB2 (ng/mL) | 4.7 (3.0, 7.2) | 3.8 (2.7, 5.7) * | 4.7 (3.1, 7.4) | 4.1 (2.8, 6.5) * | 4.7 (3.1, 7.6) | 4.5 (2.9, 6.9) | 4.7 (3.1, 7.8) | 4.3 (2.9, 6.8) * |
| VB6 (ng/mL) | 12.3 (8.9, 17.4) | 13.0 (10.1, 18.6) | 12.3 (9.0, 17.9) | 12.7 (9.0, 17.3) | 12.5 (9.6, 18.6) | 12.2 (8.7, 17.0) | 12.3 (9.0, 17.9) | 12.7 (9.0, 17.3) |
| VB9 (ng/mL) | 4.3 (2.6, 6.6) | 4.3 (2.9, 7.2) | 4.3 (2.7, 6.6) | 4.2 (2.5, 6.6) | 4.4 (2.8, 6.8) | 4.1 (2.4, 6.2) * | 4.4 (2.8, 6.7) | 4.1 (2.4, 6.3) * |
| VB1 | |||||
|---|---|---|---|---|---|
| Quartile 1 (<2.60 ng/mL) | Quartile 2 (~3.16 ng/mL) | Quartile 3 (~4.38 ng/mL) | Quartile 4 (>4.38 ng/mL) | p for Trend | |
| General obesity (BMI) | |||||
| Model 1 a | 1 (ref) | 0.99 (0.53, 1.88) | 0.84 (0.44, 1.62) | 0.74 (0.38, 1.46) | 0.328 |
| Model 2 b | 1 (ref) | 0.99 (0.52, 1.90) | 0.82 (0.42, 1.61) | 0.71 (0.35, 1.45) | 0.298 |
| Central obesity (WC) | |||||
| Model 1 a | 1 (ref) | 0.89 (0.61, 1.30) | 0.70 (0.47, 1.03) | 0.46 (0.30, 0.69) | <0.001 |
| Model 2 b | 1 (ref) | 0.89 (0.59, 1.33) | 0.71 (0.47, 1.07) | 0.47 (0.30, 0.73) | <0.001 |
| Obesity (VFA) | |||||
| Model 1 a | 1 (ref) | 0.75 (0.51, 1.09) | 0.57 (0.39, 0.83) | 0.53 (0.36, 0.78) | <0.001 |
| Model 2 b | 1 (ref) | 0.68 (0.46, 1.01) | 0.58 (0.39, 0.86) | 0.52 (0.35, 0.77) | 0.001 |
| Obesity (BF%) | |||||
| Model 1 a | 1 (ref) | 0.67 (0.46, 0.98) | 0.53 (0.37, 0.78) | 0.43 (0.29, 0.62) | <0.001 |
| Model 2 b | 1 (ref) | 0.66 (0.44, 0.98) | 0.55 (0.37, 0.82) | 0.46 (0.30, 0.69) | <0.001 |
| VB2 | |||||
|---|---|---|---|---|---|
| Quartile 1 (<2.98 ng/mL) | Quartile 2 (~4.58 ng/mL) | Quartile 3 (~7.18 ng/mL) | Quartile 4 (>7.18 ng/mL) | p for Trend | |
| General obesity (BMI) | |||||
| Model 1 a | 1 (ref) | 0.95 (0.52, 1.74) | 0.55 (0.28, 1.10) | 0.60 (0.30, 1.17) | 0.053 |
| Model 2 b | 1 (ref) | 0.97 (0.52, 1.80) | 0.53 (0.26, 1.08) | 0.53 (0.26, 1.06) | 0.027 |
| Central obesity (WC) | |||||
| Model 1 a | 1 (ref) | 0.82 (0.56, 1.20) | 0.70 (0.47, 1.03) | 0.65 (0.44, 0.97) | 0.022 |
| Model 2 b | 1 (ref) | 0.88 (0.58, 1.32) | 0.75 (0.50, 1.14) | 0.62 (0.40, 0.94) | 0.019 |
| Obesity (VFA) | |||||
| Model 1 a | 1 (ref) | 0.94 (0.65, 1.36) | 0.94 (0.65, 1.36) | 0.78 (0.54, 1.14) | 0.223 |
| Model 2 b | 1 (ref) | 0.94 (0.64, 1.39) | 0.99 (0.67, 1.46) | 0.74 (0.50, 1.10) | 0.180 |
| Obesity (BF%) | |||||
| Model 1 a | 1 (ref) | 0.64 (0.44, 0.93) | 0.80 (0.55, 1.16) | 0.63 (0.43, 0.92) | 0.053 |
| Model 2 b | 1 (ref) | 0.65 (0.44, 0.97) | 0.88 (0.60, 1.31) | 0.62 (0.41, 0.92) | 0.078 |
| VB6 | |||||
|---|---|---|---|---|---|
| Quartile 1 (<8.99 ng/mL) | Quartile 2 (~12.33 ng/mL) | Quartile 3 (~17.45 ng/mL) | Quartile 4 (>17.45 ng/mL) | p for Trend | |
| General obesity (BMI) | |||||
| Model 1 a | 1 (ref) | 1.14 (0.56, 2.35) | 1.50 (0.76, 2.98) | 1.51 (0.76, 3.00) | 0.171 |
| Model 2 b | 1 (ref) | 1.14 (0.55, 2.36) | 1.47 (0.73, 2.97) | 1.38 (0.68, 2.81) | 0.292 |
| Central obesity (WC) | |||||
| Model 1 a | 1 (ref) | 0.98 (0.66, 1.46) | 1.28 (0.86, 1.88) | 0.97 (0.65, 1.45) | 0.767 |
| Model 2 b | 1 (ref) | 1.00 (0.66, 1.53) | 1.33 (0.88, 2.02) | 0.85 (0.56, 1.31) | 0.772 |
| Obesity (VFA) | |||||
| Model 1 a | 1 (ref) | 0.82 (0.56, 1.19) | 0.98 (0.67, 1.43) | 0.69 (0.47, 1.00) | 0.121 |
| Model 2 b | 1 (ref) | 0.81 (0.55, 1.20) | 0.99 (0.67, 1.47) | 0.64 (0.43, 0.95) | 0.071 |
| Obesity (BF%) | |||||
| Model 1 a | 1 (ref) | 1.02 (0.70, 1.48) | 0.97 (0.67, 1.40) | 0.73 (0.50, 1.06) | 0.096 |
| Model 2 b | 1 (ref) | 1.05 (0.71, 1.55) | 0.98 (0.66, 1.46) | 0.64 (0.43, 0.96) | 0.034 |
| VB9 | |||||
|---|---|---|---|---|---|
| Quartile 1 (<2.59 ng/mL) | Quartile 2 (~4.27 ng/mL) | Quartile 3 (~6.59 ng/mL) | Quartile 4 (>6.59 ng/mL) | p for Trend | |
| General obesity (BMI) | |||||
| Model 1 a | 1 (ref) | 1.12 (0.57, 2.17) | 0.94 (0.47, 1.87) | 1.18 (0.61, 2.28) | 0.758 |
| Model 2 b | 1 (ref) | 1.11 (0.56, 2.18) | 0.93 (0.46, 1.89) | 1.16 (0.59, 2.27) | 0.794 |
| Central obesity (WC) | |||||
| Model 1 a | 1 (ref) | 0.88 (0.60, 1.30) | 0.86 (0.58, 1.28) | 0.92 (0.62, 1.36) | 0.656 |
| Model 2 b | 1 (ref) | 0.81 (0.53, 1.22) | 0.84 (0.55, 1.27) | 0.84 (0.56, 1.27) | 0.464 |
| Obesity (VFA) | |||||
| Model 1 a | 1 (ref) | 0.74 (0.51, 1.08) | 0.73 (0.50, 1.06) | 0.66 (0.46, 0.97) | 0.039 |
| Model 2 b | 1 (ref) | 0.67 (0.45, 0.99) | 0.71 (0.48, 1.05) | 0.61 (0.41, 0.91) | 0.027 |
| Obesity (BF%) | |||||
| Model 1 a | 1 (ref) | 0.78 (0.54, 1.14) | 0.77 (0.53, 1.12) | 0.72 (0.49, 1.04) | 0.090 |
| Model 2 b | 1 (ref) | 0.76 (0.51, 1.12) | 0.76 (0.51, 1.13) | 0.67 (0.45, 0.99) | 0.057 |
Disclaimer/Publisher’s Note: The statements, opinions and data contained in all publications are solely those of the individual author(s) and contributor(s) and not of MDPI and/or the editor(s). MDPI and/or the editor(s) disclaim responsibility for any injury to people or property resulting from any ideas, methods, instructions or products referred to in the content. |
© 2023 by the authors. Licensee MDPI, Basel, Switzerland. This article is an open access article distributed under the terms and conditions of the Creative Commons Attribution (CC BY) license (https://creativecommons.org/licenses/by/4.0/).
Share and Cite
Fu, Y.; Zhu, Z.; Huang, Z.; He, R.; Zhang, Y.; Li, Y.; Tan, W.; Rong, S. Association between Vitamin B and Obesity in Middle-Aged and Older Chinese Adults. Nutrients 2023, 15, 483. https://doi.org/10.3390/nu15030483
Fu Y, Zhu Z, Huang Z, He R, Zhang Y, Li Y, Tan W, Rong S. Association between Vitamin B and Obesity in Middle-Aged and Older Chinese Adults. Nutrients. 2023; 15(3):483. https://doi.org/10.3390/nu15030483
Chicago/Turabian StyleFu, Yu, Zhanyong Zhu, Zhaolan Huang, Ruikun He, Ying Zhang, Yuanyuan Li, Wei Tan, and Shuang Rong. 2023. "Association between Vitamin B and Obesity in Middle-Aged and Older Chinese Adults" Nutrients 15, no. 3: 483. https://doi.org/10.3390/nu15030483
APA StyleFu, Y., Zhu, Z., Huang, Z., He, R., Zhang, Y., Li, Y., Tan, W., & Rong, S. (2023). Association between Vitamin B and Obesity in Middle-Aged and Older Chinese Adults. Nutrients, 15(3), 483. https://doi.org/10.3390/nu15030483