

Time-Restricted Fasting Improves Liver Steatosis in Non-Alcoholic Fatty Liver Disease—A Single Blinded Crossover Trial

 ,
,  , , ,
, , ,  and
and
Abstract
:1. Introduction
2. Materials and Methods
2.1. Study Design
2.2. Randomization and Masking
2.3. Primary Outcomes
2.4. Secondary Endpoints
2.4.1. Anthropometry
2.4.2. Blood Pressure
2.4.3. Biochemical Assessments
2.4.4. Dietary and Appetite Monitoring
2.4.5. Global Physical Activity Questionnaire (GPAQ)
2.4.6. Statistical Analysis
3. Results
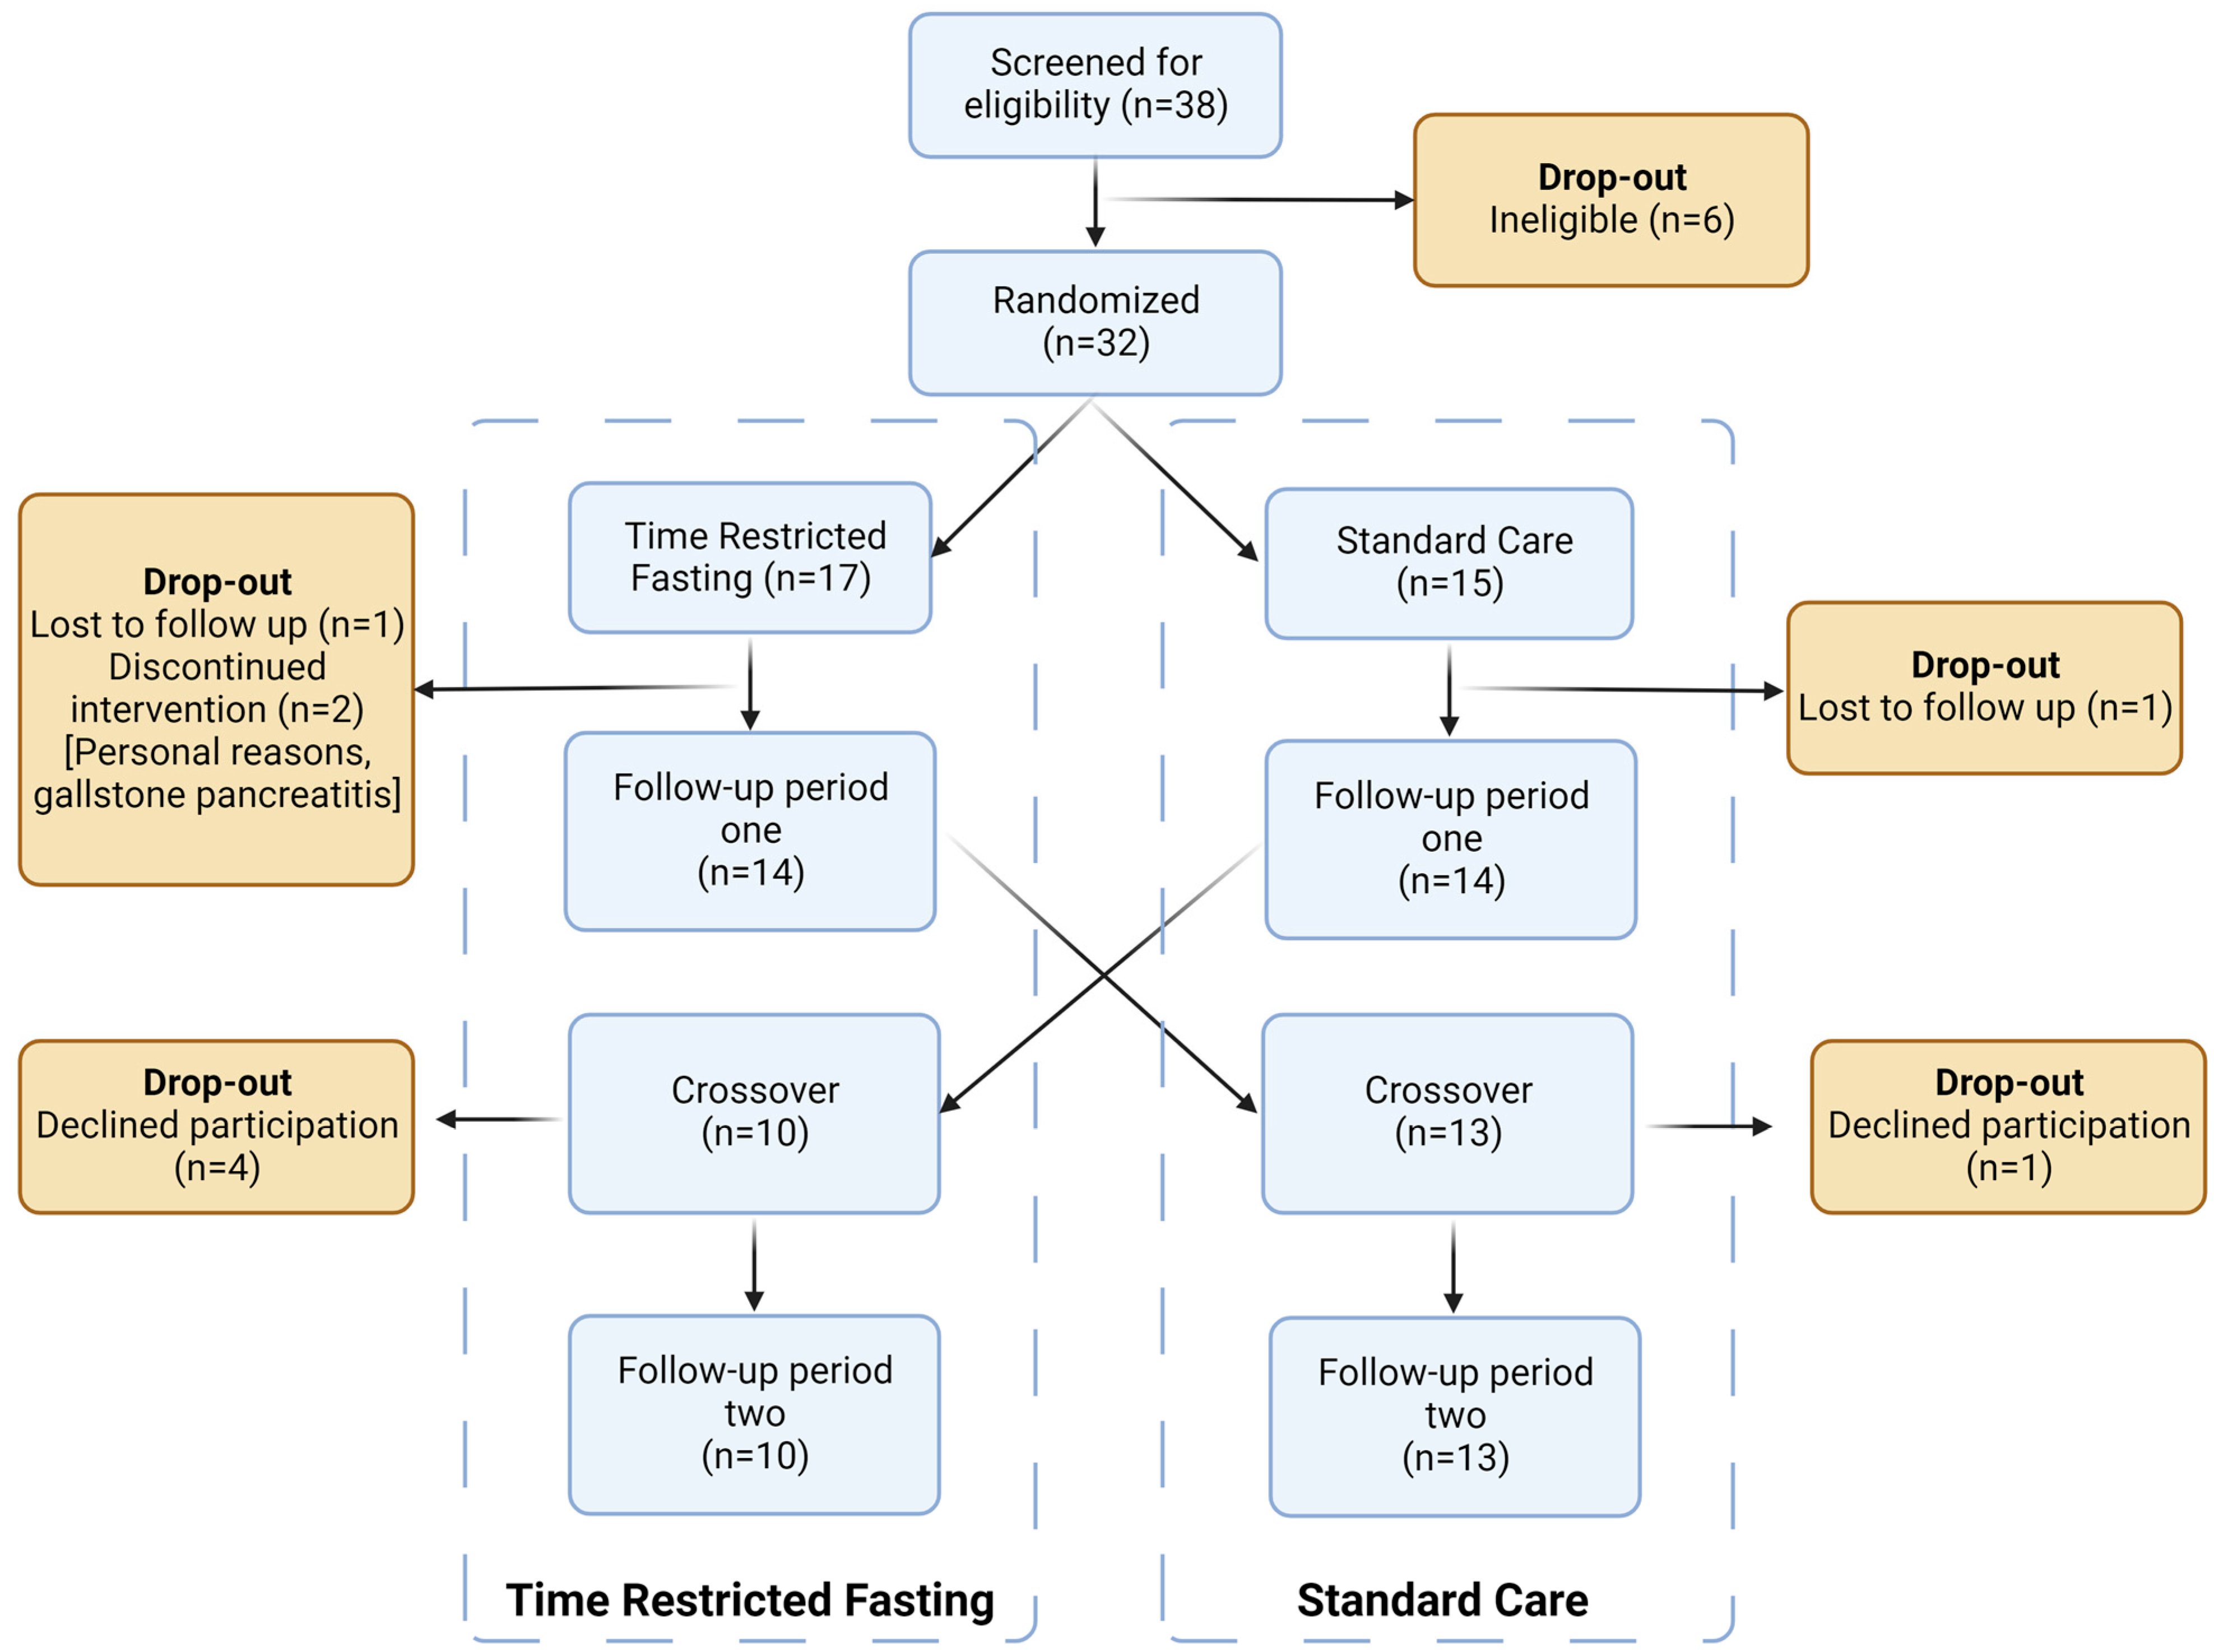
3.1. Patient Flow
3.2. Baseline Characteristics
3.3. Primary Outcomes
3.3.1. Transient Elastography
3.3.2. Visceral Fat
3.3.3. Secondary Outcomes
Hepatic Measures
Anthropometry, Lipid Profiles, and Blood Pressure
Metabolic and Inflammatory Biomarkers
Diet, Hunger, and Activity
4. Discussion
5. Conclusions
Supplementary Materials
Author Contributions
Funding
Institutional Review Board Statement
Informed Consent Statement
Data Availability Statement
Conflicts of Interest
References
- Le, M.H.; Yeo, Y.H.; Li, X.; Li, J.; Zou, B.; Wu, Y.; Ye, Q.; Huang, D.Q.; Zhao, C.; Zhang, J.; et al. 2019 Global NAFLD Prevalence: A Systematic Review and Meta-analysis. Clin. Gastroenterol. Hepatol. 2022, 20, 2809–2817. [Google Scholar] [CrossRef]
- Yki-Järvinen, H. Non-alcoholic fatty liver disease as a cause and a consequence of metabolic syndrome. Lancet. Diabetes Endocrinol. 2014, 2, 901–910. [Google Scholar] [CrossRef]
- Alberti, K.; Eckel, R.H.; Grundy, S.M.; Zimmet, P.Z.; Cleeman, J.I.; Donato, K.A.; Fruchart, J.-C.; James, W.P.T.; Loria, C.M.; Smith, S.C., Jr. Harmonizing the metabolic syndrome: A joint interim statement of the international diabetes federation task force on epidemiology and prevention; national heart, lung, and blood institute; American heart association; world heart federation; international atherosclerosis society; and international association for the study of obesity. Circulation 2009, 120, 1640–1645. [Google Scholar]
- Adams, L.A.; Harmsen, S.; St Sauver, J.L.; Charatcharoenwitthaya, P.; Enders, F.B.; Therneau, T.; Angulo, P. Nonalcoholic fatty liver disease increases risk of death among patients with diabetes: A community-based cohort study. Am. J. Gastroenterol. 2010, 105, 1567–1573. [Google Scholar] [CrossRef]
- Bhatia, L.S.; Curzen, N.P.; Calder, P.C.; Byrne, C.D. Non-alcoholic fatty liver disease: A new and important cardiovascular risk factor? Eur. Heart J. 2012, 33, 1190–1200. [Google Scholar] [CrossRef]
- Farrell, G.C. The liver and the waistline: Fifty years of growth. J. Gastroenterol. Hepatol. 2009, 24 (Suppl. 3), S105–S118. [Google Scholar] [CrossRef]
- Gosal, H.; Kaur, H.; Chakwop Ngassa, H.; Elmenawi, K.A.; Anil, V.; Mohammed, L. The Significance of the Mediterranean Diet in the Management of Non-Alcoholic Fatty Liver Disease: A Systematic Review. Cureus 2021, 13, e15618. [Google Scholar] [CrossRef]
- Drenick, E.J.; Simmons, F.; Murphy, J.F. Effect on hepatic morphology of treatment of obesity by fasting, reducing diets and small-bowel bypass. N. Engl. J. Med. 1970, 282, 829–834. [Google Scholar] [CrossRef]
- Varady, K.A.; Hellerstein, M.K. Alternate-day fasting and chronic disease prevention: A review of human and animal trials. Am. J. Clin. Nutr. 2007, 86, 7–13. [Google Scholar] [CrossRef]
- Del Corral, P.; Chandler-Laney, P.C.; Casazza, K.; Gower, B.A.; Hunter, G.R. Effect of dietary adherence with or without exercise on weight loss: A mechanistic approach to a global problem. J. Clin. Endocrinol. Metab. 2009, 94, 1602–1607. [Google Scholar] [CrossRef]
- Mattson, M.P. Energy intake, meal frequency, and health: A neurobiological perspective. Annu. Rev. Nutr. 2005, 25, 237–260. [Google Scholar] [CrossRef]
- Liu, D.; Huang, Y.; Huang, C.; Yang, S.; Wei, X.; Zhang, P.; Guo, D.; Lin, J.; Xu, B.; Li, C.; et al. Calorie Restriction with or without Time-Restricted Eating in Weight Loss. N. Engl. J. Med. 2022, 386, 1495–1504. [Google Scholar] [CrossRef]
- Ribeiro, R.; Sanches, J. Fatty liver characterization and classification by ultrasound. In Proceedings of the 4th Iberian Conference, Pattern Recognition and Image Analysis, IbPRIA 2009, Póvoa de Varzim, Portugal, 10–12 June 2009; Springer: Berlin/Heidelberg, Germany, 2009; pp. 354–361. [Google Scholar]
- Yoshizumi, T.; Nakamura, T.; Yamane, M.; Waliul Islam, A.H.M.; Menju, M.; Yamasaki, K.; Arai, T.; Kotani, K.; Funahashi, T.; Yamashita, S. Abdominal fat: Standardized technique for measurement at CT. Radiology 1999, 211, 283–286. [Google Scholar] [CrossRef]
- Flint, A.; Raben, A.; Blundell, J.; Astrup, A. Reproducibility, power and validity of visual analogue scales in assessment of appetite sensations in single test meal studies. Int. J. Obes. 2000, 24, 38–48. [Google Scholar] [CrossRef]
- Myers, R.P.; Pollett, A.; Kirsch, R.; Pomier-Layrargues, G.; Beaton, M.; Levstik, M.; Duarte-Rojo, A.; Wong, D.; Crotty, P.; Elkashab, M.J. Controlled Attenuation Parameter (CAP): A noninvasive method for the detection of hepatic steatosis based on transient elastography. Liver Int. 2012, 32, 902–910. [Google Scholar] [CrossRef]
- Li, T.; Yu, T.; Hawkins, B.S.; Dickersin, K. Design, Analysis, and Reporting of Crossover Trials for Inclusion in a Meta-Analysis. PLoS ONE 2015, 10, e0133023. [Google Scholar] [CrossRef]
- de Lédinghen, V.; Vergniol, J.; Foucher, J.; Merrouche, W.; le Bail, B.J. Non-invasive diagnosis of liver steatosis using controlled attenuation parameter (CAP) and transient elastography. Liver Int. 2012, 32, 911–918. [Google Scholar] [CrossRef]
- Karlas, T.; Petroff, D.; Sasso, M.; Fan, J.G.; Mi, Y.Q.; de Lédinghen, V.; Kumar, M.; Lupsor-Platon, M.; Han, K.H.; Cardoso, A.C.; et al. Individual patient data meta-analysis of controlled attenuation parameter (CAP) technology for assessing steatosis. J. Hepatol. 2017, 66, 1022–1030. [Google Scholar] [CrossRef]
- Jamshed, H.; Steger, F.L.; Bryan, D.R.; Richman, J.S.; Warriner, A.H.; Hanick, C.J.; Martin, C.K.; Salvy, S.J.; Peterson, C.M. Effectiveness of Early Time-Restricted Eating for Weight Loss, Fat Loss, and Cardiometabolic Health in Adults With Obesity: A Randomized Clinical Trial. JAMA Intern. Med. 2022, 182, 953–962. [Google Scholar] [CrossRef]
- Younossi, Z.M.; Stepanova, M.; Rafiq, N.; Makhlouf, H.; Younoszai, Z.; Agrawal, R.; Goodman, Z. Pathologic criteria for nonalcoholic steatohepatitis: Interprotocol agreement and ability to predict liver-related mortality. Hepatology 2011, 53, 1874–1882. [Google Scholar] [CrossRef]
- Yoneda, M.; Mawatari, H.; Fujita, K.; Endo, H.; Iida, H.; Nozaki, Y.; Yonemitsu, K.; Higurashi, T.; Takahashi, H.; Kobayashi, N.; et al. Noninvasive assessment of liver fibrosis by measurement of stiffness in patients with nonalcoholic fatty liver disease (NAFLD). Dig. Liver Dis. 2008, 40, 371–378. [Google Scholar] [CrossRef]
- Promrat, K.; Kleiner, D.E.; Niemeier, H.M.; Jackvony, E.; Kearns, M.; Wands, J.R.; Fava, J.L.; Wing, R.R. Randomized controlled trial testing the effects of weight loss on nonalcoholic steatohepatitis. Hepatology 2010, 51, 121–129. [Google Scholar] [CrossRef]
- van der Poorten, D.; Milner, K.L.; Hui, J.; Hodge, A.; Trenell, M.I.; Kench, J.G.; London, R.; Peduto, T.; Chisholm, D.J.; George, J. Visceral fat: A key mediator of steatohepatitis in metabolic liver disease. Hepatology 2008, 48, 449–457. [Google Scholar] [CrossRef]
- Kotronen, A.; Westerbacka, J.; Bergholm, R.; Pietiläinen, K.H.; Yki-Järvinen, H. Liver fat in the metabolic syndrome. J. Clin. Endocrinol. Metab. 2007, 92, 3490–3497. [Google Scholar] [CrossRef]
- Day, C.P.; James, O.F. Hepatic steatosis: Innocent bystander or guilty party? Hepatology 1998, 27, 1463–1466. [Google Scholar] [CrossRef]
- Koopman, K.E.; Caan, M.W.; Nederveen, A.J.; Pels, A.; Ackermans, M.T.; Fliers, E.; la Fleur, S.E.; Serlie, M.J. Hypercaloric diets with increased meal frequency, but not meal size, increase intrahepatic triglycerides: A randomized controlled trial. Hepatology 2014, 60, 545–553. [Google Scholar] [CrossRef]
- Polyzos, S.A.; Kountouras, J.; Zavos, C.; Tsiaousi, E. The role of adiponectin in the pathogenesis and treatment of non-alcoholic fatty liver disease. Diabetes Obes. Metab. 2010, 12, 365–383. [Google Scholar] [CrossRef]
- Pischon, T.; Girman, C.J.; Hotamisligil, G.S.; Rifai, N.; Hu, F.B.; Rimm, E.B. Plasma adiponectin levels and risk of myocardial infarction in men. JAMA 2004, 291, 1730–1737. [Google Scholar] [CrossRef]
- Hui, J.M.; Hodge, A.; Farrell, G.C.; Kench, J.G.; Kriketos, A.; George, J. Beyond insulin resistance in NASH: TNF-α or adiponectin? Hepatology 2004, 40, 46–54. [Google Scholar] [CrossRef]
- Polyzos, S.A.; Kountouras, J.; Mantzoros, C.S. Leptin in nonalcoholic fatty liver disease: A narrative review. Metabolism 2015, 64, 60–78. [Google Scholar] [CrossRef]
- Wing, R.; Sinha, M.; Considine, R.; Lang, W.; Caro, J.F. Relationship between weight loss maintenance and changes in serum leptin levels. Horm. Metab. Res. 1996, 28, 698–703. [Google Scholar] [CrossRef]
- Harsha, D.W.; Bray, G.A. Weight loss and blood pressure control (Pro). Hypertension 2008, 51, 1420–1425. [Google Scholar] [CrossRef]
- Stamler, J.; Rose, G.; Stamler, R.; Elliott, P.; Dyer, A.; Marmot, M. INTERSALT study findings. Public health and medical care implications. Hypertension 1989, 14, 570–577. [Google Scholar] [CrossRef]
- Schwenzer, N.F.; Springer, F.; Schraml, C.; Stefan, N.; Machann, J.; Schick, F. Non-invasive assessment and quantification of liver steatosis by ultrasound, computed tomography and magnetic resonance. J. Hepatol. 2009, 51, 433–445. [Google Scholar] [CrossRef]

| Time-Restricted Fasting (n = 17) Mean (SD) | Standard Care (n = 15) Mean (SD) | |
|---|---|---|
| Age (years) | 61.9 (8.7) | 54.7 (13.0) |
| Sex (M/F) [n] | 10/7 | 9/6 |
Ethnicity [n]
| ||
| 13 | 10 | |
| 2 | 3 | |
| 2 | 0 | |
| 0 | 2 | |
| Weight (kg) | 83.2 (14.4) | 82.7 (11.5) |
| Height (cm) | 167.4 (10.1) | 166.4 (8.7) |
| BMI (kg/m2) | 29.5 (3.0) | 29.9 (3.3) |
WC (cm)
| 101.8 (10.2) | 100.4 (8.0) |
| 105.5 (2.79) | 100.9 (2.68) | |
| 96.6 (3.90) | 99.7 (3.56) | |
| Metabolic syndrome † [n (%)] | 8 (47%) | 7 (47%) |
| CAP (dB/m) | 256.07 (59.96) | 256.23 (50.96) |
| Visceral Fat (cm2) | 17,836.45 (4270.24) | 16,115.91 (5565.39) |
| Baseline daily energy intake (kJ) | 7747 (829.34) | 7307 (1881.26) |
| Measure | Time-Restricted Fasting Mean Change (SD) | Standard Care Mean Change (SD) | Between-Intervention Difference | p Value |
|---|---|---|---|---|
| Weight (kg) | −1.72 (2.01) | 0.13 (2.13) | 1.85 | 0.005 |
| Waist Circumference (cm) | −2.52 (3.87) | 1.33 (3.39) | 3.85 | 0.001 |
| BMI (kg/m2) | −0.59 (0.67) | 0.04 (0.71) | 0.63 | 0.004 |
| Liver Stiffness (Kpa) | 0.02 (5.94) | 0.21 (2.38) | 0.19 | 0.559 |
| CAP (dB/m) | −9.96 (51.03) | 20.46 (49.15) | 30.42 | 0.038 |
| DBP (mmHg) | −4.00 (7.96) | −2.56 (9.53) | 1.44 | 0.492 |
| SBP (mmHg) | −4.67 (9.81) | −4.89 (16.54) | 0.31 | 0.972 |
| Heart rate (bpm) | 0.21 (8.23) | 2.56 (11.16) | 2.35 | 0.726 |
| ALT (ug/mL) | −10.00 (15.71) | −3.48 (20.86) | 6.52 | 0.094 |
| FPG (mmol/L) | 0.27 (3.02) | 0.48 (2.31) | 0.21 | 0.380 |
| Insulin (mU/L) | −0.52 (4.33) | 0.67 (5.14) | 1.19 | 0.459 |
| HOMA-IR | −0.17 (1.36) | 0.47 (1.21) | 0.64 | 0.090 |
| Total cholesterol (mmol/L) | 0.07 (0.80) | −0.11 (0.76) | 0.18 | 0.621 |
| Triglycerides (mmol/L) | −0.004 (0.43) | −0.18 (0.50) | 0.18 | 0.434 |
| LDL (mmol/L) | 0.19 (1.00) | 0.17 (1.25) | 0.02 | 0.396 |
| HDL (mmol/L) | 0.003 (0.19) | 0.01 (0.21) | 0.01 | 0.008 |
| Visceral fat (cm2) | 896.45 (2773.55) | 212.42 (4697.78) | 684.03 | 0.702 |
| Total tissue fat (%) | −0.82 (1.30) | −0.52 (1.75) | 0.3 | 0.278 |
| Total lean mass (g) | 325.21 (1351.09) | −354.29 (1094.92) | 679.5 | 0.510 |
| Adiponectin (ug/mL) | 3.58 (4.44) | 3.40 (3.91) | 0.18 | 0.622 |
| Energy intake (KJ) | 163.91 (1897.79) | 91.02 (1514.31) | 72.89 | 0.816 |
| Outcome | Baseline Mean (SD) | Follow-Up Mean (SD) | Change | p Value | |
|---|---|---|---|---|---|
| Weight (kg) | Time-Restricted Fasting | 80.61 (12.05) | 78.89 (11.72) | 1.72 | <0.001 |
| Standard Care | 81.27 (12.52) | 81.389 (12.85) | −0.12 | 0.761 | |
| BMI (kg/m2) | Time-Restricted Fasting | 29.09 (2.67) | 28.51 (2.98) | 0.58 | <0.001 |
| Standard Care | 28.88 (2.93) | 28.92 (3.00) | −0.04 | 0.767 | |
| WC (cm) | Time-Restricted Fasting | 101.25 (8.95) | 98.73 (8.25) | 2.52 | 0.004 |
| Standard Care | 99.94 (8.42) | 101.28 (9.58) | −1.34 | 0.037 | |
| Liver Stiffness (Kpa) | Time-Restricted Fasting | 7.63 (5.06) | 7.33 (4.60) | 0.3 | 0.135 |
| Standard Care | 6.67 (2.71) | 6.89 (3.91) | −0.22 | 0.655 | |
| CAP (dB/m) | Time-Restricted Fasting | 265.42 (55.12) | 255.46 (48.03) | 9.96 | 0.049 |
| Standard Care | 256.12 (51.29) | 272.56 (49.31) | −16.44 | 0.050 | |
| SBP (mmHg) | Time-Restricted Fasting | 134.50 (14.84) | 129.83 (12.18) | 4.67 | 0.029 |
| Standard Care | 132.37 (14.94) | 127.48 (15.26) | 4.89 | 0.137 | |
| DBP (mmHg) | Time-Restricted Fasting | 83.292(8.78) | 79.29 (7.43) | 4.00 | 0.022 |
| Standard Care | 82.111(10.83) | 79.56 (8.38) | 2.55 | 0.175 | |
| Heart Rate (bpm) | Time-Restricted Fasting | 67.29 (13.03) | 67.50 (14.40) | −0.21 | 0.90 |
| Standard Care | 66.41 (10.66) | 68.96 (11.44) | −2.55 | 0.245 | |
| ALT (µg/L) | Time-Restricted Fasting | 49.29 (25.85) | 39.29 (18.01) | 10.00 | 0.005 |
| Standard Care | 50.52 (29.73) | 47.04 (20.01) | 3.48 | 0.533 | |
| FPG (mmol/L) | Time-Restricted Fasting | 5.68 (1.36) | 5.70 (3.04) | −0.02 | 0.155 |
| Standard Care | 5.53 (1.80) | 6.11 (2.85) | −0.58 | 0.354 | |
| Insulin (mU/L) | Time-Restricted Fasting | 9.18 (8.20) | 8.23 (6.23) | 0.95 | 0.502 |
| Standard Care | 6.10 (5.13) | 6.80 (5.04) | −0.7 | 0.033 | |
| HOMA-IR | Time-Restricted Fasting | 6.37 (5.45) | 6.19 (7.11) | 0.18 | 0.910 |
| Standard Care | 6.91 (6.25) | 6.86 (7.26) | 0.05 | 0.042 | |
| Total cholesterol (mmol/L) | Time-Restricted Fasting | 5.14 (1.34) | 5.21 (1.28) | −0.07 | 0.670 |
| Standard Care | 5.27 (1.30) | 5.16 (1.38) | 0.11 | 0.457 | |
| Triglycerides (mmol/L) | Time-Restricted Fasting | 1.45 (0.62) | 1.44 (0.68) | 0.01 | 0.96 |
| Standard Care | 1.60 (0.73) | 1.42 (0.67) | 0.18 | 0.077 | |
| HDL (mmol/L) | Time-Restricted Fasting | 1.33 (0.34) | 1.35 (0.36) | −0.02 | 0.936 |
| Standard Care | 1.30 (0.25) | 1.32 (0.29) | −0.02 | 0.849 | |
| LDL (mmol/L) | Time-Restricted Fasting | 3.20 (1.02) | 3.23 (1.06) | −0.03 | 0.868 |
| Standard Care | 3.24 (0.96) | 3.22 (1.11) | 0.02 | 0.573 | |
| Visceral fat (cm2) | Time-Restricted Fasting | 16,925.26 (4217.92) | 15,646.89 (4635.85) | 1278.37 | 0.029 |
| Standard Care | 15,952.73 (5158.97) | 16,132.29 (5572.79) | −179.56 | 0.711 | |
| Total tissue fat (%) | Time-Restricted Fasting | 37.15 (7.55) | 36.33 (7.90) | 0.82 | 0.005 |
| Standard Care | 37.06 (7.46) | 36.11 (7.27) | 0.95 | 0.133 | |
| Total Lean muscle mass (g) | Time-Restricted Fasting | 48,783.50 (9928.91) | 48,143.21 (9496.70) | 640.29 | 0.018 |
| Standard Care | 49,034.19 (9052.07) | 50,120.77 (9257.96) | −1086.58 | 0.099 | |
| Adiponectin (ug/mL) | Time-Restricted Fasting | 16.70 (7.82) | 20.28 (8.83) | −3.58 | <0.001 |
| Standard Care | 17.37 (8.11) | 20.78 (9.12) | −3.41 | <0.001 | |
| Leptin (ng/mL) | Time-Restricted Fasting | 8.27 (4.04) | 7.35 (4.34) | 0.92 | 0.033 |
| Standard Care | 7.21 (3.42) | 5.79 (3.86) | 1.42 | <0.001 | |
| TNF-α (pg/mL) | Time-Restricted Fasting | 2.25 (1.32) | 1.82 (0.57) | 0.43 | 0.173 |
| Standard Care | 1.60 (1.02) | 2.04 (1.21) | −0.44 | 0.320 | |
| FCP (µg/mL) | Time-Restricted Fasting | 158.32 (195.31) | 223.32 (219.34) | −65 | 0.126 |
| Standard Care | 98.00 (154.69) | 138.50 (164.11) | −40.5 | 0.296 | |
| Energy intake (KJ) | Time-Restricted Fasting | 7932.54(1313.93) | 7768.63(2075.11) | 163.91 | 0.653 |
| Standard Care | 7728.65 (1974.61) | 8007.13 (1732.49) | −278.48 | 0.776 |
| Measure | Time-Restricted Fasting Mean Change (SD) | Standard Care Mean Change (SD) | Between-Intervention Difference | p Value |
|---|---|---|---|---|
| CAP (dB/m) | −26.00 (33.01) | 15.10 (27.76) | 41.1 | 0.035 |
| Liver Stiffness (Kpa) | 0.57 (9.21) | 0.10 (3.35) | 0.37 | 0.413 |
| ALT (ug/mL) | −13.40 (17.49) | −2.80 (11.49) | 10.6 | 0.212 |
| Group | Week 0 | Week 4 | Week 8 | Week 12 | p Value | |
|---|---|---|---|---|---|---|
| VAS score | ||||||
| Hunger over last 24 h | TRF | 4.4 (1.2) | 4.0 (1.4) | 3.7 (2.2) | 4.8 (1.8) | NS |
| SC | 4.1 (2.3) | 3.6 (1.7) | 4.2 (2.2) | 4.8 (2.0) | ||
| Satisfaction over last 24 h | TRF | 5.7 (1.8) | 5.6 (1.7) | 5.3 (1.7) | 5.5 (1.8) | NS |
| SC | 7.0 (2.0) | 6.7 (1.4) | 6.1 (2.5) | 6.3 (1.5) | ||
| Happiness with diet over last 24 h | TRF | 5.2 (1.3) | 6.5 (1.8) | 6.4 (1.9) | 6.5 (2.1) | NS |
| SC | 5.7 (2.0) | 6.2 (1.7) | 5.7 (2.2) | 6.0 (1.8) | ||
| GPAQ | ||||||
| Metabolic equivalent hours (kcal/kg) per week | TRF | 45.4 (44.6) | 53.5 (52.8) | 54.2 (66.9) | 66.5 (90.9) | NS |
| SC | 40.6 (53.3) | 52.4 (53.5) | 37.3 (37.3) | 45.1 (43.2) |
Disclaimer/Publisher’s Note: The statements, opinions and data contained in all publications are solely those of the individual author(s) and contributor(s) and not of MDPI and/or the editor(s). MDPI and/or the editor(s) disclaim responsibility for any injury to people or property resulting from any ideas, methods, instructions or products referred to in the content. |
© 2023 by the authors. Licensee MDPI, Basel, Switzerland. This article is an open access article distributed under the terms and conditions of the Creative Commons Attribution (CC BY) license (https://creativecommons.org/licenses/by/4.0/).
Share and Cite
Feehan, J.; Mack, A.; Tuck, C.; Tchongue, J.; Holt, D.Q.; Sievert, W.; Moore, G.T.; de Courten, B.; Hodge, A. Time-Restricted Fasting Improves Liver Steatosis in Non-Alcoholic Fatty Liver Disease—A Single Blinded Crossover Trial. Nutrients 2023, 15, 4870. https://doi.org/10.3390/nu15234870
Feehan J, Mack A, Tuck C, Tchongue J, Holt DQ, Sievert W, Moore GT, de Courten B, Hodge A. Time-Restricted Fasting Improves Liver Steatosis in Non-Alcoholic Fatty Liver Disease—A Single Blinded Crossover Trial. Nutrients. 2023; 15(23):4870. https://doi.org/10.3390/nu15234870
Chicago/Turabian StyleFeehan, Jack, Alexandra Mack, Caroline Tuck, Jorge Tchongue, Darcy Q. Holt, William Sievert, Gregory T. Moore, Barbora de Courten, and Alexander Hodge. 2023. "Time-Restricted Fasting Improves Liver Steatosis in Non-Alcoholic Fatty Liver Disease—A Single Blinded Crossover Trial" Nutrients 15, no. 23: 4870. https://doi.org/10.3390/nu15234870
APA StyleFeehan, J., Mack, A., Tuck, C., Tchongue, J., Holt, D. Q., Sievert, W., Moore, G. T., de Courten, B., & Hodge, A. (2023). Time-Restricted Fasting Improves Liver Steatosis in Non-Alcoholic Fatty Liver Disease—A Single Blinded Crossover Trial. Nutrients, 15(23), 4870. https://doi.org/10.3390/nu15234870