Abstract
The consumption of out-of-home meals is increasing. This study is aimed at assessing the effect of an intervention on healthy offerings and the management of food allergies and intolerances. Ten (control group) and eight restaurants (intervention group) were randomized in a 12-month parallel controlled trial. The outcomes were changes regarding adherence to the Mediterranean diet (AMed) and gluten management (SMAP) criteria, the traffic light rating category, nutrients, and gluten- and allergen-free content of dishes. After 12 months, and compared with baseline, there was an improvement of ≥25% in four items of the AMed criteria in the intervention group, whereas an increase in the offer of dairy desserts without added sugar, and a decrease in the first course offerings of vegetables and/or legumes were observed in the control group (p < 0.05). Also, after 12 months, there was an improvement of ≥50% in four SMAP criteria (p < 0.05) and in the mean average of all SMAP criteria (p = 0.021) compared with baseline in the intervention group, in which intra- and inter-group improvements for desserts in traffic light ratings, nutrients, and allergens were observed (p < 0.05). Therefore, the intervention showed beneficial effects, improving the quality of menus toward the Mediterranean diet pattern and gluten and food allergy/intolerance management.
1. Introduction
The consumption of out-of-home meals has increased in recent decades [1], with work and study commitments on weekdays and leisure and travel on weekends [2] being the main reasons. Out-of-home meals are linked to a negative impact on nutritional behavior [3,4]. On the one hand, eating out is associated with a higher consumption of energy, fats, and sodium and a lower consumption of fruits and vegetables [5]. These facts may increase exposure to overweight, obesity, and chronic diseases [6], raising morbidity and mortality risks [7]. On the other hand, eating away from home could be difficult for people with food allergies and intolerances. Food intolerance is a common feature affecting 15–20% of the population [8]. Around 2–37% of European adults have allergies to some food categories [9] and 1–19% to specific foods [10].
The implementation of healthier meal offerings in restaurants is a great opportunity to improve consumers’ dietary choices and promote healthy dietary habits. Additionally, in restaurants, changing to healthier offerings can increase customer satisfaction. In a cohort of restaurant consumers from ten countries worldwide, only 18% of them were satisfied with the healthy options available on menus [11]. Customers demand more vegetables, fresh ingredients, and light cooking from menus. In addition, customers are unsatisfied with the high price of food catered toward allergies/intolerances [11]. A total of 28% of fatal allergic reactions are linked to foods from restaurants or other establishments [12,13].
A systematic review of 25 studies on community-based restaurant interventions to promote healthy eating concluded that evidence is limited, and further studies with robust designs and standardized evaluation methods are needed [14]. Previous studies have shown that restaurants should improve the healthiness of their meals. Data from an observational study showed that US restaurant meals exceeded the American Heart Association’s (AHA) criteria concerning the median calories for total and saturated fats, cholesterol, and sodium. Overall, 22% of restaurant meals met zero to one of the AHA criteria, and only 8% met all seven of the AHA criteria [15]. A recent randomized cross-over trial with social norm messaging in retail store restaurants to reduce meat consumption demonstrated that the intervention had no effect [16].
In this scenario, a health intervention in restaurants is essential for improving both the food environment and individual eating behavior. A systematic review and meta-analysis on interventions promoting healthy meals in full-service restaurants and canteens was recently carried out [17]. The results showed the effectiveness of the interventions in school settings. However, the lack of randomized controlled studies in workplace and community settings, such as full-service restaurants, limited the evidence concerning the adult population and the evaluation of intervention effectiveness [17]. Due to this, the aim of the present study was to assess the effect of a multicomponent intervention in the context of a randomized controlled trial, applied to restaurant staff to promote a healthy diet and better management of food allergies and intolerances.
2. Materials and Methods
2.1. Study Design
A parallel, randomized controlled trial (The Healthy Meal Trial) was performed in restaurants in Tarragona (Spain). The trial was aimed at improving the nutritional quality of the menus offered and the availability of allergen-free dishes or those catering to specific food needs (i.e., vegan or vegetarian). The intervention period lasted 12 months. This study was part of a European-funded project called PECT-TurisTIC en Familia (The “Healthy Meals” operation) led by the Rovira and Virgili University (Tarragona, Spain). This study was conducted in accordance with the Declaration of Helsinki [18], and the protocol was approved by the Ethics Committee of the Institut d’Investigació Sanitaria Pere i Virgili (ref CEIM: 179/2018). The trial is registered in the international registry of clinical trials (ClinicalTrials.gov: https://clinicaltrials.gov/ct2/about-site/background, accessed on 21 February 2019) with the project identification code NCT03826576. All restaurant owners gave their informed consent for participation in this study. This study was conducted in accordance with the Consolidated Standards of Reporting Trials 2010 extension for randomized trials [19].
2.2. Study Population
From September 2019 to March 2021, a total of 61 restaurants offering traditional and Mediterranean cuisine were recruited, and 44 of them were randomized as previously described [20] (Figure 1). Inclusion criteria were to (1) be a full-service restaurant; (2) have a minimum of 5 tables; (3) offer Mediterranean/traditional/local cuisine; (4) have technical details of the recipe for each dish, including ingredients and cooking details; (5) share food product information with the research team; (6) sign (the owner) an informed consent form for participation in this study; (7) have (the owner/s) a minimum of one year of experience; (8) plan to continue working during the full year of the intervention; and (9) not have a Mediterranean diet (AMed) certification. Exclusion criteria were ethnic or fast-food restaurants and failure to fulfill the above-described inclusion criteria.
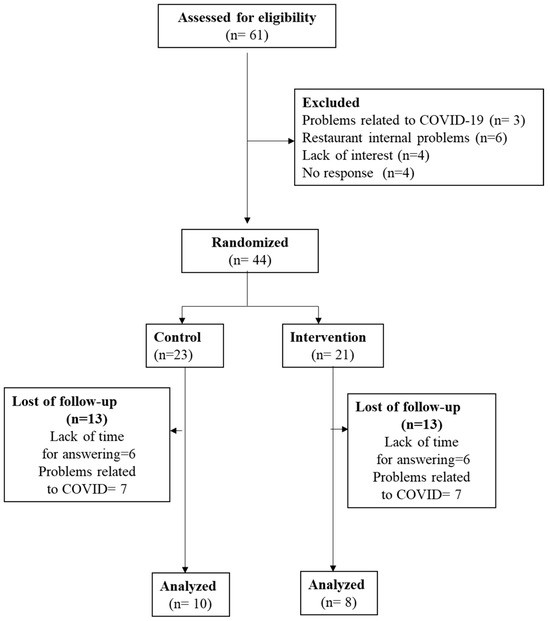
Figure 1.
Flowchart of this study.
2.3. Intervention
The multicomponent intervention included several actions:
- A virtual/face-to-face training for the kitchen and room staff on Mediterranean diet menu offers and food allergen management.
- A web-app to help chefs to improve their recipes concerning nutrition and allergen-free issues. Chefs can introduce each recipe of the menu in the app and be aware of the principal macronutrients (using a traffic light system) and the food allergens involved.
- Personalized recommendations for each restaurant based on key points for improving the Mediterranean diet profile and food allergen management.
- A marketing campaign about weak points to be improved in the restaurants concerning the two previously referred items.
2.4. Outcomes and Data Collection
The outcomes were directed at assessing changes from before to after the intervention.
2.4.1. Adherence to the Mediterranean Diet Based on the AMed Criteria, Both Mandatory and Optional
AMed criteria are a list of items created by the Public Health Agency of Catalonia, Spain. AMed criteria are the basis for a certification to be provided to restaurants and food service establishments in order to guarantee the offer of a Mediterranean diet-based menu [21]. AMed items comprise nine mandatory and eight optional criteria. The mandatory criteria are (1) olive oil for dressings and olive oil or high-oleic sunflower for cooking; (2) 25% of the first-course offerings as vegetables and/or legumes; (3) presence of whole-grain products; (4) 50% of the second-course offerings based on fish, seafood, or lean meat; (5) 50% of the dessert offerings based on fresh fruit (whole or prepared); (6) offering dairy desserts without added sugar; (7) offering free nonpackaged drinking water; (8) wine, beer, and cava offered as glasses or individual units; and (9) culinary preparations that do not require the addition of large amounts of fat and culinary techniques with some or little fat.
2.4.2. The Number of Gluten Management (SMAP) Criteria Fulfilled by Restaurants
The Malabsorption Syndrome Parents Association (SMAP) of the Catalan Celiac Association (Spain) has developed an SMAP certification [22]. SMAP consists of 18 recommendations for assessing gluten-free food management. The aim of the certification is to implement appropriate systems for cooking without gluten cross-contamination in restaurants to provide gluten-free dishes.
2.4.3. The Number of Dishes Included in Each Traffic Light Category
From the nutritional information, a traffic light rating system for every dish was obtained, in agreement with the cut-offs provided by the UK Food Standards Agency [23]. The energy, carbohydrates, sugar, protein, total fat, saturated fat, and sodium, based on a single-plate portion, were classified as (a) green: the dish contains <7.5% of the nutrient amounts classified as unhealthy by the European Guideline Daily Amount (GDA) [24]; (b) orange: the dish contains between 7.5 and 20% of them; and (c) red: the dish contains >20% of them, for a healthy adult diet of 2000 Kcal. The fiber content was classified inversely so that a red label corresponded to a low fiber content according to the recommendations.
2.4.4. The Nutrient Content of the Restaurant’s Dishes
The offered dishes were classified as starters, main dishes, and desserts. The information collected for each dish was energy (Kcal) and grams of protein, total carbohydrates, sugar, total and saturated fat, fiber, and sodium. The food composition database was extracted from the nutritional information of commercial food products and data from different public databases [25,26,27,28,29]. Nutritional information for each dish was based on the recipes including the cooking process, ingredients used, and their quantities.
2.4.5. The Gluten and Allergen-Free Content of the Dishes Offered
The 14 most common food allergens that should be declared, according to the European Regulation 1169/2011 [23], were identified considering the ingredients used and the cooking process of the dishes: (1) cereals containing gluten, (2) milk, (3) eggs, (4) fish, (5) crustaceans, (6) tree nuts, (7) peanuts, (8) soya, (9) celery, (10) mustard, (11) sesame, (12) sulfites, (13) lupin, and (14) mollusks. The variable allergen-free was defined for dishes in which any of these allergens were present.
2.4.6. The Offer of Vegetarian and Vegan Dishes
The typification of a vegetarian or vegan dish was made according to the ingredients used. The plant-based meals not containing animal products were labeled as vegetarian and the meals not containing animal products or their derivates were identified as vegan [30].
2.5. Data Analyses
Data are presented as mean ± standard deviation (SD) for continuous variables and as a percentage (number) for categorical variables. Differences in baseline characteristics between groups were assessed using Mann–Whitney or X2 tests. Wilcoxon and Mann–Whitney tests were used for intra- and inter-group comparisons, respectively, for categorical variables, and the X2 test was used for multiple comparisons. Student’s t-test was used for intra- and inter-group comparisons between related and unrelated samples, respectively, for continuous variables. Statistical significance was defined as a p-value ≤ 0.050 for a 2-sided test. Analyses were performed using SPSS for Windows, version 26 (IBM corp., Armonk, NY, USA). Before data collection, hypotheses and the analytic plan were specified, and any data-driven analyses were clearly identified and discussed appropriately.
3. Results
Of the 44 randomized restaurants, only 18 remained at the end of this study, 10 in the control group and 8 in the intervention group (Figure 1). Reasons for the loss of follow-up were related to the COVID-19 situation; specifically, seven control restaurants and six intervention restaurants closed due to the secondary effects of COVID-19, which included a lack of economic benefit. Another key reason was the availability of the restaurateur, who was too busy to spend time answering questionnaires.
3.1. General Characteristics
Table 1 shows the characteristics of the restaurants involved in this study. No differences between groups were observed in the type of restaurant, time of activity, frequency of change in the menu, and the type of cuisine or administration. The mean number of recruited employees, however, was higher in the control group when compared with the intervention group (p = 0.016).

Table 1.
General characteristics of the restaurants.
3.2. Adherence to the AMed Criteria
Table 2 shows the adherence to the AMed criteria in control and intervention groups at the beginning and end of this study. Concerning mandatory criteria, in the control group, there was a decrease in the “25% of the first course offerings as vegetables and/or legumes” (from 50% to 10%) and an increase in “the offer of dairy desserts without added sugar” (from 20% to 60%) from the beginning to the end of this study (p < 0.05). In the intervention group, when considering both mandatory and optional criteria, increases of 37.5% were observed in “olive oil for dressing, and olive oil or high oleic sunflower for cooking” and “prioritize side dishes of vegetables and legumes”, but they did not reach significance (p = 0.083). In this group, a 25% increase was observed in the “offer of dairy desserts without added sugar” (p = 0.317) and “offer options with no added salt” (p = 0.157). No significant changes were observed in the other analyzed items or between treatments. When the average AMed criteria were compared, even though increases were observed after intervention in the AMed mandatory or in the sum of all AMed (compulsory and optional), neither intra nor inter-treatment significant differences were observed.
Table 2.
Adherence to the Mediterranean diet criteria (AMed1) in the control and intervention groups at the beginning and the end of this study.
3.3. Gluten Management
Table 3 shows the gluten management in the control and intervention groups at the beginning and end of this study. In the control group, when comparing the beginning to the end of this study, the decrease from 70% to 20% in “preparation of gluten-free plates before the other food preparation” reached borderline significance (p = 0.057). In both groups, there was a 50% increase in “to place on the tables bottles of oil, vinegar, sauces, and baskets for exclusive use, or single-dose portions” (p = 0.046). In the intervention group, increases in “to provide a clean apron when working with flours or products that may leave gluten traces on the clothes” (from 37.5% to 70.5%, p =0.046) and in “do not use kitchen cloths and wooden tools, which are materials that can retain traces of gluten” (from 25% to 87.5%, p = 0.025) were observed. The increase observed in “to dispose of closed saltshakers and spice boxes or use a teaspoon to pick up the salt, as long as hands will be not placed inside” reached borderline significance (from 25% to 87.5%, p = 0.059). Additionally, in the intervention group, but not in the control group, the average of all SMAP criteria increased from the beginning to the end of this study (from 12.1 to 14.2, p = 0.021). No inter-treatment differences were observed.
Table 3.
Gluten management in the control and intervention groups at the beginning and the end of this study.
3.4. Traffic Light Rating
When the traffic light rating for restaurants was analyzed, neither intra- nor inter-treatment differences were observed for starters and main dishes (Supplementary Table S1). Concerning desserts (Figure 2), energy decreased, with a borderline significance (p = 0.054), from the beginning to the end of this study in the intervention group; the decrease reached significance compared with the changes observed in the control group (p = 0.017). A similar decreasing pattern in the intra-treatment changes for the intervention group was observed for carbohydrates (p = 0.030) and sugar (p = 0.016) (Figure 2). Neither intra- nor inter-treatment changes were observed for the other evaluated variables: total and saturated fats, proteins, sodium, or fiber.
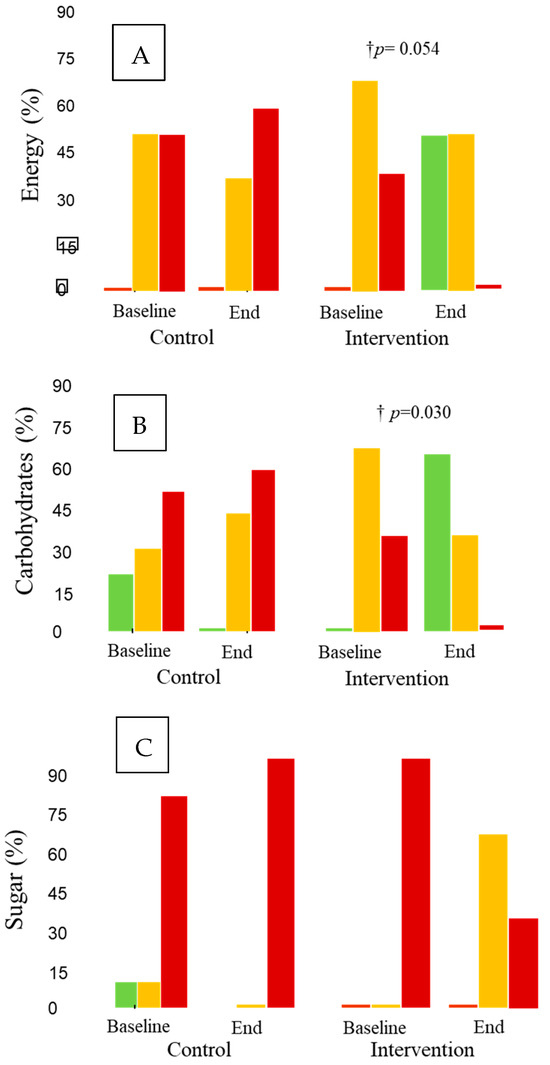
Figure 2.
Traffic light ratings for desserts. † p for intra-treatment comparisons. Green: the dish contains <7.5% of the nutrient amounts classified as unhealthy by the European Guideline Daily Amount (GDA); orange: the dish contains between 7.5 and 20% of them; red: the dish contains >20% of them, for a healthy adult diet of 2000 Kcal. (A) Energy (%), (B) carbohydrates (%), and (C) sugar (%).
3.5. Nutrient Content
When assessing the nutrient content of the restaurants’ dishes, neither intra- nor inter-treatment differences were observed for starters and main dishes (Supplementary Table S2) with the exception of desserts. Figure 3 shows the nutrient content of desserts at the beginning and the end of this study in the control and intervention groups. A decrease was observed from the beginning to the end of this study in the intervention group for energy (p = 0.045), carbohydrates (p = 0.033), and sugar (p = 0.023), with the decrease in sodium values reaching borderline significance (p = 0.058). Despite considerable reductions in proteins or total fat after the intervention period, no significant differences were observed. No differences were observed in saturated fat or fiber values either. No inter-treatment differences were observed.
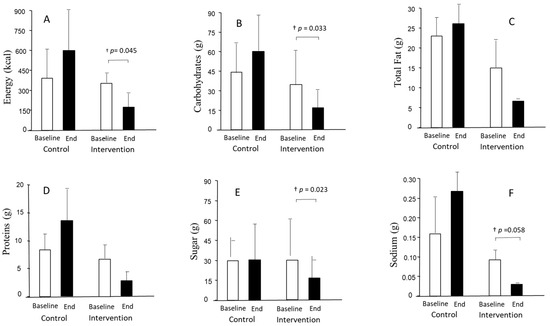
Figure 3.
Nutrient content of desserts at the beginning and end of this study in the control and intervention groups. † p for intra-treatment comparisons. (A) Energy (kcal), (B) carbohydrates (grams), (C) total fat (grams), (D) proteins (grams), (E) sugar (grams), and (F) sodium (grams).
3.6. Gluten- and Allergen-Free Content of the Dishes and Vegetarian and Vegan Offers
The gluten-free and allergen contents and vegetarian and vegan adequacy at restaurants were also examined. Neither intra- nor inter-treatment changes were observed in any variable for starters and main dishes (Supplementary Table S3). In desserts, however, the allergen-free content increased from the beginning to the end of this study in the intervention group (from 0% to 50%, p = 0.040), with the increase being significant compared with the changes in the control group (p = 0.027) (Figure 4).
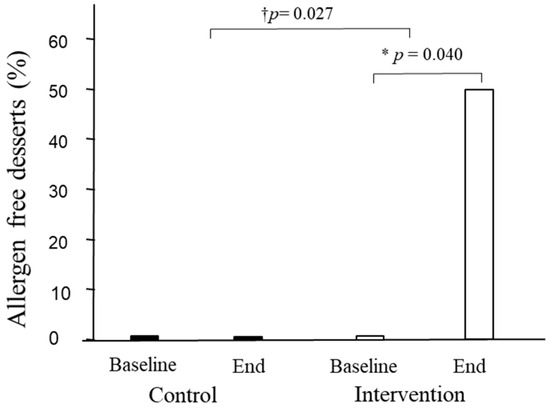
Figure 4.
Percentage of desserts offered without allergens. * p for inter-treatment; † p for intra-treatment comparisons.
4. Discussion
In this study, and after a 12-month intervention, improvements similar to or higher than 25% in four items of the AMed criteria in the intervention group were observed. In the control group, there was an increase from baseline data in the offerings of dairy desserts without added sugar (40%), with a decrease (40%) in the first course offerings as vegetables and/or legumes. Improvements of ≥40% in several SMAP criteria, as well as in the average of all SMAP criteria, were observed in the intervention group but not in the control group. Additionally, in the intervention group, but not in the control group, improvements in traffic light ratings, nutrients, and allergens were observed for desserts. Between-group differences were observed in energy reduction and allergen-free parameters in the intervention group desserts versus the control desserts. Thus, overall, the intervention showed beneficial effects that improved the quality of the menus.
In the intervention group, the main increases for AMed criteria were observed in relation to two items. The first item was “olive oil for dressing, and olive oil or high oleic sunflower for cooking”. A large body of knowledge exists on the advantages of olive oil consumption compared with other types of fats [31,32]. The improvement in this item has particular relevance and impact on the global nutritional quality of food offered, given that oils are involved in a large spectrum of common dishes such as salads or cooked vegetables, as well as in ways to prepare food (i.e., cooking meat and fish). The second item was “prioritize side dishes of vegetables and legumes”, in which an increasing trend was observed in the intervention group with a significant decrease in the control group. The prioritization of vegetable and legume side dishes implies a decrease in carbohydrate (i.e., white rice or pasta) consumption. The benefits of vegetable and legume consumption on health have also been largely documented [33,34].
Concerning SMAP criteria, the item “place on the tables bottles of oil, vinegar, sauces and baskets for exclusive use, or single-dose portions” significantly increased in both groups. This item was one of the mandatory conditions established for the partial reopening of restaurants in Spain in May 2020 after the COVID-19 pandemic lockdown [35]. Several SMAP criteria related to protection against gluten contamination (“to provide a clean apron when working with flours or products that may leave gluten traces on the clothes”; “do not use kitchen cloths and wooden tools, which are materials that can retain traces of gluten”; and “to dispose of closed saltshakers and spice boxes or use a teaspoon to pick up the salt, as long as hands will be not placed inside”) improved in both groups but reached significance only in the intervention group. Improvements in these items imply an active attitude toward avoiding gluten cross-contamination. Conversely, the “preparation of gluten-free plates before the other food preparation” decreased in both groups. This may be because it is time-consuming for the staff to accomplish this goal. It is important to remark that all SMAP criteria must have a gluten-free seal of quality, and their unfulfillment in restaurants could represent a huge problem for people with allergies when eating outside of the home. For this reason, as referred to in [36], it is important not only to use visible visual indicators but also to train staff about allergen awareness to avoid cross-contamination.
It is interesting that improvements in traffic light ratings, nutrients, and allergens occurred only in desserts in the intervention group, without changes in starters or main dishes. Despite having a small sample size, we were able to detect differences between groups for dessert energy regarding traffic light and allergen-free parameters. Regarding the traffic light ratings, there was an increase in green, a moderate decrease in orange, and a decrease in red for both energy and carbohydrates in the intervention group. Concerning sugar, however, the improvement in the intervention group was related to changes from red to orange, without modifications toward the green. Desserts are among the top five sources of fats and sugar [37]. Due to this, improvements in their nutritional value are noteworthy because there are few healthy dessert options [38], and desserts are usually consumed more outside of the home than at home [39]. In agreement with traffic light changes, changes in nutrients followed the same decreasing pattern for energy, carbohydrates, and sugar, but also for sodium. Improvements in meal energy represent one of the main goals for health. An observational study of 27 major UK chain restaurants on the energy content of their main meals showed it was excessive, not only in fast-food restaurants but also in sit-down restaurants [40]. Reducing calories in meals is a task for restaurants to accomplish, as giving consumers the option to choose, e.g., providing calorie information on the menu, seems to be relatively ineffective [41]. This also applies to reductions in sodium, given that consumers tend to underestimate its content in meals [42].
Strengths and Limitations
The present study has several strengths. First of all, this study’s design is robust enough to increase the available high-quality information on the effectiveness of this type of intervention. Additionally, focusing on the poor Mediterranean offerings on restaurant menus and difficulties preparing dishes without food allergens or with controlled food allergens is an original approach, considering the training of the restaurant staff and the provision of tools. This helps to increase their autonomy in improving the nutritional quality of the menu and food allergen detection, instead of teaching consumers about their selection when they visit restaurants.
One particular limitation of this study must be highlighted to explain the moderate success of the intervention and the timing of the intervention: from September 2019 to March 2021, the COVID-19 pandemic was particularly prevalent in Spain [43], with severe lockdown measures from March 2020 [44] to May 2020 [35]. During this time, restaurants could only trade through home delivery or takeaway. From May 2020 to February 2022, lockdown measures prompted restrictions both in the number of clients allowed in the establishment and in the opening hours [35,45]. In comparison with other industries, the restaurant industry has suffered the most significant sales and job losses since the COVID-19 outbreak began [46]. This also can explain the high loss of follow-up in this study, and the fact that the traffic light rating and nutrient improvements were only observed in desserts, as this was the easiest and cheapest way to make healthy changes to the menu. As a recently published article on the research impacts of COVID-19 points out, the COVID-19 pandemic placed a tremendous strain on sustaining the clinical research enterprise and will also likely affect key study outcomes; these effects must be considered during data analysis and interpretation [47]. The sample size reduction could have impaired the achievement of statistical significance between groups. Improvements were observed particularly in the intervention group despite a significantly low average number of recruited employees, with this fact reinforcing the benefits of the intervention. Another limitation was the difficulty in obtaining nutritional information about the dishes offered in restaurants. This is because, in the majority of cases, the restaurant staff did not have the recipes noted down in detail. The close contact that researchers had throughout this study with restaurateurs and staff personnel could explain the benefits obtained. Initiatives such as advertising campaigns, managed by town halls or local governments, directed at restaurants to improve their healthy offers are needed.
5. Conclusions
After a 12-month intervention, improvements were obtained in the intervention group for some AMed and SMAP criteria, as well as in traffic light ratings, nutrients, and allergens in desserts. The moderate rates of changes could be explained by the fact that this study was conducted in the context of the most severe COVID-19 pandemic period in Spain. Our results highlight the need for further interventions to enhance the nutritional quality and safety of menus offered in Spanish restaurants.
Supplementary Materials
The following supporting information can be downloaded at: https://www.mdpi.com/article/10.3390/nu15234869/s1, Table S1: Traffic light ratings of the restaurants for starters and main dishes in the control and intervention groups at the beginning and the end of this study; Table S2: Nutrient content of the restaurants for starters and main dishes in the control and intervention groups at the beginning and the end of this study; Table S3: Allergen content, vegetarian, and vegan adequacy at restaurants throughout this study.
Author Contributions
Conceptualization, E.L., L.T., F.M. and R.S.; methodology, E.L., L.T., F.M., and R.S.; formal analysis, E.L., L.T., F.M. and R.S.; investigation, E.L., L.T., F.M., J.Q., M.B.-M., N.V., R.M.V., A.P. and R.S.; resources, E.L., L.T., F.M., J.Q., M.B.-M., N.V., R.M.V., A.P. and R.S.; data curation, E.L., L.T., F.M. and R.S.; writing—original draft preparation, E.L., L.T., F.M. and R.S.; writing—review and editing, E.L., L.T., F.M., J.Q., M.B.-M., N.V., R.M.V., A.P. and R.S.; visualization, E.L., L.T., F.M., J.Q., M.B.-M., N.V., R.M.V., A.P. and R.S.; supervision, E.L., L.T., F.M., J.Q., M.B.-M., N.V., R.M.V., A.P. and R.S.; project administration, E.L., L.T., F.M. and R.S.; funding acquisition, E.L., L.T., F.M. and R.S. All authors have read and agreed to the published version of the manuscript.
Funding
This publication was co-funded by the European Regional Development Fund (ERDF) of the European Union within the framework of the ERDF operative program of Catalonia 2014–2020 aimed at an objective of investment in growth and employment. This publication is framed within the initiative of coordinated PECT TurisTIC en familia, Operation 12: “Healthy Meals.” This research was funded by the European Union’s Horizon 2020 research and innovation program under the Marie Skłodowska-Curie grant agreement No. 713679. This research was possible with the support of the Universitat Rovira i Virgili (URV) and Banco Santander.
Institutional Review Board Statement
This study was conducted in accordance with the Declaration of Helsinki, and approved by the Institutional Review Board (or Ethics Committee) of Institut d’Investigació Sanitaria Pere i Virgili (ref CEIM: 179/2018 and 20/12/2018). The trial is registered in the international registry of clinical trials (ClinicalTrials.gov: https://clinicaltrials.gov/ct2/about-site/background, accessed on 21 February 2019) with the project identification code NCT03826576.
Informed Consent Statement
Informed consent was obtained from all subjects involved in this study. Written informed consent was obtained from the subjects involved in this study to publish this paper.
Data Availability Statement
Emails can be directed to rosa.sola@urv.cat and elisabet.llaurado@urv.cat.
Acknowledgments
The authors acknowledge the 2021-SGR-00817 project from Agencia de Gestión de Ayudas Universitarias y de Investigación (AGAUR), Generalitat de Catalunya.
Conflicts of Interest
The authors declare no conflict of interest. The funders had no role in the design of this study; in the collection, analyses, or interpretation of data; in the writing of this manuscript; or in the decision to publish the results.
References
- McGuffin, L.E.; Price, R.K.; McCaffrey, T.A.; Hall, G.; Lobo, A.; Wallace, J.M.W.; Livingstone, M.B.E. Parent and child perspectives on family out-of-home eating: A qualitative analysis. Public Health Nutr. 2015, 18, 100–111. [Google Scholar] [CrossRef] [PubMed]
- Diaz-Mendez, C.; Garcia-Espejo, I. Eating out in Spain: Motivations, sociability and consumer contexts. Appetite 2017, 119, 14–22. [Google Scholar] [CrossRef] [PubMed]
- Lachat, C.; Nago, E.; Verstraeten, R.; Roberfroid, D.; Van Camp, J.K.P. Eating out of home and its association with dietary intake: A systematic review of the evidence. Obes. Rev. 2012, 13, 329–346. [Google Scholar] [CrossRef] [PubMed]
- Foundation, B.N. British Nutrition Foundation. Available online: https://www.nutrition.org.uk/putting-it-into-practice/make-healthier-choices/healthy-eating-when-out-and-about/ (accessed on 17 November 2023).
- Orfanos, P.; Naska, A.; Rodrigues, S.; Lopes, C.; Freisling, H.; Rohrmann, S.; Sieri, S.; Elmadfa, I.; Lachat, C.; Gedrich, K.; et al. Eating at restaurants, at work or at home. Is there a difference: A study among adults of 11 European countries in the context of the HECTOR project. Eur. J. Clin. Nutr. 2017, 71, 407–419. [Google Scholar] [CrossRef]
- Jayedi, A.; Soltani, S.; Abdolshahi, A.S.-B.S. Healthy and unhealthy dietary patterns and the risk of chronic disease: An umbrella review of meta-analyses of prospective cohort studies. Br. J. Nutr. 2020, 124, 1133–1144. [Google Scholar] [CrossRef] [PubMed]
- Organización Mundial de la Salud Enfermedades no Transmisibles. Noncommunicable Diseases. Available online: https://www.who.int/news-room/fact-sheets/detail/noncommunicable-diseases (accessed on 17 November 2023).
- Kamran, H.; Imtiaz, A.; Amin, F.; Ghazzanfar, S.; Sani, A.; Fatima, S.; Aslam, M.; Jabeen, S. Impact of food intolerance on quality of life among university students. J. Psychol. Clin. Psychiatry 2020, 11, 60–64. [Google Scholar] [CrossRef]
- Fernández-Rivas, M.; Barreales, L.; Mackie, A.R.; Fritsche, P.; Vázquez-Cortés, S.; Jedrzejczak-Czechowicz, M.; Kowalski, M.L.; Clausen, M.; Gislason, D.; Sinaniotis, A.; et al. The EuroPrevall outpatient clinic study on food allergy: Background and methodology. Allergy 2015, 70, 576–584. [Google Scholar] [CrossRef]
- Lyons, S.A.; Burney, P.G.J.; Ballmer-Weber, B.K.; Fernandez-Rivas, M.; Barreales, L.; Clausen, M.; Dubakiene, R.; Fernandez-Perez, C.; Fritsche, P.; Jedrzejczak-Czechowicz, M.; et al. Food Allergy in Adults: Substantial Variation in Prevalence and Causative Foods Across Europe. J. Allergy Clin. Immunol. Pract. 2019, 7, 1920–1928. [Google Scholar] [CrossRef]
- Newson, R.; van der Maas, R.; Beijersbergen, A.; Carlson, L.; Rosenbloom, C. International consumer insights into the desires and barriers of diners in choosing healthy restaurant meals. Food Qual. Prefer. 2015, 43, 63–70. [Google Scholar] [CrossRef]
- Radke, T.J.; Brown, L.G.; Hoover, E.R.; Faw, B.V.; Reimann, D.; Wong, M.R.; Nicholas, D.; Barkley, J.; Ripley, D. Food Allergy Knowledge and Attitudes of Restaurant Managers and Staff: An EHS-Net Study. J. Food Prot. 2016, 79, 1588–1598. [Google Scholar] [CrossRef]
- Bailey, S.; Albardiaz, R.; Frew, A.; Smith, H. Restaurant staff’s knowledge of anaphylaxis and dietary care of people with allergies. Clin. Exp. Allergy 2011, 41, 713–717. [Google Scholar] [CrossRef] [PubMed]
- Valdivia Espino, J.N.; Guerrero, N.; Rhoads, N.; Simon, N.-J.; Escaron, A.L.; Meinen, A.; Nieto, F.J.; Martinez-Donate, A.P. Community-Based Restaurant Interventions to Promote Healthy Eating: A Systematic Review. Prev. Chronic Dis. 2015, 21, E78. [Google Scholar] [CrossRef] [PubMed]
- Alexander, E.; Rutkow, L.; Gudzune, K.A.; Cohen, J.E.; McGinty, E. Healthiness of US Chain Restaurant Meals in 2017. J. Acad. Nutr. Diet 2020, 120, 1359–1367. [Google Scholar] [CrossRef] [PubMed]
- Çoker, E.N.; Pechey, R.; Frie, K.; Jebb, S.A.; Stewart, C.; Higgs, S.C.B. A dynamic social norm messaging intervention to reduce meat consumption: A randomized cross-over trial in retail store restaurants. Appetite 2022, 169, 105824. [Google Scholar] [CrossRef] [PubMed]
- Mandracchia, F.; Tarro, L.; Llauradó, E.; Valls, R.M. Interventions to Promote Healthy Meals in Full-Service Restaurants and Canteens: A Systematic Review and Meta-Analysis. Nutrients 2021, 13, 1350. [Google Scholar] [CrossRef] [PubMed]
- World Medical Association. WMA Declaration of Helsinki–Ethical Principles for Medical Research Involving Human Subjects. Available online: https://www.wma.net/policies-post/wma-declaration-of-helsinki-ethical-principles-for-medical-research-involving-human-subjects (accessed on 20 November 2023).
- Rennie, D. CONSORT revised—Improving the reporting of randomized trials. JAMA 2001, 285, 2006–2007. [Google Scholar] [CrossRef]
- Mandracchia, F.; Llauradó, E.; Valls, R.M.; Tarro, L.; Solà, R. Evaluating mediterranean diet-adherent, healthy and allergen-free meals offered in tarragona province restaurants (Catalonia, spain): A cross-sectional study. Nutrients 2021, 13, 2464. [Google Scholar] [CrossRef]
- Agència de Salut Pública de Catalunya. Generalitat de Catalunya. Amed Alimentació Mediterrània. Available online: http://www.amed.cat/requisits.php (accessed on 17 November 2023).
- Associació de Celíacs de Catalunya. Available online: https://www.celiacscatalunya.org/ca/establiment_acreditat (accessed on 19 November 2023).
- Food Standards Agency. Department of Health. Scotland Northern Ireland and Wales Governments. Guide to Creating a Front of Pack (FoP) Nutrition Label for Pre-Packed Products Sold through Retail Outlets. Available online: https://www.gov.uk/government/publications/front-of-pack-nutrition-labelling-guidance (accessed on 2 September 2022).
- Rayner, M.; Scarborough, P. The origin of Guideline Daily Amounts and the Food Standards Agency’s guidance on what counts as “a lot” and “a little. ” Public Health Nutr. 2004, 7, 293. [Google Scholar] [CrossRef]
- RedBedca AESAN Base de Datos Española de Composición de Alimentos-BEDCA. Spanish Database of Food CompositionBEDCA. Available online: https://www.bedca.net/ (accessed on 2 September 2022).
- Mcgraw-Hill Tablas De Composicion De Alimentos Del Cesnid; Interameri: Madrid, Spain, 2003; ISBN 9788448605902.
- Verdú, J.M. Tabla De Composición De Alimentos. In Food Composition Table, 4th ed.; Universidad de Granada: Granada, Spain, 2003; ISBN 978-84-3383-050-3. [Google Scholar]
- Favier, J.C.; Ireland-Ripert, J.; Toque, C.; Feinberg, M. Répertoire général des aliments: Table de composition. In General Food Directory: Composition Table; Technique & Documentation: Paris, France, 1995; ISBN 2-85206-921-0. [Google Scholar]
- Moreiras, O.; Carbajal, Á.; Cabrera, L.; Cuadrado, C. Tablas de composición de alimentos. In Food Composition Tables, 16th ed.; Pirámide: Madrid, Spain, 2013; ISBN 8436815718. [Google Scholar]
- Tuso, P.J.; Ismail, M.H.; Ha, B.P.; Bartolotto, C. Nutritional update for physicians: Plant-based diets. Perm. J. 2013, 17, 61–66. [Google Scholar] [CrossRef]
- Gaforio, J.J.; Visioli, F.; Alarcón-de-la-Lastra, C.; Castañer, O.; Delgado-Rodríguez, M.; Fitó, M.; Hernández, A.F.; Huertas, J.R.; Martínez-González, M.A.; Menendez, J.A.; et al. Virgin Olive Oil and Health: Summary of the III International Conference on Virgin Olive Oil and Health Consensus Report, JAEN (Spain) 2018. Nutrients 2019, 11, 2039. [Google Scholar] [CrossRef]
- Pedret, A.; Fernández-Castillejo, S.; Valls, R.M.; Catalán, Ú.; Rubió, L.; Romeu, M.; Macià, A.; López de Las Hazas, M.C.; Farràs, M.; Giralt, M.; et al. Cardiovascular Benefits of Phenol-Enriched Virgin Olive Oils: New Insights from the Virgin Olive Oil and HDL Functionality (VOHF) Study. Mol. Nutr. Food Res. 2021, 65, e2170061. [Google Scholar] [CrossRef]
- Gibbs, J.; Cappuccio, F. Plant-Based Dietary Patterns for Human and Planetary Health. Nutrients 2022, 14, 1614. [Google Scholar] [CrossRef] [PubMed]
- English, L.K.; Ard, J.D.; Bailey, R.L.; Bates, M.; Bazzano, L.A.; Boushey, C.J.; Brown, C.; Butera, G.; Callahan, E.H.; de Jesus, J.; et al. Evaluation of Dietary Patterns and All-Cause Mortality: A Systematic Review. JAMA Netw. Open. 2021, 4, e2122277. [Google Scholar] [CrossRef] [PubMed]
- B.O.E. Boletin Oficial del Estado (Spanish Official Journal). Saturday 9 of May of 2020. Disposition 4911. Article 16. 2020. Available online: https://www.boe.es/boe/dias/2020/05/09/pdfs/BOE-A-2020-4911.pdf (accessed on 14 March 2022).
- Barnett, J.; Begen, F.M.; Gowland, M.H.; Lucas, J.S. Comparing the eating out experiences of consumers seeking to avoid different food allergens. BMC Public. Health 2018, 18, 1263. [Google Scholar] [CrossRef]
- Wambogo, E.; O’Connor, L.; Shams-White, M.; Herrick, K.; Reedy, J. Top sources and trends in consumption of total energy and energy from solid fats and added sugars among youth aged 2–18 years: United States 2009–2018. Am. J. Clin. Nutr. 2022, 116, 1779–1789. [Google Scholar] [CrossRef]
- Craig, W.J.; Brothers, C.J. Nutritional Content of Non-Dairy Frozen Desserts. Nutrients 2022, 14, 4150. [Google Scholar] [CrossRef] [PubMed]
- Naska, A.; Katsoulis, M.; Orfanos, P.; Lachat, C.; Gedrich, K.; Rodrigues, S.S.; Freisling, H.; Kolsteren, P.; Engeset, D.; Lopes, C.; et al. Eating out is different from eating at home among individuals who occasionally eat out. A cross-sectional study among middle-aged adults from eleven European countries. Br. J. Nutr. 2015, 113, 1951–1964. [Google Scholar] [CrossRef]
- Robinson, E.; Jones, A.; Whitelock, V.; Mead, B.R.; Haynes, A. (Over)eating out at major UK restaurant chains: Observational study of energy content of main meals. BMJ 2018, 363, k4982. [Google Scholar] [CrossRef]
- Bailey, R.L.; Kwon, K.; Garcia, C.; Wang, P. Fast food menu calorie labeling contexts as complex contributing factors to overeating. Appetite 2022, 173, 105992. [Google Scholar] [CrossRef]
- Moran, A.J.; Ramirez, M.; Block, J.P. Consumer underestimation of sodium in fast food restaurant meals: Results from a cross-sectional observational study. Appetite 2017, 113, 155–161. [Google Scholar] [CrossRef]
- Working group for the surveillance and control of COVID-19 in Spain; Members of the Working group for the surveillance and control of COVID-19 in Spain. The first wave of the COVID-19 pandemic in Spain: Characterisation of cases and risk factors for severe outcomes, as at 27 April 2020. Euro Surveill 2020, 25, 2001431. [Google Scholar] [CrossRef]
- B.O.E. Boletin Oficial del Estado (Spanish Official Journal). Number 67. Available online: https://www.boe.es/buscar/pdf/2020/BOE-A-2020-3692-consolidado.pdf (accessed on 14 March 2022).
- Instituto para la Calidad Turística Española. Medidas para la Reducción del Contagio por el Coronavirus SARSCoV-2; Ministerio de Industria, Comercio y Turismo: Madrid, Spain, 2020; Available online: https://www.mincotur.gob.es/es-es/COVID-19/turismo/GuiasSectorTurismo/Restaurantes.pdf (accessed on 17 November 2023).
- National Restaurant Association USA. Available online: https://restaurant.org/education-and-resources/learning-center/business-operations/coronavirus-information-and-resources/ (accessed on 20 September 2022).
- Tuttle, K. Impact of the COVID-19 pandemic on clinical research. Nat. Rev. Nephrol. 2020, 16, 562–564. [Google Scholar] [CrossRef] [PubMed]
Disclaimer/Publisher’s Note: The statements, opinions and data contained in all publications are solely those of the individual author(s) and contributor(s) and not of MDPI and/or the editor(s). MDPI and/or the editor(s) disclaim responsibility for any injury to people or property resulting from any ideas, methods, instructions or products referred to in the content. |
© 2023 by the authors. Licensee MDPI, Basel, Switzerland. This article is an open access article distributed under the terms and conditions of the Creative Commons Attribution (CC BY) license (https://creativecommons.org/licenses/by/4.0/).