Review

Efficacy of Postprandial Exercise in Mitigating Glycemic Responses in Overweight Individuals and Individuals with Obesity and Type 2 Diabetes—A Systematic Review and Meta-Analysis

by
Jie Kang
1,*,
Brian M. Fardman
2,
Nicholas A. Ratamess
1,
Avery D. Faigenbaum
1 and
Jill A. Bush
1
1
Department of Kinesiology and Health Sciences, The College of New Jersey, Ewing, NJ 08618, USA
2
Rowan-Virtua School of Osteopathic Medicine, Stratford, NJ 08084, USA
*
Author to whom correspondence should be addressed.
Nutrients 2023, 15(20), 4489; https://doi.org/10.3390/nu15204489
Submission received: 27 September 2023 / Revised: 17 October 2023 / Accepted: 20 October 2023 / Published: 23 October 2023
(This article belongs to the Special Issue Exercise and Nutrition for Human Health)

Abstract

:
Studies investigating the acute effect of postprandial exercise (PPE) on glucose responses exhibit significant heterogeneity in terms of participant demographic, exercise protocol, and exercise timing post-meal. As such, this study aimed to further analyze the existing literature on the impact of PPE on glycemic control in overweight individuals and individuals with obesity and type 2 diabetes (T2DM). A literature search was conducted through databases such as PubMed, CINAHL, and Google Scholar. Thirty-one original research studies that met the inclusion criteria were selected. A random-effect meta-analysis was performed to compare postprandial glucose area under the curve (AUC) and 24 h mean glucose levels between PPE and the time-matched no-exercise control (CON). Subgroup analyses were conducted to explore whether the glucose-lowering effect of PPE could be influenced by exercise duration, exercise timing post-meal, and the disease status of participants. This study revealed a significantly reduced glucose AUC (Hedges’ g = −0.317; SE = 0.057; p < 0.05) and 24 h mean glucose levels (Hedges’ g = −0.328; SE = 0.062; p < 0.05) following PPE compared to CON. The reduction in glucose AUC was greater (p < 0.05) following PPE lasting >30 min compared to ≤30 min. The reduction in 24 h mean glucose levels was also greater (p < 0.05) following PPE for ≥60 min compared to <60 min post-meal and in those with T2DM compared to those without T2DM. PPE offers a viable approach for glucose management and can be performed in various forms so long as exercise duration is sufficient. The glucose-lowering effect of PPE may be further enhanced by initiating it after the first hour post-meal. PPE is a promising strategy, particularly for patients with T2DM. This manuscript is registered with Research Registry (UIN: reviewregistry1693).

1. Introduction

Persistent postprandial hyperglycemia is an important risk factor for type 2 diabetes mellitus (T2DM) and its complications, which include cardiovascular diseases and mortality [1,2,3]. In fact, postprandial glucose is often considered a more dynamic indicator of metabolic health and cardiovascular disease risk compared to glycated hemoglobin (HbA1c) or fasting glucose [4,5,6]. Impaired postprandial glycemia is also associated with inflammation, oxidative stress, and impaired endothelial function [7]. Longitudinal studies have demonstrated that reducing postprandial glucose not only improves glycemic control but also reduces cardiovascular disease risk in patients with T2DM [8,9]. Given the recurrent exposure to postprandial hyperglycemia throughout the day, the postprandial phase has emerged as a pivotal focus for the prevention and treatment of diabetic conditions.
Exercise is vital in the prevention and treatment of T2DM. Both endurance and resistance exercise can acutely enhance insulin sensitivity and glucose tolerance [10,11,12]. These improvements have been attributed to the activation of the skeletal muscle glucose transporter system [13], the depletion of muscle and liver glycogen stores [14,15], and/or increased skeletal muscle blood flow [16] following the cessation of exercise. In adults with prediabetes or T2DM, a net reduction in blood glucose concentration during exercise is usually observed [17]. It has been suggested that strategies to combat T2DM should consider exercise after meals to more effectively tame postprandial glucose excursions [18,19]. When exercise is performed postprandially, both contraction- and insulin-mediated glucose uptake are stimulated, resulting in an additive effect on skeletal muscle glucose uptake [20]. Exercise after a meal is also linked to an elevated insulin-to-glucagon ratio, which can suppress hepatic glucose output, thereby lowering blood glucose levels [21,22].
A key objective of adopting postprandial exercise (PPE) is to effectively balance the rate of meal-derived glucose entering the bloodstream with the rate at which exercise utilizes this fuel. In this context, the impact that exercise has on postprandial glucose profile will depend in part on the time elapsed between the start of the preceding meal and the initiation of subsequent exercise. If exercise occurs too soon while meal-derived glucose levels are still low, or if it occurs too late, i.e., beyond the peak blood glucose period, the opportunity to effectively blunt postprandial hyperglycemia can be lost [23]. Recent reviews suggest that exercise initiated 30 min after a meal may produce the greatest improvements in glycemic control for individuals with T2DM [24,25]. However, this view is based on a limited number of studies that mainly compare the effect of pre- and post-meal exercise on glycemic responses in individuals with T2DM [26,27,28]. Studies involving an exercise regimen 60 min or more after a meal have also shown a significant reduction in glucose response in this population [29,30,31,32,33,34,35,36].
While managing postprandial hyperglycemia holds crucial significance in treating and preventing T2DM, exercise strategies during this phase that could be most effective in mitigating blood glucose levels have yet to be fully established. Among the studies exploring the acute effect of postprandial exercise on glycemic control, substantial heterogeneity exists in aspects such as participant demographics, exercise protocols, and exercise timing post-meal, making it challenging in directly applying the findings. Among the studies in the literature, there are also disparities in how postprandial glycemic responses have been determined. Glycemic responses following PPE can be assessed by quantifying the area under the curve (AUC) for glucose a few hours after exercise or by determining the mean glucose concentration over a 24 h period that includes the exercise treatment. These two measures, however, do not always yield the same results [29,37,38,39].
Therefore, the aim of this study was to comprehensively examine the available literature on the impact of PPE on glycemic control, including assessments of both the glucose AUC and the 24 h mean glucose concentration. Subgroup analyses were included to further explore whether the glucose-lowering effect of PPE could be influenced by exercise duration, exercise timing post-meal, and participants’ disease status. By pooling and stratifying data from multiple studies via a meta-analytical approach, this quantitative review could provide more compelling evidence on how PPE may be best arranged tactically to minimize meal-induced glucose surges in overweight adults and adults with obesity and T2DM.

2. Methods

2.1. Search Strategy

This review followed the Preferred Reporting Items for Systematic Reviews and Meta-Analyses (PRISMA) guidelines [40]. A literature search was conducted through electronic databases such as PubMed, CINAHL, and Google Scholar; our search began in July 2022 and ended in June 2023. Only English language articles were retrieved. The search was restricted to peer-reviewed publications reporting the acute effects of postprandial exercise on glycemic responses in human subject experimentation since 1970. The search was performed by using various combinations of the key words or phrases concerning (1) the exercise treatment (such as “postprandial exercise”, “post-meal exercise”, and “exercise after eating”) and (2) the outcome measures (such as “glycemia”, “hyperglycemia”, and “blood glucose concentrations”). Articles were also identified by a manual search via cross-referencing the original research papers, review articles, and lay press publications. The search results were imported into the EndNote software program (EndNote v20) to organize references and remove duplicates.

2.2. Inclusion and Exclusion Criteria

The studies that were chosen for further analysis met the following inclusion criteria: (a) participants were 18 years of age or older and overweight (i.e., BMI ≥ 25 kg·m−2), obese (i.e., BMI ≥ 30 kg·m−2) or diagnosed with T2DM (i.e., HbA1c ≥ 6.5%); (b) studies involved exercise protocols that were initiated after a meal and measured the acute effect of postprandial exercise on glycemic responses; (c) studies included a control condition of no exercise (CON) conducted in the same postprandial period on a different day; and (d) glycemic responses were assessed via AUC for glucose post exercise and/or by the mean glucose concentration over a 24 h period that included the experimental treatment. In accordance with these inclusion criteria, we excluded studies that (a) used animal models, healthy, normal-weight participants, or special populations such as adolescents, pregnant women, and patients with type 1 diabetes; (b) employed a longitudinal study design involving physical training; (c) failed to use a separate and time-matched control condition; (d) implemented an exercise protocol outside of postprandial period; and (e) assessed other postprandial parameters, such as blood lipid levels, substrate oxidation, hormonal responses, antioxidant status, and immune function. Each article was independently screened and approved by two authors based on these inclusion and exclusion criteria.

2.3. Assessment of Methodological Quality

To assess the methodological quality of the included studies, a 7-question checklist was created according to the National Heart, Lung, and Blood Institute (NHLBI) Quality Assessment Tool for Observational Cohort and Cross-Sectional Studies (https://www.nhlbi.nih.gov/health-topics/study-quality-assessment-tools, accessed on 15 July 2022). The 7 questions in this checklist are as follows: (1) Was the research question or objective in this paper clearly stated? (2) Was the study population clearly defined and characterized? (3) Were inclusion and exclusion criteria for being in the study prespecified and applied uniformly to all participants? (4) Was sample size justification, power calculation, or effect size estimate provided? (5) Were the exposure measures (independent variables) clearly defined and applied consistently to all participants? (6) Were the outcome measures (dependent variables) clearly defined and measured consistently across all participants? (7) Were potential confounding variables such as medications, diet, and/or physical activity prior to experimental trials properly controlled? The assessment was made independently by two coauthors.

2.4. Data Extraction

Extracted data included (1) study authors and year of publication, (2) participants’ characteristics, (3) PPE protocols, (4) test meal profiles, (5) outcome variables, and (6) major findings. The outcome variables included the postprandial glucose excursions—measured by glucose AUC or incremental AUC (if AUC is not available) and 24 h mean glucose concentrations. The glucose AUC measures the more immediate glucose response, while the 24 h mean glucose concentration provides a more complete picture of glycemic control throughout the day [41,42]. If the studies presented standard errors (SEs), they were converted to standard deviations (SDs) using the formula of SE times the square root of sample size [43]. If the studies only presented 95% confidence intervals, SDs were calculated as the confidence interval length divided by 3.92 and multiplied by the square root of the sample size [43]. When results were only shown in graphs and the corresponding authors could not be reached, they were extracted using the Web Plot Digitizer (Web Plot Digitizer V3.11). Data extraction was independently performed by two authors and crosschecked for accuracy.

2.5. Statistical Analysis

Meta-analysis was conducted to compare glycemic responses between PPE and CON using the Statistical Package for Social Sciences Version 28 (SPSS v28, SPSS Inc., IBM Corp, Armonk, NY, USA). Additional comparisons of glycemic responses were made between high-intensity interval exercise (HIIE) and continuous moderate-intensity exercise (CMIE) and between exercise post-meal and pre-meal. To facilitate subgroup analyses, the chosen studies were further dichotomized into groups based on (1) exercise duration (i.e., ≤30 min vs. >30 min), (2) exercise timing post-meal (i.e., <60 min vs. ≥60 min), and (3) participants’ disease status (i.e., with vs. without T2DM). As a result, three separate subgroup analyses were performed for each of these three factors. The random-effects model was chosen due to the expected heterogeneity among the chosen studies. The effect size of comparison was determined by Hedge’s g to reduce the potential bias associated with small sample sizes [44]. To justify the adequacy of combining studies, the study homogeneity was evaluated by using the I2 static and interpreted as “high” if I2 was < 50%, “moderate” if I2 was between 50 and 75%, and “low” if I2 was > 75% [45]. For each of the three subgroup analyses, a chi-square-based heterogeneity test was used to detect if the effect size associated with one subgroup significantly differed from the others. In addition, publication bias was evaluated using the Egger’s test in combination with the Trim and Fill procedure, which adjusts the effect size based on potential theoretical missing studies if such occurrences were to happen [46]. For all analyses, the statistical significance threshold was set at p ≤ 0.05.

3. Results

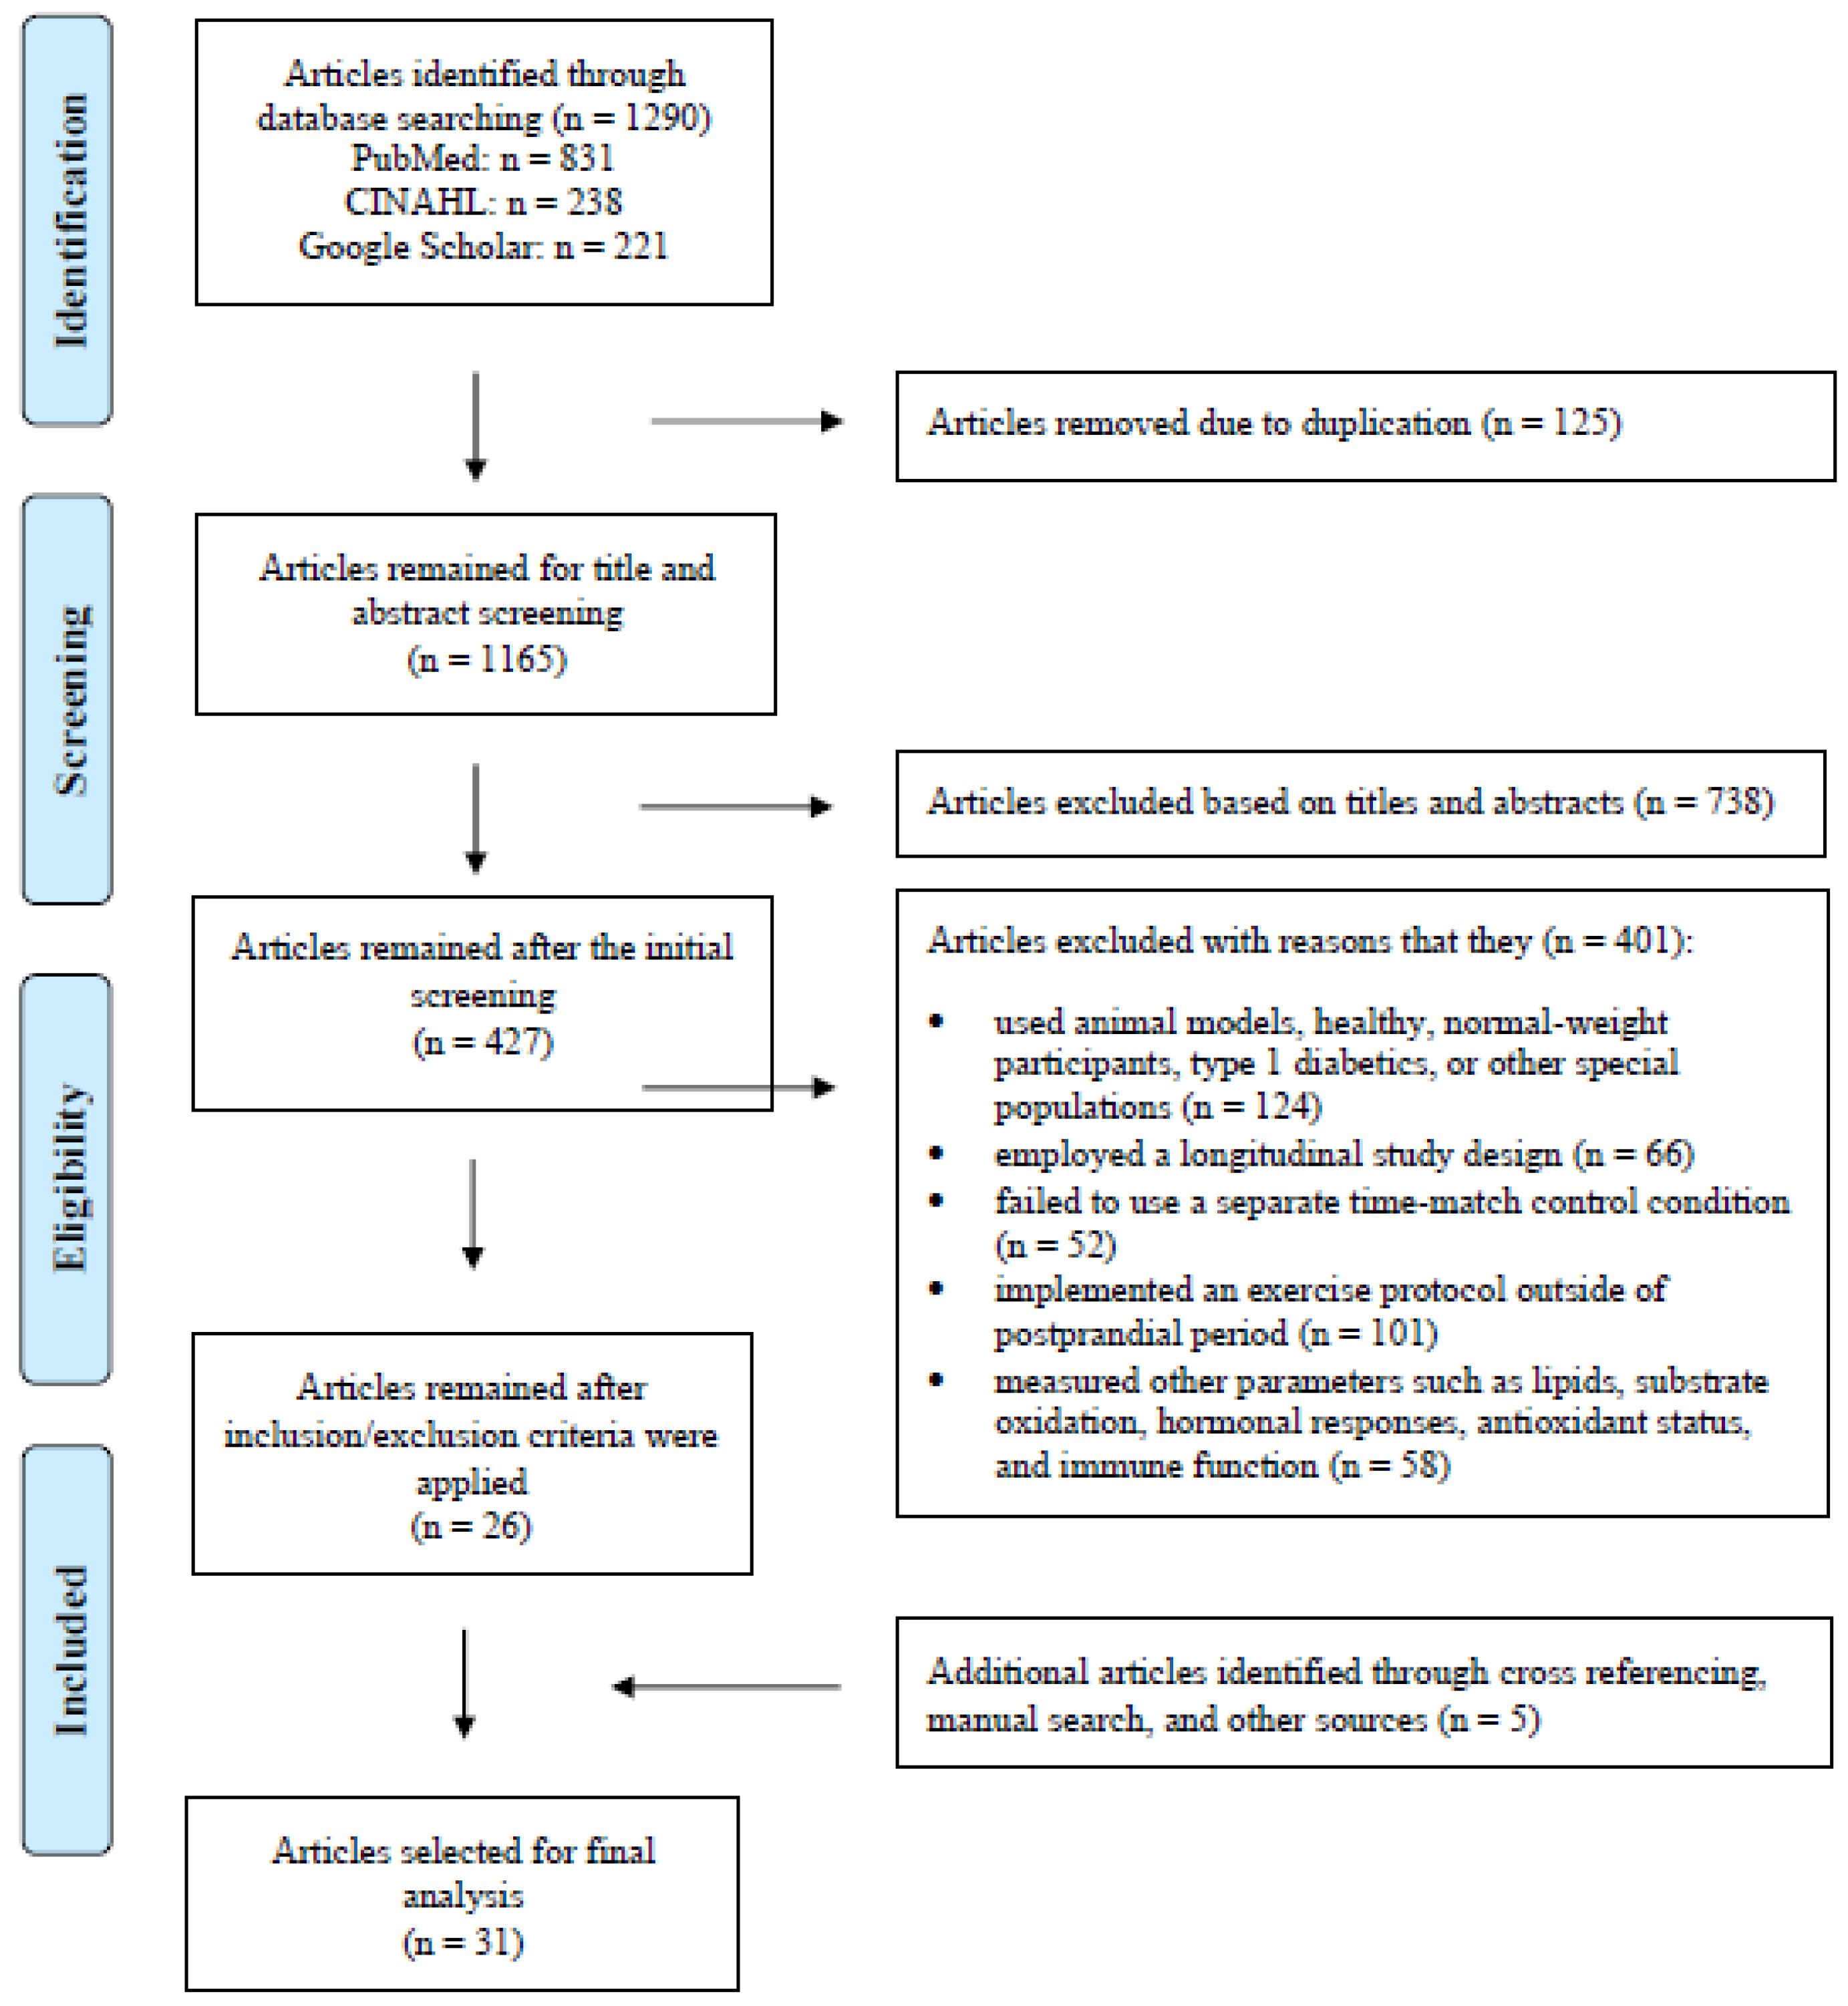
3.1. Study Selection

The initial searches of the aforementioned databases identified 1290 potential full-text, peer-reviewed original research articles. After removing the duplicates and the studies that did not fit the research objective based on their titles and abstracts, 427 articles remained and were subjected to further screening. When both the inclusion and exclusion criteria were applied in conjunction with the articles retrieved from our manual search, 31 articles were selected for the final analysis (Figure 1).

3.2. Study Characteristics

The experimental details of the 31 chosen studies are presented in Table 1. Collectively, these studies included a total of 516 participants aged from 21 to 69 years old, and ~77% of them were men. The average body mass index (BMI) of all participants in all studies combined was 30 kg·m−2. Of the 31 selected studies, 21 recruited patients with T2DM [26,28,29,30,31,32,33,34,35,36,37,38,47,48,49,50,51,52,53,54,55], while the remaining 10 studies involved overweight and obese participants [39,56,57,58,59,60,61,62,63,64]. Of those 21 studies on patients with T2DM, 3 included patients that were treated with exogenous insulin [34,35,36], while the rest allowed their participants to use glucose-lowering medications but instructed them to keep the same dosage throughout the study period. All studies employed a cross-over design in which the same participants underwent both PPE and CON on separate days in a randomized or counterbalanced order. This research setup helps control for diurnal variations and minimize carry-over effects, thus enhancing the internal validity of the study.
The exercise protocols employed in the selected studies were predominantly aerobic (Table 1). Exercise intensity varied between 3 METs and 90% VO2max, with durations ranging from 3 to 60 min. The exercise modalities encompassed activities such as brisk walking with and without inclines, stair climbing and descending, stationary cycling, and resistance exercise. Six studies compared glycemic responses between HIIE and CMIE [32,52,54,60,62,63]. In these studies, the average intensity and duration were approximately 90% VO2max and 28 min, respectively, for HIIE and 60% VO2max and 46 min, respectively, for CMIE. Two studies examined glycemic responses to postprandial resistance exercise [28,33], and two compared such responses between resistance and aerobic exercise [35,47]. Resistance exercises were implemented using medicine balls, elastic bands, calisthenics, and resistance machines, and the intensity and duration of these activities were between 30–70% of one-repetition maximum (1 RM) and between 15–45 min, respectively. Five studies also included a pre-meal exercise trial in which exercise was performed in the postabsorptive or fasting state in addition to the postprandial period [26,28,54,57,61].
All but one study provided specific nutrient information either on the test meal or for the entire day when the experimental trial was conducted (Table 1). On average, participants consumed 507 kcal per meal or 2217 kcal per day, with 59% of the caloric intake being derived from carbohydrates. Most studies were conducted in the morning following a standardized breakfast, with only six studies being performed in the afternoon or evening. The selected studies exhibited a notable range in the time elapsed between the test meal and the subsequent exercise, spanning from 20 to 150 min.
All the studies assessed the impact of postprandial exercise by analyzing glucose AUC or iAUC within a 1 to 6 h timeframe and/or by determining the average glucose concentration over a 24 h period in response to PPE. Of the chosen studies, 17 utilized continuous glucose monitoring to measure glucose responses, while the remaining studies employed the conventional blood sampling technique. In the majority of the studies, the experimental treatment, whether PPE or CON, took place within the glucose measurement period. However, two studies did not record blood glucose levels until immediately after exercise cessation [32,56].

3.3. Methodological Quality and Publication Bias

Detailed results of quality assessment for the included studies are presented in Table 2. Overall, 26 of the 31 studies received a score of 6 or higher, while the average score of all studies combined based on the seven-question checklist was 6.1, exceeding the threshold rating for high quality, i.e., 85% [65]. The most common concern with the chosen studies related to a lack of sample size justification, and this was followed by an inadequate elaboration regarding the criteria used in relation to participant recruitment. Egger’s test indicated that publication bias was insignificant for both the postprandial glucose AUC and 24 h mean glucose concentrations. Moreover, the Trim-and-Fill analysis, which was used to impute potentially missing studies, suggested that no adjustment to the effect size was deemed necessary for either of these two variables.

3.4. Results of Meta-Analysis

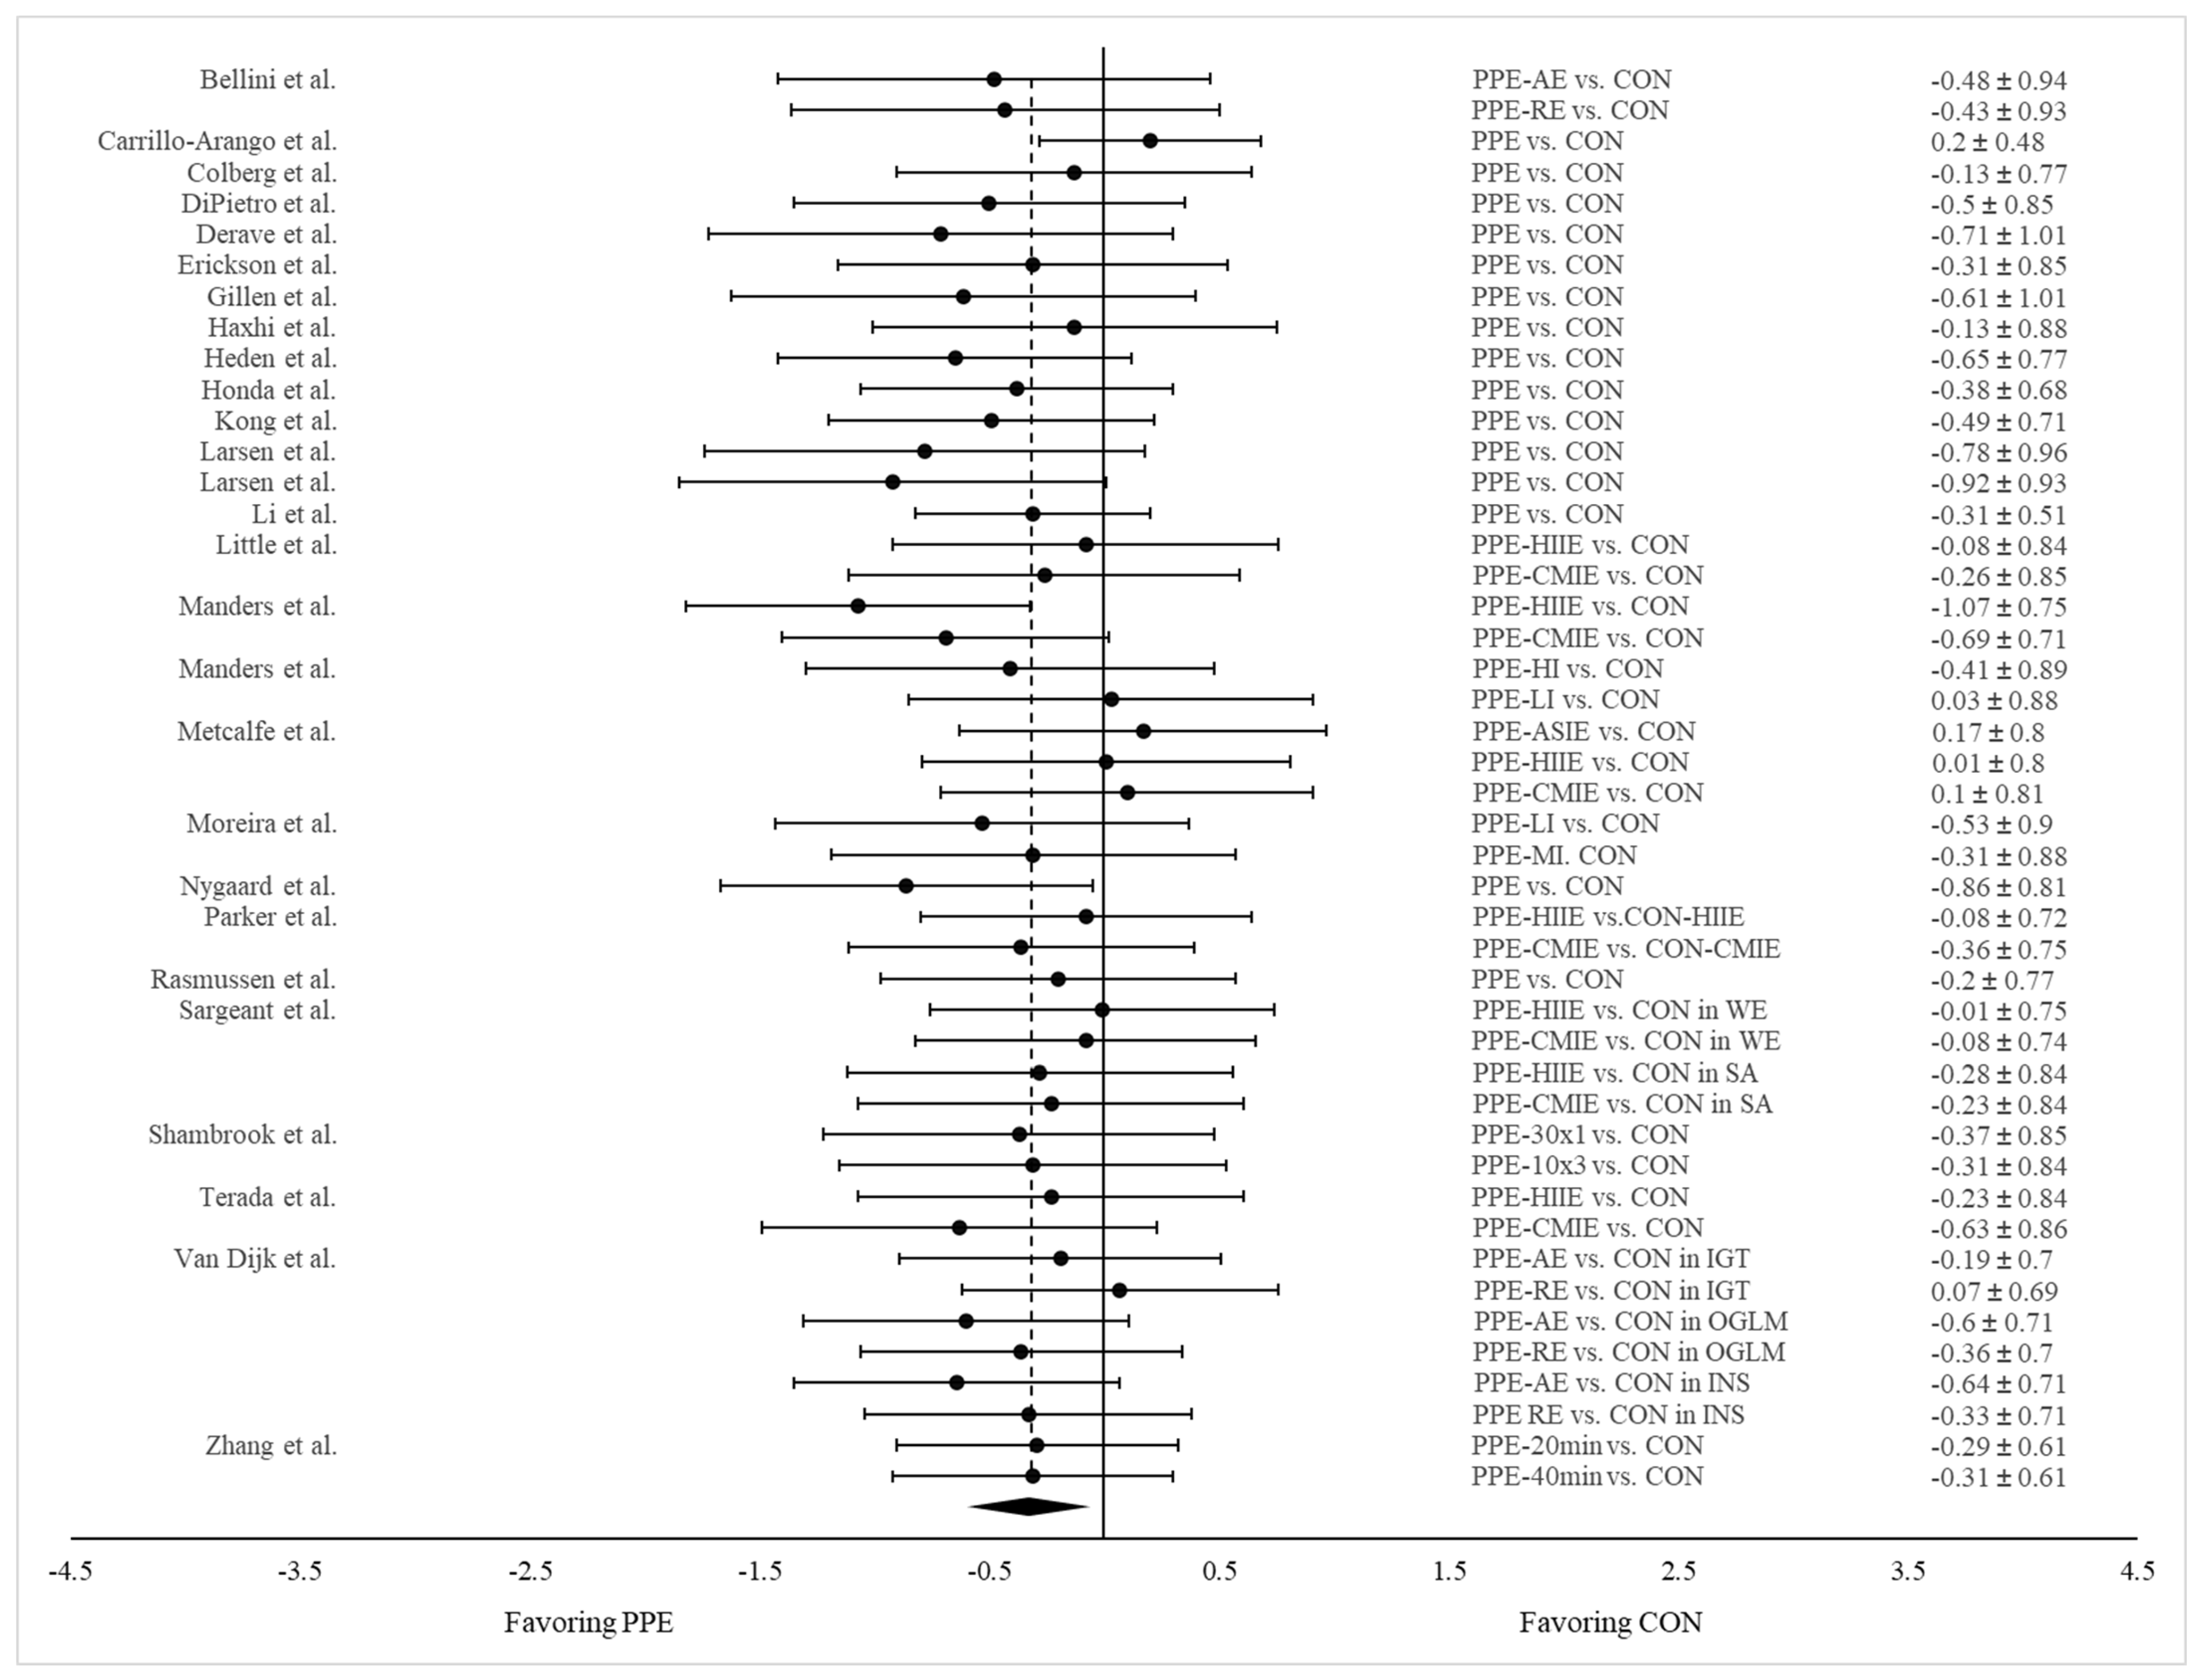
3.4.1. PPE vs. CON on Postprandial Glucose AUC

Twenty-seven studies reported glycemic response as measured by glucose AUC or iAUC for both PPE and CON (Table 1). Twelve of them employed more than one exercise treatment (e.g., AE and RE, HIIE, and CMIE) and exercises with varying intensities, durations, or frequencies. Two studies examined exercise effects in participants differing in ethnic background or disease status. Consequently, a total 46 pairs of data were extracted and pooled for comparison between PPE and CON. Our meta-analysis revealed significantly lower glucose AUC in PPE compared to CON (Hedge’s g = −0.317; SE = 0.057; 95% CI = −0.432, −0.201; p < 0.001) (Figure 2). I2 equaled zero, suggesting a high level of consistency regarding this measure across the studies.

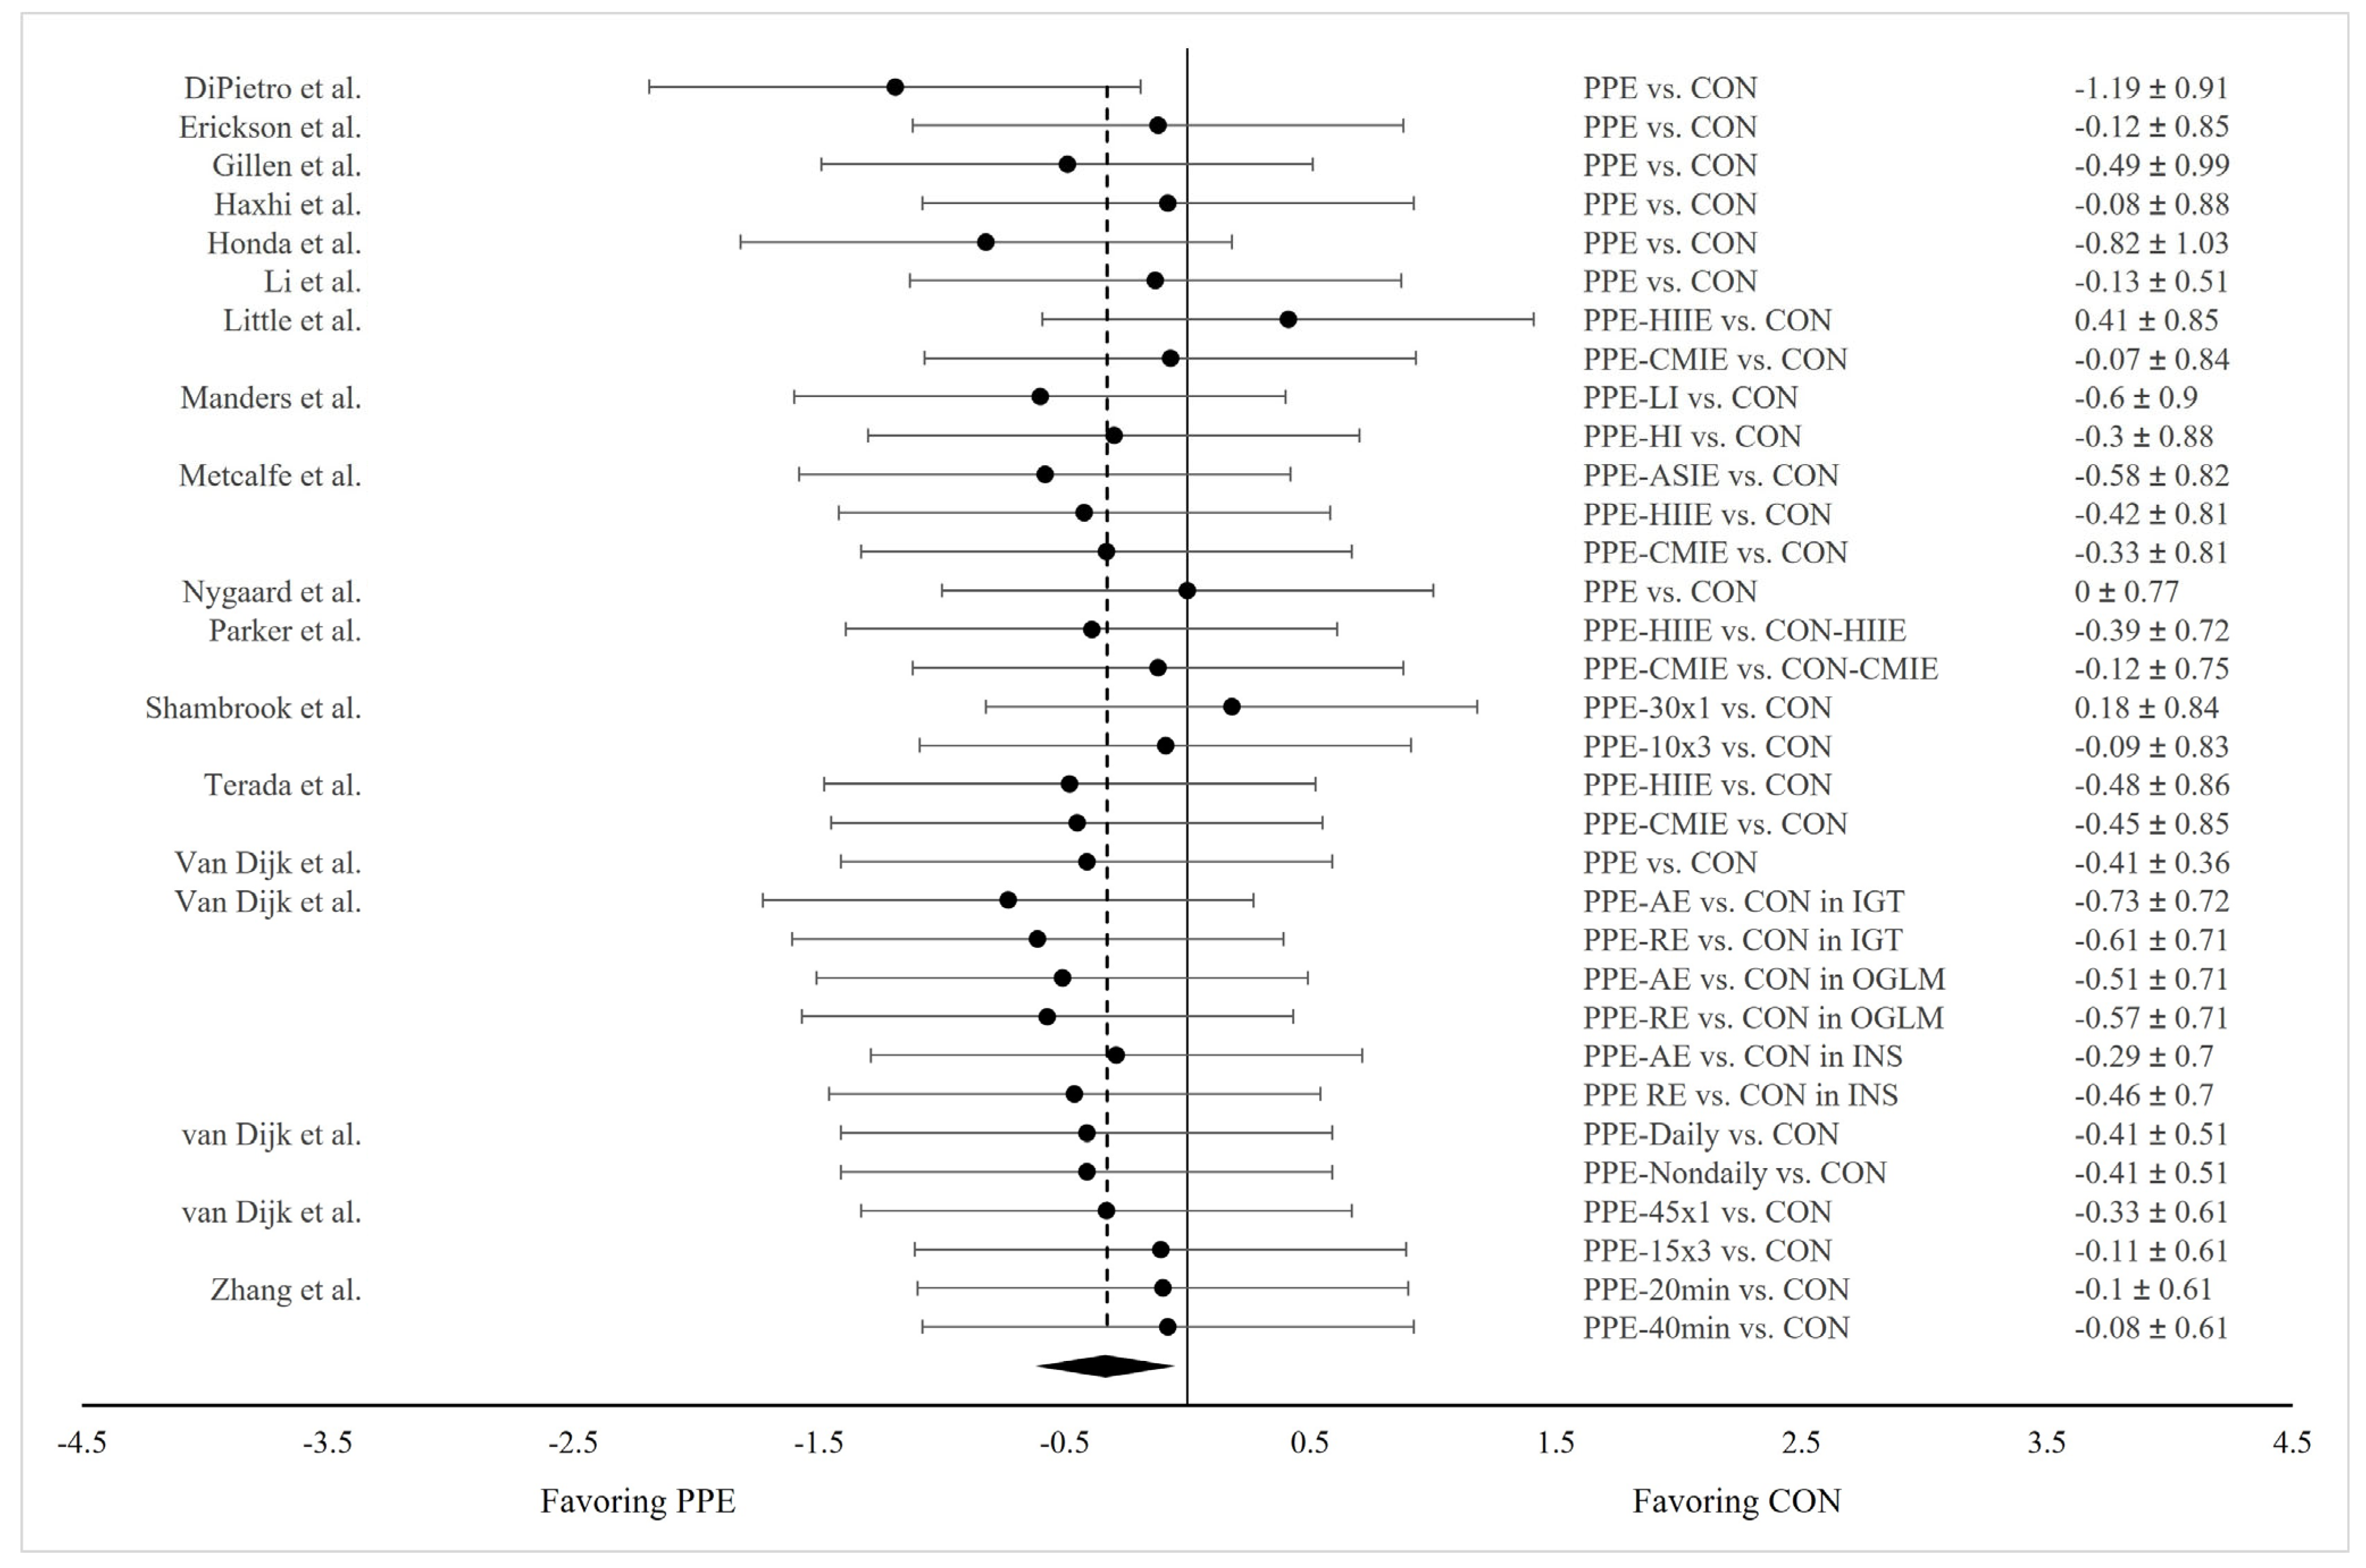
3.4.2. PPE vs. CON on 24 h Mean Glucose Concentration

Eighteen studies examined ~24 h mean glucose concentrations in response to PPE, and eight of them employed more than one exercise treatment (e.g., AE and RE, HIIE, and CMIE) and exercises with varying intensities, durations, or frequencies. One study examined exercise effects in participants differing in disease status. Therefore, a total 33 pairs of data were extracted and pooled for comparison between PPE and CON. Our meta-analysis revealed significantly lower 24 h mean glucose concentrations in PPE compared to CON (Hedge’s g = −0.328; SE = 0.062; 95% CI = −0.453, −0.203; p < 0.001) (Figure 3). I2 equaled zero, suggesting a high level of consistency regarding this measure across the studies.

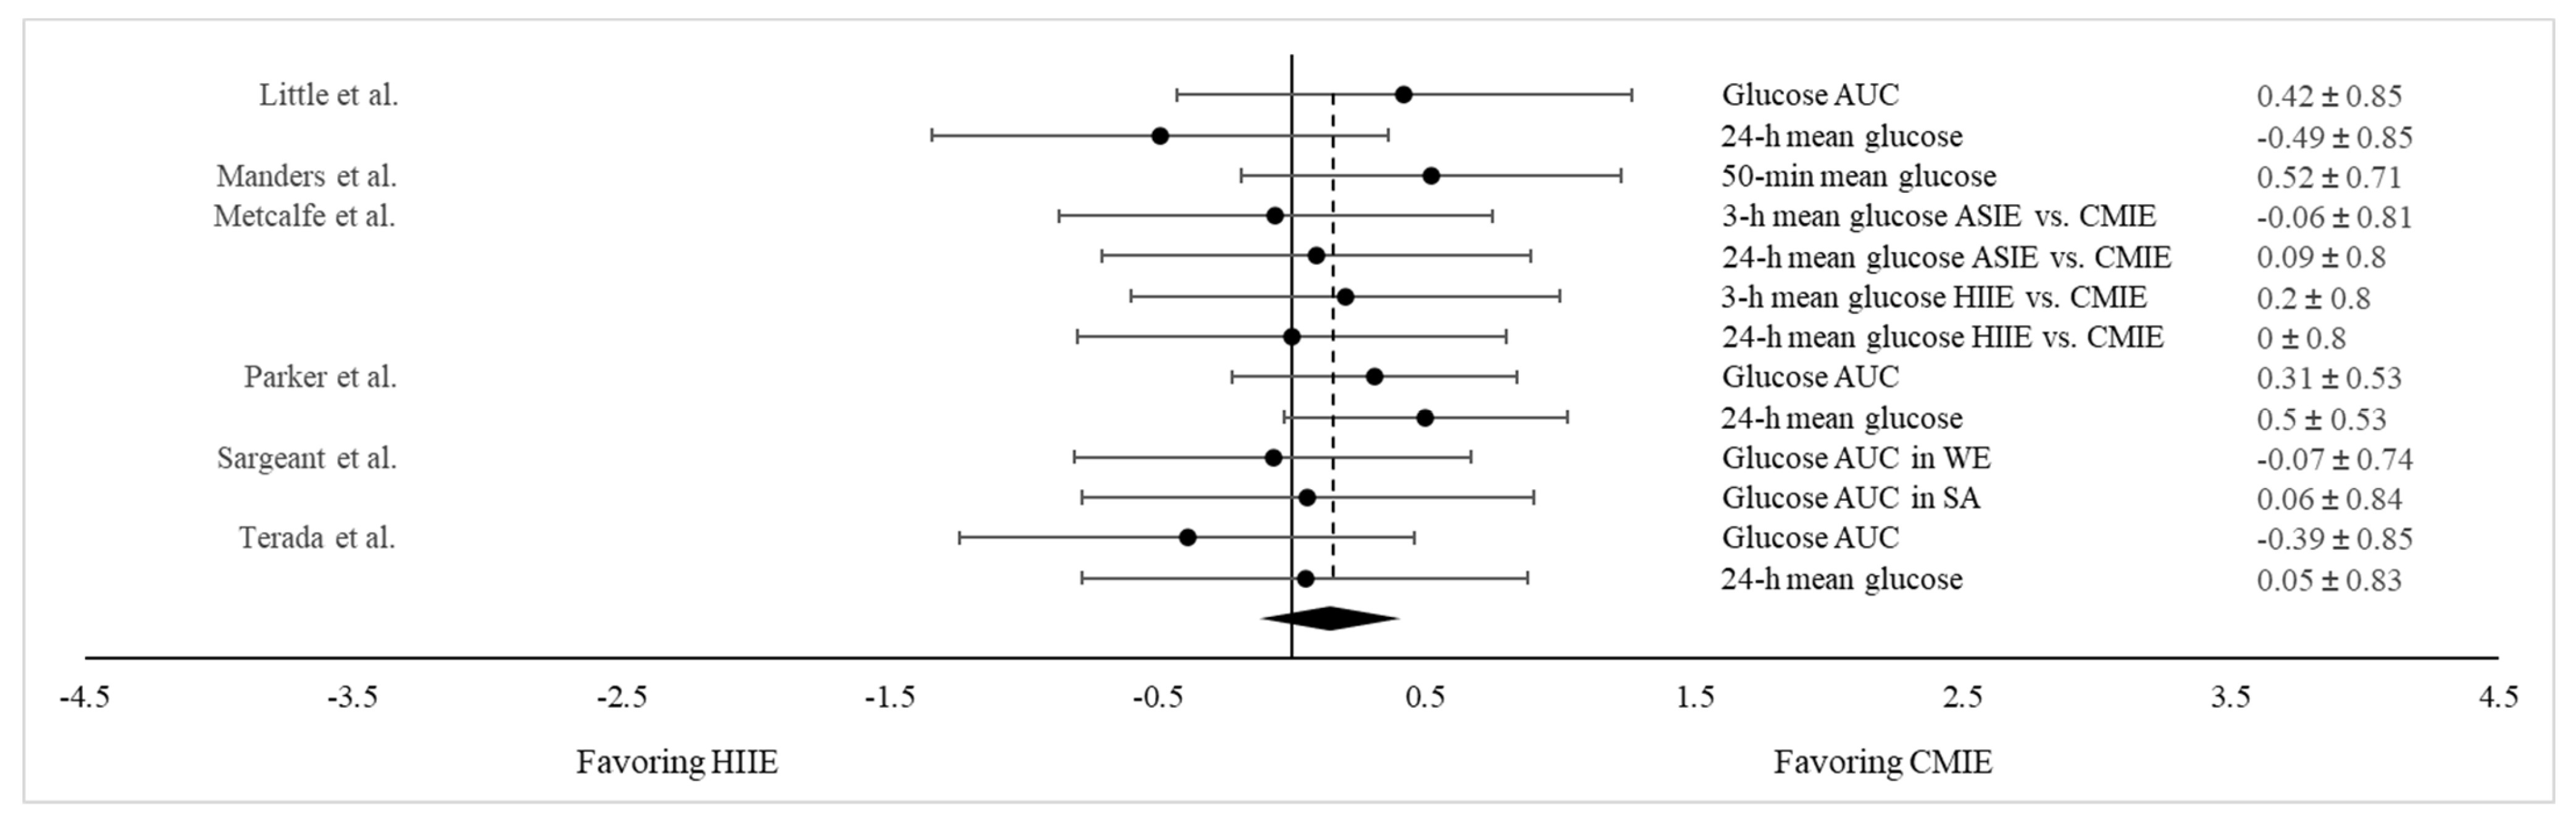
3.4.3. HIIE vs. CMIE on Both Post Prandial Glucose AUC and 24 h Mean Glucose Concentration

A separate meta-analysis was conducted to compare the glucose-lowering effect between HIIE and CMIE. This was accomplished by extracting results on the postprandial glucose AUC and the 24 h mean glucose concentration from the six studies that tested both the HIIE and CMIE protocols [32,52,54,60,62,63]. While all six studies measured the glucose AUC, five of them also assessed the 24 h mean glucose concentration following PPE. In addition, Metcalfe et al. [52] implemented two different HIIE protocols, and Sargeant et al. [63] examined exercise effects in participants from two different ethnic backgrounds separately. Consequently, a total of 13 pairs of data on both the postprandial glucose AUC and 24 h mean glucose concentrations were combined for comparison between HIIE and CMIE. As shown in Figure 4, there were no differences in glycemic responses between HIIE and CMIE (Hedge’s g = 0.152; SE = 0.104; 95% CI = −0.075, 0.397; p = 0.170). This finding suggests that both HIIE and CMIE are equally effective in mitigating postprandial hyperglycemia.

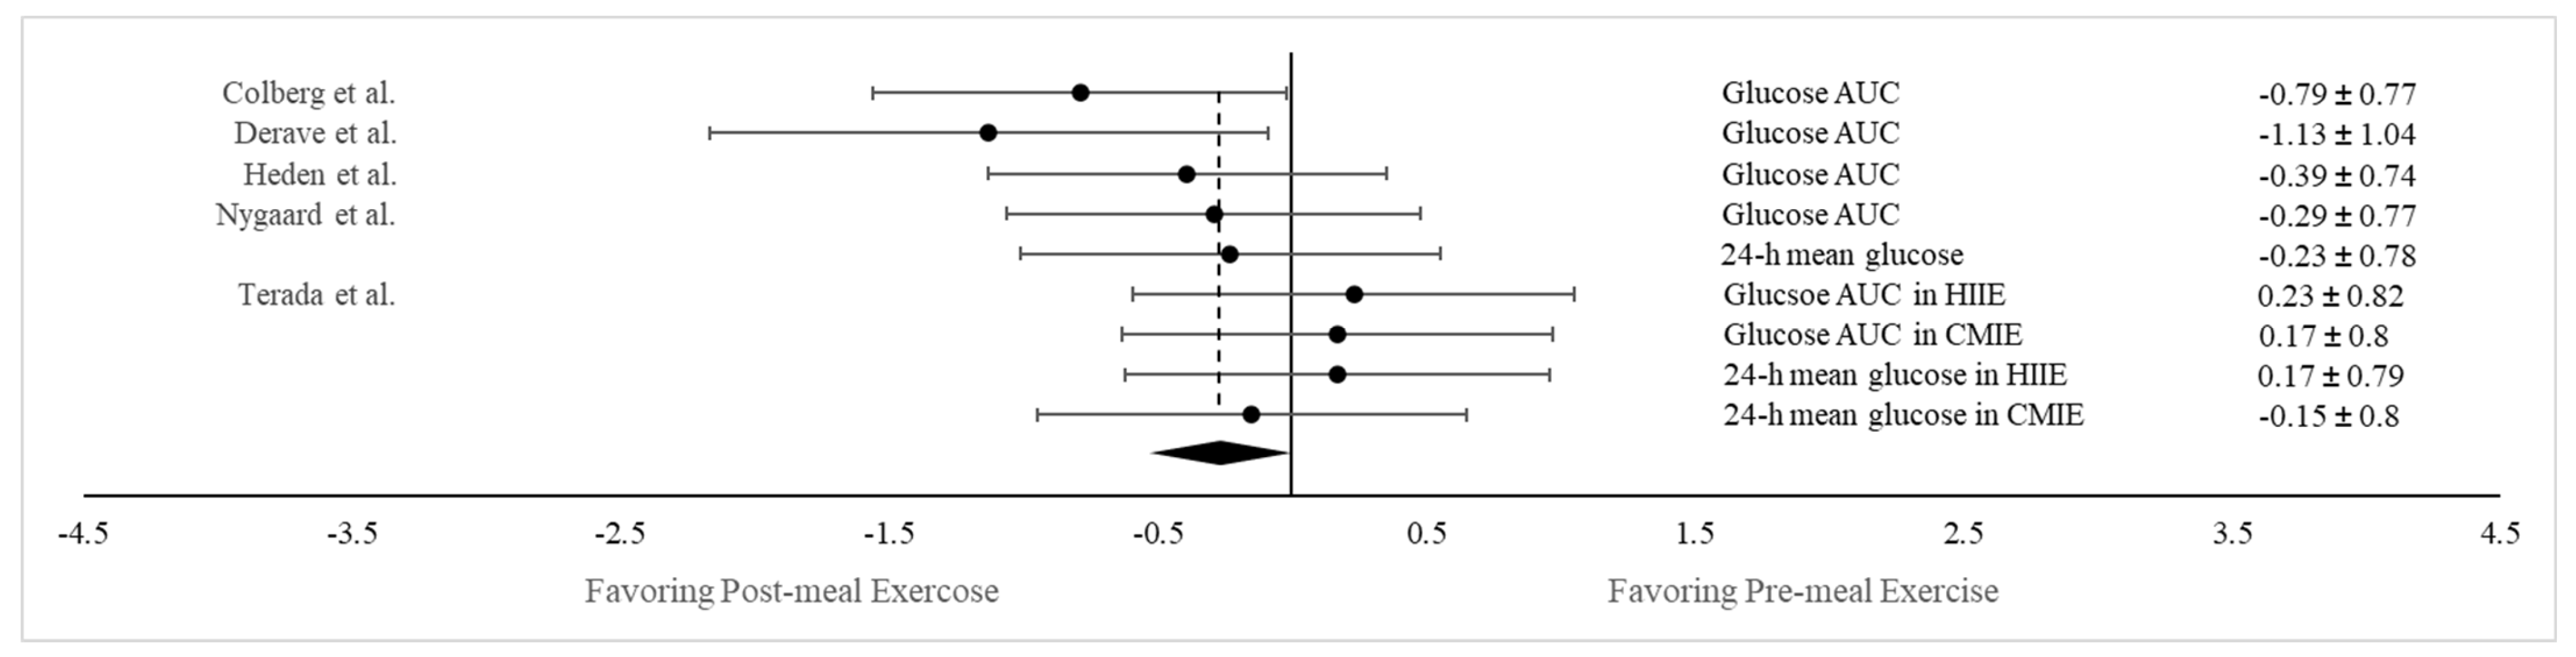
3.4.4. Postprandial vs. Pre-meal Exercise on Both Postprandial Glucose AUC and 24 h Mean Glucose Concentration

Overall, 5 of the 31 chosen studies also incorporated a pre-meal exercise trial in addition to PPE [26,28,54,57,61]. This allowed us to also compare the blood-lowering effect of exercise between the pre- and post-meal conditions in an aggregated manner. Of these five studies, two measured both the glucose AUC and the 24 h mean glucose concentration [54,61], and one of these two also employed two exercise conditions: HIIE and CMIE [54]. Hence, a total of nine pairs of data on both the glucose AUC and the 24 h mean glucose concentration were combined for comparison between the pre- and post-meal conditions. As shown in Figure 5, a significantly greater reduction in glycemic response was noted following PPE compared to the pre-meal condition (Hedges’ g = −0.271; SE = 0.072; 95% CI = −0.357, −0.085; p < 0.05), suggesting that engaging in PPE is more efficacious in attenuating postprandial hyperglycemia compared to exercising before a meal.

3.5. Subgroup Analyses

3.5.1. Results on Postprandial Glucose AUC

The 27 studies were further categorized according to (1) exercise duration (i.e., ≤30 min or >30 min), (2) exercise timing (i.e., <60 min or ≥60 min after meal), and (3) disease status (i.e., with or without T2DM). Such stratifications allow for a more precise understanding of how various factors may interact to influence metabolic outcomes of PPE. As shown in Table 3, the glucose-lowering effect was significantly less in the ≤30 min than the >30 min group (chi-square Q = 4.361, p < 0.05). However, the glucose-lowering effects were similar between PPE initiated <60 min and ≥60 min after a meal (chi-square Q = 0.044, p = 0.833) and between those with and without T2DM (chi-square Q = 1.194, p = 0.275) (Table 3).

3.5.2. Results on 24 h Mean Glucose Concentration

Another subgroup analysis was conducted on the 24 h mean glucose levels by classifying the 18 studies based on the same criteria mentioned above. Only a modest trend towards a greater reduction in 24 h mean glucose levels in the >30 min group than the ≤30 min group was observed (chi-square Q = 1.994, p = 0.158) (Table 3). However, notable differences emerged in terms of exercise timing and disease status. The glucose-lowering effect was significantly smaller following PPE initiated <60 min compared to ≥60 min after a meal (chi-square Q = 4.463, p < 0.05) (Table 3). Moreover, participants with T2D experienced a significantly greater reduction in glucose levels than those without T2D (chi-square Q = 4.104, p < 0.05) (Table 3).

4. Discussion

This review sought to quantitatively analyze the current literature surrounding the role PPE plays in mitigating meal-induced hyperglycemia in individuals who are overweight, obese, and have T2DM. Through combining multiple studies that have investigated the acute metabolic effects of PPE, a modest yet significant reduction in blood glucose response following PPE was detected in those with and without T2DM. The reduction was evident in both the postprandial glucose AUC, which quantifies the immediate glycemic response to PPE, and the 24 h mean glucose concentration, which provides a more comprehensive assessment of glycemic control. Taken together, these findings suggest that exercise post-meal can not only lead to a transitory reduction in postprandial glucose levels but also contribute to positive glycemic control throughout the day. The underlying mechanism for the glucose-lowering effect of PPE can be attributed to the muscular activity that occurs concurrently with the buildup of glucose in the blood from the meal. When this occurs, it stimulates both contraction- and insulin-mediated glucose uptake, thereby removing glucose from the bloodstream more effectively [20]. During this time period, the insulin-to-glucagon ratio is also elevated, which could further reduce blood glucose concentration by inhibiting hepatic glucose output [23].
Exercise protocols in studies demonstrating a significant reduction in postprandial glucose AUC or 24 h mean glucose concentrations following PPE exhibited wide variations in intensity, duration, and modality. These protocols can be broadly categorized as either more vigorous shorter-duration exercises or less intense exercises for a longer duration. While the majority of studies utilized treadmill walking and stationary cycling, the glucose-lowering effects of alternative exercises, including bodyweight exercises, exercises involving medicine balls or elastic bands, and daily activities such as stair climbing, gardening, and household tasks, have also been demonstrated. In general, higher-intensity exercises are more effective in enhancing cellular glucose uptake due to their high demand for glycogen [66,67,68]. However, this evidence may not directly apply in the context of PPE, where the overall exercise volume is relatively small. Characterizing a generalized dose–response relationship for PPE is challenging due to the diverse exercise protocols used in the selected studies. Regarding exercise duration, our subgroup analysis that involved dividing studies based on PPE of ≤30 min vs. >30 min revealed a significantly larger reduction in postprandial glucose AUC associated with exercise lasting more than 30 min. It appears that although PPE may take various intensities or forms, its glucose-lowering effect can be ensured or potentially maximized by maintaining a sufficient exercise duration (i.e., 30 min or longer).
There has been a growing interest in using HIIE following meals as a time-efficient approach to counter postprandial hyperglycemia, as HIIE has been shown to enhance glucose tolerance and insulin sensitivity [69,70,71]. Given the high-intensity nature of HIIE, incorporating it into a PPE should theoretically enhance glucose disposal into skeletal muscle, reducing meal-induced glucose responses. As part of our secondary analysis, we also compared the glucose-lowering effect between HIIE and CMIE from the six studies that attempted to examine the role a more time-efficient exercise protocol plays in mitigating postprandial hyperglycemia [32,52,54,60,62,63]. On average, the intensity and duration attained were ~90% VO2max and ~28 min, respectively, in HIIE and ~60% VO2max and ~45 min, respectively, in CMIE. Notwithstanding these disparities between HIIE and CMIE, a similarity was observed in their glucose-lowering effects (as measured by the postprandial glucose AUC and the 24 h mean glucose concentrations combined). This finding is consistent with an earlier review by Borror et al. [17] and suggests that the combination or interaction of intensity and duration or the total exercise volume are the most critical factors in determining the effectiveness of PPE. Caution should be used when interpreting the results on this issue, as only six studies were used for the comparison. One should also be cognizant that despite HIIE protocols being time-efficient, their intense nature could potentially increase hepatic glucose output and worsen postprandial hyperglycemia [72,73].
Another major aim of this review was to address the temporal optimization of exercise in relation to meal consumption. Knowing an ideal time frame when exercise should commence after a meal can help further increase the metabolic benefits from the same exercise. Our secondary analysis based on the five studies that implemented an exercise trial before and after a meal revealed a significantly larger glucose-lowering effect associated with exercise being carried out post-meal [26,28,54,57,61]. This finding agrees with many earlier reports suggesting that exercise undertaken postprandially confers better glycemic control than exercise initiated before a meal [18,24]. Pre-meal exercise may not be as effective in part because exercise in the postabsorptive state has been associated with more activated counterregulatory hormones such as glucagon and epinephrine, which trigger a greater hepatic glucose output [22].
When exploring the optimal timing for initiating PPE, the answer appears to diverge widely across the selected studies, ranging from 20 min to 150 min after a meal. Earlier studies involving healthy humans suggest that commencing exercise within 30–45 min after a meal is more effective in blunting postprandial hyperglycemia because it coincides more closely with the time when the blood glucose level reaches its peak [74,75,76]. However, based on our subgroup analysis of exercise timing post-meal, the reduction in glucose AUC appears unaffected by exercise timing, that is, whether postprandial exercise is initiated within the first hour after a meal or later, it remains equally effective in eliciting a transient reduction in blood glucose levels during the postprandial period. As for the 24 h mean glucose concentration, it demonstrated a significantly greater reduction following PPE initiated ≥60 min compared to <60 min after a meal. This review targeted individuals who were overweight, obese, and diagnosed with T2DM, and nearly 70% of the chosen studies involved patients with T2DM. It has been suggested that individuals with impaired insulin action may experience a more prolonged and higher peak in postprandial glucose levels between 60 and 90 min after a meal [77,78,79]. In this context, it appears that for individuals with T2DM or insulin resistance, engaging in PPE during the second hour after a meal may allow them to maximize the glucose-lowering benefit of exercise, particularly when seeking better glycemic control throughout the day.
Our subgroup analysis that involved categorizing participants by disease status revealed that patients with T2DM exhibited a significantly greater reduction in 24 h mean glucose concentrations in response to PPE when compared to those who are overweight and obese. This finding is consistent with an early clinical trial in which individuals with higher HbA1c levels (≥7%) experienced greater absolute reductions in blood glucose concentrations following PPE [34], and it underscores the critical role of incorporating PPE into daily glycemic control strategies, particularly for individuals with more severe metabolic disorders. Blood glucose levels tend to rise more after a meal in patients with diabetes compared to non-diabetic individuals [80]. This may explain why the greater glucose-lowering effect was seen in patients with T2DM, as higher plasma glucose concentrations have been correlated with greater cellular glucose uptake following exercise even when insulin levels remain unchanged [81]. As the majority of patients considered in this review received glucose-lowering medications or exogenous insulin during the study, it is plausible that these medical interventions may have additively interacted with the exercise regimen, contributing to the more pronounced reduction in blood glucose responses observed in diabetic participants.

5. Strengths and Limitations

This review was based on the most recent publications concerning the benefits of postprandial exercise and included studies that employed a randomized or counterbalanced crossover design. Aggregating data from studies sharing similar designs enabled a more precise assessment of the impact of postprandial exercise on blood glucose responses. Our analysis encompassed data on both post-meal glucose AUC and the 24 h mean glucose concentration, enhancing our comprehensive understanding of how PPE could influence glycemic control over an extended period of time. The inclusion of subgroup analysis considering exercise duration, exercise timing, and disease status also enabled us to more specifically explore how this exercise approach could be optimally implemented. Furthermore, the findings from this review have clinical applicability, as the study included participants who were at risk of developing T2DM or already diagnosed with the condition.
It should be noted that this study only evaluated the acute responses of exercise, so how postprandial exercise may affect glycemic control over time warrants further investigation. Given the highly diverse exercise protocols used in the selected studies, we cannot recommend a specific optimal intensity range. As a majority of the chosen studies utilized a once-daily exercise regimen, it remains uncertain whether the glucose-lowering impact of PPE would be heightened through multiple exercise sessions distributed across the day compared to a single exercise session of equal volume. The test meals used in the studies supplied sufficient calories (~500 kcal), yet they were higher in carbohydrates, which constituted an average of ~60% of the total caloric intake. Therefore, it is important to investigate how blood glucose may respond when PPE follows meals with diverse nutrient compositions, such as those high in fat or protein. Additionally, this review did not evaluate hyperglycemia prevalence, which may not always correlate with 24 h mean glucose concentrations [82,83].

6. Conclusions

This analytical study examined the acute impact of postprandial exercise on glycemic responses by incorporating evaluations of both the immediate post-meal glucose AUC and the 24 h mean glucose concentration and by targeting individuals who were overweight, obese, and diagnosed with T2D. The results of this review demonstrate that engaging in some forms of exercise following a meal is effective in mitigating postprandial hyperglycemia and assisting with daily glycemic control. The improved glycemic response observed in studies using diverse exercise protocols suggests that an exercise strategy aimed at reducing blood glucose response can be readily applied without being constrained by the availability of exercise equipment or the functional capacity of an individual, as long as the exercise duration is sufficient (i.e., >30 min). Although the reduction in glucose AUC following PPE seems less affected by exercise timing, for individuals with T2D or insulin resistance, initiating exercise after the first hour post-meal may be more efficacious in mitigating 24 h mean glucose response than exercising sooner. PPE led to a more pronounced reduction in 24 h mean glucose concentrations in patients with T2D than those without the condition, suggesting its potential as a potent glucose-lowering strategy for this population.

Author Contributions

Conceptualization—J.K., N.A.R., A.D.F. and J.A.B. Article search and screening—J.K. and B.M.F. Data extraction and analysis—J.K. and B.M.F. Writing, reviewing, and editing—J.K., B.M.F., N.A.R., A.D.F. and J.A.B. All authors have read and agreed to the published version of the manuscript.

Funding

This research received no external funding.

Institutional Review Board Statement

Not applicable.

Informed Consent Statement

Not applicable.

Data Availability Statement

Not applicable.

Conflicts of Interest

The authors declare no conflict of interest.

References

  1. Hanefeld, M.; Fischer, S.; Julius, U.; Schulze, J.; Schwanebeck, U.; Schmechel, H.; Ziegelasch, H.J.; Lindner, J. Risk factors for myocardial infarction and death in newly detected NIDDM: The Diabetes Intervention Study, 11-year follow-up. Diabetologia 1996, 39, 1577–1583. [Google Scholar] [CrossRef]
  2. Sievers, M.L.; Bennett, P.H.; Nelson, R.G. Effect of glycemia on mortality in Pima Indians with type 2 diabetes. Diabetes 1999, 48, 896–902. [Google Scholar] [CrossRef]
  3. Ceriello, A.; Hanefeld, M.; Leiter, L.; Monnier, L.; Moses, A.; Owens, D.; Tajima, N.; Tuomilehto, J. Postprandial glucose regulation and diabetic complications. Arch. Intern. Med. 2004, 164, 2090–2095. [Google Scholar] [CrossRef]
  4. Jackson, C.A.; Yudkin, J.S.; Forrest, R.D. A comparison of the relationships of the glucose tolerance test and the glycated haemoglobin assay with diabetic vascular disease in the community. The Islington Diabetes Survey. Diabetes Res. Clin. Pract. 1992, 17, 111–123. [Google Scholar] [CrossRef]
  5. de Vegt, F.; Dekker, J.M.; Ruhe, H.G.; Stehouwer, C.D.; Nijpels, G.; Bouter, L.M.; Heine, R.J. Hyperglycaemia is associated with all-cause and cardiovascular mortality in the Hoorn population: The Hoorn Study. Diabetologia 1999, 42, 926–931. [Google Scholar] [CrossRef]
  6. Meigs, J.B.; Nathan, D.M.; D’Agostino, R.B.; Wilson, P.W. Fasting and postchallenge glycemia and cardiovascular disease risk: The Framingham Offspring Study. Diabetes Care 2002, 25, 1845–1850. [Google Scholar] [CrossRef]
  7. Mah, E.; Bruno, R.S. Postprandial hyperglycemia on vascular endothelial function: Mechanisms and consequences. Nutr. Res. 2012, 32, 727–740. [Google Scholar] [CrossRef]
  8. Holman, R.R.; Thorne, K.I.; Farmer, A.J.; Davies, M.J.; Keenan, J.F.; Paul, S.; Levy, J.C.; 4-T Study Group. Addition of biphasic, prandial, or basal insulin to oral therapy in type 2 diabetes. N. Engl. J. Med. 2007, 357, 1716–1730. [Google Scholar] [CrossRef]
  9. Hanefeld, M.; Cagatay, M.; Petrowitsch, T.; Neuser, D.; Petzinna, D.; Rupp, M. Acarbose reduces the risk for myocardial infarction in type 2 diabetic patients: Meta-analysis of seven long-term studies. Eur. Heart J. 2004, 25, 10–16. [Google Scholar] [CrossRef]
  10. Devlin, J.T.; Hirshman, M.; Horton, E.D.; Horton, E.S. Enhanced peripheral and splanchnic insulin sensitivity in NIDDM men after single bout of exercise. Diabetes 1987, 36, 434–439. [Google Scholar] [CrossRef]
  11. Fenicchia, L.M.; Kanaley, J.A.; Azevedo, J.L.; Miller, C.S.; Weinstock, R.S.; Carhart, R.L.; Ploutz-Snyder, L.L. Influence of resistance exercise training on glucose control in women with type 2 diabetes. Metabolism 2004, 53, 284–289. [Google Scholar] [CrossRef]
  12. Praet, S.F.; Manders, R.J.; Lieverse, A.G.; Kuipers, H.; Stehouwer, C.D.; Keizer, H.A.; van Loon, L.J.C. Influence of acute exercise on hyperglycemia in insulin-treated Type 2 diabetes. Med. Sci. Sports Exerc. 2006, 38, 2037–2044. [Google Scholar] [CrossRef]
  13. Garcia-Roves, P.M.; Han, D.H.; Song, Z.; Jones, T.E.; Hucker, K.A.; Holloszy, J.O. Prevention of glycogen supercompensation prolongs the increase in muscle GLUT4 after exercise. Am. J. Physiol. Endocrinol. Metab. 2003, 285, E729–E736. [Google Scholar] [CrossRef]
  14. Pencek, R.R.; Fueger, P.T.; Camacho, R.C.; Wasserman, D.H. Mobilization of glucose from the liver during exercise and replenishment afterward. Can. J. Appl. Physiol. 2005, 30, 292–303. [Google Scholar] [CrossRef]
  15. Price, T.B.; Rothman, D.L.; Shulman, R.G. NMR of glycogen in exercise. Proc. Nutr. Soc. 1999, 58, 851–859. [Google Scholar] [CrossRef]
  16. Bisquolo, V.A.; Cardoso, C.G.; Ortega, K.C.; Gusmao, J.L.; Tinucci, T.; Negrao, C.E.; Wajchenberg, B.L.; Mion, D.; Forjaz, C.L. Previous exercise attenuates muscle sympathetic activity and increases blood flow during acute euglycemic hyperinsulinemia. J. Appl. Physiol. 2005, 98, 866–871. [Google Scholar] [CrossRef]
  17. Borror, A.; Zieff, G.; Battaglini, C.; Stoner, L. The effects of postprandial exercise on glucose control in individuals with type 2 diabetes: A systematic review. Sports Med. 2018, 48, 1479–1491. [Google Scholar] [CrossRef]
  18. Kanaley, J.A.; Colberg, S.R.; Corcoran, M.H.; Malin, S.K.; Rodriguez, N.R.; Crespo, C.J.; Kirwan, J.P.; Zierath, J.R. Exercise/Physical Activity in Individuals with Type 2 Diabetes: A Consensus Statement from the American College of Sports Medicine. Med. Sci. Sports Exerc. 2022, 54, 353–368. [Google Scholar] [CrossRef]
  19. Colberg, S.R.; Sigal, R.J.; Fernhall, B.; Regensteiner, J.G.; Blissmer, B.J.; Rubin, R.R.; Chasan-Taber, L.; Albright, A.L.; Braun, B. American College of Sports Medicine, American Diabetes Association. Exercise and type 2 diabetes: The American College of Sports Medicine and the American Diabetes Association: Joint position statement. Diabetes Care 2010, 33, e147–e167. [Google Scholar] [CrossRef]
  20. Goodyear, L.J.; Chang, P.Y.; Sherwood, D.J.; Dufresne, S.D.; Moller, D.E. Effects of exercise and insulin on mitogen-activated protein kinase signaling pathways in rat skeletal muscle. Am. J. Physiol. Metab. 1996, 271, E403–E408. [Google Scholar] [CrossRef] [PubMed]
  21. Poirier, P.; Mawhinney, S.; Grondin, L.; Tremblay, A.; Broderick, T.; and Cléroux, J.; Catellier, C.; Tancrède, G.; Nadeau, A. Prior meal enhances the plasma glucose lowering effect of exercise in type 2 diabetes. Med. Sci. Sports Exerc. 2001, 33, 1259–1264. [Google Scholar] [CrossRef] [PubMed]
  22. Kowalski, G.M.; Moore, S.M.; Hamley, S.; Selathurai, A.; Bruce, C.R. The effect of ingested glucose dose on the suppression of endogenous glucose production in humans. Diabetes 2017, 66, 2400–2406. [Google Scholar] [CrossRef] [PubMed]
  23. Chacko, E. A time for exercise: The exercise window. J. Appl. Physiol. 2017, 122, 206–209. [Google Scholar] [CrossRef]
  24. Haxhi, J.; Scotto, D.P.A.; Sacchetti, M. Exercising for metabolic control: Is timing important? Ann. Nutr. Metab. 2013, 62, 14–25. [Google Scholar] [CrossRef] [PubMed]
  25. Teo, S.Y.; Kanaley, J.A.; Guelfi, K.J.; Cook, S.B.; Hebert, J.J.; Forrest, M.R.; Fairchild, T.J. Exercise timing in type 2 diabetes mellitus: A systematic review. Med. Sci. Sports Exerc. 2018, 50, 2387–2397. [Google Scholar] [CrossRef] [PubMed]
  26. Colberg, S.R.; Zarrabi, L.; Bennington, L.; Nakave, A.; Somma, C.T.; Swain, D.P.; Sechrist, S.R. Postprandial walking is better for lowering the glycemic effect of dinner than pre-dinner exercise in type 2 diabetic individuals. J. Am. Med. Dir. Assoc. 2009, 10, 394–397. [Google Scholar] [CrossRef]
  27. Gaudet-Savard, T.; Ferland, A.; Broderick, T.L.; Garneau, C.; Tremblay, A.; Nadeau, A.; Poirier, P. Safety and magnitude of changes in blood glucose levels following exercise performed in the fasted state and the postprandial state in men with type 2 diabetes. Eur. J. Cardiovasc. Prev. Rehabil. 2007, 14, 831–836. [Google Scholar] [CrossRef]
  28. Heden, T.D.; Winn, N.C.; Mari, A.; Booth, F.W.; Rector, R.S.; Thyfault, J.P.; Kanaley, J.A. Postdinner resistance exercise improves postprandial risk factors more effectively than predinner resistance exercise in patients with type 2 diabetes. J. Appl. Physiol. 2015, 118, 624–634. [Google Scholar] [CrossRef]
  29. Gillen, J.B.; Little, J.P.; Punthakee, Z.; Tarnopolsky, M.A.; Riddell, M.C.; Gibala, M.J. Acute high-intensity interval exercise reduces the postprandial glucose response and prevalence of hyperglycaemia in patients with type 2 diabetes. Diabetes Obes. Metab. 2012, 14, 575–577. [Google Scholar] [CrossRef]
  30. Honda, H.; Igaki, M.; Hatanaka, Y.; Komatsu, M.; Tanaka, S.-I.; Miki, T.; Suzuki, T.; Takaishi, T.; Hayashi, T. Stair climbing/descending exercise for a short time decreases blood glucose levels after a meal in people with type 2 diabetes. BMJ Open Diabetes Res. Care 2016, 4, e000232. [Google Scholar] [CrossRef]
  31. Honda, H.; Igaki, M.; Komatsu, M.; Tanaka, S.-I.; Takaishi, T.; Hayashi, T. Stair climbing-descending exercise following meals improves 24-hour glucose excursions in people with type 2 diabetes. J. Phys. Fit. Sports Med. 2021, 10, 51–56. [Google Scholar] [CrossRef]
  32. Mendes, R.; Sousa, N.; Themudo-Barata, J.L.; Reis, V.M. High-Intensity Interval Training Versus Moderate-Intensity Continuous Training in Middle-Aged and Older Patients with Type 2 Diabetes: A Randomized Controlled Crossover Trial of the Acute Effects of Treadmill Walking on Glycemic Control. Int. J. Environ. Res. Public Health 2019, 16, 4163. [Google Scholar] [CrossRef] [PubMed]
  33. Moreira, S.R.; Simões, G.C.; Moraes, J.F.V.N.; Motta, D.F.; Campbell, C.S.G.; Simões, H.G. Blood glucose control for individuals with type-2 diabetes: Acute effects of resistance exercise of lower cardiovascular-metabolic stress. J. Strength Cond. Res. 2012, 26, 2806–2811. [Google Scholar] [CrossRef] [PubMed]
  34. van Dijk, J.-W.; Manders, R.J.F.; Canfora, E.E.; Van Mechelen, W.; Hartgens, F.; Stehouwer, C.D.A.; Van Loon, L.J.C. Exercise and 24-h glycemic control: Equal effects for all type 2 diabetes patients? Med. Sci. Sports Exerc. 2013, 45, 628–635. [Google Scholar] [CrossRef]
  35. van Dijk, J.-W.; Manders, R.J.F.; Tummers, K.; Bonomi, A.G.; Stehouwer, C.D.A.; Hartgens, F.; van Loon, L.J.C. Both resistance- and endurance-type exercise reduce the prevalence of hyperglycaemia in individuals with impaired glucose tolerance and in insulin-treated and non-insulin-treated type 2 diabetic patients. Diabetologia 2012, 55, 1273–1282. [Google Scholar] [CrossRef]
  36. van Dijk, J.-W.; Tummers, K.; Stehouwer, C.D.A.; Hartgens, F.; van Loon, L.J.C. Exercise therapy in type 2 diabetes: Is daily exercise required to optimize glycemic control? Diabetes Care 2012, 35, 948–954. [Google Scholar] [CrossRef]
  37. Erickson, M.L.; Little, J.P.; Gay, J.L.; McCully, K.K.; Jenkins, N.T. Postmeal exercise blunts postprandial glucose excursions in people on metformin monotherapy. J. Appl. Physiol. 2017, 123, 444–450. [Google Scholar] [CrossRef]
  38. Li, Z.; Hu, Y.; Yan, R.; Li, H.; Zhang, D.; Li, F.; Su, X.; Ma, J. Twenty Minute Moderate-Intensity Post-Dinner Exercise Reduces the Postprandial Glucose Response in Chinese Patients with Type 2 Diabetes. Med. Sci. Monit. 2018, 24, 7170–7177. [Google Scholar] [CrossRef]
  39. Zhang, X.; Wongpipit, W.; Sun, F.; Sheridan, S.; Huang, W.Y.J.; Sit, C.H.P.; Wong, S.H.S. Walking Initiated 20 Minutes before the Time of Individual Postprandial Glucose Peak Reduces the Glucose Response in Young Men with Overweight or Obesity: A Randomized Crossover Study. J. Nutr. 2021, 151, 866–875. [Google Scholar] [CrossRef]
  40. Moher, D.; Liberati, A.; Tetzlaff, J.; Altman, D.G.; PRISMA Group. Preferred reporting items for systematic reviews and meta-analyses: The PRISMA statement. PLoS Med. 2009, 6, e1000097. [Google Scholar] [CrossRef]
  41. Freckmann, G.; Hagenlocher, S.; Baumstark, A.; Jendrike, N.; Gillen, R.C.; Rössner, K.; Haug, C. Continuous glucose profiles in healthy subjects under everyday life conditions and after different meals. J. Diabetes Sci. Technol. 2007, 1, 695–703. [Google Scholar] [CrossRef]
  42. Uemura, M.; Yano, Y.; Suzuki, T.; Yasuma, T.; Sato, T.; Morimoto, A.; Hosoya, S.; Suminaka, C.; Nakajima, H.; Gabazza, E.C.; et al. Comparison of Glucose Area Under the Curve Measured Using Minimally Invasive Interstitial Fluid Extraction Technology with Continuous Glucose Monitoring System in Diabetic Patients. Diabetes Metab. J. 2017, 41, 265–274. [Google Scholar] [CrossRef]
  43. Higgins, J.P.T.; Thomas, J.; Chandler, J.; Cumpston, M.; Li, T.; Page, M.; Welch, V. Cochrane Handbook for Systematic Reviews of Interventions, 2nd ed.; John Wiley & Sons: Chichester, UK, 2019. [Google Scholar]
  44. Grissom, R.J.; Kim, J.J. Effect Sizes for Research: A Broad Practical Approach; Lawrence Erlbaum Associates Publishers: Mahwah, NJ, USA, 2005. [Google Scholar]
  45. Higgins, J.P.; Thompson, S.G.; Deeks, J.J.; Altman, D.G. Measuring inconsistency in meta-analyses. BMJ 2003, 327, 557–560. [Google Scholar] [CrossRef]
  46. Egger, M.; Smith, G.D.; Schneider, M.; Minder, C. Bias in meta-analysis detected by a simple, graphical test. BMJ 1997, 315, 629–634. [Google Scholar] [CrossRef] [PubMed]
  47. Bellini, A.; Nicolò, A.; Bulzomì, R.; Bazzucchi, I.; Sacchetti, M. The Effect of Different Postprandial Exercise Types on Glucose Response to Breakfast in Individuals with Type 2 Diabetes. Nutrients 2021, 13, 1440. [Google Scholar] [CrossRef]
  48. Haxhi, J.; Leto, G.; di Palumbo, A.S.; Sbriccoli, P.; Guidetti, L.; Fantini, C.; Buzzetti, R.; Caporossi, D.; Luigi, L.D.; Sacchetti, M. Exercise at lunchtime: Effect on glycemic control and oxidative stress in middle-aged men with type 2 diabetes. Eur. J. Appl. Physiol. 2016, 116, 573–582. [Google Scholar] [CrossRef]
  49. Larsen, J.J.; Dela, F.; Kjaer, M.; Galbo, H. The effect of moderate exercise on postprandial glucose homeostasis in NIDDM patients. Diabetologia 1997, 40, 447–453. [Google Scholar] [CrossRef]
  50. Larsen, J.J.; Dela, F.; Madsbad, S.; Galbo, H. The effect of intense exercise on postprandial glucose homeostasis in type II diabetic patients. Diabetologia 1999, 42, 1282–1292. [Google Scholar] [CrossRef] [PubMed]
  51. Manders, R.J.F.; van Dijk, J.-W.M.; van Loon, L.J.C. Low-intensity exercise reduces the prevalence of hyperglycemia in type 2 diabetes. Med. Sci. Sports Exerc. 2010, 42, 219–225. [Google Scholar] [CrossRef] [PubMed]
  52. Metcalfe, R.S.; Fitzpatrick, B.; Fitzpatrick, S.; McDermott, G.; Brick, N.; McClean, C.; Davison, G.W. Extremely short duration interval exercise improves 24-h glycaemia in men with type 2 diabetes. Eur. J. Appl. Physiol. 2018, 118, 2551–2562. [Google Scholar] [CrossRef]
  53. Rasmussen, B.M.; Christiansen, C.; Rasmussen, O.W.; Hansen, C.; Hermansen, K. Alcohol and postexercise metabolic responses in type 2 diabetes. Metabolism 1999, 48, 597–602. [Google Scholar] [CrossRef]
  54. Terada, T.; Wilson, B.J.; Myette-Côté, E.; Kuzik, N.; Bell, G.J.; McCargar, L.J.; Boulé, N.G. Targeting specific interstitial glycemic parameters with high-intensity interval exercise and fasted-state exercise in type 2 diabetes. Metabolism 2016, 65, 599–608. [Google Scholar] [CrossRef] [PubMed]
  55. van Dijk, J.-W.; Venema, M.; van Mechelen, W.; Stehouwer, C.D.A.; Hartgens, F.; van Loon, L.J.C. Effect of moderate-intensity exercise versus activities of daily living on 24-hour blood glucose homeostasis in male patients with type 2 diabetes. Diabetes Care 2013, 36, 3448–3453. [Google Scholar] [CrossRef] [PubMed]
  56. Carrillo-Arango, H.A.; Atencio-Osorio, M.A.; López-Álban, C.A.; Nava-González, E.J.; Correa-Rodríguez, M.; Izquierdo, M.; Ramírez-Vélez, R. Metabolic responses to acute sprint interval exercise training performed after an oral 75-gram glucose load in individuals with overweight/obesity. Physiol. Rep. 2023, 11, e15555. [Google Scholar] [CrossRef]
  57. Derave, W.; Mertens, A.; Muls, E.; Pardaens, K.; Hespel, P. Effects of post-absorptive and postprandial exercise on glucoregulation in metabolic syndrome. Obesity 2007, 15, 704–711. [Google Scholar] [CrossRef] [PubMed]
  58. DiPietro, L.; Gribok, A.; Stevens, M.S.; Hamm, L.F.; Rumpler, W. Three 15-min bouts of moderate postmeal walking significantly improves 24-h glycemic control in older people at risk for impaired glucose tolerance. Diabetes Care 2013, 36, 3262–3268. [Google Scholar] [CrossRef]
  59. Kong, Z.; Shi, Q.; Sun, S.; Tong, T.K.; Zhang, H.; Nie, J. High-intensity interval exercise lowers postprandial glucose concentrations more in obese adults than lean adults. Prim. Care Diabetes 2019, 13, 568–573. [Google Scholar] [CrossRef]
  60. Little, J.P.; Jung, M.E.; Wright, A.E.; Wright, W.; Manders, R.J.F. Effects of high-intensity interval exercise versus continuous moderate-intensity exercise on postprandial glycemic control assessed by continuous glucose monitoring in obese adults. Appl. Physiol. Nutr. Metab. 2014, 39, 835–841. [Google Scholar] [CrossRef]
  61. Nygaard, H.; Rønnestad, B.R.; Hammarström, D.; Holmboe-Ottesen, G.; Høstmark, A.T. Effects of Exercise in the Fasted and Postprandial State on Interstitial Glucose in Hyperglycemic Individuals. J. Sports Sci. Med. 2017, 16, 254–263. [Google Scholar]
  62. Parker, L.; Shaw, C.S.; Banting, L.; Levinger, I.; Hill, K.M.; McAinch, A.J.; Stepto, N.K. Acute Low-Volume High-Intensity Interval Exercise and Continuous Moderate-Intensity Exercise Elicit a Similar Improvement in 24-h Glycemic Control in Overweight and Obese Adults. Front. Physiol. 2017, 7, 661. [Google Scholar] [CrossRef]
  63. Sargeant, J.A.; Jelleyman, C.; Coull, N.A.; Edwardson, C.L.; Henson, J.; King, J.A.; Khunti, K.; McCarthy, M.; Rowlands, A.V.; Stensel, D.J.; et al. Improvements in Glycemic Control After Acute Moderate-Intensity Continuous or High-Intensity Interval Exercise Are Greater in South Asians Than White Europeans with Nondiabetic Hyperglycemia: A Randomized Crossover Study. Diabetes Care 2021, 44, 201–209. [Google Scholar] [CrossRef] [PubMed]
  64. Shambrook, P.; Kingsley, M.I.; Taylor, N.F.; Wundersitz, D.W.; Wundersitz, C.E.; Paton, C.D.; Gordon, B.A. A comparison of acute glycaemic responses to accumulated or single bout walking exercise in apparently healthy, insufficiently active adults. J. Sci. Med. Sport 2020, 23, 902–907. [Google Scholar] [CrossRef] [PubMed]
  65. Xu, L.; Tian, Z.; Chen, H.; Zhao, Y.; Yang, Y. Anthocyanins, Anthocyanin-Rich Berries, and Cardiovascular Risks: Systematic Review and Meta-Analysis of 44 Randomized Controlled Trials and 15 Prospective Cohort Studies. Front Nutr. 2021, 8, 747884. [Google Scholar] [CrossRef] [PubMed]
  66. Roberts, C.K.; Little, J.P.; Thyfault, J.P. Modification of insulin sensitivity and glycemic control by activity and exercise. Med. Sci. Sports Exerc. 2013, 45, 1868–1877. [Google Scholar] [CrossRef] [PubMed]
  67. Marliss, E.B.; Vranic, M. Intense exercise has unique effects on both insulin release and its roles in glucoregulation: Implications for diabetes. Diabetes 2002, 51 (Suppl. S1), S271–S283. [Google Scholar] [CrossRef]
  68. Jensen, J.; Rustad, P.I.; Kolnes, A.J.; Lai, Y.C. The role of skeletal muscle glycogen breakdown for regulation of insulin sensitivity by exercise. Front Physiol. 2011, 2, 112. [Google Scholar] [CrossRef]
  69. Gibala, M.J.; Little, J.P.; MacDonald, M.J.; Hawley, J.A. Physiological adaptations to low-volume, high-intensity interval training in health and disease. J. Physiol. 2012, 590, 1077–1084. [Google Scholar] [CrossRef]
  70. Dunstan, D.W.; Daly, R.M.; Owen, N.; Jolley, D.; De Courten, M.; Shaw, J.; Zimmet, P. High-intensity resistance training improves glycemic control in older patients with type 2 diabetes. Diabetes Care 2002, 25, 1729–1736. [Google Scholar] [CrossRef]
  71. Weston, K.S.; Wisløff, U.; Coombes, J.S. High-intensity interval training in patients with lifestyle-induced cardiometabolic disease: A systematic review and meta-analysis. Br. J. Sports Med. 2014, 48, 1227–1234. [Google Scholar] [CrossRef]
  72. Gibala, M.J.; Little, J.P. Physiological basis of brief vigorous exercise to improve health. J. Physiol. 2020, 598, 61–69. [Google Scholar] [CrossRef]
  73. Little, J.P.; Francois, M.E. High-intensity interval training for improving postprandial hyperglycemia. Res. Q. Exerc. Sport 2014, 85, 451–456. [Google Scholar] [CrossRef]
  74. Bellini, A.; Nicolò, A.; Bazzucchi, I.; Sacchetti, M. Effects of Different Exercise Strategies to Improve Postprandial Glycemia in Healthy Individuals. Med. Sci. Sports Exerc. 2021, 53, 1334–1344. [Google Scholar] [CrossRef] [PubMed]
  75. Bellini, A.; Nicolò, A.; Bazzucchi, I.; Sacchetti, M. The Effects of Postprandial Walking on the Glucose Response after Meals with Different Characteristic. Nutrients 2022, 14, 1080. [Google Scholar] [CrossRef]
  76. Hatamoto, Y.; Goya, R.; Yamada, Y.; Yoshimura, E.; Nishimura, S.; Higaki, Y.; Tanaka, H. Effect of exercise timing on elevated postprandial glucose levels. J. Appl. Physiol. 2017, 123, 278–284. [Google Scholar] [CrossRef] [PubMed]
  77. Daenen, S.; Sola-Gazagnes, A.; M’Bemba, J.; Dorange-Breillard, C.; Defer, F.; Elgrably, F.; Larger, E.; Slama, G. Peak-time determination of post-meal glucose excursions in insulin-treated diabetic patients. Diabetes Metab. 2010, 36, 165–169. [Google Scholar] [CrossRef] [PubMed]
  78. Ben-Haroush, A.; Yogev, Y.; Chen, R.; Rosenn, B.; Hod, M.; Langer, O. The postprandial glucose profile in the diabetic pregnancy. Am. J. Obstet. Gynecol. 2004, 191, 576–581. [Google Scholar] [CrossRef]
  79. Kahn, B.B.; Flier, J.S. Obesity and insulin resistance. J. Clin. Invest. 2000, 106, 473–481. [Google Scholar] [CrossRef]
  80. Hershon, K.S.; Hirsch, B.R.; Odugbesan, O. Importance of Postprandial Glucose in Relation to A1C and Cardiovascular Disease. Clin. Diabetes 2019, 37, 250–259. [Google Scholar] [CrossRef]
  81. Rose, A.J.; Richter, E.A. Skeletal muscle glucose uptake during exercise: How is it regulated? Physiology 2005, 20, 260–270. [Google Scholar] [CrossRef]
  82. Pistrosch, F.; Natali, A.; Hanefeld, M. Is hyperglycemia a cardiovascular risk factor? Diabetes Care 2011, 34 (Suppl. S2), S128–S131. [Google Scholar] [CrossRef]
  83. van Dijk, J.-W.; Manders, R.J.F.; Hartgens, F.; Stehouwer, C.D.; Praet, S.F.E.; van Loon, L.J.C. Postprandial hyperglycemia is highly prevalent throughout the day in type 2 diabetes patients. Diabetes Res. Clin. Pract. 2011, 93, 31–37. [Google Scholar] [CrossRef] [PubMed]
Figure 1. PRISMA Flow diagram illustrating the selection process for articles included in this systematic review and meta-analysis.
Nutrients 15 04489 g001
Figure 2. Forest plot showing comparisons of glucose AUC between PPE and CON. The X-axis denotes the effect size derived from the random-effect meta-analysis. The data in the center-right column specify the conditions under which PPE and CON were compared, while the far-right column provides the effect size and 95% confidence interval (CI) for each comparison. The diamond at the bottom represents the pooled effect size (Hedge’s g = −0.317; SE = 0.057; 95% CI = −0.432, −0.201; p < 0.001) based on all the studies combined.
Nutrients 15 04489 g002
Figure 3. Forest plot showing comparisons of 24 h mean glucose concentrations between PPE and CON. The X-axis denotes effect size derived from the random-effect meta-analysis. The data in the center-right column specify the conditions under which PPE and CON were compared, while the far-right column provides the effect size and 95% confidence interval (CI) for each comparison. The diamond at the bottom represents the pooled effect size (Hedge’s g = −0.328; SE = 0.062; 95% CI = −0.453, −0.203; p < 0.001) based on all the studies combined.
Nutrients 15 04489 g003
Figure 4. Forest plot showing comparisons of glycemic responses (as measured by both the glucose AUC and the 24 h mean glucose level between HIIE and CMIE). The X-axis denotes effect size derived from the random-effect meta-analysis. The data in the center-right column specify the conditions under which PPE and CON were compared, while the far-right column provides the effect size and 95% confidence interval (CI) for each comparison. The diamond at the bottom represents the pooled effect size (Hedge’s g = 0.152; SE = 0.104; 95% CI = −0.075, 0.397; p = 0.170) based on all the studies combined.
Nutrients 15 04489 g004
Figure 5. Forest plot showing comparisons of glycemic responses (as measured by both the glucose AUC and the 24 h mean glucose level between pre-meal and post-meal exercise conditions). The X-axis denotes effect size derived from the random-effect meta-analysis. The data in the center-right column specify the conditions under which PPE and CON were compared, while the far-right column provides the effect size and 95% confidence interval (CI) for each comparison. The diamond at the bottom represents the pooled effect size (Hedges’ g = −0.271; SE = 0.072; 95% CI = −0.357, −0.085; p < 0.05) based on all the studies combined.
Nutrients 15 04489 g005
Table 1. Experimental characteristics of the included studies (n = 31) involving overweight (OW) individuals and individuals with obesity (OB) and type II diabetes (T2DM).
StudiesParticipant CharacteristicsPPE ProtocolsTest MealsOutcome VariablesMajor Findings
Authors (Year)N (Sex)Age (Year)BMI (kg/m2)Disease Status (Fasting Glucose)Exercise Mode and IntensityExercise DurationExercise Timing Post-MealCaloric Intake (Kcal)% Energy from CHO
Bellini et al. [47]86332T2DM (HbA1c: 7.0%)
  • AE: Walking at 100 steps/min
  • RE: A circuits of 5 exercises w/medicine ball and elastic band
  • AE: 30 min
  • RE: 15 min
~30 min310/meal663 h mean glucose concentration 3 h mean glucose ↓ in AE or RE than CON
Carrillo-Arango et al. [56]33 (24 M/9 F)3329OW/OB (FG: 85 mg/dL)8 30 s all-out cycling at 90–95% HRmax with 1 min rest period between bouts12 min~90 min300/meal1003 h glucose AUC3 h glucose AUC ↔ between PPE and CON
Colberg et al. [26]12 (6 M/6 F)6135T2DM (HbA1c: 7.0%)Walking at 40% HHR20 min15–20 min400–450/mealMixed4 h glucose AUC4 h glucose AUC ↔ between PPE and CON
Derave et al. [57]7 (7 M)4534OB (FG: 90 mg/dL)Cycling at 60% VO2max 45 min~60 min516/meal823 h glucose iAUC3 h glucose iAUC ↔ between PPE and CON
DiPietro et al. [58]106930OB (FG: 105–125 mg/dL)Walking at 3 METs for 15 min after each meal45 min~30 min32/kg/day533 h mean glucose concentration; 24 h glucose AUC3 h mean glucose ↓ in PPE than CON; 24 h glucose AUC ↓ in PPE than CON
Erickson et al. [37]10 (2 M/8 F)5734T2DM (HbA1c: 6.3%)5 10 min cycling at 60% VO2max with 3 min rest between bouts 50 min<30 min600–1000/meal652 h glucose AUC; 24 h mean glucose concentration2 h glucose AUC ↓ in PPE than CON; 24 h mean glucose ↔ between PPE and CON
Gillen et al. [29]76231T2DM (HbA1c: 6.9%)10 1 min cycling at 85% HRmax with 1 min rest between bouts10 min ~90 min1704/day522 h mean glucose concentration; 24 h mean glucose concentration2 h mean glucose ↓ in PPE than CON; 24 h mean glucose ↔ between PPE and CON
Haxhi et al. [48]9 (9 M)5830T2DM (HbA1c: 7.0%)Walking at 50% of HRR40 min~40 min673/meal55–603 h glucose iAUC; 24 h mean glucose concentration3 h iAUC ↔ between PPE and CON; 24 h mean glucose ↔ between PPE and CON
Heden et al. [28]13 (5 M/8 F)4937T2DM (HbA1c: 7.2%)3 sets of 10 reps in each of 8 exercises at 10 RM with ~2 min rest between sets47 min~45 min832/meal504 h glucose iAUC4 h glucose iAUC ↓ in PPE than CON
Honda et al. [30]16 (13 M/3 F)6524T2DM (HbA1c: 6.9%)Stair climbing at ~80% HRmax for 3 min after breakfast and lunch3 min60–120 min460/meal493 h glucose AUC3 h glucose AUC ↓ in PPE than CON
Honda et al. [31]7 (7 M)7024T2DM (HbA1c: 7%)Stair climbing at ~80% HRmax for 3 min after breakfast and lunch3 min60–120 min522/meal6624 h mean glucose concentration24 h mean glucose ↓ in PPE than CON
Kong et al. [59]15 (15 M)2134OW (NA)4 30 s all-out cycling against 5–7.5% of BM with 4 min recovery between bouts 14 min~90 minNA552.5 h glucose AUC2.5 h glucose AUC ↓ in PPE than CON
Larsen et al. [49]8 (8 M)5629T2DM (HbA1c: 6.0%)4 7 min cycling (3 min at 57% and 4 min at 98% VO2max with 6 min rest between bouts46 min<45 min648/meal594 h glucose iAUC4 h glucose iAUC ↓ in PPE than CON
Larsen et al. [50]9 (9 M)6029T2DM (HbA1c: 7.1%)Cycling at 50% VO2max45 min~45 min596/meal564 h glucose iAUC4 h glucose iAUC ↓ in PPE than CON
Li et al. [38]29 (22 M/7 F)5125T2DM (HbA1c: 7.3%)Walking at 40% HRR20 min<30 min1754/day552 h glucose AUC; 12 h mean glucose concentration2 h glucose AUC ↓ in PPE than CON; 12 h mean glucose ↔ between PPE and CON
Little et al. [60]10 (2 M/8 F)4136OW/OB (FG: 5.6 mM)
  • HIIE: 10 1 min cycling at 90% HRmax with 1 min rest between bouts
  • CMIE: Cycling at 65% HRmax
  • HIIE: 10 min
  • CMIE: 30 min
~120 min595/meal702 h glucose iAUC; 24 h mean glucose concentration2 h glucose iAUC ↓ in HIIE or CMIE than CON; 24 h mean glucose ↔ across HIIE, CMIE, and CON
Manders et al. [51]9 (9 M)5729T2DM (HbA1c: 7.3%)
  • LI: Cycling at 35% Wmax
  • HI: Cycling at 70% Wmax
  • LI: 60 min
  • HI: 30 min
<60 min2503/day584 h mean glucose; 24 h mean glucose concentration4 h mean glucose ↔ across LI, HI, and CON; 24 h mean glucose ↓ in LI than CON
Manders et al. [32]15 (7 M/8 F)6030T2DM (HbA1c: 7.0%)
  • HIIE: 5 min walking at 25% HRR, 5 sets of 3 min walking at 70% HRR with 3 min recovery at 30% HRR between sets, and 5 min cooldown at 25% HRR
  • CMIE: 5 min walking at 25% HRR, 30 min at 50% HRR, and 5 min cooldown at 25% HRR
  • HIIE: 40 min
  • CMIE: 40 min
60 min200/meal6150 min mean glucose concentration50 min mean glucose ↓ in HIIE or CMIE than CON
Metcalfe et al. [52]11 (11 M)5230T2DM (HbA1c: 7.0%)
  • ASIE: 10 min unloaded cycling interspersed with 2 20 s all-out cycling against 5% BM;
  • HIIE: 10 1 min cycling at 90%HRmax with 1 min recovery;
  • CMIE: Cycling at 50% Wmax for 30 min
  • ASIE: 10 min
  • HIIE: 25 min
  • CMIE: 30 min
~30 min2441/day513 h mean glucose concentration; 24 h mean glucose concentration3 h glucose AUC ↔ across ASIE, HIIE, CMIE, and CON; 24 h mean glucose ↓ in ASIE than CON
Moreira et al. [33]9 (9 M)4729T2DM (HbA1c: >7%)
  • RE-LI: 3 sets of 30 reps in each of 6 exercises at 23% 1 RM with 2 min rest between sets
  • RE-MI: 3 sets of 16 reps in each of 6 exercises at 43% 1RM with 2 min rest between sets
  • RE-LI: 25 min
  • RE-HI: 25 min
~120 min285/meal63145 min glucose AUC145 min glucose iAUC ↓ in RE-LI or RE-MI than CON
Nygaard et al. [61]12 (8 M/4 F)6525HG (HbA1c: 6.1%)Walking at 8% and speed corresponding to RPE of 12 60 min~30 min2117/day441 h glucose AUC; 22 h mean glucose concentration1 h glucose AUC ↓ in PPE than CON; 22 h mean glucose ↔ between PPE and CON
Parker et al. [62]27 (10 M/17 F)3030OW/OB (FG: 4.5–5.0 mM)
  • HIIE: 5 min cycling at 50% Wmax, 8 1 min cycling at 100% Wmax with 1 min recovery at 50 W between bouts, and 3 min cooldown at 50% Wmax
  • CMIE: Cycling at 50% Wmax
  • HIIE: 24 min
  • CMIE: 38 min
≥60 min500/meal552 h glucose AUC; 24 h mean glucose concentration2 h AUC ↓ in HIIE or CMIE than CON; 22 h mean glucose ↓ in HIIE or CMIE than CON
Rasmussen et al. [53]12 (8 M/4 F)5629T2DM (HbA1c: 8%)Cycling at 40% VO2max30 min30 min436/meal484 h glucose AUC4 h glucose AUC ↔ between PPE and CON
Sargeant et al. [63]23 (13 M/10 F)6730HG (HbA1c: 5.9%)
  • HIIE: 3 min walking at 3.5 mph, 10 1 min brisk and inclined walking at 90% VO2max with 1 min recovery at 3.5 mph between bouts, 2 min cooldown at 3.5 mph
  • CMIE: Brisk and inclined walking at 65% VO2max
  • HIIE: 25 min
  • CMIE: 35 min
~90 min622–668/meal626 h glucose AUC6 h glucose iAUC ↔ across PPE-HIIE, CMIE and CON in WE and SA subgroups
Shambrook et al. [64]10 (8 M/2 F)5029OW (FG: 4.8 mM)
  • Ex-30 × 1: Walking at 55–70% HHR for 30 min after breakfast
  • Ex-10 × 3: Walking at 55–70% HHR for 10 min after each meal
  • Ex-30 × 1: 30 min
  • Ex-10 × 3: 30 min
30 minNA552 h glucose AUC; 24 h glucose AUC2 h and 24 h glucose AUC ↔ between Ex-30 × 1, Ex-10 × 3, and CON
Terada et al. [54]10 (8 M/2 F)6031T2DM (HbA1c: 7.1%)
  • HIIE: 15 1 min inclined walking at 100% VO2max with 3 min recovery at 40% VO2max between bouts
  • CMIE: Inclined walking at 55% VO2max
  • HIIE: 60 min
  • CMIE: 60 min
≥60 min600/meal502 h glucose iAUC; 24 h mean glucose concentration 2 h iAUC ↔ between HIIE or CMIE and CON; 24 h mean glucose ↔ between HIIE or CMIE and CON
Van Dijk et al. [34]60 (60 M)6030T2DM (HbA1c: 7.3%)Cycling at 35–50% Wmax45–60 min90–150 min2390/day5624 h mean glucose concentration24 h mean glucose ↓ in PPE than CON
Van Dijk et al. [35]45 (45 M)6130IGT and T2DM (HbA1c: 6.1–7.6%)
  • AE: Cycling at 50% Wmax;
  • RE: Warm-up set at 20% BM, 3 sets of 10 reps at 40% BM in each of 2 upper-body exercises and 5 sets of 10 reps at 70% 1 RM in each of 2 lower-body exercises
  • AE: 45 min
  • RE: 45 min
~150 min2486/day576 h mean glucose; 24 h mean glucose concentration6 h mean glucose ↓ in AE or RE than CON in all subgroups; 24 h mean glucose ↓ in AE or RE than CON in IGT, OGLM, and INS subgroups
van Dijk et al. [36]30 (30 M)6030T2DM (HbA1c: 7.0–7.4%)
  • Ex-Daily: Cycling at 50% Wmax for 30 min every 24 h over a 48 h period
  • Ex-Nondaily: Cycling at 50% Wmax for 60 min over a 48 h period
  • Ex-Daily: 30 min/24 h
  • Ex-Nondaily: 60 min/48 h
~90 min2462/day5548 h mean glucose concentration48 h mean glucose ↓ in Ex-Daily or Ex-Nondaily than CON
van Dijk et al. [55]20 (20 M)6430T2DM (HbA1c: 6.9%)
  • Ex-45 × 1: Cycling at 6 METs for 45 min after breakfast
  • Ex-15 × 3: Cycling at 3 METs 15 min after each meal
  • Ex-45 × 1: 45 min
  • Ex-15 × 3: 45 min
~45 min2342/day5024 h mean glucose concentration24 h mean glucose ↓ in Ex-45 × 1 than CON, but ↔ between Ex-15 × 3 and CON
Zhang et al. [39]20 (20 M)2327 (OB by WHO Guidelines) OW/OB (HbA1c: 5.3%)
  • Ex-20 min post: Walking at 50% VO2max ~20 min post-meal
  • Ex-40 min post: Walking at 50% VO2max ~40 min post-meal
  • Ex-20 min post: 30 min
  • Ex-20 min post: 30 min
~20 min and ~40 min1970–1980/day49.7–51.24 h glucose iAUC; 24 h mean glucose concentration4 h iAUC ↓ in Ex-20 min post or Ex-40 min post than CON; 24 h mean glucose ↔ between Ex-20 min post or Ex-40 min post and CON
Note: Thirty-one studies were selected for the meta-analysis. Values for age, BMI, and fasting glucose are the group means extracted from the studies. PPE: Postprandial exercise; CON: Time-matched control condition; ASIE: All-out sprint interval exercise; HIIE: High-intensity interval exercise; CMIT: Continuous moderate-intensity exercise; AE: Aerobic exercise; RE: Resistance exercise; MET: Metabolic equivalent; HHR: Heart rate reserve; W: Power in watts; BM: Body mass; LI: Lower intensity; MI: Moderate intensity; HI: High intensity; AUC: Area under the curve; iAUC: Incremental AUC; WE: White Europeans; SA: South Asians; IGT: Impaired glucose tolerance; OGLM: Oral glucose-lowering medication; INS: Insulin treatment; ↓: Significantly different, p < 0.05; ↔: not significantly different, p ≥ 0.05.
Table 2. Results of quality assessment for the included studies (n = 31).
StudiesQ1Q2Q3Q4Q5Q6Q7No. of “Y”
Bellini et al. [47]YYYNYYY6
Carrillo-Arango et al. [56]YYYYYYY7
Colberg et al. [26]YYYNYYY6
Derave et al. [57]YYYNYYY6
DiPietro et al. [58]YYYNYYY6
Erickson et al. [37]YYYNYYY6
Gillen et al. [29]YYNNYYY5
Haxhi et al. [48]YYYNYYY6
Heden et al. [28]YYYNYYY6
Honda et al. [30]YYNNYYY5
Honda et al. [31]YYNYYYY6
Kong et al. [59]YYYYYYY7
Larsen et al. [49]YYYNYYY6
Larsen et al. [50]YYYNYYY6
Li et al. [38]YYYNYYY6
Little et al. [60]YYNNYYY5
Manders et al. [51]YYYNYYY6
Manders et al. [32]YYYYYYY7
Metcalfe et al. [52]YYYYYYY7
Moreira et al. [33]YYNNYYY5
Nygaard et al. [61]YYYYYYY7
Parker et al. [62]YYYNYYY6
Rasmussen et al. [53]YYNNYYY5
Sargeant et al. [63]YYYYYYY7
Shambrook et al. [64]YYYNYYY6
Terada et al. [54]YYYNYYY6
Van Dijk et al. [34]YYYNYYY6
Van Dijk et al. [35]YYYNYYY6
van Dijk et al. [36]YYYNYYY6
van Dijk et al. [55]YYYNYYY6
Zhang et al. [39]YYYYYYY7
No. of “Y”3131258313131Overall Mean = 6.1
Note: Y: “Yes” to the question; N: “No” to the question. Q1–Q7 are the questions that assess research quality and can be found in the Methods section.
Table 3. Results of subgroup analysis on the glucose-lowering effect based on exercise duration, exercise timing post-meal, and the disease status of participants.
FactorsSubgroup CategoriesPostprandial Glucose AUC24 h Mean Glucose Levels
Hedges’ g
(PPE vs. CON)
Test for Subgroup HomogeneityHedges’ g
(PPE vs. CON)
Test for Subgroup Homogeneity
Chi-Square Q-Statisticp ValueChi-Square Q-Statisticp Value
Exercise Duration ≤30 min−0.2094.3610.037 *−0.2251.9940.158
>30 min−0.450−0.401
Exercise Timing Post-Meal<60 min−0.3310.0440.833−0.1634.4630.035 *
≥60 min−0.307−0.430
Disease Status of ParticipantsWithout T2DM−0.2391.1940.275−0.1264.1040.043 *
With T2DM−0.368−0.405
Note: * Significantly different between the two subgroups (p < 0.05).
Disclaimer/Publisher’s Note: The statements, opinions and data contained in all publications are solely those of the individual author(s) and contributor(s) and not of MDPI and/or the editor(s). MDPI and/or the editor(s) disclaim responsibility for any injury to people or property resulting from any ideas, methods, instructions or products referred to in the content.

