Article

SLC6A4 DNA Methylation Levels and Serum Kynurenine/Tryptophan Ratio in Eating Disorders: A Possible Link with Psychopathological Traits?

1
Department of Medicine and Aging, School of Medicine and Health Sciences, “G. d’Annunzio” University, 66100 Chieti, Italy
2
Center for Advanced Studies and Technology, “G. d’Annunzio” University, 66100 Chieti, Italy
3
Department of Medicine and Surgery, University of Perugia, 06129 Perugia, Italy
4
Laboratory of Biostatistics, Department of Medical, Oral and Biotechnological Sciences, “G. d’Annunzio” University, 66100 Chieti, Italy
5
Food Science and Human Nutrition Unit, University Campus Biomedico of Rome, 00128 Rome, Italy
6
Department of Psychological, Health and Territorial Sciences, School of Medicine and Health Sciences, “G. d’Annunzio” University, 66100 Chieti, Italy
7
Department of Pharmaceutical Sciences, University of Perugia, 06126 Perugia, Italy
*
Author to whom correspondence should be addressed.
Nutrients 2023, 15(2), 406; https://doi.org/10.3390/nu15020406
Submission received: 13 December 2022 / Revised: 7 January 2023 / Accepted: 11 January 2023 / Published: 13 January 2023
(This article belongs to the Section Proteins and Amino Acids)

Abstract

:
Background: The incidence of eating disorders (EDs), serious mental and physical conditions characterized by a disturbance in eating or eating-related behaviors, has increased steadily. The present study aims to develop insights into the pathophysiology of EDs, spanning over biochemical, epigenetic, psychopathological, and clinical data. In particular, we focused our attention on the relationship between (i) DNA methylation profiles at promoter-associated CpG sites of the SCL6A4 gene, (ii) serum kynurenine/tryptophan levels and ratio (Kyn/Trp), and (iii) psychopathological traits in a cohort of ED patients. Among these, 45 patients were affected by restricting anorexia nervosa (AN0), 21 by purging AN (AN1), 21 by bulimia (BN), 31 by binge eating disorders (BED), 23 by unspecified feeding or eating disorders (UFED), and finally 14 by other specified eating disorders (OSFED) were compared to 34 healthy controls (CTRs). Results: Kyn level was higher in BED, UFED, and OSFED compared to CTRs (p ≤ 0.001). On the other hand, AN0, AN1, and BN patients showed significatively lower Kyn levels compared to the other three ED groups but were closed to CTRs. Trp was significantly higher in AN0, AN1, and BN in comparison to other ED groups. Moreover, AN1 and BN showed more relevant Trp levels than CTRs (p <0.001). BED patients showed a lower Trp as compared with CTRs (p ≤ 0.001). In addition, Kyn/Trp ratio was lower in the AN1 subtype but higher in BED, UFED, and OSFED patients than in CTRs (p ≤ 0.001). SCL6A4 DNA methylation level at CpG5 was lower in AN0 compared to BED (p = 0.021), and the CpG6 methylation was also significantly lower in AN0 in comparison to CTRs (p = 0.025). The mean methylation levels of the six CpGs analyzed were lower only in the AN0 subgroup compared to CTRs (p = 0.008). Relevant psychological trait EDI-3 subscales were correlated with biochemical and epigenetic data. Conclusions: These findings underline the complexity of psychological and pathophysiological components of EDs.

1. Introduction

Eating disorders (EDs) are serious mental and physical conditions characterized by a disturbance in eating or eating-related behaviors and are correlated with distressing thoughts and emotions [1]. EDs are heterogeneous and are usually associated with physical and mental health morbidity and elevated mortality, which vary according to the diagnosis, duration, and frequency of certain specific behaviors [2,3,4]. Comorbidities with other psychiatric diseases are high [5] since up to 95% of EDs subjects have at least one additional psychiatric illness [6]. EDs are prevalent among females and young adults, with a female-to-male ratio ranging from 3:1 to 8:1 [7,8]. Based on the Diagnostic and Statistical Manual of Mental Disorders (DSM-V) [1], EDs include anorexia nervosa (AN), bulimia nervosa (BN), binge eating disorder (BED), other specified eating disorders (OSFED), unspecified feeding or eating disorder (UFED), pica, rumination disorder, avoidant/restrictive food intake disorder (ARFID), and others.
The pathogenesis of EDs ensues from a pattern of genetic, psychosocial, biological, and environmental risk factors [9,10], and its complexity is often increased by the shift from one to another eating disorder diagnosis [6,11] (typically within the first 5 years of illness), suggesting an overlapping pathogenesis of this type of disorder [12]. In particular, it has been demonstrated that EDs share common neurobiological abnormalities, such as dysregulation of the serotonergic system [13]. Serotonin (5-hydroxytryptamine, 5-HT) is a monoamine that acts as a neurotransmitter. Only about 3% of the essential amino acid L-tryptophan (Trp), purchased from the diet, is conveyed to the synthesis of 5-HT, which is involved in behavioral, biological, and physiological functions [14] regulating sleep, mood, drug abuse, appetite, and eating behavior [15]. Some studies have suggested that underweight AN patients have reduced 5-HT levels [16,17] as a consequence of reduced Trp availability probably due to the hypocaloric diet. However, after refeeding, peripheral measures of 5-HT tend to normalize [18]. On the contrary, the serum Trp concentration was very high in AN subjects with more severe statuses (lower BMI, excessive exercise, and low energy intake), probably correlated with measures of catabolism [19]. A decrease in 5-HT is also associated with anxiety, depression, autism spectrum disorder, and obesity [20].
Several hypotheses have been suggested to explain the serotoninergic tone alteration in the brain of ED patients, including the observation of dysfunctional 5-HT receptors (e.g., 5-HT2AR) and 5-HT transporters. Specifically, the serotonin transporter (SERT, 5-HTT), an integral membrane protein abundantly expressed in the brain, plays a key role in the regulation of 5-HT homeostasis and was thought to be implicated in EDs [21] by controlling hunger and promoting satiety. SERT is encoded by a gene (also known as the solute carrier family 6 member 4, SLC6A4) located on chromosome 17q11.2 [22]. Genetic variants within the promoter of this gene (i.e., rs25531 and rs25532) along with variable number tandem repeat (VNTR) polymorphisms in the promoter and intron 2 regions (5HTTLPR and STin2) modulate its transcriptional activity [23], influencing emotional, endocrine, and personality characteristics as well as vulnerability to a broad range of psychiatric disorders [24,25,26,27]. In this scenario, in vivo study demonstrated that transgenic mice overexpressing SLC6A4 are lighter and shorter than controls [28]; on the other hand, Slc6a4 knockout mice develop late-onset obesity, hepatic steatosis, glucose intolerance, and insulin resistance [29].
In addition to genetic variants, recent epigenetic alterations modulating gene expression have garnered much interest in the etiology of EDs [17,30], although the role of these mechanisms is currently unclear. Epigenetic modifications mainly refer to chemical modifications of DNA and chromatin proteins and are mediated by several environmental factors, such as diet and stress [31]. When epigenetic modifications occur, gene expression changes without altering DNA sequences. DNA methylation, characterized by the addition of a methyl group to cytosine residues (5 mC) in CpG dinucleotides, is the most widely studied epigenetic modification. DNA methylation of the SLC6A4 promoter region has been associated with 5-HT-related disorders, including abnormal eating behaviors (including food restriction and food avoidance), psychiatric pathologies, depressed mood, trauma, and work stress [17,32,33,34]. SLC6A4 promoter hypermethylation is significantly associated with an increased prevalence of obesity [35]. Due to the regulatory network of SLC6A4, further insight into DNA methylation could be of high interest to better understand and treat different ED subgroups.
The essential amino acid Trp is a building block for protein synthesis and the precursor of different metabolic pathways. In eukaryotic cells, Trp is conveyed in two main metabolic pathways, generating serotonin and melatonin (namely, the serotonin pathway) and kynurenines (namely, the kynurenine pathway). Trp availability is known to influence sensitivity to mood disorders [36,37]. The kynurenine (Kyn) pathway represents a major route for the metabolism of Trp in both the peripheral and central systems, in which about 90% of Trp is catabolized to form nicotine amides and the vitamin niacin [38]. The enzyme indoleamine-(2,3)-dioxygenase 1 (IDO1) controls the rate-limiting step in the conversion of Trp into the intermediate catabolite l-Kyn [39]. An altered Kyn/Trp, as biomarker of IDO1 activity, has been shown in many conditions—including Alzheimer’s disease, amyotrophic lateral sclerosis, AIDS dementia complex, cancer, depression, and schizophrenia—suggesting an important role of the kynurenine pathway in the development of several diseases [40]. Nevertheless, the link between the Kyn pathway and EDs remains poorly understood.
Through an interdisciplinary approach, the present study describes the relationship among epigenetic data (i.e, DNA methylation at the promoter-associated CpG sites of the SCL6A4 gene), biochemical data (i.e., the measurement of serum Kyn/Trp ratio), and psychopathological traits in ED patients.

2. Materials and Methods

2.1. Participants and Healthy Control Recruitment

EDs patients were referred to the outpatient clinic for EDs at the Palazzo Francisci (USL 1 Umbria, Todi, Italy). All ED patients were unrelated and were of Caucasian origin. They were recruited consecutively at the Palazzo Francisci residence from January 2018 to July 2019. They were diagnosed according to the DSM-V (Diagnostic and Statistical Manual of Mental Disorders, 5th edition) criteria by at least one health professional or psychiatrist. Psychopathological features were evaluated during the first week after the admission to the residential facility together with blood collections. EDs were divided into six major groups: 66 patients were affected by AN, 21 were affected by BN (mean age 19 [17.0;26.0]), 31 by BED (mean age 39 [20.2;52.8]), 23 by UFED (mean age 54.0 [18.5;64.5]) and 14 by OSFED (mean age 54.5 [35.2;58.5]). In addition, according to DSM-V criteria, 66 AN patients were divided in turn into 45 restricting AN (AN0) (mean age 16.0 [14.0;18.0]) and 21 purging AN (AN1) (mean age 18.0 [17.0;19.0]), based on the presence or absence of binge eating and vomiting behaviors and according to anamnesis and a psychiatric test. In addition, 34 Caucasian healthy controls (CTRs) without a lifetime history of EDs, psychiatric disorders, or substance abuse were consecutively recruited in Palazzo Francisci.

2.2. Ethical Statement and Inclusion Criteria

The study and all research processes were approved by the Ethics Committee of the Aziende Sanitarie (CEAS) della Regione Umbria, Italy. Written informed consent was obtained from all subjects in accordance with the Declaration of Helsinki and its subsequent revisions. For data protection and confidentiality, all participants were assigned a unique research identifier alphanumeric code.
Sociodemographic characteristics and psychopathological and clinical data were collected for ED patients during the first week at the facility residence. During recruitment, all the subjects filled out a questionnaire with different queries about gender, age, BMI, secondary amenorrhea, food restriction, water restriction, fasting, diet pills, binge eating, vomiting, alcohol abuse, laxative abuse, diuretics abuse, drug abuse, excessive physical activity, and sleep disorder. In the survey, the criterion for food restriction to standardize all answers was: eating <1000 kcal/day, and patients could answer Yes or No. Water restriction was indicated in the questionnaire as drinking <0.5 L/day (Yes or No).
Exclusion criteria for the admission, determined before psychological test [41], included mental retardation, dementia, schizophrenia, Turner’s syndrome, other neurological disorders, and underlying endocrine pathologies. CTRs inclusion criteria include never having been diagnosed with any previous EDs and/or familiarity with EDs, any psychiatric disorders and/or familiarity, and having normal BMI for their whole life (range 18.5–24.9 kg/m2).
Before starting the rehabilitation course in the residential structure Palazzo Francisci, all patients carried out a complete blood test.

2.3. Psychological Traits

Psychological profiles were analyzed through the Italian version of the self-completed Eating Disorders Inventory, third edition (EDI-3) [42]. EDI-3 measures psychological traits relevant in individuals with Eds, characterizes them by 91 items, and organizes them into 3 eating-disorder-specific scales and 9 general psychological scales. It also generates six composites: eating disorder risk (EDRC), ineffectiveness (IC), interpersonal problems (IPC), affective problems (AP), overcontrol (OC), and global psychological maladjustment (GPM).

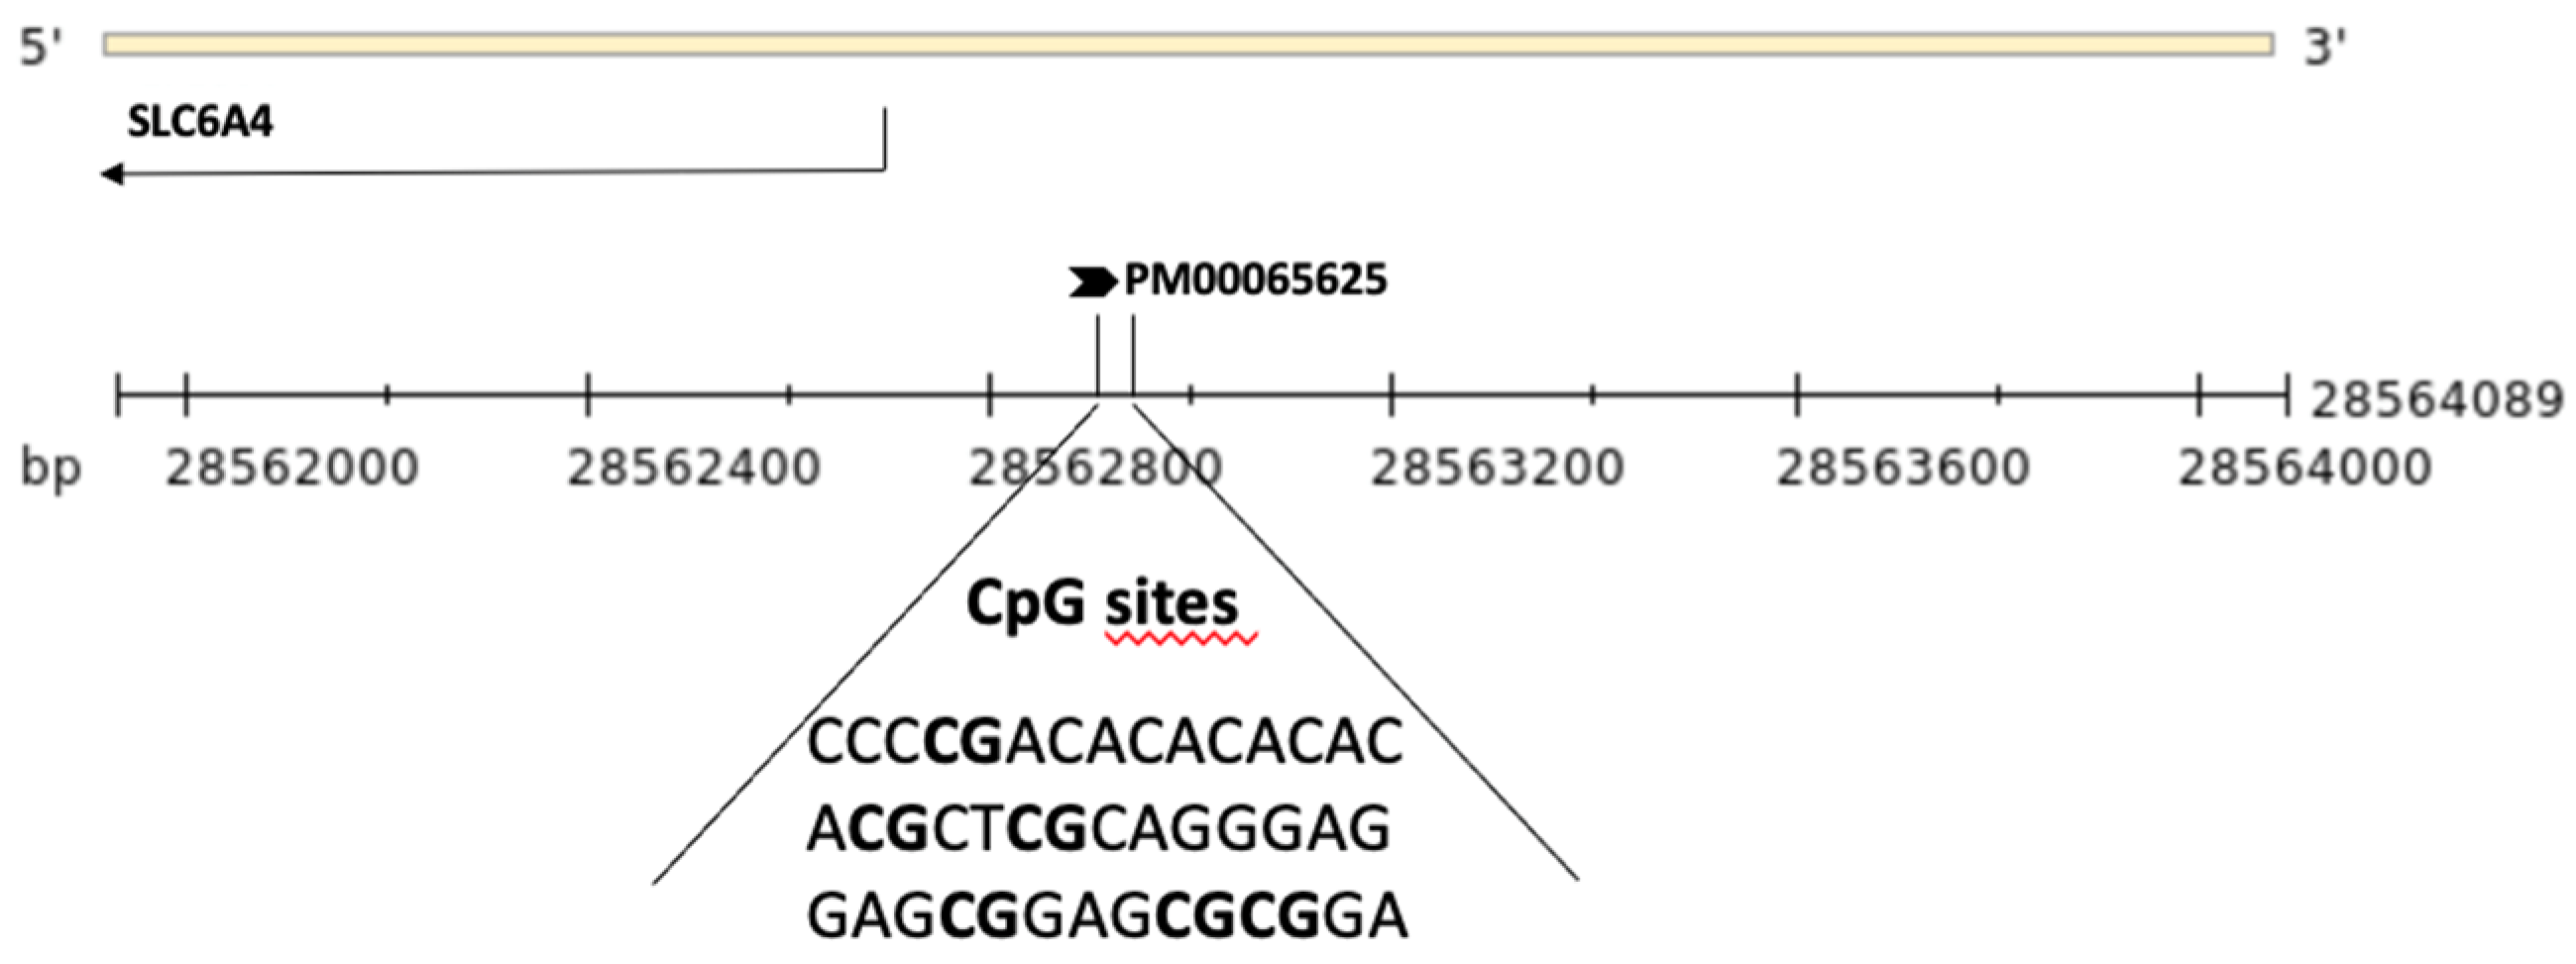
2.4. DNA Methylation Analysis

A blood sample was collected in a sterile tube containing EDTA for all patients, and CTRs and has been used for DNA extraction and serum analysis.
Genomic DNA was extracted from peripheral blood lymphocytes starting from 300 μL of whole anticoagulated peripheral blood using a commercially gDNA Mini Kit (Geneaid) according to the manufacturer’s instructions. An amount of 100 ng of each sample was run in 0.8% agarose gel electrophoresis in 1X TBE buffer at 90 V for 45 min to verify the integrity of gDNA, and at least the gDNA was quantified using the NanoDrop system [43].
DNA methylation levels at 6 CpG sites within the SLC6A4 promoter region (ENSG00000108576, Chr:17) were assessed using pyrosequencing (Qiagen, Hilden, Germany, Pyromark Q96) (Figure 1). In brief, genomic DNA was treated with sodium bisulfite (NaBis) using the EpiTect Plus DNA Bisulfite Kit (Qiagen) as previously reported [44]. Bisulfite-treated DNA (50 ng) was amplified via PCR using the Pyromark PCR kit (200) (Qiagen) with a biotin-labeled primer (Hs_SLC6A4_01_PM PyroMark CpG assay PM00065625). The PCR cycling conditions according to the general guidelines of pyrosequencing were as follows: 95 °C for 15 min, 45 cycles at 94 °C for 30 s, 60 °C for 30 s, 72 °C for 30 s, and a final extension at 72 °C for 10 min. DNA methylation levels were analyzed through the PyroMark Q96 ID version 1.0.11 software, which calculates the methylation percentage expressed both as a percentage of every single CpG site and as the average of the methylation percentage of all 6 of the CpG sites under study.

2.5. HPLC Analysis

Plasma levels of Trp and its derived metabolite Kyn, as well as the Kyn/Trp ratio, were evaluated at the admission of ED patients. Blood samples were immediately centrifuged to obtain serum samples. After deproteinization, Kyn and Trp concentrations were measured via HPLC. Briefly, a Perkin Elmer (series 200 HPLC) instrument and a Kinetex C18 column (250 × 4.6 mm, 5 µm, 100 Å, Phenomenex, Torrance, CA, USA) were used for the analysis. The column was maintained at a temperature of 25 °C and a pressure of 1800 PSI. Samples were eluted with a phase containing 10 mM NaH2PO4 (pH = 3.0; 99%) and methanol (1%) (Sigma–Aldrich, St. Louis, MO, USA) with a flow rate of 1.3 mL/min. Kyn was detected at 360 nm and Trp was detected at 220 nm by UV detector. The software TotalChrom version 6.3.1 was used for evaluating the concentration of Kyn and Trp in samples using a calibration curve.

2.6. Statistical Analysis

The descriptive analysis reports, in accordance with the distribution of the variables, the median (q1 = first quartile; q3 = third quartile) for continuous variables and the absolute frequency and percentage for categorical variables. Pearson chi-square test was used to investigate the association among categorical variables. The Kruskal–Wallis test was used to assess whether statistically significant differences existed between the diagnosis groups for the continuous variables under study, and if a p ≤ 0.05 was found, Dunn’s post hoc test was applied. Mann U Whitney test was used to test unpaired differences between groups. Nonparametric Spearman rho correlation coefficients were estimated to evaluate the relationship between quantitative variables. Because of the exploratory nature of the study, no correction for multiplicity was applied. Statistical analysis was performed using the R environment for statistical computing and graphics version 3.5.3 (R Foundation for Statistical Computing, Vienna, Austria).

3. Results

3.1. Clinical Data

Sociodemographic characteristics and clinical phenotypes are shown in Table 1 and Table 2, respectively. Women were prevalent in patients with EDs with the following frequencies: 100% in both AN0 and AN1, 95.2% in BN, 74.2% in BED, 82.6% in UFED, and 85.7% in OSFED (Table 1). The BED group contains the highest percentage of males (25.8%) of all groups. Notably, among patients with EDs, at least one out of three patients declared that a first-degree family member had had a previous ED. As expected, AN patients showed lower weight than the other groups (Table 1), with a BMI outflank of 14.4 kg/m2 for AN0 and 15.8 kg/m2 for AN1. This justifies a severe or extreme severe condition based on BMI value as described in DSM-V. At the same time, some patients with BN showed a BMI under normality (with a median = 17.7 kg/m2) probably due to a possible diagnostic crossover from AN purging subtype and BN during the life history of the disease. On the other hand, severe obesity was registered in the BED, UFED, and OSFED groups, with a maximum BMI in the BED subgroup (median 45.7 kg/m2), followed by UFED (42.3 kg/m2) and lastly OSFED (38.9 kg/m2). It is worthy of note that the 65.5% and 65.2%, respectively in BED and UFED groups presented a grade III obesity.
As described in Table 2, secondary amenorrhea was prevalent in AN0 (89.5%), followed by AN1 and BN (63.2% and 62.5%). Menopause was absent in AN0, AN1, and BN because of the young age, whereas it was present in BED, UFED, and OSFED in a different way (42.1, 43.8, and 20%, respectively). Food restriction was a behavioral characteristic present in almost all AN1 and AN0 (100%), in a large group of BN (94.4%), and in more than half of the other three groups (>60%).
When we refer to dietary restriction behavior, we refer to qualitative and quantitative behavior: eating fewer meals per day, higher frequency of fasting, consuming small meals, and only low-calorie foods. Water restriction was a condition almost present in extreme patients (54.5% of AN0, 52.4% of AN1, 33.3% of BN, 16.0% of BED, 10% of UFED, and 8.33% of OSFED). Patients, in particular those affected by AN, decided to reduce water intake due to incessant worry over gaining weight. Sometimes, all biological functions are impaired and patients lose the sense of thirst. In the survey, fasting common in AN and BN (around 80%) is defined as skipping at least one meal/day. Binge eating was infrequent in patients with AN0 but was a common trait for all other subgroups, with an incidence of 55.0% in AN1, 88.9% in BN, 100% in BED, 60.0% in UFED, and 83.3% in OSFED (p < 0.001). Inappropriate compensatory behavior (self-induced vomiting) was a common trait in AN1 and BN, as reported in Table 2: 85.0% and 88.9%, respectively (p < 0.001). Alcohol abuse was unusual; only one out of four patients with BN declared to have alcoholism. Around 30% of AN1 and BN patients stated that they engaged in laxative abuse, whereas all other patients did so less (Table 2). Diuretics and drug abuse were unusual in all ED subgroups (Table 2). The excessive physical activity is significantly linked (p < 0.001) to a peculiar portion of patients, as reported in Table 2: AN0 (79.5%), AN1 (90.0%), and BN (66.7%). On the contrary, it is undistinguished in BED (7.7%), UFED (10.0%), and OSFED (16.7%). Finally, sleep disorder was present in around 80% of AN0, AN1, and OSFED patients but only in half of BN, BED, and UFED. Only these last two subtypes used a CPAP (continuous positive airway pressure) (p = 0.002).
Glucose level was also statistically different among EDs groups, albeit all values were in the range of normality (70.0–100.0 mg/dL). AN patients (purging and restricted subtypes) presented lower fasting glucose levels in line with their malnutrition status.

Hematological Data

Malnutrition was evident in AN0 and AN1. White blood cell (WBC) count and platelet (PLT) count decreased significantly in AN0 and AN1 patients and partially in BN patients. Despite a decrease in WBC count, the patients did not present any infections. Red blood cell (RBC) count was borderline in AN0, AN1, and BN, suggesting the onset of anemia (Table 3).

3.2. Biochemical Data

Kyn levels, as reported in Table 4, were higher in BED, UFED, and OSFED than in CTRs (p ≤ 0.001). On the other hand, purging and restricting AN as well as BN patients showed significantly lower Kyn levels compared to other ED groups but similar levels to CTRs. Trp was significantly higher in AN0, AN1, BN in comparison with other EDs groups. Moreover, AN1 and BN with a Trp median value upper than 50 µmol/L showed relevant results if compared to CTRs (p < 0.001). Conversely, BED patients with a median of 41.0 µmol/L showed a lower Trp as compared with CTRs (p < 0.001). In addition, the serum Kyn/Trp ratio was significantly lower in the AN1 subgroup but significantly higher in BED, UFED, and OSFED patients, compared to the CTRs (p < 0.001). AN0, AN1, and BN showed significantly lower Kyn/Trp ratios compared to other ED groups and stood out for severe obesity.
In the whole cohort of ED patients, several interesting correlations were observed between plasma levels of Kyn and Trp, and the Kyn/Trp ratio was correlated with peculiar behaviors of ED patients, such as vomiting, excessive levels of physical activity, and binge eating behavior (Figure 2). Specifically, vomit (characteristic in AN1 and BN subtypes) and excessive levels of physical activity (present in AN0 and AN1 and in some BN patients) were both positively correlated with a lower Kyn level and higher Trp value. As a consequence, the resulting Kyn/Trp ratio was very low in patients that declared that they vomited (p = 0.001) or abused physical activity (p < 0.001) compared to all other patients. On the contrary, in patients with binge eating behavior, the Kyn/Trp ratio resulted increased (p < 0.001) as a consequence of increased Kyn and a drastical drop in Trp.

3.3. Epigenetic Data

SCL6A4 DNA methylation level at CpG5 was lower in AN with restricting subtype (AN0) compared to BED (p = 0.021), and the CpG6 methylation was significatively lower in AN0 in comparison to CTRs (p = 0.025). The mean methylation levels of the six CpGs analyzed were lower in AN0 compared to CTRs (p = 0.008) (Table 4).
Moreover, DNA methylation at CpG4 was positively related to Kyn concentration (rho = 0.764; p < 0.001) as well as to Kyn/Trp ratio (rho = 0.809; p < 0.001) in the OSFED group. DNA methylation at CpG1 and CpG6 in AN0 was positively correlated with Kyn/Trp ratio (rho = 0.418; p < 0.05 and rho = 0.428; p < 0.05, respectively). Indeed, CpG1 was positively correlated with Kyn concentration (rho = 0.493; p < 0.05) in the same group. In addition, DNA methylation at CpG5 and CpG6 was also positively related to Trp (rho = 0.459; p < 0.05) and Kyn (rho = 0.471; p < 0.05) in the BED group, respectively (Supplementary Table S1).

3.4. Psychopathological Data

Psychopathological data for ED patients are reported in Table 5. Significant differences between the EDs groups were found on the subscales of the EDI-3, covering a wide range of ED symptoms and pathology. In addition, EDI-3 subscale scores were correlated with biochemical and epigenetics data. SLC6A4 methylation levels were inversely related to relevant psychological trait subscales, including low self-esteem (LSE) (rho = −0.435; p < 0.05 vs. CpG2), interpersonal alienation (IA) (rho = −0.493; p < 0.05 vs. CpG4), and ineffectiveness composite (IC) (rho = −0.417; p < 0.05 vs. CpG2) in the AN0 group. In addition, interoceptive deficits (ID) were inversely related to DNA methylation at CpG1 (rho = −0.649; p < 0.05) and CpG2 (rho = −0.635; p < 0.05). Indeed, DNA methylation at CpG4 was positively related to interpersonal alienation (IA) (rho = 0.636; p < 0.05) and emotional dysregulation (ED) (rho = 0.798; p < 0.01) and CpG6 with ED (rho = 0.830; p < 0.001) in the AN1 group. The ID (rho = −0.681; p < 0.05) was inversely related to Kyn levels in UFED patients.

4. Discussion

To the best of our knowledge, the present study investigates for the first time the complexity of EDs by an interdisciplinary approach, deepening the relationship between SCL6A4 gene DNA methylation, serum Kyn/Trp ratio, and psychopathological traits in patients with different ED subtypes compared to the CTR group. Poor and contradictory results are available on the kynurenine pathway in EDs patients. Consistent with the observation in mice, obese patients have lower Trp and higher Kyn in plasma [45]. Breum et al. reported that plasma Trp concentrations and the ratio of Trp to other large neutral amino acids in obese subjects were low throughout a 24 h period and that these effects persisted after weight reduction [46]. The hypothesis could be that a lower Trp level observed throughout the day and night in obese subjects causes a reduced 5-HT synthesis in the brain and suggests that the obese may struggle against a biochemical signal oriented toward increased appetite and food intake [47,48]. Moreover, the kynurenine pathway is chronically activated in obesity in response to the low-grade inflammatory condition that characterizes these patients, and it has been associated with neuropsychiatric symptoms in obese patients [49]. In this scenario, we speculated that the available Trp, taken with their diets, could constantly be conveyed into the Kyn pathway in obese patients, resulting in increased Kyn levels and decreased 5-HT. Higher Kyn/Trp ratios and parallel lower 5-HT levels were also observed in obese subjects (without a specific ED diagnosis) relative to non-obese controls [50].
In our cohort, serum Trp resulted significantly higher in AN0, AN1, and BN patients, whereas BED patients showed a lower Trp level compared to CTRs. In our cohort, Kyn levels were higher in BED, UFED, and OSFED groups than in CTRs. On the other hand, AN with restricting and binge–purge subtypes as well as BN patients showed a lower Kyn level compared to other EDs groups.
In our cohort, serum Kyn/Trp ratios were higher in BED, UFED, and OSFED patients than in the CTRs. As previously described [39], Kyn and Trp levels are correlated with each other because Kyn is generated from Trp along the kynurenine pathway, which is essentially controlled by TDO and IDO1 enzymes. Kyn levels increased in patients with binge eating, probably because of the persistent inflammatory state in adipose tissue and liver activating the Trp-degrading enzymes. As a consequence, Trp level decreased in the same patients. We speculated that binge eating patients internalized from their diet highs amounts of the essential amino acid Trp, which was immediately converted into Kyn. In fact, the Kyn pathway accounts for ~95% of dietary Trp degradation, of which 90% is attributed to the hepatic synthesis. As a consequence, Kyn/Trp ratio was very high in binge eating patients [51].
For the first time, we also evaluated the serum Kyn/Trp ratio in AN (restricted and purging) and BN subtypes, and this value was lower compared to other ED groups, in particular in the purging AN group. The value was significantly below that of the CTRs.
Although altered levels of the Trp-derived metabolites along the Kyn pathway have been observed in the pathogenesis of several conditions, including aging and sleep disorders, metabolic syndrome, cardiovascular and autoimmune diseases, anxiety and depression, and neurodegenerative diseases [52], so far, poor observations are available on the alteration of Trp–Kyn pathway EDs. Food restrictions have been described to reduce available circulating Trp and therefore to induce serotoninergic system depletion [53]. Mood disorders and neuropsychiatric symptoms—such as depression, anxiety, and others—are correlated with EDs in general and in particular with AN—especially during the acute phase [54], probably due to the Trp deficiency—but the literature on the topic is contrasting. On one hand, plasma Trp significantly increased during the refeeding process in underweight AN patients [55]. Conversely, Favaro et al. (2000) demonstrated in sixteen AN patients that Trp level—in particular, the ratio between Trp and other large neutral amino acids (Trp/LNAA)—competes with Trp for brain uptake [19]. In this work, Trp/LNAA value was very high in the AN subjects with more severe statuses (lower BMI, excessive exercise, and low energy intake) and probably correlated with measures of catabolism. In the presence of low fat stores, depleted glycogen, and insufficient Kcal intake, AN patients have to turn to release amino acids from the skeletal muscle back into the plasma. In the middle of these opposite results, other studies demonstrated that plasma Trp levels did not change comparing underweight AN patients and CTRs [56]. In our cohort, higher Trp value was registered for restricting and purging AN subtypes as well as BN patients and was positively correlated with excessive levels of physical activity, corroborating the catabolism hypothesis.
Trp supplementation was proposed as a therapeutic approach for AN [57] and was aimed at increasing 5-HT brain levels and reducing depressive symptoms. Contrasting data were obtained in the AN group, with an increase in anxiety after Trp intravenous administration [58]. A dietary reduction of serum Trp was also associated with reduced anxiety among AN patients [59]. In fact, lean men respond to prolonged fasting by increasing hypothalamic 5-HT transporter availability, whereas this response is absent in men with obesity [60].
It is known that gene and environment interaction have a role in the development of EDs, which may involve epigenetic processes. In comparison to genetic variants, epigenetic contributions to EDs remain largely understudied. To date, as reviewed by Hübel et al., few studies have evaluated DNA methylation at selected candidate genes [61] mainly involved in synaptic transmission, endoplasmic reticulum stress response, growth hormone signaling, fluid balance, the cannabinoid system, dopamine transmission, stress response, and appetite regulation [62,63,64]. Due to the role of the serotonin transporter in the regulation of emotion, behavior, energy balance and appetite control, SLC6A4 may also be a promising candidate in epigenetic analyses involving DNA methylation. In our ED cohort, the methylation profile of the SLC6A4 gene resulted in hypomethylated sites in AN with the restrictive trait, indicating a potential activation of the gene transcription. Previously, animal studies showed the role of 5-HT in suppressing eating behaviors, promoting satiety, and producing anorexic effects [65,66]. Moreover, although SLC6A4 methylation has been also shown to play a role in depressive disorders and schizophrenia [67], no difference in SLC6A4 methylation levels in AN patients has been reported [68,69]. Nevertheless, the DNA methylation in this candidate gene was positively correlated with resting-state functional connectivity (rsFC) in specific brain regions, such as the dorsolateral prefrontal cortex. These data suggested that increased rsFC in the salience network mediated the link between SLC6A4 methylation and eating disorder symptoms in AN patients [17].
The EDI-3 evaluates eating pathology and general psychological constructs of relevance to EDs. Previously, some variants in genes related to eating behavior and mental disorders have been correlated with at least one of the EDI scales and psychopathological traits [70,71,72,73]. Moreover, biochemical measures, including androgen and cholesterol levels, have shown significant correlations with several EDI scores [74,75]. In the current study, significant correlations emerged between SLC6A4 methylation and Kyn levels with the scores of the EDI-3 for LSE, IA, ID, IC, MF, IPC, and GPM in several ED groups. In particular, interesting results were obtained with BED and OSFED subgroups and maturity fear (MF). BED, with a median score of 9.0, and OSFED, with 12.0, were both hypomethylated at CpG4 in SLC6A4. Methylation levels at CpG3, CpG4, and CpG6 were negatively associated with global psychological maladjustment (GPM) and OSFED patients. Not by chance, they showed the lowest score (62.5) compared to other subgroups.
A strength of our study is that this is the first attempt to characterize the major six ED subtypes; demonstrate the associations betweenDNA methylation profiles of the SCL6A4 gene, the serum Kyn/Trp ratio, and psychopathological traits in the different EDs subgroups; and point out the complexity of the psychological and pathophysiological components of these conditions.
The present study has some limitations. First, we show the laboratory variables only in ED groups because in the control group, they were unavailable. Second, although the ED groups (total 155) can be considered a good sample size, it should be noted that the number of the controls was relatively small. In conclusion, our findings suggest that epigenetic marks at the SLC6A4 gene, responsive to environmental stressors, might play a role in EDs and/or associated phenotypes, including anxiety and increased stress reactivity. In addition, considering the role of the serotonergic system, the study of the complex link between SLC6A4 expression and the serum Kyn/Trp ratio in EDs patients may be an area of high interest to better understand and treat 5-HT-related EDs. A lower SLC6A4 methylation level in AN with restricting subtype could be accompanied by a change in SLC6A4 mRNA expression, suggesting that altered SLC6A4 methylation may be of functional relevance in EDs. Thus, since SLC6A4 plays a key role in regulating eating behaviors, epigenetic alterations in this gene could promote satiety, producing an anorexic effect. In this complex scenario, the significance of the link between SLC6A4 methylation patterns and the serum Kyn/Trp ratio related to the specific pathophysiology of EDs must be clarified with the aim of assisting the clinicians in a more precise diagnosis of the various EDs. In this view, it should be also elucidated whether or not epigenetic changes occur at first stage or when illness has taken full hold. Such knowledge may pave the way toward future research into the potential of epigenetic markers to evaluate the risk for eating disorders. It is known that the interest of the epigenetic mechanisms is due to their reversibility; therefore, further investigation is needed to establish the possibility to modulate the epigenetically relevant effects through pharmacological and behavioral treatment strategies. In this view, in 2014, Domschke et al. investigated the correlation between SLC6A4 methylation level and impaired response to antidepressant drugs after six weeks of treatment in patients with major depressive disorder (MDD), suggesting that individuals’ methylation profile may contribute to improve a personalized therapy [76,77]. Epigenome-modifying drugs both up- and downregulating DNA methylation are promising and could open new avenues on EDs.

5. Conclusions

This study showed the associations between DNA methylation profiles of the SCL6A4, the serum Kyn/Trp ratio, and psychopathological traits in the different ED subgroups and pointed to the complexity of psychological and pathophysiological components of these conditions. These results provide significant insights into the pathophysiology of EDs, contributing to improve the stratification of ED patients.

Supplementary Materials

The following supporting information can be downloaded at: https://www.mdpi.com/article/10.3390/nu15020406/s1, Table S1: Correlations among SLC6A4 methylation and serum Kynurenine/Tryptophan (Kyn/Trp) levels in EDs patients.

Author Contributions

Conceptualization, M.R.C.; designed the work, M.R.C., T.B., M.F. and E.V.; conducted all experiments, M.R.C., M.F., E.O. and G.M.; contributed to clinical evaluation, E.V.; contributed to data acquisition, M.R.C. and M.F.; contributed to the interpretation of results, M.R.C., E.V. and M.F; performed the statistical analysis, A.P. and M.D.N.; drafted the manuscript, M.F. and M.R.C.; revised the manuscript, C.O., E.V., L.D.R. and T.B.; project administration, T.B. and L.S. All authors have read and agreed to the published version of the manuscript.

Funding

This research received no external funding.

Institutional Review Board Statement

The study was conducted in accordance with the Declaration of Helsinki and approved by the Ethics Committee of the Aziende Sanitarie (CEAS) della Regione Umbria (Italy) Prot. No. 29616/12/AV.

Informed Consent Statement

Informed consent was obtained from all subjects involved in the study.

Data Availability Statement

All data generated or analyzed during this study are included in this published article.

Acknowledgments

MF was supported by Fondazione Umberto Veronesi. We thank all patients with EDs and their families for participation in this study. We very much appreciated the work and the collaboration of all healthcare professionals for the invaluable help during patient enrollment. In particular, we thank Valentina Benfatti and Kathleeen Ortenzi for their passion and their help.

Conflicts of Interest

The authors declare no conflict of interest.

References

  1. American Psychiatric Association. Diagnostic and Statistical Manual of Mental Disorders: DSM-5; American Psychiatric Association: Arlington, VA, USA, 2013. [Google Scholar]
  2. Arcelus, J.; Mitchell, A.J.; Wales, J.; Nielsen, S. Mortality rates in patients with anorexia nervosa and other eating disorders: A meta-analysis of 36 studies. Arch. Gen. Psychiatry 2011, 68, 724–731. [Google Scholar] [CrossRef] [PubMed] [Green Version]
  3. Udo, T.; Grilo, C.M. Prevalence and correlates of DSM-5-defined eating disorders in a nationally representative sample of US adults. Biol. Psychiatry. 2018, 84, 345–354. [Google Scholar] [CrossRef]
  4. Feltner, C.; Peat, C.; Reddy, S.; Riley, S.; Berkman, N.; Middleton, J.C.; Balio, C.; Coker-Schwimmer, M.; Jonas, D.E. Screening for Eating Disorders in Adolescents and Adults: Evidence Report and Systematic Review for the US Preventive Services Task Force. JAMA 2022, 327, 1068–1082. [Google Scholar] [CrossRef]
  5. Momen, N.C.; Plana-Ripoll, O.; Bulik, C.M.; McGrath, J.J.; Thornton, L.M.; Yilmaz, Z.; Petersen, L.V. Comorbidity between types of eating disorder and general medical conditions. Br. J. Psychiatry 2021, 23, 1–8. [Google Scholar] [CrossRef]
  6. Levinson, C.A.; Cusack, C.; Brown, M.L.; Smith, A.R. A network approach can improve eating disorder conceptualization and treatment. Nat. Rev. Psychol. 2022, 1, 419–430. [Google Scholar] [CrossRef]
  7. Preti, A.; de Girolamo, G.; Vilagut, G.; Alonso, J.; de Graaf, R.; Bruffaerts, R.; Demyttenaere, K.; Pinto-Meza, A.; Haro, J.M.; Morosini, P.; et al. The epidemiology of eating disorders in six European countries: Results of the ESEMeD-WMH project. J. Psychiatr. Res. 2009, 43, 1125–1132. [Google Scholar] [CrossRef] [Green Version]
  8. Merikangas, K.R.; He, J.P.; Burstein, M.; Swanson, S.A.; Avenevoli, S.; Cui, L.; Benjet, C.; Georgiades, K.; Swendsen, J. Lifetime prevalence of mental disorders in U.S. adolescents: Results from the National Comorbidity Survey Replication-Adolescent Supplement (NCS-A). J. Am. Acad. Child Adolesc. Psychiatry 2010, 49, 980–989. [Google Scholar] [CrossRef] [Green Version]
  9. Paolacci, S.; Kiani, A.K.; Manara, E.; Beccari, T.; Ceccarini, M.R.; Stuppia, L.; Chiurazzi, P.; Dalla Ragione, L.; Bertelli, M. Genetic contributions to the etiology of anorexia nervosa: New perspectives in molecular diagnosis and treatment. Mol. Genet. Genom. Med. 2020, 8, e1244. [Google Scholar] [CrossRef] [PubMed]
  10. Bulik, C.M.; Coleman, J.R.I.; Hardaway, J.A.; Breithaupt, L.; Watson, H.J.; Bryant, C.D.; Breen, G. Genetics and neurobiology of eating disorders. Nat. Neurosci. 2022, 25, 543–554. [Google Scholar] [CrossRef] [PubMed]
  11. Ceccarini, M.R.; Precone, V.; Manara, E.; Paolacci, S.; Maltese, P.E.; Benfatti, V.; Dhuli, K.; Donato, K.; Guerri, G.; Marceddu, G.; et al. A next generation sequencing gene panel for use in the diagnosis of anorexia nervosa. Eat Weight Disord. 2022, 27, 1869–1880. [Google Scholar] [CrossRef]
  12. Trace, S.E.; Baker, J.H.; Peñas-Lledó, E.; Bulik, C.M. The genetics of eating disorders. Annu. Rev. Clin. Psychol. 2013, 9, 589–620. [Google Scholar] [CrossRef] [Green Version]
  13. Hinney, A.; Volckmar, A.L. Genetics of eating disorders. Curr. Psychiatry Rep. 2013, 15, 423. [Google Scholar] [CrossRef] [PubMed]
  14. Soubrié, P. Reconciling the role of central serotonin neurons in human and animal behavior. Behav. Brain Sci. 1986, 9, 319–335. [Google Scholar] [CrossRef]
  15. Walther, D.J.; Peter, J.U.; Bashammakh, S.; Hörtnagl, H.; Voits, M.; Fink, H.; Bader, M. Synthesis of serotonin by a second tryptophan hydroxylase isoform. Science 2003, 299, 76. [Google Scholar] [CrossRef] [PubMed]
  16. Brewerton, T.D. Toward a unified theory of serotonin dysregulation in eating and related disorders. Psychoneuroendocrinology 1995, 20, 561–590. [Google Scholar] [CrossRef]
  17. Boehm, I.; Walton, E.; Alexander, N.; Batury, V.L.; Seidel, M.; Geisler, D.; King, J.A.; Weidner, K.; Roessner, V.; Ehrlich, S. Peripheral serotonin transporter DNA methylation is linked to increased salience network connectivity in females with anorexia nervosa. J. Psychiatry Neurosci. 2020, 45, 206–213. [Google Scholar] [CrossRef] [PubMed]
  18. Kaye, W.H.; Gwirtsman, H.E.; Brewerton, T.D.; George, D.T.; Wurtman, R.J. Bingeing behavior and plasma amino acids: A possible involvement of brain serotonin in bulimia nervosa. Psychiatry Res. 1988, 23, 31–43. [Google Scholar] [CrossRef]
  19. Favaro, A.; Caregaro, L.; Burlina, A.B.; Santonastaso, P. Tryptophan levels, excessive exercise, and nutritional status in anorexia nervosa. Psychosom. Med. 2000, 62, 535–538. [Google Scholar] [CrossRef] [Green Version]
  20. Lischka, J.; Schanzer, A.; Baumgartner, M.; de Gier, C.; Greber-Platzer, S.; Zeyda, M. Tryptophan Metabolism Is Associated with BMI and Adipose Tissue Mass and Linked to Metabolic Disease in Pediatric Obesity. Nutrients 2022, 14, 286. [Google Scholar] [CrossRef]
  21. Sundaramurthy, D.; Pieri, L.F.; Gape, H.; Markham, A.F.; Campbell, D.A. Analysis of the serotonin transporter gene linked polymorphism (5-HTTLPR) in anorexia nervosa. Am. J. Med. Genet. 2000, 96, 53–55. [Google Scholar] [CrossRef]
  22. Gelernter, J.; Pakstis, A.J.; Kidd, K.K. Linkage mapping of serotonin transporter protein gene SLC6A4 on chromosome 17. Hum. Genet. 1995, 95, 677–680. [Google Scholar] [CrossRef]
  23. Murphy, D.L.; Moya, P.R. Human serotonin transporter gene (SLC6A4) variants: Their contributions to understanding pharmacogenomic and other functional G x G and G x E differences in health and disease. Curr. Opin. Pharmacol. 2011, 11, 3–10. [Google Scholar] [CrossRef] [Green Version]
  24. Rozenblat, V.; Ong, D.; Fuller-Tyszkiewicz, M.; Akkermann, K.; Collier, D.; Engels, R.R.C.M.E.; Fernandez-Aranda, F.; Harro, J.; Homberg, J.R.; Karwautz, A.; et al. A systematic review and secondary data analysis of the interactions between the serotonin transporter 5-HTTLPR polymorphism and environmental and psychological factors in eating disorders. J. Psychiatr. Res. 2017, 84, 62–72. [Google Scholar] [CrossRef] [PubMed] [Green Version]
  25. Jang, Y.J.; Lim, S.W.; Moon, Y.K.; Kim, S.Y.; Lee, H.; Kim, S.; Kim, D.K. 5-HTTLPR-rs25531 and Antidepressant Treatment Outcomes in Korean Patients with Major Depression. Pharmacopsychiatry 2021, 54, 269–278. [Google Scholar] [CrossRef] [PubMed]
  26. Tanahashi, S.; Tanii, H.; Konishi, Y.; Otowa, T.; Sasaki, T.; Tochigi, M.; Okazaki, Y.; Kaiya, H.; Okada, M. Association of Serotonin Transporter Gene (5-HTTLPR/rs25531) Polymorphism with Comorbidities of Panic Disorder. Neuropsychobiology 2021, 80, 333–341. [Google Scholar] [CrossRef] [PubMed]
  27. Li, G.; Wang, L.; Cao, C.; Fang, R.; Hall, B.J.; Elhai, J.D.; Liberzon, I. Post-traumatic stress symptoms of children and adolescents exposed to the 2008 Wenchuan Earthquake: A longitudinal study of 5-HTTLPR genotype main effects and gene-environment interactions. Int. J. Psychol. 2021, 56, 22–29. [Google Scholar] [CrossRef]
  28. Pringle, A.; Jennings, K.A.; Line, S.; Bannerman, D.M.; Higgs, S.; Sharp, T. Mice overexpressing the 5-hydroxytryptamine transporter show no alterations in feeding behaviour and increased non-feeding responses to fenfluramine. Psychopharmacology 2008, 200, 291–300. [Google Scholar] [CrossRef]
  29. Murphy, D.L.; Lesch, K.P. Targeting the murine serotonin transporter: Insights into human neurobiology. Nat. Rev. Neurosci. 2008, 9, 85–96. [Google Scholar] [CrossRef] [Green Version]
  30. Steiger, H.; Booij, L. Eating Disorders, Heredity and Environmental Activation: Getting Epigenetic Concepts into Practice. J. Clin. Med. 2020, 9, 1332. [Google Scholar] [CrossRef]
  31. Franzago, M.; La Rovere, M.; Guanciali Franchi, P.; Vitacolonna, E.; Stuppia, L. Epigenetics and human reproduction: The primary prevention of the noncommunicable diseases. Epigenomics 2019, 11, 1441–1460. [Google Scholar] [CrossRef]
  32. Kang, H.J.; Kim, J.M.; Stewart, R.; Kim, S.Y.; Bae, K.Y.; Kim, S.W.; Shin, I.S.; Shin, M.G.; Yoon, J.S. Association of SLC6A4 methylation with early adversity, characteristics and outcomes in depression. Prog. Neuropsychopharmacol. Biol. Psychiatry 2013, 44, 23–28. [Google Scholar] [CrossRef]
  33. Booij, L.; Szyf, M.; Carballedo, A.; Frey, E.M.; Morris, D.; Dymov, S.; Vaisheva, F.; Ly, V.; Fahey, C.; Meaney, J.; et al. DNA methylation of the serotonin transporter gene in peripheral cells and stress-related changes in hippocampal volume: A study in depressed patients and healthy controls. PLoS ONE 2015, 10, e0119061. [Google Scholar] [CrossRef] [PubMed] [Green Version]
  34. Alasaari, J.S.; Lagus, M.; Ollila, H.M.; Toivola, A.; Kivimäki, M.; Vahtera, J.; Kronholm, E.; Härmä, M.; Puttonen, S.; Paunio, T. Environmental stress affects DNA methylation of a CpG rich promoter region of serotonin transporter gene in a nurse cohort. PLoS ONE 2012, 7, e45813. [Google Scholar] [CrossRef] [PubMed]
  35. Zhao, J.; Goldberg, J.; Vaccarino, V. Promoter methylation of serotonin transporter gene is associated with obesity measures: A monozygotic twin study. Int. J. Obes. 2013, 37, 140–145. [Google Scholar] [CrossRef] [PubMed] [Green Version]
  36. Ruddick, J.P.; Evans, A.K.; Nutt, D.J.; Lightman, S.L.; Rook, G.A.; Lowry, C.A. Tryptophan metabolism in the central nervous system: Medical implications. Expert Rev. Mol. Med. 2006, 8, 1–27. [Google Scholar] [CrossRef]
  37. Floc’h, L.; Otten, W.; Merlot, E. Tryptophan metabolism, from nutrition to potential therapeutic applications. Amino Acids 2011, 41, 1195–1205. [Google Scholar] [CrossRef]
  38. Bender, D.A.; Olufunwa, R. Utilization of tryptophan, nicotinamide and nicotinic acid as precursors for nicotinamide nucleotide synthesis in isolated rat liver cells. Br. J. Nutr. 1988, 59, 279–287. [Google Scholar] [CrossRef] [Green Version]
  39. Mondanelli, G.; Coletti, A.; Greco, F.A.; Pallotta, M.T.; Orabona, C.; Iacono, A.; Belladonna, M.L.; Albini, E.; Panfili, E.; Fallarino, F.; et al. Positive allosteric modulation of indoleamine 2,3-dioxygenase 1 restrains neuroinflammation. Proc. Natl. Acad. Sci. USA 2020, 117, 3848–3857. [Google Scholar] [CrossRef]
  40. Chen, Y.; Guillemin, G.J. Kynurenine pathway metabolites in humans: Disease and healthy States. Int. J. Tryptophan Res. 2009, 2, 1–19. [Google Scholar] [CrossRef] [Green Version]
  41. Ceccarini, M.R.; Fittipaldi, S.; Ciccacci, C.; Granese, E.; Centofanti, F.; Dalla Ragione, L.; Bertelli, M.; Beccari, T.; Botta, A. Association Between DRD2 and DRD4 Polymorphisms and Eating Disorders in an Italian Population. Front. Nutr. 2022, 9, 838177. [Google Scholar] [CrossRef]
  42. Garner, D.M. The Eating Disorder Inventory-3: Professional Manual; Psychological Assessment Resources Inc.: Odessa, FL, USA, 2004. [Google Scholar]
  43. Ceccarini, M.R.; Tasegian, A.; Franzago, M.; Patria, F.F.; Albi, E.; Codini, M.; Conte, C.; Bertelli, M.; Dalla Ragione, L.; Stuppia, L. 5-HT2AR and BDNF gene variants in eating disorders susceptibility. Am. J. Med. Genet. B Neuropsychiatr. Genet. 2020, 183, 155–163. [Google Scholar] [CrossRef]
  44. Franzago, M.; Porreca, A.; D’Ardes, M.; Di Nicola, M.; Di Tizio, L.; Liberati, M.; Stuppia, L.; Vitacolonna, E. The Obesogenic Environment: Epigenetic Modifications in Placental Melanocortin 4 Receptor Gene Connected to Gestational Diabetes and Smoking. Front. Nutr. 2022, 9, 879526. [Google Scholar] [CrossRef] [PubMed]
  45. Brandacher, G.; Hoeller, E.; Fuchs, D.; Weiss, H.G. Chronic Immune Activation Underlies Morbid Obesity: Is IDO a Key Player? Curr. Drug Metab. 2007, 8, 289–295. [Google Scholar] [CrossRef]
  46. Breum, L.; Rasmussen, M.H.; Hilsted, J.; Fernstrom, J.D. Twenty-four-hour plasma tryptophan concentrations and ratios are below normal in obese subjects and are not normalized by substantial weight reduction. Am. J. Clin. Nutr. 2003, 77, 1112–1118. [Google Scholar] [CrossRef] [PubMed] [Green Version]
  47. Caballero, B.; Finer, N.; Wurtman, R.J. Plasma amino acids and insulin levels in obesity: Response to carbohydrate intake and tryptophan supplements. Metabolism 1988, 37, 672–676. [Google Scholar] [CrossRef]
  48. Ashley, D.V.; Fleury, M.O.; Golay, A.; Maeder, E.; Leathwood, P.D. Evidence for diminished brain 5-hydroxytryptamine biosynthesis in obese diabetic and non-diabetic humans. Am. J. Clin. Nutr. 1985, 42, 1240–1245. [Google Scholar] [CrossRef] [PubMed]
  49. Chaves Filho, A.J.M.; Lima, C.N.C.; Vasconcelos, S.M.M.; de Lucena, D.F.; Maes, M.; Macedo, D. IDO chronic immune activation and tryptophan metabolic pathway: A potential pathophysiological link between depression and obesity. Prog. Neuropsychopharmacol. Biol. Psychiatry 2018, 80, 234–249. [Google Scholar] [CrossRef]
  50. Cussotto, S.; Delgado, I.; Anesi, A.; Dexpert, S.; Aubert, A.; Beau, C.; Forestier, D.; Ledaguenel, P.; Magne, E.; Mattivi, F.; et al. Tryptophan Metabolic Pathways Are Altered in Obesity and Are Associated with Systemic Inflammation. Front. Immunol. 2020, 11, 557. [Google Scholar] [CrossRef] [PubMed] [Green Version]
  51. Badawy, A.A. Kynurenine Pathway of Tryptophan Metabolism: Regulatory and Functional Aspects. Int. J. Tryptophan Res. 2017, 10, 1178646917691938. [Google Scholar] [CrossRef] [Green Version]
  52. Jamshed, L.; Debnath, A.; Jamshed, S.; Wish, J.V.; Raine, J.C.; Tomy, G.T.; Thomas, P.J.; Holloway, A.C. An Emerging Cross-Species Marker for Organismal Health: Tryptophan-Kynurenine Pathway. Int. J. Mol. Sci. 2022, 23, 6300. [Google Scholar] [CrossRef]
  53. Strasser, B.; Berger, K.; Fuchs, D. Effects of a caloric restriction weight loss diet on tryptophan metabolism and inflammatory biomarkers in overweight adults. Eur. J. Nutr. 2015, 54, 101–107. [Google Scholar] [CrossRef]
  54. Gauthier, C.; Hassler, C.; Mattar, L.; Launay, J.M.; Callebert, J.; Steiger, H.; Melchior, J.C.; Falissard, B.; Berthoz, S.; Mourier-Soleillant, V.; et al. Symptoms of depression and anxiety in anorexia nervosa: Links with plasma tryptophan and serotonin metabolism. Psychoneuroendocrinology 2014, 39, 170–178. [Google Scholar] [CrossRef]
  55. Attia, E.; Wolk, S.; Cooper, T.; Glasofer, D.; Walsh, B.T. Plasma tryptophan during weight restoration in patients with anorexia nervosa. Biol. Psychiatry 2005, 57, 674–678. [Google Scholar] [CrossRef] [PubMed]
  56. Dudzińska, E.; Szymona, K.; Kloc, R.; Kocki, T.; Gil-Kulik, P.; Bogucki, J.; Kocki, J.; Paduch, R.; Urbańska, E.M. Fractalkine, sICAM-1 and Kynurenine Pathway in Restrictive Anorexia Nervosa-Exploratory Study. Nutrients 2021, 13, 339. [Google Scholar] [CrossRef]
  57. Haleem, D.J. Improving therapeutics in anorexia nervosa with tryptophan. Life Sci. 2017, 178, 87–93. [Google Scholar] [CrossRef]
  58. Goodwin, G.M.; Shapiro, C.M.; Bennie, J.; Dick, H.; Carroll, S.; Fink, G. The neuroendocrine responses and psychological effects of infusion of L-tryptophan in anorexia nervosa. Psychol. Med. 1989, 19, 857–864. [Google Scholar] [CrossRef]
  59. Kaye, W.H.; Barbarich, N.C.; Putnam, K.; Gendall, K.A.; Fernstrom, J.; Fernstrom, M.; McConaha, C.W.; Kishore, A. Anxiolytic effects of acute tryptophan depletion in anorexia nervosa. Int. J. Eat Disord. 2003, 33, 257–267. [Google Scholar] [CrossRef] [PubMed]
  60. van Galen, K.A.; Booij, J.; Schrantee, A.; Adriaanse, S.M.; Unmehopa, U.A.; Fliers, E.; Schwartz, G.J.; DiLeone, R.J.; Ter Horst, K.W.; la Fleur, S.E.; et al. The response to prolonged fasting in hypothalamic serotonin transporter availability is blunted in obesity. Metabolism 2021, 123, 154839. [Google Scholar] [CrossRef]
  61. Hübel, C.; Marzi, S.J.; Breen, G.; Bulik, C.M. Epigenetics in eating disorders: A systematic review. Mol. Psychiatry 2019, 24, 901–915. [Google Scholar] [CrossRef] [PubMed]
  62. Campbell, I.C.; Mill, J.; Uher, R.; Schmidt, U. Eating disorders, gene–environment interactions and epigenetics. Neurosci. Biobehav. Rev. 2011, 35, 784–793. [Google Scholar] [CrossRef]
  63. Pjetri, E.; Schmidt, U.; Kas, M.; Campbell, I. Epigenetics and eating disorders. Curr. Opin. Clin. Nutr. Metab. Care 2012, 15, 330–335. [Google Scholar] [CrossRef]
  64. Ehrlich, S.; Weiss, D.; Burghardt, R.; Infante-Duarte, C.; Brockhaus, S.; Muschler, M.A.; Bleich, S.; Lehmkuhl, U.; Frieling, H. Promoter specific DNA methylation and gene expression of POMC in acutely underweight and recovered patients with anorexia nervosa. J. Psychiatr. Res. 2010, 44, 827–833. [Google Scholar] [CrossRef]
  65. Wyler, S.C.; Lord, C.C.; Lee, S.; Elmquist, J.K.; Liu, C. Serotonergic Control of Metabolic Homeostasis. Front. Cell Neurosci. 2017, 11, 277. [Google Scholar] [CrossRef] [PubMed] [Green Version]
  66. Silverstein-Metzler, M.G.; Shively, C.A.; Clarkson, T.B.; Appt, S.E.; Carr, J.J.; Kritchevsky, S.B.; Jones, S.R.; Register, T.C. Sertraline inhibits increases in body fat and carbohydrate dysregulation in adult female cynomolgus monkeys. Psychoneuroendocrinology 2016, 68, 29–38. [Google Scholar] [CrossRef] [Green Version]
  67. Palma-Gudiel, H.; Fañanás, L. An integrative review of methylation at the serotonin transporter gene and its dialogue with environmental risk factors, psychopathology and 5-HTTLPR. Neurosci. Biobehav. Rev. 2017, 72, 190–209. [Google Scholar] [CrossRef]
  68. Steiger, H.; Booij, L.; Kahan, E.; McGregor, K.; Thaler, L.; Fletcher, E.; Labbe, A.; Joober, R.; Israël, M.; Szyf, M.; et al. A longitudinal, epigenome-wide study of DNA methylation in anorexia nervosa: Results in actively ill, partially weight-restored, long-term remitted and non-eating-disordered women. J. Psychiatry Neurosci. 2019, 44, 205–213. [Google Scholar] [CrossRef] [Green Version]
  69. Pjetri, E.; Dempster, E.; Collier, D.A.; Treasure, J.; Kas, M.J.; Mill, J.; Campbell, I.C.; Schmidt, U. Quantitative promoter DNA methylation analysis of four candidate genes in anorexia nervosa: A pilot study. J. Psychiatr. Res. 2013, 47, 280–282. [Google Scholar] [CrossRef]
  70. Frieling, H.; Römer, K.D.; Wilhelm, J.; Hillemacher, T.; Kornhuber, J.; de Zwaan, M.; Jacoby, G.E.; Bleich, S. Association of catecholamine-O-methyltransferase and 5-HTTLPR genotype with eating disorder-related behavior and attitudes in females with eating disorders. Psychiatr. Genet. 2006, 16, 205–208. [Google Scholar] [CrossRef] [PubMed]
  71. Ando, T.; Ichimaru, Y.; Konjiki, F.; Shoji, M.; Komaki, G. Variations in the preproghrelin gene correlate with higher body mass index, fat mass, and body dissatisfaction in young Japanese women. Am. J. Clin. Nutr. 2007, 86, 25–32. [Google Scholar] [CrossRef] [PubMed] [Green Version]
  72. Nisoli, E.; Brunani, A.; Borgomainerio, E.; Tonello, C.; Dioni, L.; Briscini, L.; Redaelli, G.; Molinari, E.; Cavagnini, F.; Carruba, M.O. D2 dopamine receptor (DRD2) gene Taq1A polymorphism and the eating-related psychological traits in eating disorders (anorexia nervosa and bulimia) and obesity. Eat Weight Disord. 2007, 12, 91–96. [Google Scholar] [CrossRef] [PubMed]
  73. Castellini, G.; Franzago, M.; Bagnoli, S.; Lelli, L.; Balsamo, M.; Mancini, M.; Nacmias, B.; Ricca, V.; Sorbi, S.; Antonucci, I.; et al. Fat mass and obesity-associated gene (FTO) is associated to eating disorders susceptibility and moderates the expression of psychopathological traits. PLoS ONE 2017, 12, e0173560. [Google Scholar] [CrossRef] [PubMed] [Green Version]
  74. Miller, K.K.; Wexler, T.L.; Zha, A.M.; Lawson, E.A.; Meenaghan, E.M.; Misra, M.; Binstock, A.B.; Herzog, D.B.; Klibanski, A. Androgen deficiency: Association with increased anxiety and depression symptom severity in anorexia nervosa. J. Clin. Psychiatry 2007, 68, 959–965. [Google Scholar] [CrossRef]
  75. Monteleone, P.; Santonastaso, P.; Pannuto, M.; Favaro, A.; Caregaro, L.; Castaldo, E.; Zanetti, T.; Maj, M. Enhanced serum cholesterol and triglyceride levels in bulimia nervosa: Relationships to psychiatric comorbidity, psychopathology and hormonal variables. Psychiatry Res. 2005, 134, 267–273. [Google Scholar] [CrossRef]
  76. Domschke, K.; Tidow, N.; Schwarte, K.; Deckert, J.; Lesch, K.P.; Arolt, V.; Zwanzger, P.; Baune, B.T. Serotonin transporter gene hypomethylation predicts impaired antidepressant treatment response. Int. J. Neuropsychopharmacol. 2014, 17, 1167–1176. [Google Scholar] [CrossRef] [PubMed] [Green Version]
  77. Webb, L.M.; Phillips, K.E.; Ho, M.C.; Veldic, M.; Blacker, C.J. The Relationship between DNA Methylation and Antidepressant Medications: A Systematic Review. Int. J. Mol. Sci. 2020, 21, 826. [Google Scholar] [CrossRef] [PubMed]
Figure 1. Schematic representation of the SLC6A4 gene and the upstream region. The region sequenced to analyze DNA methylation levels of the six CpG sites (in bold) is shown.
Nutrients 15 00406 g001
Figure 2. Boxplot and Mann–Whitney U test for Kyn (Panel A), Trp (Panel B), and the Kyn/Trp ratio (Panel C) with vomit, excessive levels of physical activity (EPA), and binge eating behavior. Significance code: * p < 0.05, ** p < 0.01, *** p < 0.001, **** p < 0.0001.
Nutrients 15 00406 g002
Table 1. Sociodemographic and anthropometric characteristics of EDs and control group. Summary descriptive table by groups of diagnosis expressed as median (q1 = first quartile; q3 = third quartile) for continuous variable and absolute frequency (% = column percentage) for categorical. Significance values are according to the Kruskal–Wallis and chi-squared tests. Statistically significant values are in bold. * = The p-value refers to the difference between independent groups excluding the control group. Abbreviations: AN0 = restricting anorexia nervosa; AN1 = purging anorexia nervosa; BN = bulimia; BED = binge eating disorders; UFED = unspecified feeding or eating disorder; OSFED = other specified eating disorders; CTR = controls.
VariablesAN0AN1BNBEDUFEDOSFEDCTRp-Value *
Gender: 0.001
Female45 (100.0)21 (100.0)20 (95.2)23 (74.2)19 (82.6)12 (85.7)29 (85.3)
Male0 (0.0)0 (0.0)1 (4.76)8 (25.8)4 (17.4)2 (14.3)5 (14.7)
Relatives with EDs: 0.309
No27 (61.4)17 (81.0)12 (66.7)17 (58.6)13 (56.5)6 (42.9)34 (100.0)
Yes17 (38.6)4 (19.0)6 (33.3)12 (41.4)10 (43.5)8 (57.1)0 (0.0)
Age at time of admission, years16.0 [14.0;18.0]18.0 [17.0;19.0]19.0 [17.0;26.0]39.0 [20.2;52.8]54.0 [18.5;64.5]54.5 [35.2;58.5]25.0 [24.0;33.0]<0.001
Heigh, m1.62 [1.57;1.65]1.62 [1.58;1.65]1.67 [1.60;1.71]1.65 [1.60;1.70]1.60 [1.58;1.69]1.67 [1.60;1.73]1.70 [1.62;1.75]0.124
Minimum Weight, kg38.0 [34.0;40.0]41.4 [37.6;48.0]48.0 [45.0;55.0]70.0 [62.2;85.5]67.0 [58.0;85.0]65.0 [48.0;75.0]56.0 [53.0;60.0]<0.001
Maximum Weight, kg54.5 [50.0;58.5]57.0 [53.0;63.0]68.0 [60.0;75.2]111 [106;126]106 [96.0;128]113 [98.5;130]63.0 [58.5;70.5]<0.001
BMI, kg/m214.4 [13.6;15.4]15.8 [14.7;17.2]17.7 [16.1;19.0]26.2 [23.6;30.9]25.4 [21.9;31.5]22.3 [18.9;26.9]20.5 [19.0;21.7]<0.001
Maximum BMI, kg/m221.3 [19.8;23.3]22.9 [19.7;24.6]24.3 [23.1;25.9]45.7 [38.3;49.3]42.3 [37.3;46.9]38.9 [37.1;45.9]22.8 [21.5;23.6]<0.001
Table 2. Eating behaviors and physical characteristics of ED groups. Descriptive statistics by groups of diagnosis for eating behaviors and physical characteristics expressed as column percentage. The p-values results from the chi-squared test. Statistically significant values are in bold. Abbreviations: AN0 = restricting anorexia nervosa; AN1 = purging anorexia nervosa; BN = bulimia; BED= binge eating disorders; UFED = unspecified feeding or eating disorder; OSFED = other specified eating disorders, CPAP: Continuous Positive Airway Pressure.
VariablesAN0AN1BNBEDUFEDOSFEDp-Value
Secondary Amenorrhea: <0.001
No10.536.837.547.437.550.0
Yes89.563.262.510.518.830.0
Menopause0.000.000.0042.143.820.0
Food restriction: <0.001
No0.000.005.5636.040.033.3
Yes10010094.464.060.066.7
Water restriction: <0.001
No45.547.666.784.090.091.7
Yes54.552.433.316.010.08.33
Fasting: <0.001
No22.720.016.773.1 80.0 83.3
Yes77.380.083.326.920.0 16.7
Diets pills: 0.002
No10078.994.473.185.083.3
Yes0.0021.15.5626.915.016.7
Binge eating: <0.001
No84.145.011.10.0040.016.7
Yes15.955.088.910060.083.3
Vomit: <0.001
No86.415.011.192.384.291.7
Yes13.685.088.97.6915.88.33
Alcohol abuse: 0.112
No95.388.975.092.310090.9
Yes4.6511.125.07.690.009.09
Laxatives abuse: 0.008
No93.265.066.792.394.783.3
Yes6.8235.033.37.695.2616.7
Diuretics abuse: 0.027
No10084.288.296.210091.7
Yes0.0015.811.83.850.008.33
Drugs abuse: 0.303
No95.510094.492.310083.3
Yes4.550.005.567.690.0016.7
Excessive physical activity: <0.001
No20.510.033.392.390.083.3
Yes79.590.066.77.710.016.7
Sleep disorder: 0.116
No20.018.254.550.042.916.7
Yes80.081.845.550.057.183.3
CPAP ventilator: 0.002
No100.0100.0100.069.271.4100.0
Yes0.00.00.030.828.60.0
Table 3. Clinical data of ED groups. Summary descriptive table by groups of diagnosis for laboratory variables expressed as median (q1 = first quartile; q3 = third quartile). p-values are according to the Kruskal–Wallis test. Statistically significant values are in bold. TSH: thyroid-stimulating hormone, WBCs: white blood cells, RBCs: red blood cells, PLT: platelet, Hb: hemoglobin, Ht: hematocrit, MCV: mean corpuscular volume, fL: femtoliter. Abbreviations: AN0 = restricting anorexia nervosa; AN1 = purging anorexia nervosa; BN = bulimia; BED = binge eating disorders; UFED = unspecified feeding or eating disorder; OSFED = other specified eating disorders.
VariablesAN0AN1BNBEDUFEDOSFEDp-Value
Glycemia, mg/dL76.0
[67.8;80.8]
80.0
[72.2;85.0]
80.5
[69.8;84.5]
90.0
[85.0;101]
96.5
[85.5;104]
96.0
[87.0;104]
<0.001
Azotemia, mg/dL31.8
[25.0;42.0]
25.5
[20.8;38.2]
28.4
[23.5;31.8]
32.0 [29.2;37.5]30.0 [27.0;34.5]34.0 [27.2;37.0]0.690
Creatinine, mg/dL0.74 [0.62;0.86]0.71 [0.67;0.82]0.78 [0.66;0.83]0.74 [0.62;0.79]0.77 [0.68;0.90]0.78 [0.68;0.83]0.756
TSH, mU/L2.07 [1.42;2.71]2.00 [1.55;3.04]1.77 [1.34;2.34]2.57 [2.05;3.19]2.71 [1.81;3.26]2.59 [1.94;4.00]0.203
Amylasi, U/L68.0 [51.5;101]84.0 [64.0;104]69.5 [55.0;79.2]47.0 [33.0;59.0]52.0 [37.2;65.2]65.0 [65.0;65.0]0.126
WBCs, ×03/uL5.19 [3.90;6.10]5.14 [4.72;6.88]6.19 [5.00;7.10]8.22 [7.12;9.00]7.18 [6.16;8.34]6.97 [6.17;8.18]<0.001
RBCs, ×06/uL4.20 [3.90;4.72]4.43 [4.14;4.47]4.42 [4.30;4.78]4.90 [4.73;5.12]4.82 [4.62;5.24]4.73 [4.64;5.08]<0.001
PLT, ×03/uL214 [181;238]221 [200;292]245 [212;302]273 [249;312]260 [221;287]254 [226;296]<0.001
Hb, g/dL13.2 [12.4;14.1]13.3 [12.7;13.7]13.4 [12.1;13.8]14.1 [13.0;14.7]13.3 [12.4;14.8]13.7 [13.2;14.1]0.270
Ht, vol%38.7 [37.1;41.6]39.6 [37.5;40.9]39.5 [38.1;41.2]43.2 [40.8;44.4]40.5 [37.8;43.8]40.5 [39.8;42.9]0.001
MCV, fL90.8 [87.2;94.8]89.4 [88.4;91.6]87.6 [85.3;91.7]87.0 [83.8;89.1]84.6 [80.6;88.0]85.8 [82.8;89.9]0.002
Serum protein electrophoresis, g/dL7.30 [6.85;7.75]7.30 [7.20;7.60]7.40 [7.00;7.65]7.00 [6.82;7.58]7.05 [6.95;7.15]7.30 [7.30;7.30]0.814
Table 4. DNA methylation levels of the six CpG sites at SLC6A4 in ED groups and controls. Summary descriptive table by groups of diagnosis expressed as median ([q1 = first quartile; q3 = third quartile) for continuous variable and absolute frequency (% = column percentage) for categorical. Significance values are according to the Kruskal–Wallis test. To show the pairwise differences, we assigned a number to each group: AN0 = (a), AN1 = (b), BN = (c), BED = (d), UFED = (e), OSFED = (f) and, CTR = (*). Statistically significant values are in bold. Abbreviations: AN0 = restricting anorexia nervosa; AN1 = purging anorexia nervosa; BN = bulimia; BED = binge eating disorders; UFED = unspecified feeding or eating disorder; OSFED = other specified eating disorders; CTR = controls.
VariablesAN0 (a)AN1 (b)BN (c)BED (d)UFED (e)OSFED (f)CTR (*)p-Value
Kyn, µmol/L1.35 [1.07;1.57]
(d) (e) (f)
1.25
[1.09;1.46]
(d) (e) (f)
1.40
[1.06;1.72]
(d) (e) (f)
1.97
[1.60;2.35]
(*)
1.64
[1.45;2.21]
(*)
2.22
[1.90;2.34]
(*)
1.37
[1.11;1.58]
<0.001
Trp, µmol/L50.2 [42.4;53.9]
(d) (e) (f)
50.7
[45.8;58.0]
(*) (d) (e) (f)
50.6
[46.2;58.4]
(*) (d) (e) (f)
41.0 [35.2;47.0]
(*)
43.7
[36.0;46.5]
40.6
[36.3;46.1]
45.8
[42.2;49.5]
<0.001
Kyn/Trp, * 100025.5 [20.3;31.6]
(d) (e) (f)
25.6
[20.8;28.4]
(*) (d) (e) (f)
26.1
[23.6;30.1]
(d) (e) (f)
42.6 [36.8;54.3]
(*)
42.5
[33.8;50.5]
(*)
51.8
[42.6;60.6]
(*)
28.7
[25.4;34.2]
<0.001
SLC6A4 CpG1%2.03 [1.69;2.91]2.24
[1.83;2.69]
3.18
[2.02;4.26]
2.37 [1.89;3.46]2.44
[1.95;3.59]
2.10
[1.58;2.27]
2.32
[1.83;4.16]
0.230
SLC6A4 CpG2%6.04 [5.09;7.40]7.17
[4.32;9.65]
6.33
[4.99;7.82]
6.10 [4.83;7.94]5.36
[4.46;7.18]
5.00
[3.66;7.07]
7.31
[5.70;9.22]
0.270
SLC6A4 CpG3%,2.40 [1.81;2.77]2.68
[1.71;3.47]
2.17
[1.86;2.94]
2.42 [2.07;3.14]2.75
[1.68;3.58]
1.70
[0.00;2.58]
2.91
[2.15;3.66]
0.121
SLC6A4 CpG4%3.51 [2.71;4.53]4.81
[3.63;5.56]
3.97
[3.34;4.59]
4.63 [3.20;5.82]4.34
[3.61;5.05]
4.33
[3.29;5.13]
4.89
[3.84;5.58]
0.127
SLC6A4 CpG5%0.00 [0.00;2.42]
(d)
1.75
[0.00;2.28]
0.00
[0.00;2.51]
2.70 [0.91;3.47]2.18
[1.68;3.05]
0.91
[0.00;2.56]
2.21
[1.58;2.66]
0.021
SLC6A4 CpG6%0.00 [0.00;2.50]
(*)
1.38
[0.00;3.05]
2.21
[0.00;3.55]
2.81 [0.00;3.41]2.08
[0.00;3.09]
0.00
[0.00;3.13]
2.93
[2.00;3.82]
0.025
Mean Methylation%2.56 [2.20;3.22]
(*)
3.35
[2.37;4.27]
3.25
[2.41;4.03]
3.55 [2.60;4.46]3.09
[2.17;4.14]
2.78
[2.01;3.05]
3.87
[3.17;4.60]
0.008
Table 5. Psychopathological data for ED patients. Descriptive statistics by groups of diagnosis for EDI-3 questionnaire expressed as median (q1 = first quartile; q3 = third quartile). The p-values result from the Kruskal–Wallis test. Statistically significant values are in bold. DT: drive for thinness, B: bulimia, BD: body dissatisfaction, EDRC: eating disorder risk, LSE: low self-esteem, PA: personal alienation, II: interpersonal insecurity, IA: interpersonal alienation, ID: interoceptive deficits, ED: emotional dysregulation, P: perfectionism, A: ascetism, MF: maturity fears, ECC: eating concerns composite, IC: ineffectiveness composite, IPC: interpersonal problems composite, OC: overcontrol composite, GPM: global psychological maladjustment, ID: interoceptive deficits, APC: affective problems composite, IA: interpersonal alienation, ED: emotional dysregulation, IN: inconsistency, IF: infrequency, NI: negative impression. Abbreviations: AN0 = restricting anorexia nervosa; AN1 = purging anorexia nervosa; BN = bulimia; BED = binge eating disorders; UFED = unspecified feeding or eating disorder; OSFED = other specified eating disorders.
EDI VariablesAN0AN1BNBEDUFEDOSFEDp-Value
DT26.0 [22.0;28.0]28.0 [25.5;28.0]28.0 [21.0;28.0]15.0 [10.0;21.0]17.0 [11.0;21.0]16.0 [6.00;20.0]<0.001
B4.00 [1.00;5.00]7.00 [4.00;14.0]21.0 [7.00;22.0]16.0 [9.00;20.0]8.00 [4.00;11.0]10.0 [5.00;15.0]<0.001
BD32.0 [24.0;36.0]36.0 [33.5;38.0]34.0 [29.0;38.0]28.0 [22.0;33.0]28.0 [20.0;32.0]26.0 [16.0;31.0]0.006
EDCR60.0 [44.0;69.0]70.0 [65.0;75.0]85.0 [60.0;88.0]57.0 [47.0;71.0]54.0 [38.0;60.0]56.0 [44.0;65.0]0.001
LSE19.0 [17.0;21.0]17.0 [13.0;19.5]18.0 [16.0;23.0]10.0 [8.00;16.0]8.00 [4.00;17.5]9.00 [6.00;15.0]<0.001
PA17.0 [14.0;21.0]18.0 [10.0;21.5]21.0 [14.0;24.0]9.00 [7.00;13.0]8.00 [4.50;15.0]9.00 [6.00;14.0]<0.001
II17.0 [10.0;19.0]16.0 [14.5;21.5]16.0 [12.0;19.0]11.0 [6.00;16.0]10.0 [4.50;16.0]11.0 [6.00;13.0]0.001
IA13.0 [11.0;18.0]12.0 [10.0;17.0]15.0 [14.0;20.0]9.00 [7.00;12.0]9.00 [6.50;11.5]10.0 [6.00;13.0]0.001
ID22.0 [18.0;30.0]24.0 [18.0;29.5]23.0 [17.0;25.0]14.0 [7.00;18.0]10.0 [6.00;17.0]14.0 [4.00;18.0]<0.001
ED13.0 [10.0;17.0]15.0 [11.0;16.0]16.0 [11.2;20.2]6.00 [3.00;12.0]6.00 [2.50;10.0]3.00 [1.00;4.00]<0.001
P11.0 [7.00;14.0]11.0 [8.00;14.5]11.0 [8.00;19.0]10.0 [5.00;11.0]4.00 [2.00;9.50]5.00 [4.00;12.0]0.006
A15.0 [11.0;20.0]16.0 [12.0;18.5]14.0 [12.0;21.0]9.00 [5.00;14.0]6.50 [4.00;10.0]9.00 [6.00;13.0]<0.001
MF16.0 [14.0;25.0]16.0 [11.2;21.5]11.0 [7.00;19.0]9.00 [7.00;15.0]13.0 [10.5;16.0]12.0 [7.00;21.0]0.022
IC37.0 [29.0;41.0]34.0 [27.0;40.5]40.0 [28.0;46.0]21.0 [15.0;31.0]15.0 [9.50;35.5]19.0 [11.0;28.0]<0.001
IPC28.0 [23.0;37.0]27.0 [25.5;38.5]31.0 [27.0;36.0]22.0 [13.0;25.0]20.0 [12.0;25.5]23.0 [13.0;25.0]<0.001
APC33.0 [25.0;46.5]39.0 [30.0;45.0]38.5 [31.5;46.2]17.0 [12.0;33.0]14.0 [10.5;27.0]14.0 [7.00;19.0]<0.001
OC27.0 [19.0;33.0]26.0 [22.0;32.0]26.0 [22.0;40.0]16.0 [14.0;26.0]12.0 [7.50;16.0]16.0 [11.0;22.0]<0.001
GPM148 [114;166]153 [121;171]161 [133;166]96.0 [66.2;114]73.0 [50.0;115]62.5 [54.8;112]<0.001
IN10.5 [7.75;14.0]10.5 [8.25;11.8]5.00 [3.00;10.0]12.0 [8.00;15.0]9.00 [8.00;14.5]8.00 [7.00;12.5]0.113
IF1.00 [1.00;3.00]1.00 [0.00;2.00]1.00 [1.00;3.00]0.00 [0.00;1.00]1.00 [0.00;1.00]0.00 [0.00;1.00]0.045
NI28.0 [13.5;41.5]25.0 [16.5;37.8]46.0 [30.0;49.0]13.0 [8.00;22.0]11.0 [6.50;25.0]12.0 [8.00;18.0]<0.001
Disclaimer/Publisher’s Note: The statements, opinions and data contained in all publications are solely those of the individual author(s) and contributor(s) and not of MDPI and/or the editor(s). MDPI and/or the editor(s) disclaim responsibility for any injury to people or property resulting from any ideas, methods, instructions or products referred to in the content.

