Article

Association between Selenium Intake and Optimal Sleep Duration: A National Longitudinal Study

1
School of Public Health, Chongqing Medical University, Chongqing 400016, China
2
Research Center for Medicine and Social Development, Chongqing Medical University, Chongqing 400016, China
3
Research Center for Public Health Security, Chongqing Medical University, Chongqing 400016, China
4
Human Nutrition Department, College of Health Sciences, QU Health, Qatar University, Doha 2713, Qatar
5
Department of Epidemiology and Health Statistics, School of Public Health, Capital Medical University, Beijing 100069, China
6
Chongqing Key Laboratory of Child Nutrition and Health, Children’s Hospital of Chongqing Medical University, Chongqing 400014, China
*
Author to whom correspondence should be addressed.
Nutrients 2023, 15(2), 397; https://doi.org/10.3390/nu15020397
Submission received: 8 November 2022 / Revised: 6 January 2023 / Accepted: 10 January 2023 / Published: 12 January 2023
(This article belongs to the Special Issue China National Nutrition Survey)

Abstract

:
Inconsistent findings have been discovered in studies examining the link between dietary selenium (Se) and sleep. Data were obtained from 17,176 people aged 20 and over who participated in the China Health and Nutrition Survey (CHNS) from 2004 to 2011. Face-to-face interviews were used to measure sleep duration in 2004, 2006, 2009, and 2011. To track dietary Se consumption, a 3-day, 24-h recall was undertaken. In the analysis, multilevel mixed-effects logistic regression was employed. The odds ratios (95% confidence intervals) of optimal sleep duration (7–9 h/day) in the regression of Model 4 were 1.00, 1.01 (0.89–1.15) and 1.19 (1.02–1.38) for the three tertiles of selenium consumption, respectively. Only overweight patients displayed a substantial positive connection between Se intake and the optimal sleep duration in the subgroup analysis. In summary, Se intake was significantly associated with optimal sleep duration.

1. Introduction

For humans, sleeping is as important as eating [1]. A healthy adult should have 7–9 h of sleep time per night [2]. Health issues may result from long-term insufficiency or excess sleep. Previous studies have discovered that persistent sleep deprivation is connected to physiological, cognitive, and psychomotor disorders, such as obstructive sleep apnea (OSA), the declines of memory, concentration, learning, and even depression [3,4]. Compared with 2010, the prevalence of sleep deprivation (sleep time < 7 h/day) of working American adults increased by 4.7% in 2018 [5]; however, little information is available regarding the effects of prolonged sleep and higher mortality. Although few studies of this kind exist, several studies have suggested that excessive sleep may be linked to detrimental health consequences, including obesity, stroke, and coronary heart disease [6,7,8]. Minerals, such as magnesium, iron, and selenium, have been discovered to have a substantial relationship with habitual sleep length [9].
Selenium (Se), a naturally occurring chemical element that has toxicological and nutritional effects, is attracting a lot of interest in biology and medicine [9,10]. Selenoprotein, an antioxidant active material, is crucial for reducing reactive oxygen species and pro-inflammatory biomarkers [11]. However, a projection estimated that approximately one out of seven people will have a low level of Se intake in the future [12]. Furthermore, according to a review, 39% to 61% of Chinese residents have a low daily intake of selenium (26–34 μg/day), which is below the WHO/FAO recommendation [13].
The antioxidant role of Se is important to improve sleep quality and sleep duration [14,15]. Recently, some studies have demonstrated a correlation between Se and sleep. A study assessed the relationship between sleep and dietary/nutritional variables through the National Health and Nutrition Examination Survey (NHANES, 2007–2008). It has shown that low Se intake was associated with short sleep (5–6 h) compared with normal sleep (7–8 h) [16]. Furthermore, a case-control study published in 2020 has found that Se may be an important defense mechanism amongst patients with OSA without any comorbidities [17]. Rachel et al. [18] also proposed that Se can be used to treat depression, which is the main symptom of sleep disturbance. Nevertheless, the debate about Se and sleep is ongoing. A multicenter prospective cohort study published in 2021 suggested that no significant association exists between toenail Se concentrations and sleep quality [19]. Moreover, an animal study has shown that Se compounds can act as an inhibitor of prostaglandin D2 (PGD2) to increase the incidence of arousal behavior [20]. These inconsistent findings could be related to Se status and different soil Se levels for the study populations [21,22].
Currently, no relevant study has been conducted on the Chinese population. Using the latest data from the CHNS, we aimed to evaluate the association between Se intake and sleep duration in the general Chinese population.

2. Methods

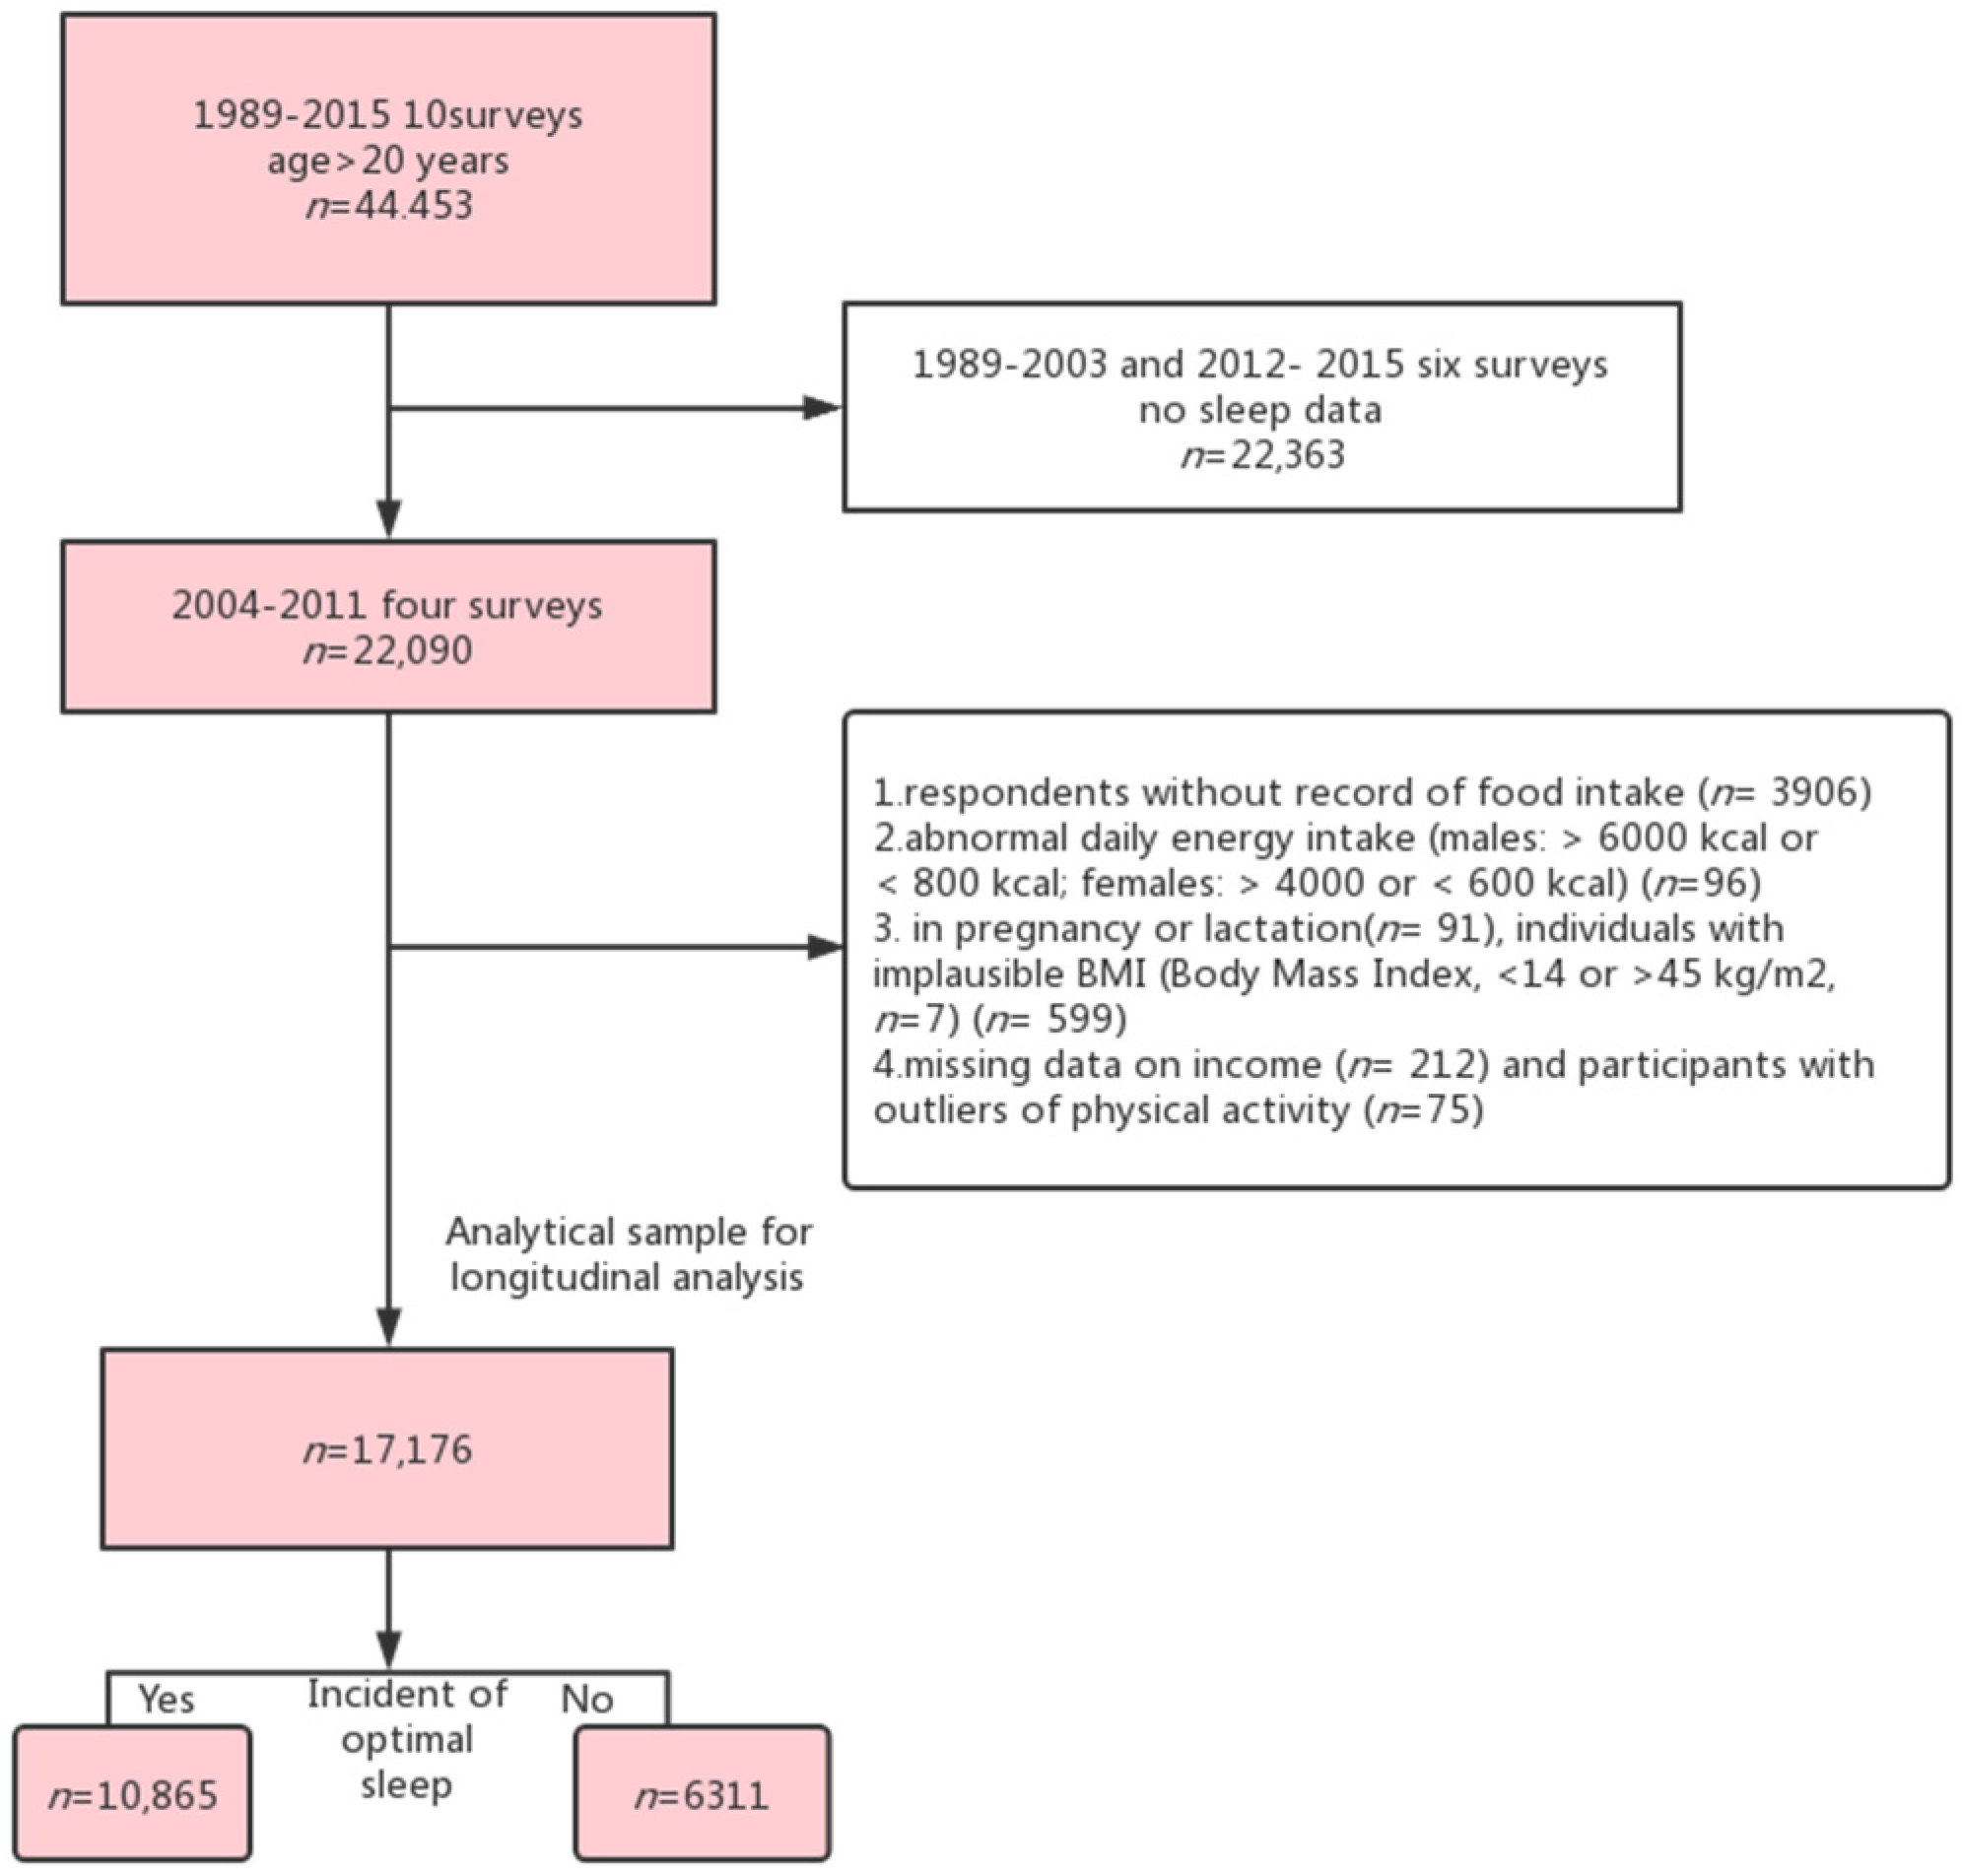
2.1. Study Design and Study Sample

Data were collected from the CHNS, which is a follow-up project conducted by the Carolina Population Center and the National Institute for Nutrition and Health (China). CHNS aimed to investigate the population’s state of health and nutrition. A multistage stratified cluster random sampling design was used to sample over 30,000 people from 7200 families across 15 provinces.
The CHNS was started in 1989; ten waves of surveys have been carried out. The survey on sleep started in 2004, so we used data from 2004 to 2011 to examine the relationship between Se intake and sleep duration based on inclusion and exclusion.
A total of 22,090 individuals who were 20 years old or more were selected in the first round of selection. Subsequently, participants who failed to report their dietary intake (n = 3906), abnormal calorie consumption each day (men: above 6000 kcal or under 800 kcal; women: over 4000 or under 600 kcal) (n = 96), pregnant or breastfeeding women (n = 91), individuals with implausible body mass index (BMI) < 14 or > 45 kg/m2, n = 7) (n = 599), missing data on income (n = 212), and participants with outliers of physical activity (n = 75) were excluded. Ultimately, 17,176 participants were enrolled, and 10,865 participants had optimal sleep duration at baseline (sleep time 7–9 h/day) (Figure 1). Both the National Institute of Nutrition and Food Safety and the University of North Carolina (USA) approved the survey (China). Each participant provided their explicit written consent. On the official CHNS website, the information for this study is freely accessible. (https://www.cpc.unc.edu/projects/china. Accessed on 18 April 2022).

2.2. Outcome Variable: Optimal Sleep Duration

Self-reported sleep duration was determined by the question, ‘How many hours of sleep do you usually get each day at daytime and nighttime (in hours)?’. Daily sleep duration was categorized into short (≤6 h), optimal (7–9 h), and long (≥10 h) based on the data distribution and sleep reality amongst the Chinese population. Optimal sleep duration was defined as >6 h and <10 h per day [2,23,24].

2.3. Exposure Variable: Se Intake

In each wave, a professional investigator documented every person’s food intake over three consecutive days. Researchers were required to maintain a daily food record, weighed the household’s supply of food and condiments, and accounted for food waste. Nutrient intakes, including Se and protein, were computed based on the average of 3-day food consumption data utilizing the Chinese Food Composition Table (CFCT). The dietary data module, which was employed by CFCT to decipher the food code, contained information on each respondent’s mean daily intake of selenium (in micrograms). To assess Chinese people’s food intake and nutrition, three different CFCT versions were applied. With regard to specific waves, the 1981 CFCT approved specifically for the 1989, 1991, and 1993 waves; the 1991 CFCT for the 1997 and 2000 waves; and the 2002/2004 CFCT for 2004, 2006, 2009, and 2011. Regarding the nutritious content of specific food items, the CFCT considered the region. Consequently, geographical characteristics were connected to selenium content in this study.
In order to determine the independent variable, we computed the cumulative Se intake. This approach effectively decreased individual variance and represented permanent dietary habits [15]. To give a simple example, a person’s cumulative means for 2005, 2006, and 2009 are (q + x)/2, (q + x + y)/3, and (q + x + y + z)/4, respectively, if his selenium consumption in 2004, 2005, 2006, and 2009 was q, x, y, and z. The most recent intake for 2004, 2005, 2006, and 2009 was q, x, y, and z, respectively. The baseline intake was q [25]. In addition, depending on all observations, we divided the intake into tertiles.

2.4. Covariates

Sociodemographic characteristics and health-related behaviors in the survey results were taken as covariables. Sociodemographic information included gender (male or female), age, education level (primary school and below, junior high school, and senior high school and above), and income (low, medium, and high). The examined health-related variables included smoking (yes or no), drinking alcohol (yes or no), activity level (light, moderate, or heavy), and BMI based on the self-reported height and weight. Overweight was defined as having a BMI ≥ 24 kg/m2, which was used to measure adiposity levels [26]. A systolic blood pressure of more than 140 mmHg, diastolic blood pressure more than 90 mmHg, or with known hypertension is considered hypertension. Physical activity level (MET) was determined via self-reported activities (including occupational, domestic, transportation, and leisure-time physical activity) and duration using the Adult Compendium of Physical Activities. Self-reported diabetes was marked as “yes” or “no”." Geographically, Heilongjiang, Liaoning, Shandong, and Henan were considered to be in the north, and Jiangsu, Hubei, Hunan, Guizhou, and Guangxi were considered to be in the south [27].

2.5. Statistical Analyses

Continuous variables were reported as mean ± standard deviation (SD) and were examined using ANOVA or Kruskal–Wallis test. Chi-square test results for categorical variables were provided as frequencies and proportions (%). Multilevel mixed-effect logistic regression analysis was used to investigate the relationship between cumulative mean Se consumption and sleep duration. The ideal sleep length was treated as a function of fixed effects of Se consumption, whereas individual participant variables were handled as random effects. In order to take into consideration interindividual variations in baseline measurements and the rate of change, random-effects components were fitted to the intercept and slope [28]. Multilevel model description for the survey on optimal sleep duration:
log ( Π i j 1 Π i j ) = γ 00 + γ 10 t i m e i j + ( μ 0 j + μ 1 j t i m e i j + e i j )
Level 1 (Within the individual) model:
log ( Π i j 1 Π i j ) = β 0 j + β 1 j t i m e i j + e i j
Level 2 (Between individuals) model:
β 0 j = γ 00 + μ 0 j ,   β 1 j = γ 10 + μ 1 j
j represents the identification number of the participant, i represents the number of measurements, γ00 represents the incidence of optimal sleep duration at baseline, eij represents the difference between each measurement of individual, β0j and β1j denote the incidence of optimal sleep duration for subject j at baseline and the change in the incidence of optimal sleep duration for subject j over time, respectively.
Se intake in the first tertile was taken as the reference group. A set of multivariable models was built: Model 1, which adjusted for age, gender, fat, and energy intake; Model 2, which further adjusted for smoking, alcohol drinking, income, urban, education, and physical activity; Model 3, which further adjusted for BMI and hypertension based on Model 2; and Model 4 which further added for self-reported diabetes, energy, and fat intake. In subgroup analyses, cumulative mean Se intake was used in the mixed-effect logistic regression models, and the interaction of cumulative mean Se intake in the diet and covariates, including urbanization level, gender, smoking, region, and alcohol intake, was assessed by adding a cross-product term to the overall multilevel mixed effects logistic regression model.

3. Results

Eligibility was met by 17,176 individuals who were included in this study. Table 1 demonstrated that across the Se consumption tertiles, the mean ± SD of Se intake was 23.9 ± 6.1, 39.2 ± 3.8, and 68.0 ± 44.8, respectively. Energy, fat, protein, and carbohydrate intake increased across the tertiles of Se intake. Alcohol consumption and BMI were higher in participants who consumed high Se. Se intake was strongly correlated with urbanization, literacy, and household income, while the consumption of selenium decreased with age.

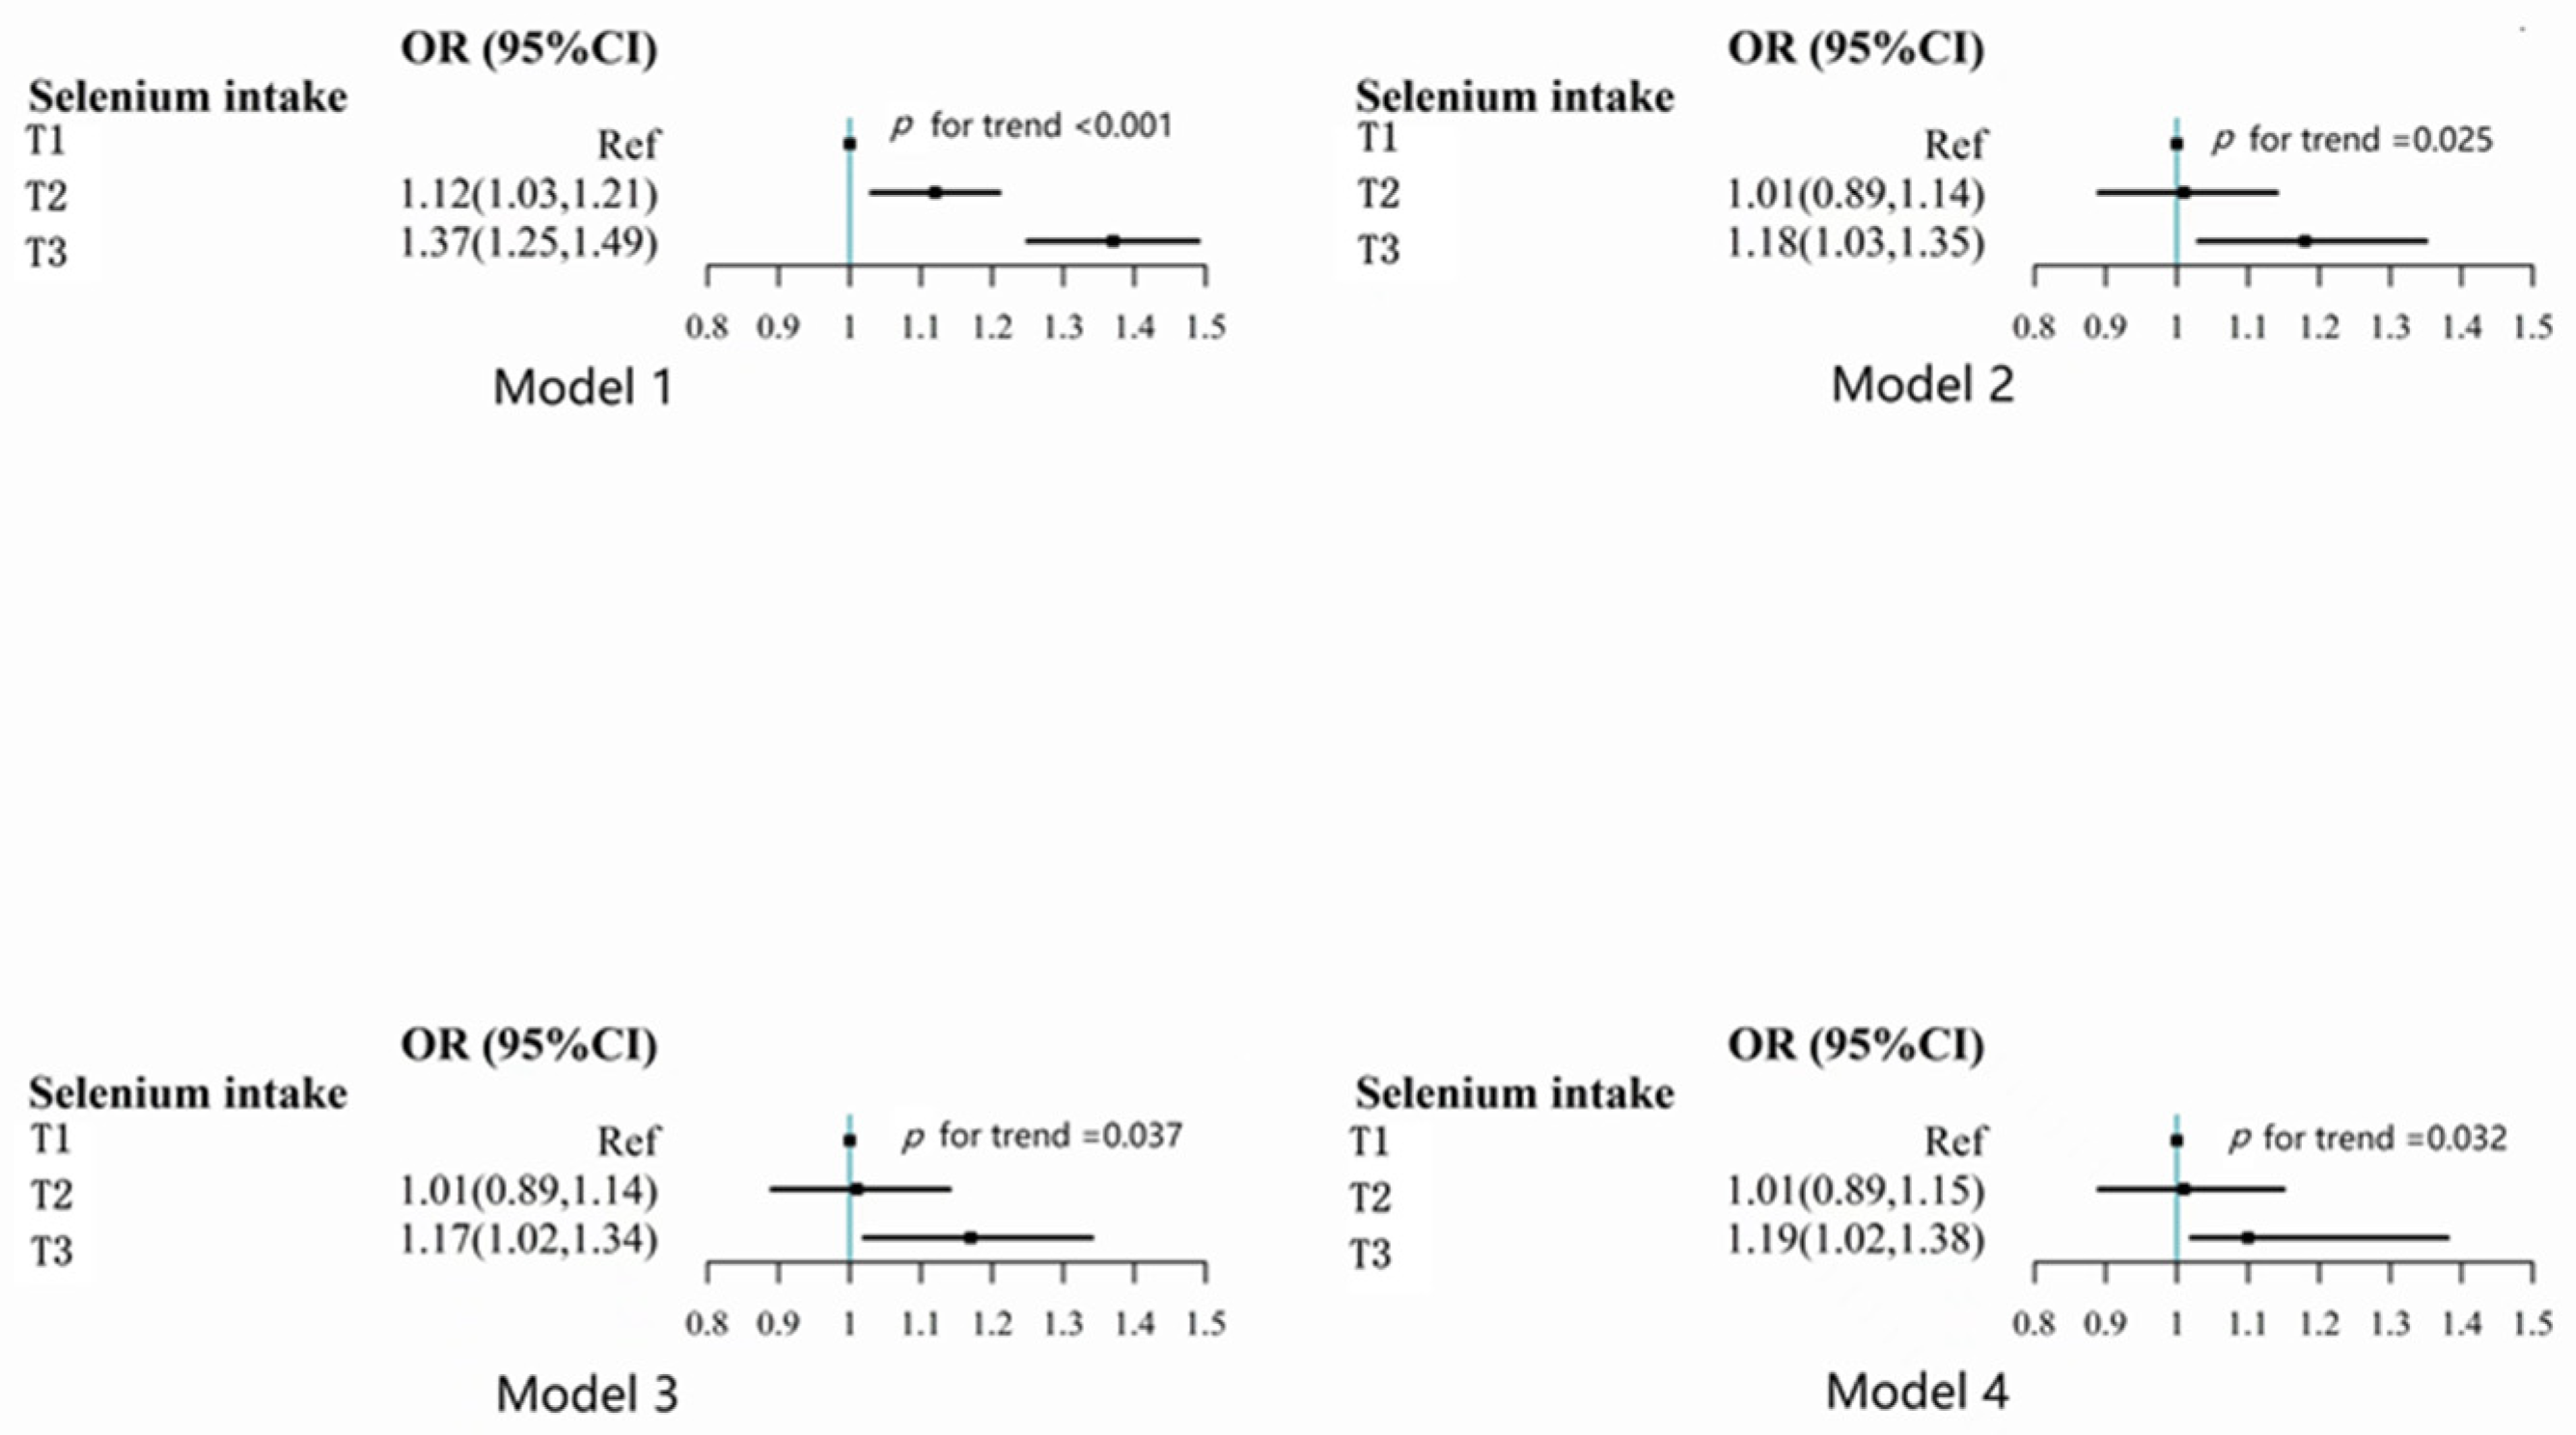
3.1. Association between Se Intake and Self-Reported Optimal Sleep Duration

Self-reported optimum sleep duration and Se intake were positively correlated (Figure 2). In the model, age, gender, and calorie consumption were taken into account (model 1), the odds ratios (ORs) (95% confidence interval (CI)) were 1.00, 1.12 (1.03–1.21), and 1.37 (1.25–1.49) across the food selenium consumption tertiles. Nonetheless, after adding additional factors (e.g., smoking, alcohol consumption, income, urban residence, education, physical activity level, BMI, hypertension, fat intake, protein intake, carbohydrate intake, and self-reported diabetes), this correlation weakened and the value of p for trend was 0.032 (model 4). In the fully adjusted model, the ORs (95% CI) across the tertiles of Se intake were 1.00, 1.01 (0.89–1.15), and 1.19 (1.02–1.38), respectively.

3.2. Subgroup Analyses of Selenium Consumption with the Optimal Sleep in China Nutrition and Health Study

Selenium intake was not interactively related to income, hypertension, gender, education, and urbanization in relation to optimal sleep duration. Nonetheless, the optimal sleep duration was significantly influenced by the interaction between Se daily consumption and BMI (p = 0.018) (Table 2). When analyzing the subgroups, a high correlation between Se intake and the optimal sleep duration was found only amongst overweight participants compared with participants with a BMI < 24.

4. Discussion

The average daily intake of selenium examined in this study ranged from 42.3 micrograms per day in 2004 to 43.3 micrograms per day in 2011. However, the majority of participants consumed less selenium than the China EAR (50 micrograms per day) [29]. The cumulative average Se intake was less likely to result in improper sleep duration and was favorably associated with the ideal sleep duration. Moreover, the consumption of selenium had remarkable interactions with BMI. Only people with a high BMI had a favorable correlation between Se intake and the ideal amount of sleep.
Our research showed that people who consumed large amounts of Se experience the best sleep. More and more people know that both very long and excessively short sleep durations are thought to be detrimental. Additionally, several researchers have discovered a connection between selenium and the length of sleep. For example, only a brief sleep period (5–6 h) was revealed by the NHANES to be negatively correlated with selenium consumption [30]. The same result has been found in a case-control study [30]. However, data from experiments performed in a laboratory environment differed from our findings. Some animal studies have demonstrated that decreased sleeping time is due to the inhibition of PGD synthase activity in the brain by SeCl4 [31]. The main source of selenium for both people and animals is food, and the main organic selenium species in cereal and vegetables are selenomethionine and selenocysteine, which differ from selenium chloride (SeCl4) [32].
Further studies are needed to discover how selenium intake affects human sleep. Sleep deprivation and poor sleep quality are linked to oxidative stress and antioxidant imbalance, which could increase the prevalence of chronic diseases [33,34]. Selenoenzymes are important antioxidants, and they may be particularly beneficial in the defense against oxidative stress [35,36]. Antioxidant consumption may influence sleep because sleep duration can be affected by pro-inflammatory cytokines [37,38]. A review has indicated that some pro-inflammatory cytokines are associated with increased body temperature, reduced nREM sleep duration, and increased wakefulness, thereby proving that having insomnia is connected to increased plasma cytokine levels [39]. The body produces many leukocytes and mast cells in the injured area as a result of the inflammatory response, which increases the generation and release of ROS by increasing the intake of oxygen [40]. Meanwhile, antioxidants show the strongest anti-inflammatory activities through the inhibition of inducible pro-inflammatory cytokines expression and ROS generation [41,42]. In summary, the intake of Se could increase the activity of antioxidant enzymes and inhibit ROS generation, providing reliable relief from insomnia and promoting healthy sleep.
The interaction between BMI and Se intake in terms of the ideal amount of sleep was interesting. In our study, the positive association between Se intake and optimal sleep duration was observed only in overweight people. The Wisconsin Sleep Cohort Study has demonstrated a U-shaped curvilinear association between sleep duration and BMI [43]. Dashti et al. [44] indicated robust causal effects of insomnia on higher BMI and, conversely, of higher BMI on snoring and daytime sleepiness. Additionally, bidirectional effects between sleep duration and daytime napping with obesity may exist. The third National Health and Nutrition Examination Survey in the US has further found that BMI was inversely associated with serum Se concentrations in men and women [44], inconsistent with our finding. The reason may be that we measured only food Se intake instead of Se biomarkers. Meanwhile, high BMI is associated with an inflammatory state, which reduces circulating Se [45,46]. In summary, having a BMI < 24 may be a standalone protective factor for getting the recommended amount of sleep. The interaction mechanisms between overweight and Se to optimal sleep duration require further exploration.
Our study has a number of advantages that should be emphasized. First, we used four cycles of CHNS data. The study sample represented the general population. The sample size was large and improved the precision of estimates. Second, the long-term relationship between dietary selenium intake and sleep has not been extensively studied in the literature. Third, in order to provide a reliable estimate of long-term Se consumption, this study used a prospective design with numerous rounds of nutritional evaluations on the basis of three-day meal recalls and records. Fourth, our findings could be applied to a larger population because of the huge sample of participants from various provinces. Last but not least, we had control over a number of possible confounders.
There are additional limitations to this study. First, the calculation of long-term dietary selenium intake using a 3-day, 24-h food survey could be insufficient. Second, the data on sleep duration and other self-reported characteristics may be subject to recall bias among respondents. Third, even though we made adjustments for a variety of sociodemographic and the variables of style of living in the multivariate analysis, including income, personal BMI, and diet, there may still be some other confounding variables. Fourth, there was no information on Se indicators (such as hair and serum Se), sleep quality, or other micronutrients that can affect the ideal length of sleep. Lastly, it is also important to consider other factors that may impact sleep time.

5. Conclusions

In conclusion, a high-selenium diet may promote optimal sleep time, and a strong positive association between Se intake and the optimal sleep duration was only found amongst overweight participants. The role of BMI in the relationship between Se intake and optimal sleep duration requires further investigations.

Author Contributions

L.Z., S.L., Y.Z. (Yangchang Zhang), Z.S. and Y.Z. (Yong Zhao) all made contributions to the design, analysis, and analysis of data. L.Z. carried out the data analyses and wrote the manuscript. Y.Z. (Yuzhao Zhu), T.W., Y.S. and Y.Z. (Yong Zhao) all made contributions to the manuscript revision. All authors have read and agreed to the published version of the manuscript.

Funding

Research on dietary Se consumption and its associations with diabetes and hypertension in middle-aged and older persons in Jiangjin Chongqing provided funding for this project, which was sponsored by the Chongqing Nutrition Society (2019001). The research’s conception, analysis, interpretation of the data, and publication were all performed independently of the funders.

Institutional Review Board Statement

The National Institute of Nutrition and Food Safety and the University of North Carolina (USA) examined the written informed consent for CHNS (China). On the official CHNS website (https://www.cpc.unc.edu/projects/china, accessed on 18 April 2022), which is open to the public, we used publicly accessible datasets.

Informed Consent Statement

The National Institute of Nutrition and Food Safety and the University of North Carolina (USA) examined the written informed consent for CHNS (China). On the official CHNS website (https://www.cpc.unc.edu/projects/china, accessed on 18 April 2022), which is open to the public, we used publicly accessible datasets. Thus, there was no obligation for ethics approval.

Data Availability Statement

The datasets created and analyzed for the current work may be found in the CHNS repository at https://www.cpc.unc.edu/projects/china (accessed on 18 April 2022).

Conflicts of Interest

The authors have no relevant financial or non-financial interest to disclose.

References

  1. Hillman, D.R.; Lack, L.C. Public health implications of sleep loss: The community burden. Med. J. Aust. 2013, 199, S7–S10. [Google Scholar] [CrossRef] [PubMed] [Green Version]
  2. St-Onge, M.P.; Grandner, M.A.; Brown, D.; Conroy, M.B.; Jean-Louis, G.; Coons, M.; Bhatt, D.L.; On behalf of the American Heart Association Obesity, Behavior Change, Diabetes, and Nutrition Committees of the Council on Lifestyle and Cardiometabolic Health; Council on Cardiovascular Disease in the Young; Council on Clinical Cardiology; et al. Sleep Duration and Quality: Impact on Lifestyle Behaviors and Cardiometabolic Health: A Scientific Statement From the American Heart Association. Circulation 2016, 134, e367–e386. [Google Scholar] [CrossRef] [Green Version]
  3. Wei, L.; Ying, X.; Zhai, M.; Li, J.; Liu, D.; Liu, X.; Yu, B.; Yan, H. The association between peritraumatic distress, perceived stress, depression in pregnancy, and NR3C1 DNA methylation among Chinese pregnant women who experienced COVID-19 lockdown. Front. Immunol. 2022, 13, 966522. [Google Scholar] [CrossRef] [PubMed]
  4. Klinzing, J.G.; Niethard, N.; Born, J. Mechanisms of systems memory consolidation during sleep. Nat. Neurosci. 2019, 22, 1598–1610. [Google Scholar] [CrossRef] [PubMed]
  5. Khubchandani, J.; Price, J.H. Short Sleep Duration in Working American Adults, 2010–2018. J Community Health 2020, 45, 219–227. [Google Scholar] [CrossRef]
  6. Sawyer, E.; Heussler, H.; Gunnarsson, R. Defining short and long sleep duration for future paediatric research: A systematic literature review. J. Sleep Res. 2019, 28, e12839. [Google Scholar] [CrossRef] [PubMed]
  7. Zhou, L.; Yu, K.; Yang, L.; Wang, H.; Xiao, Y.; Qiu, G.; Liu, X.; Yuan, Y.; Bai, Y.; Li, X.; et al. Sleep duration, midday napping, and sleep quality and incident stroke: The Dongfeng-Tongji cohort. Neurology 2020, 94, e345–e356. [Google Scholar] [CrossRef]
  8. Yang, L.; Yang, H.; He, M.; Pan, A.; Li, X.; Min, X.; Zhang, C.; Xu, C.; Zhu, X.; Yuan, J.; et al. Longer Sleep Duration and Midday Napping Are Associated with a Higher Risk of CHD Incidence in Middle-Aged and Older Chinese: The Dongfeng-Tongji Cohort Study. Sleep 2016, 39, 645–652. [Google Scholar] [CrossRef] [Green Version]
  9. Barchielli, G.; Capperucci, A.; Tanini, D. The Role of Selenium in Pathologies: An Updated Review. Antioxidants 2022, 11, 251. [Google Scholar] [CrossRef]
  10. Hatfield, D.L.; Tsuji, P.A.; Carlson, B.A.; Gladyshev, V.N. Selenium and selenocysteine: Roles in cancer, health, and development. Trends Biochem. Sci. 2014, 39, 112–120. [Google Scholar] [CrossRef]
  11. Forceville, X. Seleno-enzymes and seleno-compounds: The two faces of selenium. Crit. Care 2006, 10, 180. [Google Scholar] [CrossRef] [PubMed] [Green Version]
  12. Jones, G.D.; Droz, B.; Greve, P.; Gottschalk, P.; Poffet, D.; McGrath, S.P.; Seneviratne, S.I.; Smith, P.; Winkel, L.H. Selenium deficiency risk predicted to increase under future climate change. Proc. Natl. Acad. Sci. USA 2017, 114, 2848–2853. [Google Scholar] [CrossRef] [PubMed] [Green Version]
  13. Dinh, Q.T.; Cui, Z.; Huang, J.; Tran, T.A.T.; Wang, D.; Yang, W.; Zhou, F.; Wang, M.; Yu, D.; Liang, D. Selenium distribution in the Chinese environment and its relationship with human health: A review. Environ. Int. 2018, 112, 294–309. [Google Scholar] [CrossRef]
  14. Pau, M.C.; Mangoni, A.A.; Zinellu, E.; Pintus, G.; Carru, C.; Fois, A.G.; Pirina, P.; Zinellu, A. Circulating Superoxide Dismutase Concentrations in Obstructive Sleep Apnoea (OSA): A Systematic Review and Meta-Analysis. Antioxidants 2021, 10, 1764. [Google Scholar] [CrossRef] [PubMed]
  15. Stanek, A.; Brożyna-Tkaczyk, K.; Myśliński, W. Oxidative Stress Markers among Obstructive Sleep Apnea Patients. Oxidative Med. Cell. Longev. 2021, 2021, 9681595. [Google Scholar] [CrossRef]
  16. Grandner, M.A.; Jackson, N.; Gerstner, J.R.; Knutson, K.L. Dietary nutrients associated with short and long sleep duration. Data from a nationally representative sample. Appetite 2013, 64, 71–80. [Google Scholar] [CrossRef] [Green Version]
  17. Saruhan, E.; Sertoglu, E.; Unal, Y.; Bek, S.; Kutlu, G. The role of antioxidant vitamins and selenium in patients with obstructive sleep apnea. Sleep Breath 2021, 25, 923–930. [Google Scholar] [CrossRef]
  18. Albuquerque, R.G.; Tufik, S.; Andersen, M.L. Benefits of selenium in the treatment of depression and sleep disorders: Commentaries of the article “The selenium-containing compound 3-((4-chlorophenyl)selanyl)-1-methyl-1H-indole reverses depressive-like behavior induced by acute restraint stress in mice: Modulation of oxido-nitrosative stress and inflammatory pathway”. Sleep Breath 2019, 23, 933–934. [Google Scholar] [CrossRef]
  19. Zhang, Y.; Chen, C.; Luo, J.; Dibaba, D.T.; Fly, A.D.; Haas, D.M.; Shikany, J.M.; Kahe, K. Long-chain omega-3 fatty acids, selenium, and mercury in relation to sleep duration and sleep quality: Findings from the CARDIA study. Eur. J. Nutr. 2021, 61, 753–762. [Google Scholar] [CrossRef]
  20. Lee, B.; Hirst, J.J.; Walker, D.W. Prostaglandin D synthase in the prenatal ovine brain and effects of its inhibition with selenium chloride on fetal sleep/wake activity in utero. J. Neurosci. Off. J. Soc. Neurosci. 2002, 22, 5679–5686. [Google Scholar] [CrossRef]
  21. D’Amato, R.; Regni, L.; Falcinelli, B.; Mattioli, S.; Benincasa, P.; Dal Bosco, A.; Pacheco, P.; Proietti, P.; Troni, E.; Santi, C.; et al. Current Knowledge on Selenium Biofortification to Improve the Nutraceutical Profile of Food: A Comprehensive Review. J. Agric. Food Chem. 2020, 68, 4075–4097. [Google Scholar] [CrossRef] [PubMed]
  22. Kipp, A.P.; Strohm, D.; Brigelius-Flohé, R.; Schomburg, L.; Bechthold, A.; Leschik-Bonnet, E.; Heseker, H. Revised reference values for selenium intake. J. Trace Elem. Med. Biol. Organ Soc. Miner. Trace Elem. (GMS) 2015, 32, 195–199. [Google Scholar] [CrossRef] [PubMed] [Green Version]
  23. Feng, X.; Liu, Q.; Li, Y.; Zhao, F.; Chang, H.; Lyu, J. Longitudinal study of the relationship between sleep duration and hypertension in Chinese adult residents (CHNS 2004-2011). Sleep Med. 2019, 58, 88–92. [Google Scholar] [CrossRef] [PubMed]
  24. Watson, N.F.; Badr, M.S.; Belenky, G.; Bliwise, D.L.; Buxton, O.M.; Buysse, D.; Dinges, D.F.; Gangwisch, J.; Grandner, M.A.; Kushida, C.; et al. Recommended Amount of Sleep for a Healthy Adult: A Joint Consensus Statement of the American Academy of Sleep Medicine and Sleep Research Society. Sleep 2015, 38, 843–844. [Google Scholar] [CrossRef]
  25. Zhang, Y.; Ye, M.; Zhao, Y.; Xiong, Y.; Shen, S.; Yu, Q.; Lu, Y.; Shi, Z.; Lei, X. Higher Dietary Se Intake Is Associated With the Risk of New-Onset Fracture: A National Longitudinal Study for 20 Years. Front. Nutr. 2021, 8, 719147. [Google Scholar] [CrossRef]
  26. Zhou, B. [Predictive values of body mass index and waist circumference to risk factors of related diseases in Chinese adult population]. Zhonghua Liu Xing Bing Xue Za Zhi 2002, 23, 5–10. [Google Scholar]
  27. Xie, C.; Xian, J.; Zeng, M.; Cai, Z.; Li, S.; Zhao, Y.; Shi, Z. Regional Difference in the Association between the Trajectory of Selenium Intake and Hypertension: A 20-Year Cohort Study. Nutrients 2021, 13, 1501. [Google Scholar] [CrossRef]
  28. Singer, J.D.; Willet, J.B. Applied Longitudinal Data Analysis: Modeling Change and Event Occurrence; Oxford University Press: New York, NY, USA, 2003. [Google Scholar]
  29. Wu, C.C.; Wang, C.K.; Yang, A.M.; Lu, C.S.; Lin, C.Y. Selenium status is independently related to bone mineral density, FRAX score, and bone fracture history: NHANES, 2013 to 2014. Bone 2021, 143, 115631. [Google Scholar] [CrossRef]
  30. Chen, P.C.; Guo, C.H.; Tseng, C.J.; Wang, K.C.; Liu, P.J. Blood trace minerals concentrations and oxidative stress in patients with obstructive sleep apnea. J. Nutr. Health Aging 2013, 17, 639–644. [Google Scholar] [CrossRef]
  31. Matsumura, H.; Takahata, R.; Hayaishi, O. Inhibition of sleep in rats by inorganic selenium compounds, inhibitors of prostaglandin D synthase. Proc. Natl. Acad. Sci. USA 1991, 88, 9046–9050. [Google Scholar] [CrossRef] [Green Version]
  32. Razaghi, A.; Poorebrahim, M.; Sarhan, D.; Björnstedt, M. Selenium stimulates the antitumour immunity: Insights to future research. Eur. J. Cancer 2021, 155, 256–267. [Google Scholar] [CrossRef] [PubMed]
  33. Alzoubi, K.H.; Khabour, O.F.; Albawaana, A.S.; Alhashimi, F.H.; Athamneh, R.Y. Tempol prevents chronic sleep-deprivation induced memory impairment. Brain Res. Bull. 2016, 120, 144–150. [Google Scholar] [CrossRef]
  34. Kanagasabai, T.; Riddell, M.C.; Ardern, C.I. Inflammation, Oxidative Stress, and Antioxidant Micronutrients as Mediators of the Relationship Between Sleep, Insulin Sensitivity, and Glycosylated Hemoglobin. Front. Public Health 2022, 10, 888331. [Google Scholar] [CrossRef] [PubMed]
  35. Albuquerque, R.G.; Hirotsu, C.; Tufik, S.; Andersen, M.L. Why Should We Care About Selenium in Obstructive Sleep Apnea? J. Clin. Sleep Med. JCSM Off. Publ. Am. Acad. Sleep Med. 2017, 13, 931–932. [Google Scholar] [CrossRef] [PubMed] [Green Version]
  36. Winther, K.H.; Rayman, M.P.; Bonnema, S.J.; Hegedüs, L. Selenium in thyroid disorders—Essential knowledge for clinicians. Nat. Rev. Endocrinol. 2020, 16, 165–176. [Google Scholar] [CrossRef]
  37. Doherty, R.; Madigan, S.; Warrington, G.; Ellis, J. Sleep and Nutrition Interactions: Implications for Athletes. Nutrients 2019, 11, 822. [Google Scholar] [CrossRef] [Green Version]
  38. Nieman, D.C.; Mitmesser, S.H. Potential Impact of Nutrition on Immune System Recovery from Heavy Exertion: A Metabolomics Perspective. Nutrients 2017, 9, 513. [Google Scholar] [CrossRef] [Green Version]
  39. Santos, R.V.; Tufik, S.; De Mello, M.T. Exercise, sleep and cytokines: Is there a relation? Sleep Med. Rev. 2007, 11, 231–239. [Google Scholar] [CrossRef]
  40. Coussens, L.M.; Werb, Z. Inflammation and cancer. Nature 2002, 420, 860–867. [Google Scholar] [CrossRef]
  41. Arulselvan, P.; Fard, M.T.; Tan, W.S.; Gothai, S.; Fakurazi, S.; Norhaizan, M.E.; Kumar, S.S. Role of Antioxidants and Natural Products in Inflammation. Oxidative Med. Cell. Longev. 2016, 2016, 5276130. [Google Scholar] [CrossRef] [Green Version]
  42. Jiang, Y.; Wang, M.H. Different solvent fractions of Acanthopanax senticosus harms exert antioxidant and anti-inflammatory activities and inhibit the human Kv1.3 channel. J. Med. Food 2015, 18, 468–475. [Google Scholar] [CrossRef] [PubMed]
  43. Taheri, S.; Lin, L.; Austin, D.; Young, T.; Mignot, E. Short sleep duration is associated with reduced leptin, elevated ghrelin, and increased body mass index. PLoS Med. 2004, 1, e62. [Google Scholar] [CrossRef] [PubMed]
  44. Dashti, H.S.; Ordovás, J.M. Genetics of Sleep and Insights into Its Relationship with Obesity. Annu. Rev. Nutr. 2021, 41, 223–252. [Google Scholar] [CrossRef] [PubMed]
  45. Zhong, Q.; Lin, R.; Nong, Q. Adiposity and Serum Selenium in U.S. Adults. Nutrients 2018, 10, 727. [Google Scholar] [CrossRef] [PubMed] [Green Version]
  46. Schomburg, L. Selenium Deficiency Due to Diet, Pregnancy, Severe Illness, or COVID-19-A Preventable Trigger for Autoimmune Disease. Int. J. Mol. Sci. 2021, 22, 8532. [Google Scholar] [CrossRef]
Figure 1. Flow chart of participants in the Selenium Intake and Sleep Survey.
Nutrients 15 00397 g001
Figure 2. Odds ratios (95% CI) for optimal sleep duration by selenium intake tertiles among Chinese individuals aged 20 or older from China Health and Nutrition Survey. Age, gender, and calorie intake were modified in Model 1. Smoking and alcohol use, income (low, medium, and high), urbanization (low, medium, and high), education (low, medium, and high), and level of physical activity (continuous) were all further accounted for in Model 2. BMI and hypertension were still further modified in Model 3. Self-reported diabetes, fat intake, and energy intake were further modified in Model 4.
Nutrients 15 00397 g002
Table 1. Baseline sample characteristics of Chinese adults attending CHNS by tertiles of cumulative selenium intake (n = 17,176).
FactorsT1T2T3p-Value
n = 6380n = 5009n = 5787
Se intake (µg/day), mean (SD)23.9 (6.1)39.2 (3.8)68.0 (44.8)<0.001
Energy intake (kcal/day), mean (SD)1716.3 (536.3)2072.4 (566.5)2464.7 (669.6)<0.001
Fat intake (g/day), mean (SD)55.3 (30.8)71.0 (32.5)87.3 (40.4)<0.001
Protein intake (g/day), mean (SD)48.9 (14.5)65.3 (16.2)86.3 (26.2)<0.001
Carbohydrate intake (g/day), mean (SD)252.6 (100.8)288.4 (107.3)325.9 (118.5)<0.001
Age (years), mean (SD)48.5 (16.3)46.4 (15.0)45.3 (14.4)<0.001
BMI (kg/m2), mean (SD)22.9 (3.5)23.3 (3.4)23.8 (3.4)<0.001
Gender <0.001
Men2482 (38.9%)2363 (47.2%)3359 (58.0%)
Women3898 (61.1%)2646 (52.8%)2428 (42.0%)
Smoking <0.001
Non-smoker4632 (72.8%)3434 (68.7%)3602 (62.3%)
Ex-smoker232 (3.6%)168 (3.4%)253 (4.4%)
Current smoker1503 (23.6%)1393 (27.9%)1929 (33.4%)
Income <0.001
Low3039 (47.6%)1720 (34.3%)1683 (29.1%)
Medium1892 (29.7%)1696 (33.9%)1916 (33.1%)
High1449 (22.7%)1593 (31.8%)2188 (37.8%)
Urbanization <0.001
Low2701 (42.3%)1473 (29.4%)1497 (25.9%)
Medium1797 (28.2%)1560 (31.1%)1703 (29.4%)
High1882 (29.5%)1976 (39.4%)2587 (44.7%)
SURVEY YEAR <0.001
20043355 (52.6%)2483 (49.6%)2750 (47.5%)
2006725 (11.4%)628 (12.5%)756 (13.1%)
2009706 (11.1%)645 (12.9%)850 (14.7%)
20111594 (25.0%)1253 (25.0%)1431 (24.7%)
Education <0.001
Low4876 (76.6%)3324 (66.5%)3450 (59.7%)
Medium698 (11.0%)749 (15.0%)1032 (17.9%)
High792 (12.4%)923 (18.5%)1297 (22.4%)
Hypertension1379 (21.6%)987 (19.7%)1091 (18.9%)<0.001
Diabetes156 (2.5%)132 (2.6%)149 (2.6%)0.90
Alcohol drinking1727 (27.1%)1671 (33.4%)2452 (42.4%)<0.001
Region <0.001
South3991 (62.6%)3040 (60.7%)3080 (53.2%)
North2389 (37.4%)1969 (39.3%)2707 (46.8%)
Overweight2151 (33.7%)1963 (39.2%)2550 (44.1%)<0.001
Physical activity (MET-h/week), mean (SD)168.3 (96.6)156.4 (91.1)153.5 (86.7)<0.001
Optimal sleep duration3860 (60.5%)3251 (64.9%)3754 (64.9%)<0.001
Data are reported as mean (SD) for continuous variables and n (%) for categorical variables.
Table 2. Subgroup analyses of selenium consumption with the optimal sleep in China Nutrition and Health Study (n = 17,176).
T1T2T3p Trendp for Interaction
Income 0.563
Low1.000.99(0.81–1.21)1.19(0.95–1.48)0.129
Medium1.001.08(0.89–1.31)1.29(1.05–1.59)0.015
High1.001.01(0.73–1.40)1.16(0.83–1.63)0.287
Urbanization 0.168
Low1.001.00(0.85–1.18)1.18(0.98–1.42)0.097
Medium1.001.27(1.02–1.57)1.31(1.04–1.65)0.023
High1.000.74(0.51–1.07)1.04(0.71–1.53)0.385
Education 0.549
Low1.001.04(0.90–1.19)1.19(1.02–1.38)0.021
Medium1.001.37(0.95–1.99)1.39(0.95–2.02)0.107
High1.000.70(0.44–1.10)1.27(0.78–2.06)0.125
Region 0.226
South1.001.07(0.92–1.26)1.37(1.15–1.64)<0.001
North1.001.11(0.90–1.36)1.15(0.94–1.42)0.226
Gender 0.766
Men1.001.01(0.83–1.24)1.36(1.10–1.67)0.001
Women1.001.13(0.96–1.34)1.22(1.02–1.47)0.017
Overweight 0.018
No1.001.07(0.92–1.24)1.21(1.03–1.43)0.128
Yes1.001.14(0.91–1.42)1.51(1.19–1.91)<0.001
Hypertension 0.647
No1.001.04(0.90–1.20)1.23(1.06–1.43)0.005
Yes1.001.26(0.98–1.61)1.64(1.25–2.15)<0.001
Odds ratios (with a 95% confidence interval) are the values from multilevel mixed-effects logistic regression. Age, gender, caloric intake, smoking, alcohol use, income, urbanization, education, physical activity, BMI, hypertension, and self-reported diabetes were all taken into account in multilevel mixed-effects logistic regression models. In the appropriate models, stratification factors were not altered. Based on the tertiles of annual income, the distribution of income was divided as low, middle, and high.
Disclaimer/Publisher’s Note: The statements, opinions and data contained in all publications are solely those of the individual author(s) and contributor(s) and not of MDPI and/or the editor(s). MDPI and/or the editor(s) disclaim responsibility for any injury to people or property resulting from any ideas, methods, instructions or products referred to in the content.

