


Causal Associations between Dietary Habits and Chronic Pain: A Two-Sample Mendelian Randomization Study
Abstract
:1. Introduction
2. Method
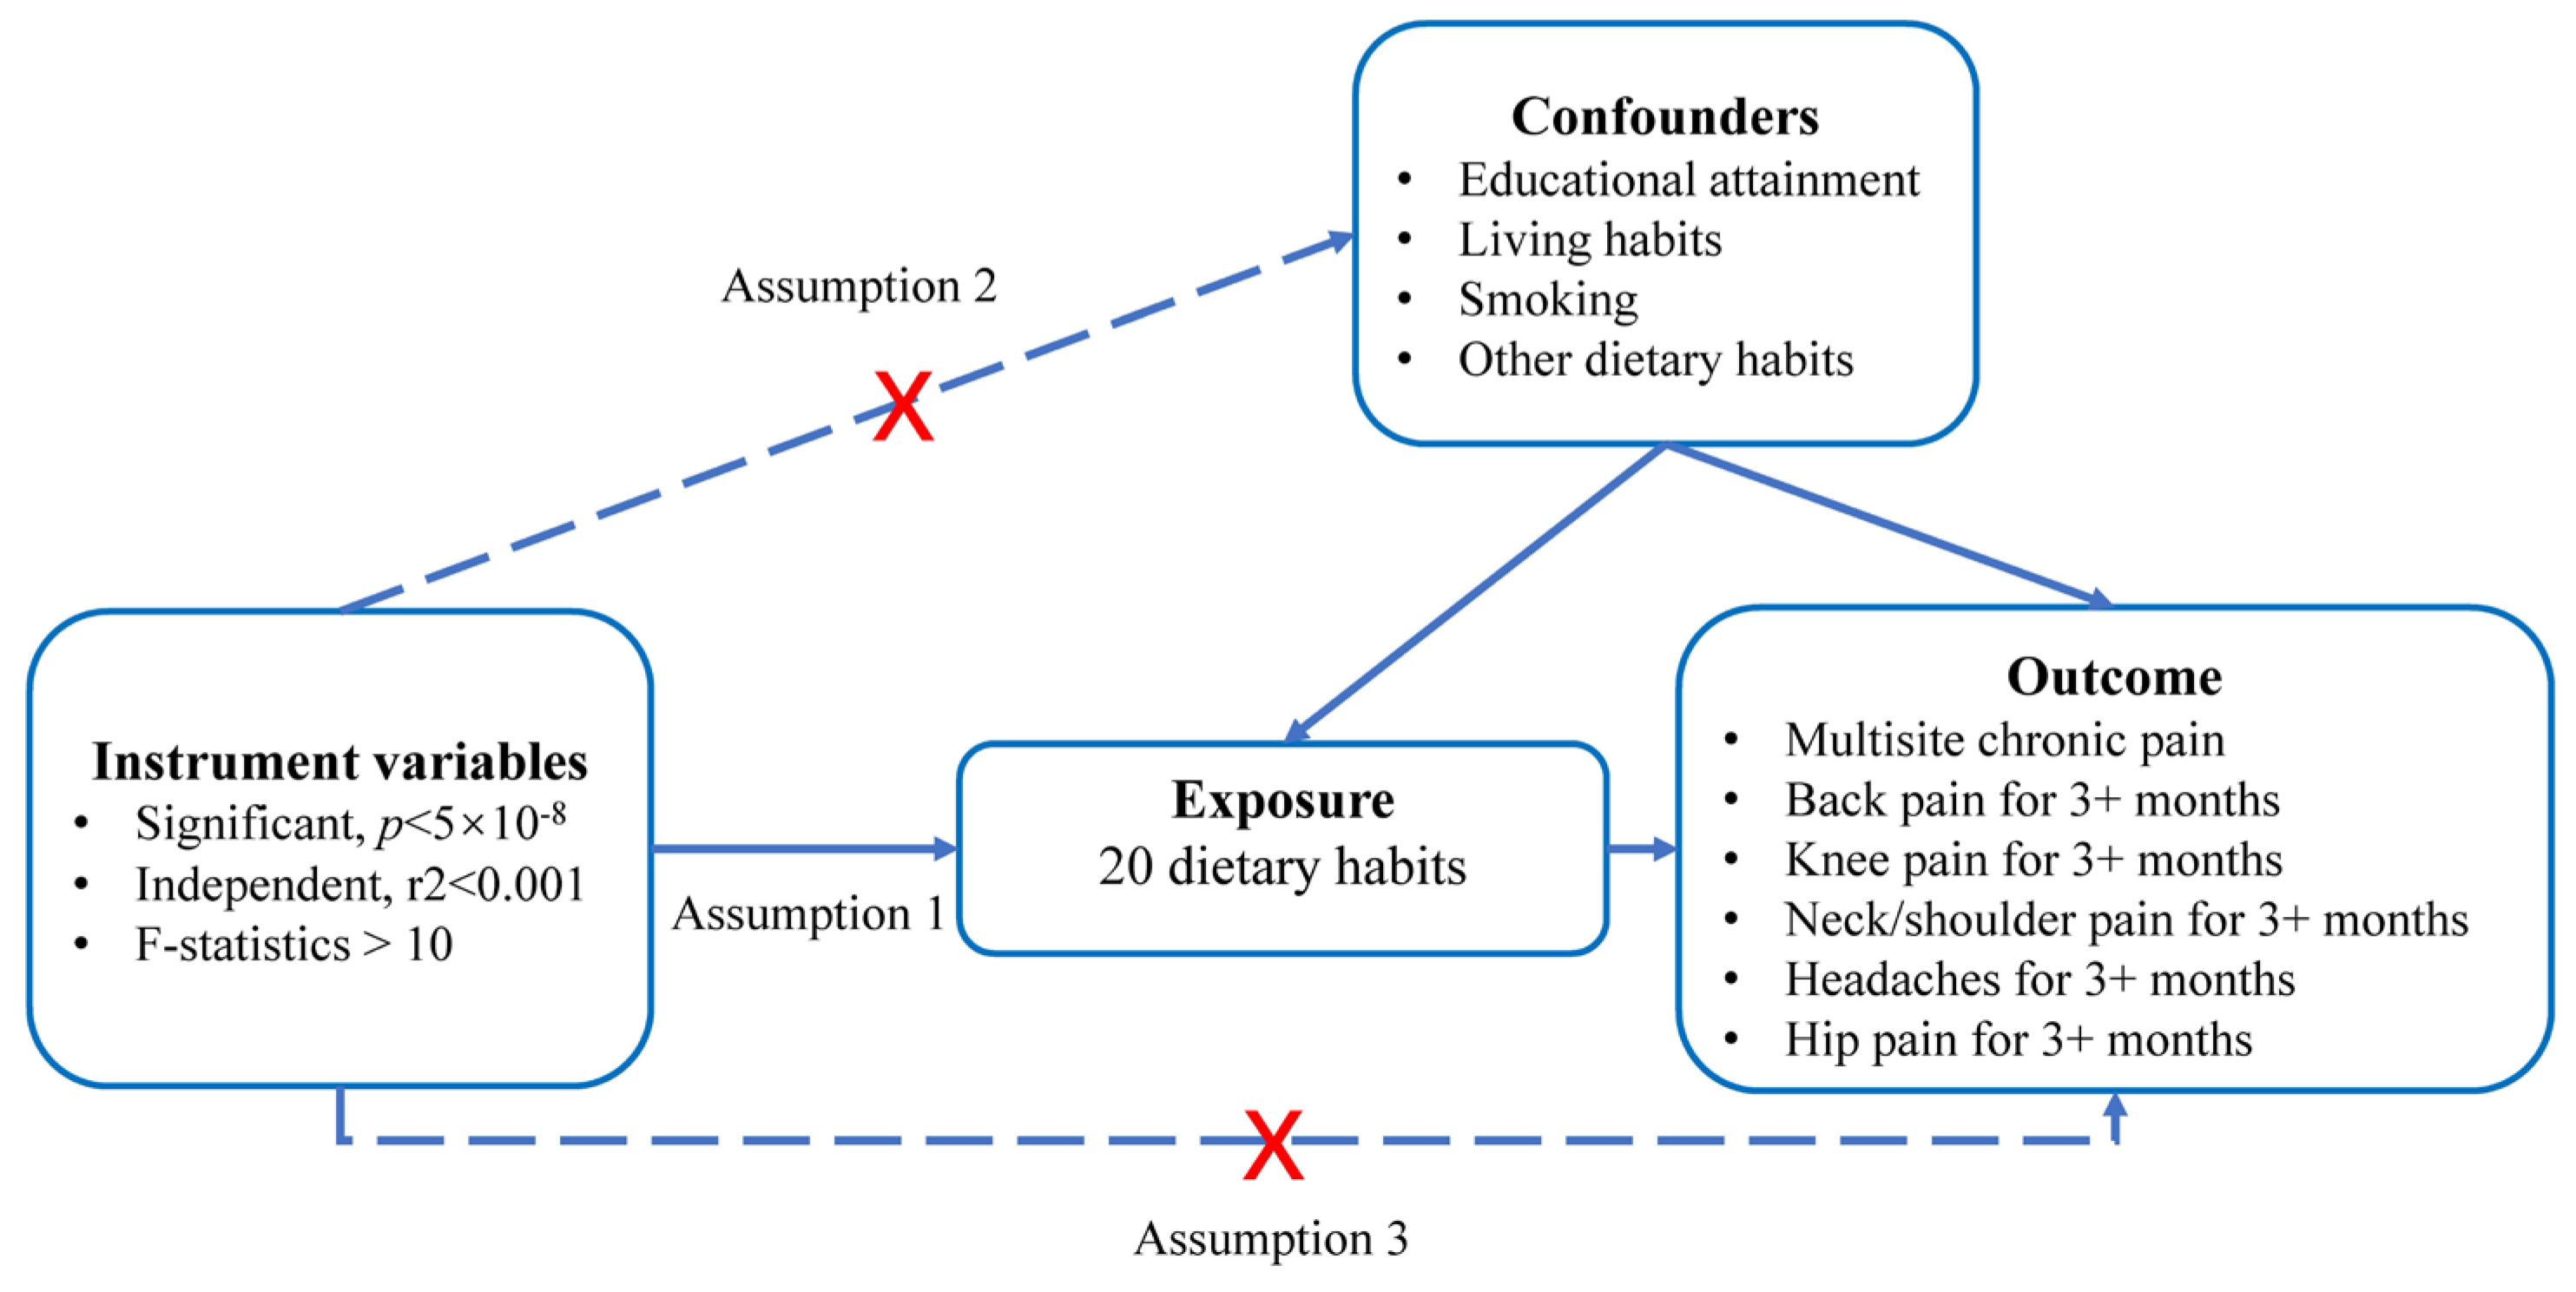
2.1. Study Design
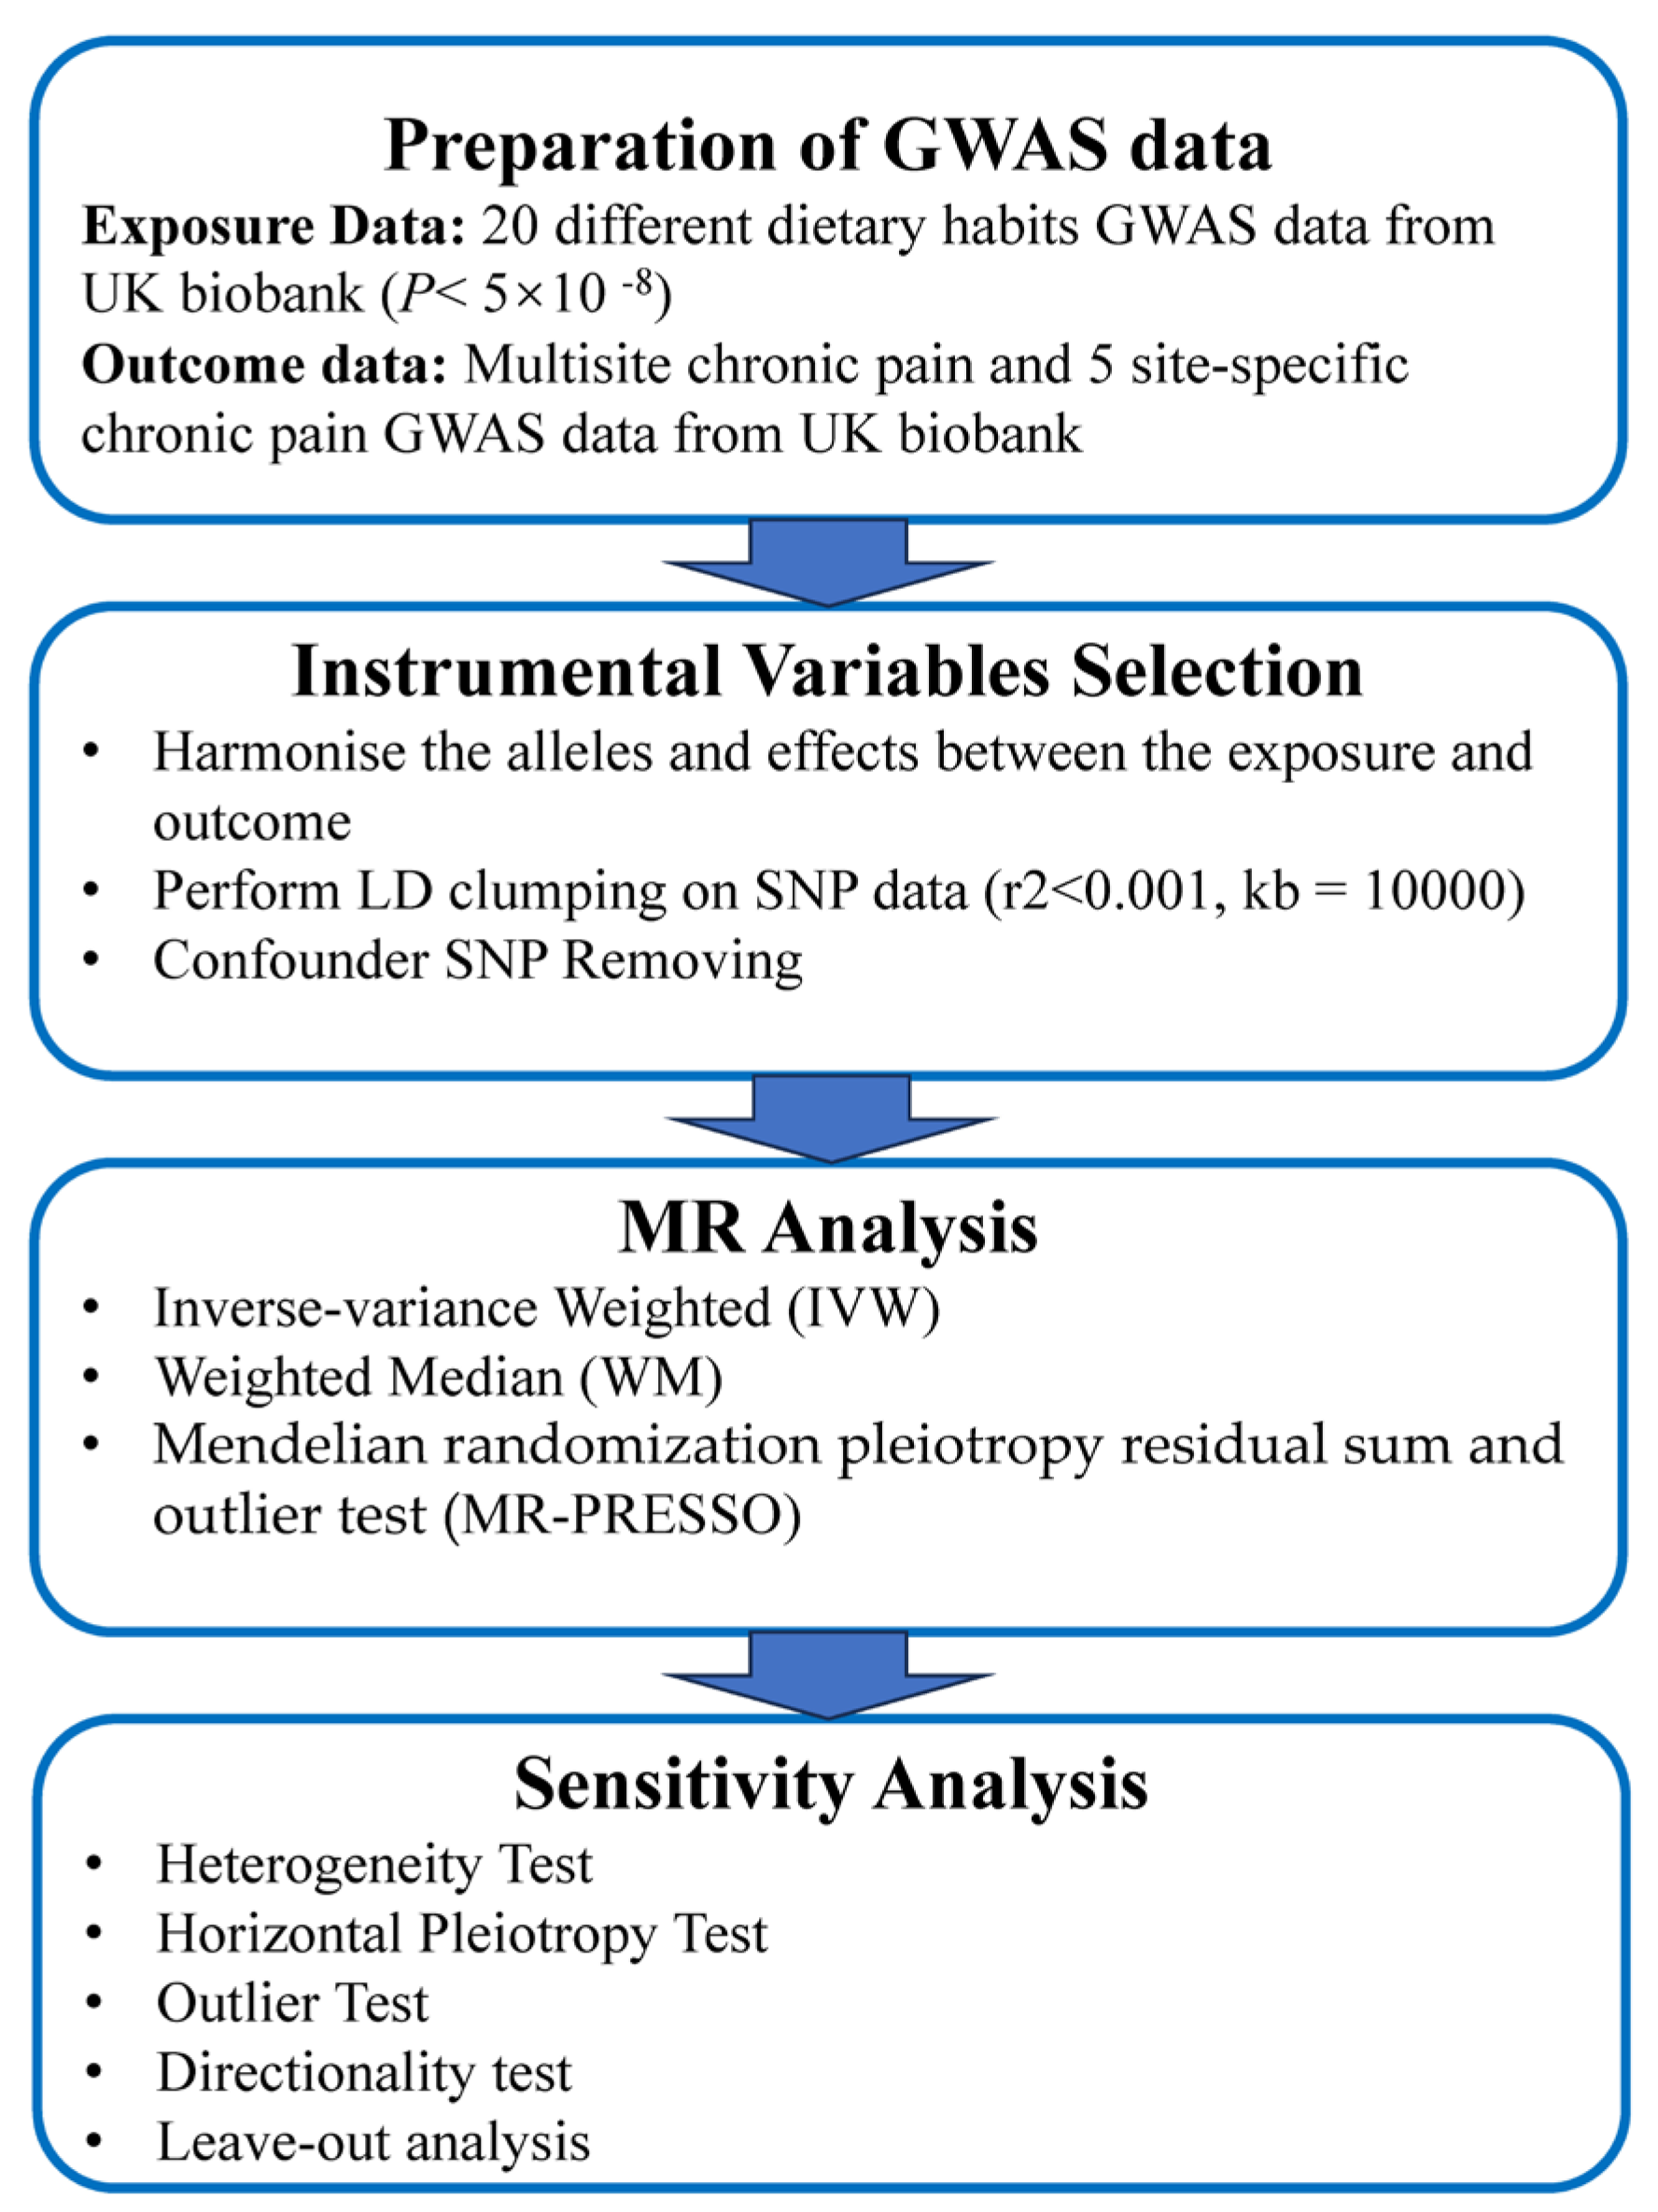
2.2. Exposure Data
2.3. Outcome Data
2.4. Selection of Instrumental Variables
- (a)
- We selected SNPs significantly correlated with dietary habits (p < 5 × 10⁻⁸), ensuring their independence from each other (r2 < 0.001) within a clumping distance of 10,000 kb;
- (b)
- SNPs associated with the outcomes of interest (p < 5 × 10⁻⁸) were excluded from the instrumental variables;
- (c)
- SNPs associated with potential confounding factors, such as educational attainment, living habits (e.g., usual walking pace, time spent watching television), smoking, and other dietary habits, were excluded from all analyses. The relevant information was obtained from the PhenoScanner database V2 (http://www.phenoscanner.medschl.cam.ac.uk/, accessed on 10 June 2023);
- (d)
- To ensure a strong correlation between instrumental variables and exposure factors, we verified that the F-statistic of each SNP was larger than 10 using the formula F = β2/SEβ2;
- (e)
- Palindromic SNPs with intermediate allele frequencies were excluded from the analysis to maintain consistency between the effects of SNPs on exposures and outcomes.
2.5. Statistical Analysis
3. Results
3.1. Genetic Instruments for 20 Dietary Habits
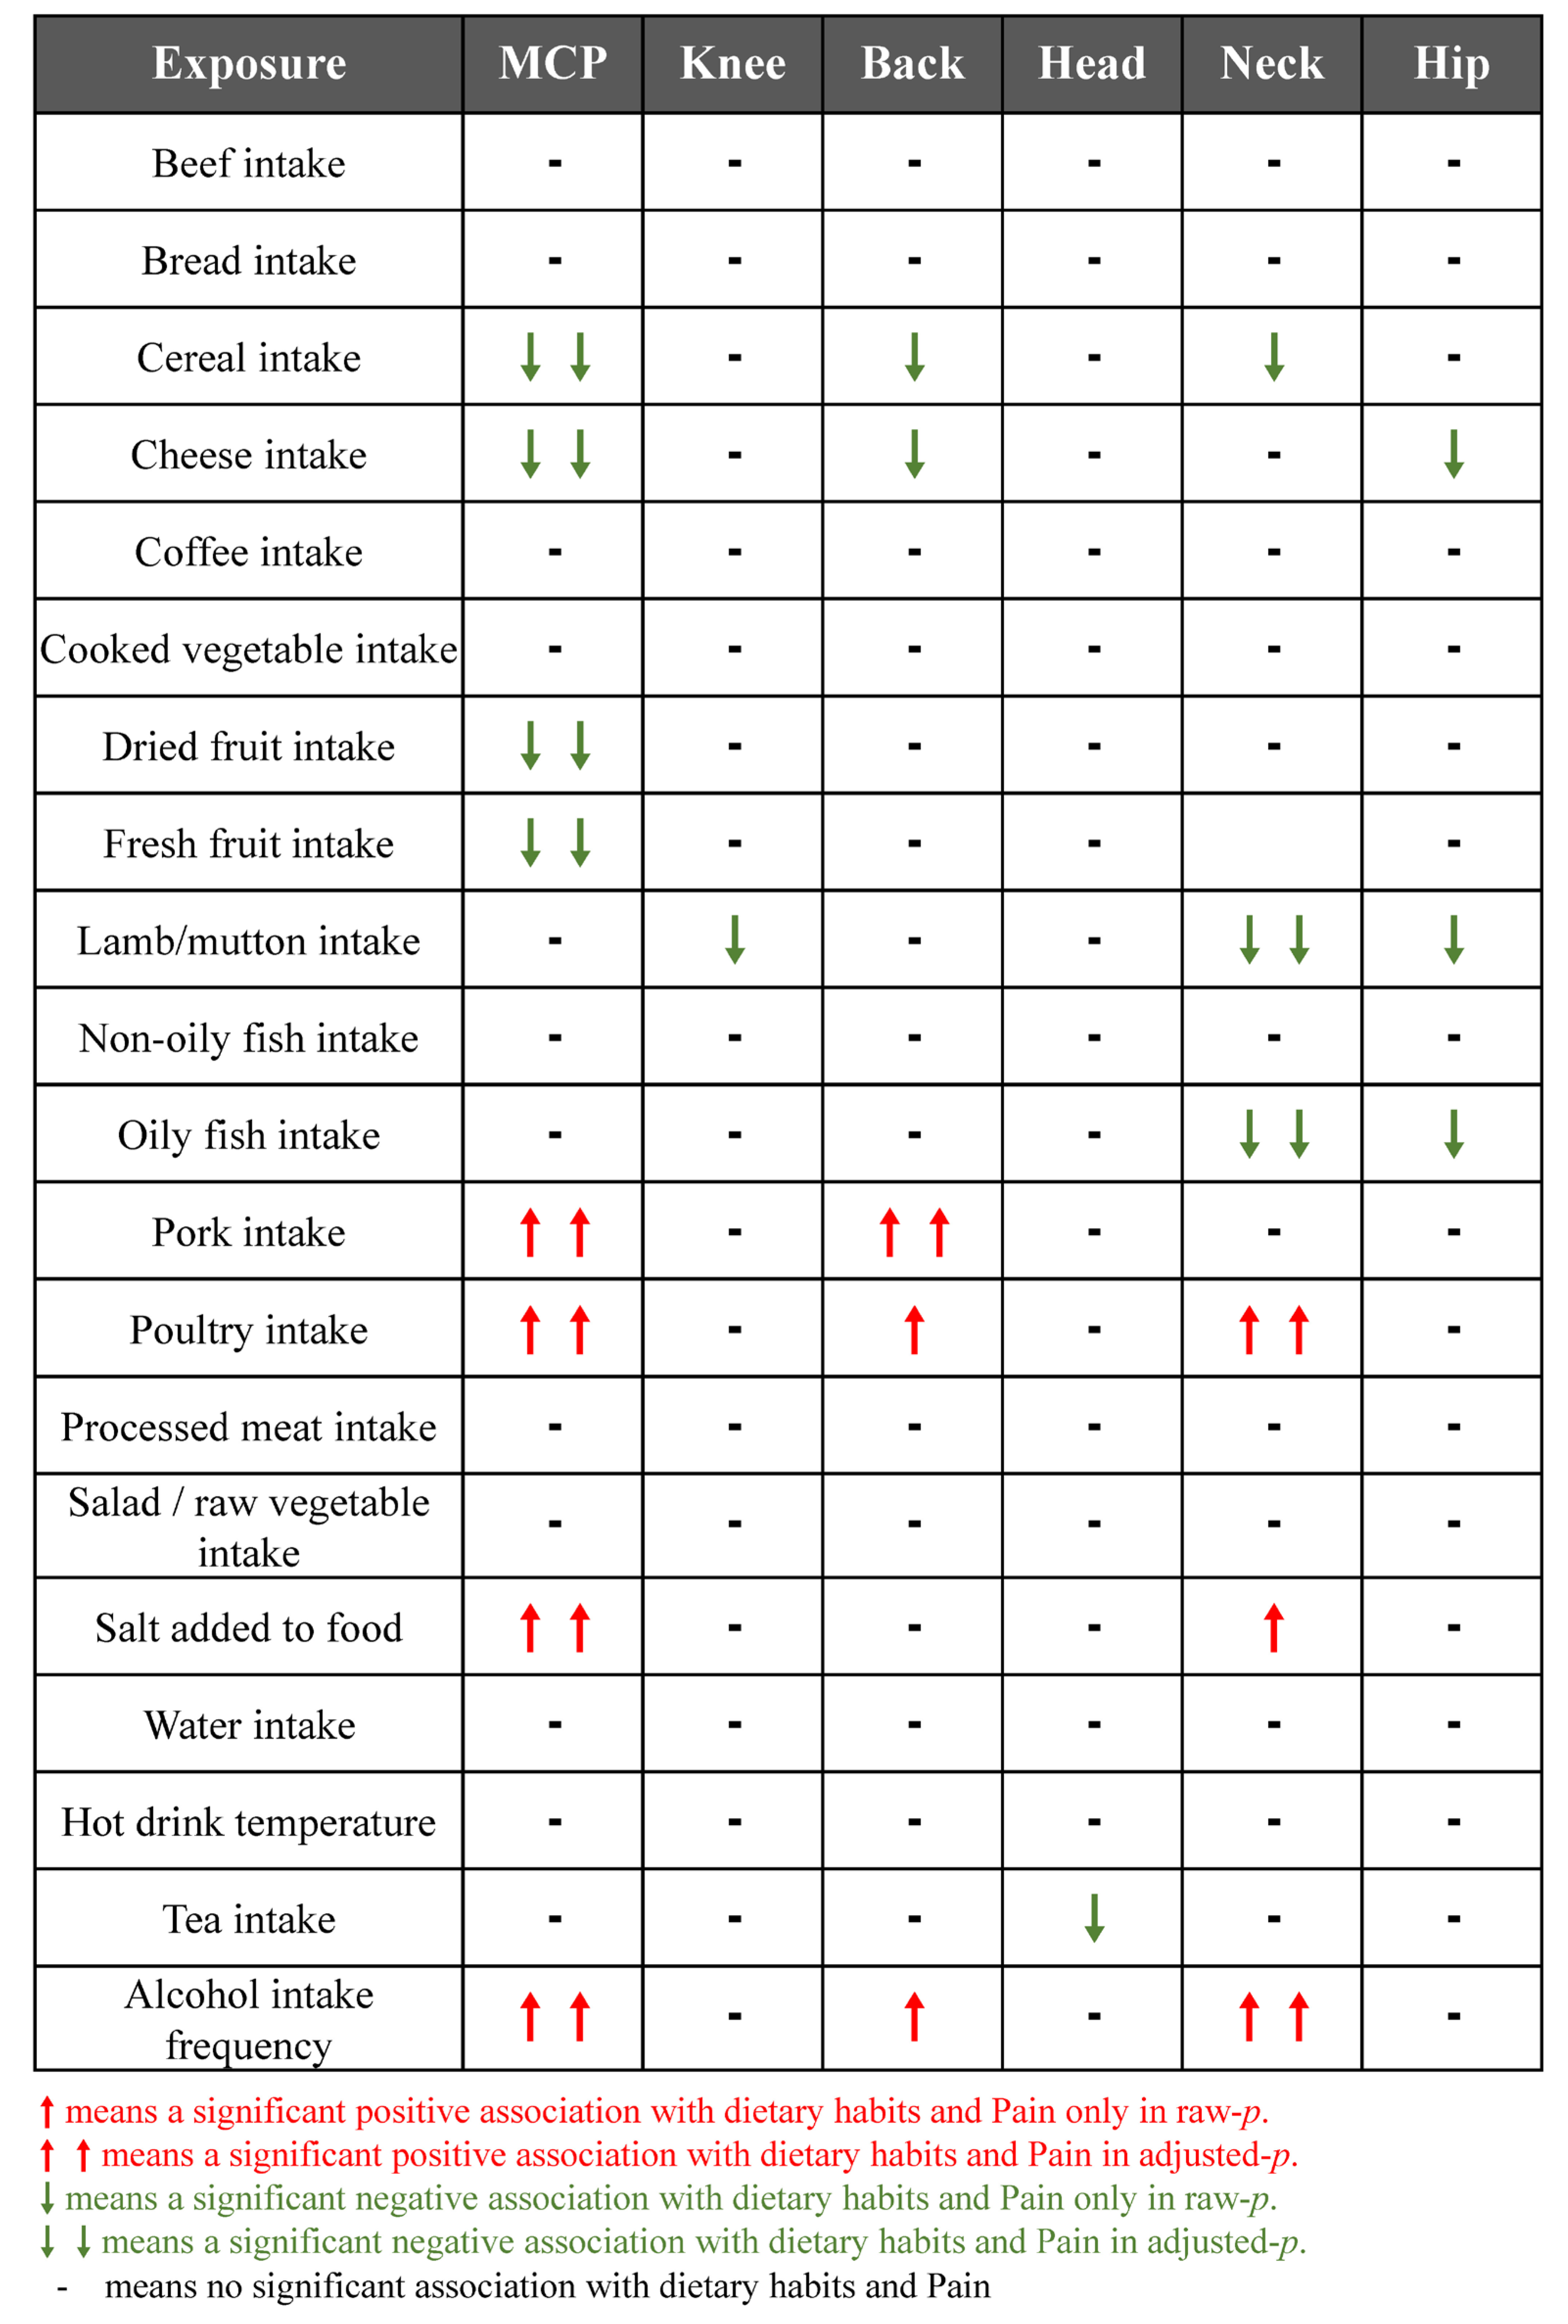
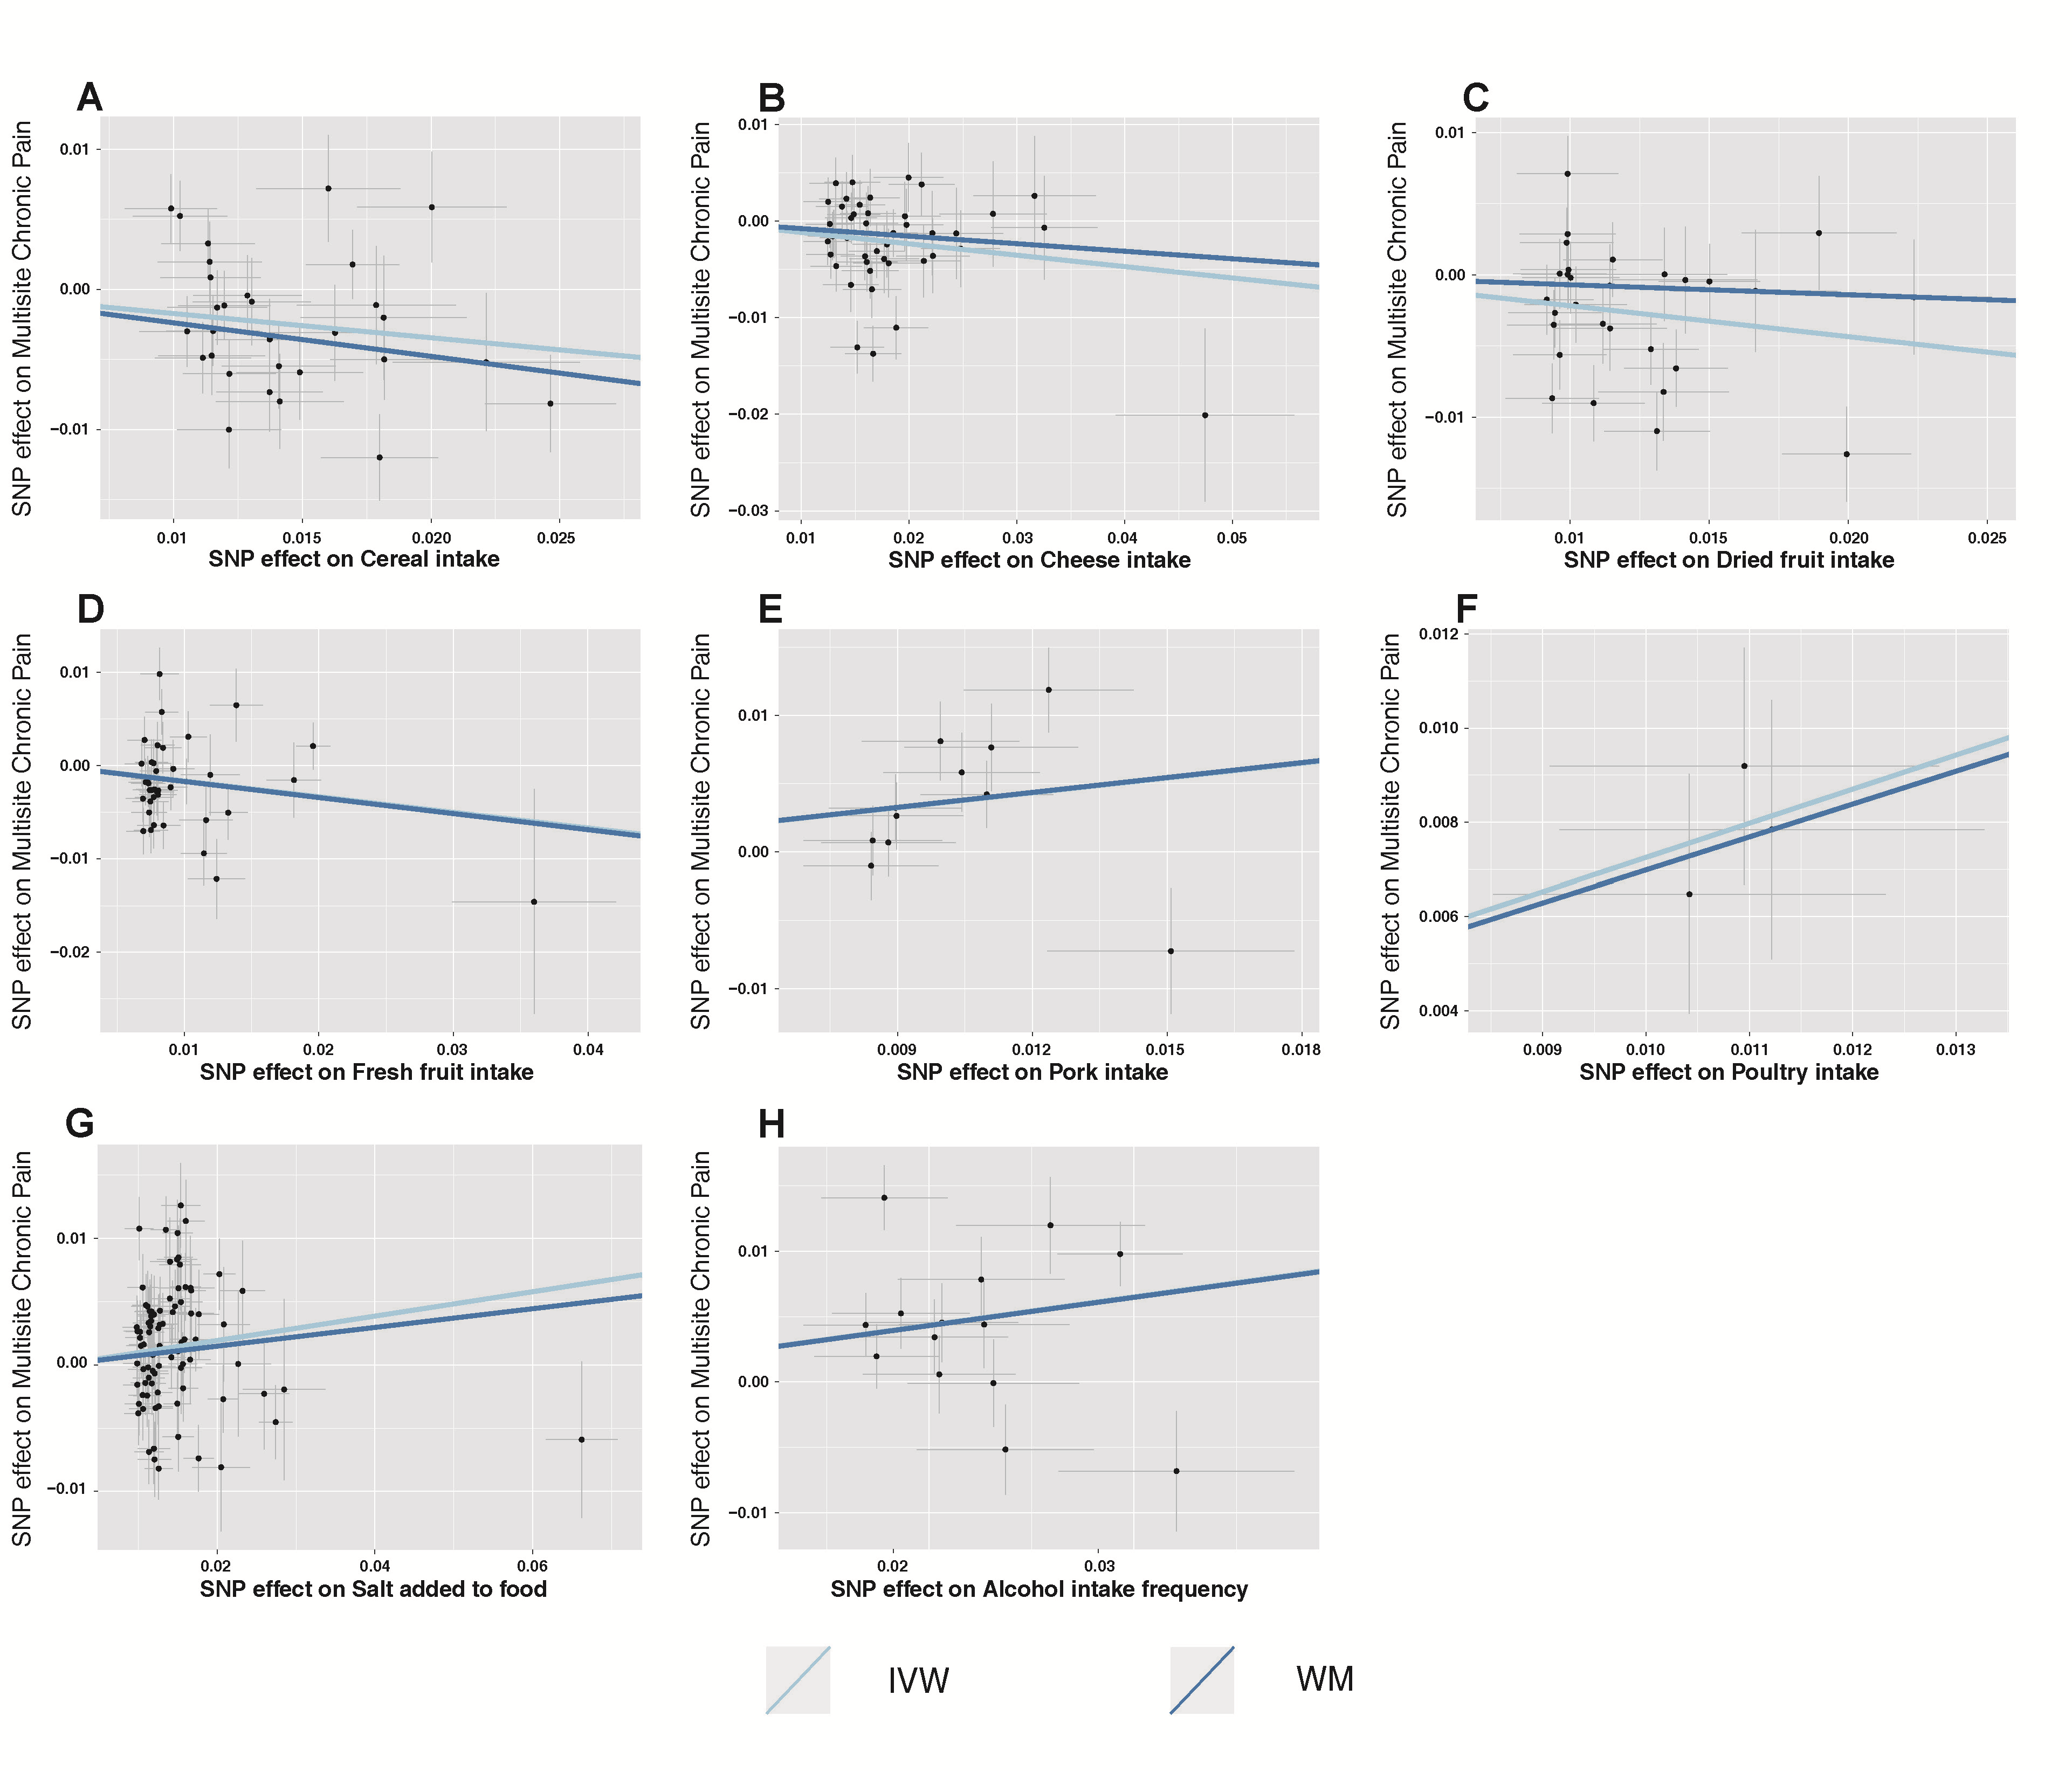
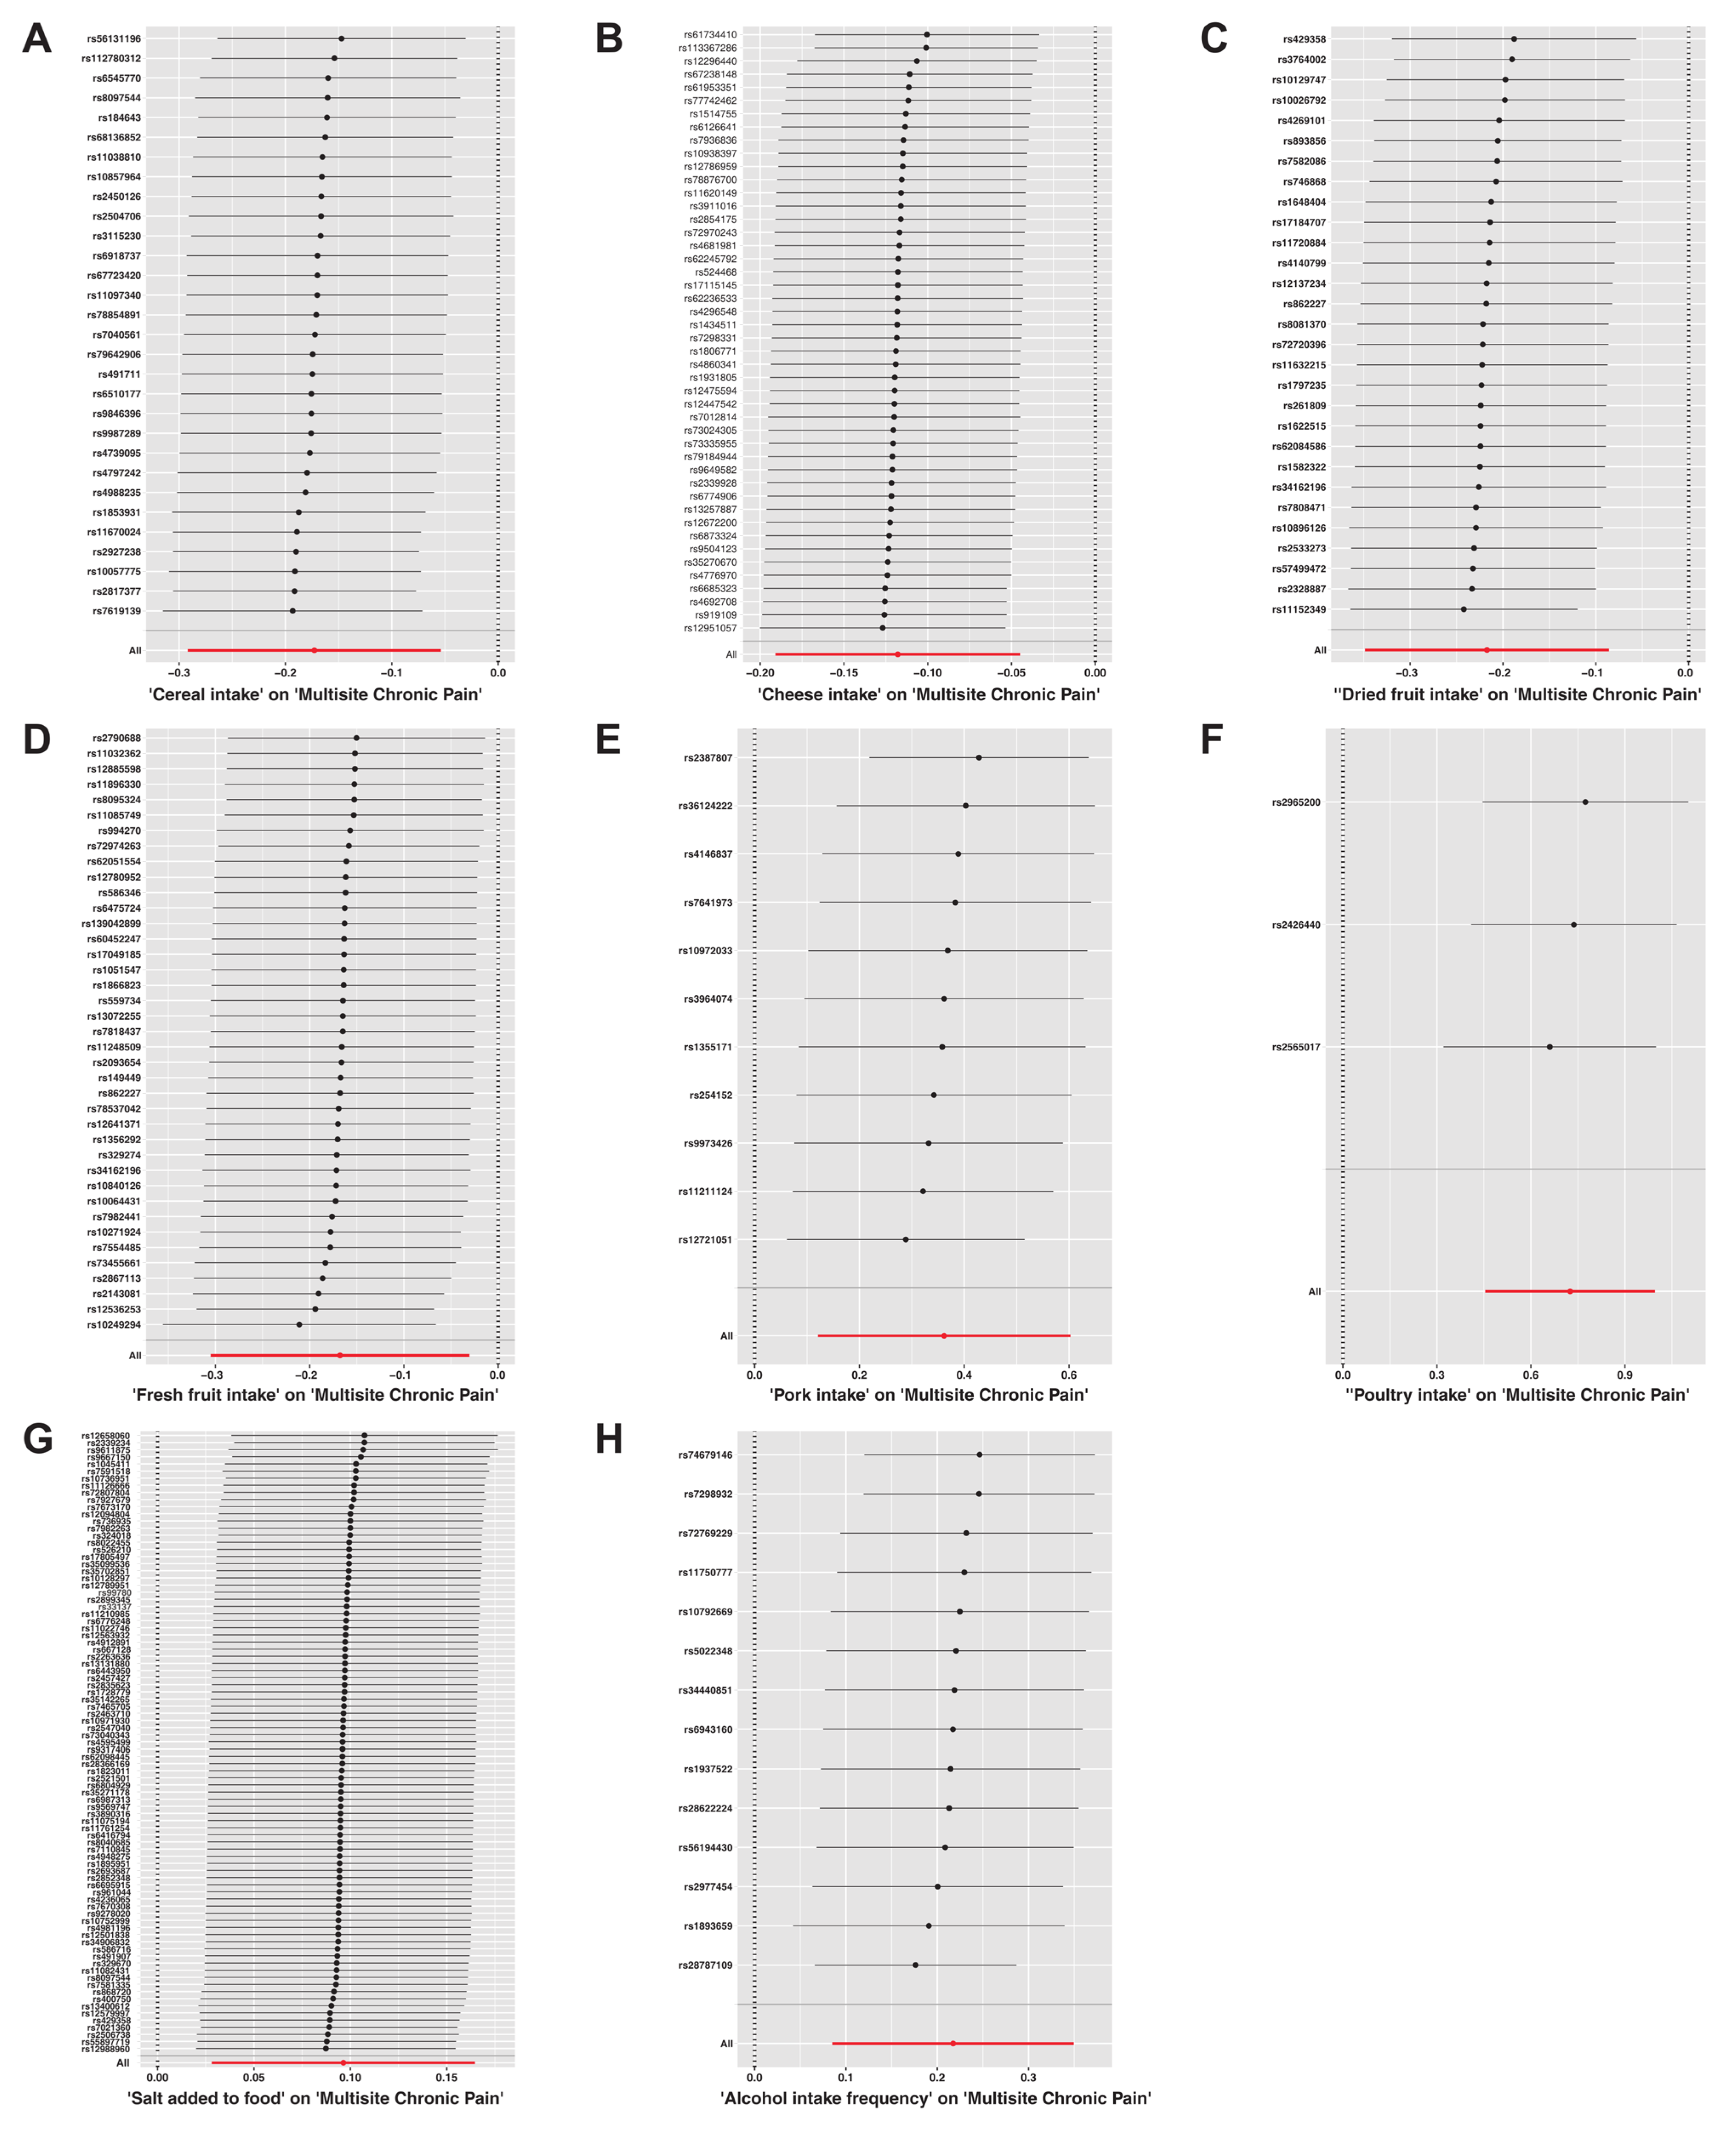
3.2. Causal Effects of Dietary Habits on CP
4. Discussion
5. Conclusions
Supplementary Materials
Author Contributions
Funding
Institutional Review Board Statement
Informed Consent Statement
Data Availability Statement
Acknowledgments
Conflicts of Interest
References
- Cohen, S.P.; Vase, L.; Hooten, W.M. Chronic pain: An update on burden, best practices, and new advances. Lancet 2021, 397, 2082–2097. [Google Scholar] [CrossRef]
- Jackson, T.; Thomas, S.; Stabile, V.; Shotwell, M.; Han, X.; McQueen, K. A Systematic Review and Meta-Analysis of the Global Burden of Chronic Pain Without Clear Etiology in Low- and Middle-Income Countries: Trends in Heterogeneous Data and a Proposal for New Assessment Methods. Anesth. Analg. 2016, 123, 739–748. [Google Scholar] [CrossRef]
- Kozak-Szkopek, E.; Broczek, K.; Slusarczyk, P.; Wieczorowska-Tobis, K.; Klich-Raczka, A.; Szybalska, A.; Mossakowska, M. Prevalence of chronic pain in the elderly Polish population—Results of the PolSenior study. Arch. Med. Sci. 2017, 13, 1197–1206. [Google Scholar] [CrossRef]
- Yong, R.J.; Mullins, P.M.; Bhattacharyya, N. Prevalence of chronic pain among adults in the United States. Pain 2022, 163, e328–e332. [Google Scholar] [CrossRef] [PubMed]
- Wong, C.K.; Mak, R.Y.; Kwok, T.S.; Tsang, J.S.; Leung, M.Y.; Funabashi, M.; Macedo, L.G.; Dennett, L.; Wong, A.Y. Prevalence, Incidence, and Factors Associated with Non-Specific Chronic Low Back Pain in Community-Dwelling Older Adults Aged 60 Years and Older: A Systematic Review and Meta-Analysis. J. Pain 2022, 23, 509–534. [Google Scholar] [CrossRef]
- Robinson, C.L.; Kim, R.S.; Li, M.; Ruan, Q.Z.; Surapaneni, S.; Jones, M.; Pak, D.J.; Southerland, W. The Impact of Smoking on the Development and Severity of Chronic Pain. Curr. Pain Headache Rep. 2022, 26, 575–581. [Google Scholar] [CrossRef]
- Castro-Barquero, S.; Lamuela-Raventós, R.M.; Doménech, M.; Estruch, R. Relationship between Mediterranean Dietary Polyphenol Intake and Obesity. Nutrients 2018, 10, 1523. [Google Scholar] [CrossRef] [PubMed]
- Venter, C.; Eyerich, S.; Sarin, T.; Klatt, K.C. Nutrition and the Immune System: A Complicated Tango. Nutrients 2020, 12, 818. [Google Scholar] [CrossRef]
- Lane, M.M.; Gamage, E.; Travica, N.; Dissanayaka, T.; Ashtree, D.N.; Gauci, S.; Lotfaliany, M.; O’Neil, A.; Jacka, F.N.; Marx, W. Ultra-Processed Food Consumption and Mental Health: A Systematic Review and Meta-Analysis of Observational Studies. Nutrients 2022, 14, 2568. [Google Scholar] [CrossRef] [PubMed]
- Juul, F.; Vaidean, G.; Parekh, N. Ultra-processed Foods and Cardiovascular Diseases: Potential Mechanisms of Action. Adv. Nutr. 2021, 12, 1673–1680. [Google Scholar] [CrossRef]
- Zhou, L.; Wen, X.; Peng, Y.; Zhao, L.; Yu, Y. Salt added to food and body mass index: A bidirectional Mendelian randomisation study. Nutr. Diet. 2021, 78, 315–323. [Google Scholar] [CrossRef]
- Elizabeth, L.; Machado, P.; Zinöcker, M.; Baker, P.; Lawrence, M. Ultra-Processed Foods and Health Outcomes: A Narrative Review. Nutrients 2020, 12, 1955. [Google Scholar] [CrossRef]
- Liu, D.; Zhou, L.; Yang, M.; McIntyre, R.S.; Cao, B. Oxidative Stress Mediates the Association Between Dietary Fat Intake and Cognition in US Older Adults. Am. J. Geriatr. Psychiatry 2022, 30, 761–773. [Google Scholar] [CrossRef] [PubMed]
- Malesza, I.J.; Malesza, M.; Walkowiak, J.; Mussin, N.; Walkowiak, D.; Aringazina, R.; Bartkowiak-Wieczorek, J.; Mądry, E. High-Fat, Western-Style Diet, Systemic Inflammation, and Gut Microbiota: A Narrative Review. Cells 2021, 10, 3164. [Google Scholar] [CrossRef]
- Ji, R.R.; Nackley, A.; Huh, Y.; Terrando, N.; Maixner, W. Neuroinflammation and Central Sensitization in Chronic and Widespread Pain. Anesthesiology 2018, 129, 343–366. [Google Scholar] [CrossRef]
- Kaushik, A.S.; Strath, L.J.; Sorge, R.E. Dietary Interventions for Treatment of Chronic Pain: Oxidative Stress and Inflammation. Pain. Ther. 2020, 9, 487–498. [Google Scholar] [CrossRef]
- Wasser, J.G.; Vasilopoulos, T.; Zdziarski, L.A.; Vincent, H.K. Exercise Benefits for Chronic Low Back Pain in Overweight and Obese Individuals. PM&R 2017, 9, 181–192. [Google Scholar] [CrossRef]
- Elma, Ö.; Yilmaz, S.T.; Deliens, T.; Clarys, P.; Nijs, J.; Coppieters, I.; Polli, A.; Malfliet, A. Chronic Musculoskeletal Pain and Nutrition: Where Are We and Where Are We Heading? PM&R 2020, 12, 1268–1278. [Google Scholar] [CrossRef]
- Lombardo, M.; Feraco, A.; Ottaviani, M.; Rizzo, G.; Camajani, E.; Caprio, M.; Armani, A. The Efficacy of Vitamin D Supplementation in the Treatment of Fibromyalgia Syndrome and Chronic Musculoskeletal Pain. Nutrients 2022, 14, 3010. [Google Scholar] [CrossRef] [PubMed]
- Vormann, J.; Worlitschek, M.; Goedecke, T.; Silver, B. Supplementation with alkaline minerals reduces symptoms in patients with chronic low back pain. J. Trace Elem. Med. Biol. 2001, 15, 179–183. [Google Scholar] [CrossRef] [PubMed]
- MacFarlane, L.A.; Cook, N.R.; Kim, E.; Lee, I.M.; Iversen, M.D.; Gordon, D.; Buring, J.E.; Katz, J.N.; Manson, J.E.; Costenbader, K.H. The Effects of Vitamin D and Marine Omega-3 Fatty Acid Supplementation on Chronic Knee Pain in Older US Adults: Results from a Randomized Trial. Arthritis Rheumatol. 2020, 72, 1836–1844. [Google Scholar] [CrossRef] [PubMed]
- Huang, J.; Xie, Z.F. Dried fruit intake causally protects against low back pain: A Mendelian randomization study. Front. Nutr. 2023, 10, 1027481. [Google Scholar] [CrossRef] [PubMed]
- Chen, T.T.; Chen, C.Y.; Fang, C.P.; Cheng, Y.C.; Lin, Y.F. Causal influence of dietary habits on the risk of major depressive disorder: A diet-wide Mendelian randomization analysis. J. Affect. Disord. 2022, 319, 482–489. [Google Scholar] [CrossRef]
- Mao, X.; Huang, C.; Wang, Y.; Mao, S.; Li, Z.; Zou, W.; Liao, Z. Association between Dietary Habits and Pancreatitis among Individuals of European Ancestry: A Two-Sample Mendelian Randomization Study. Nutrients 2023, 15, 1153. [Google Scholar] [CrossRef] [PubMed]
- Sudlow, C.; Gallacher, J.; Allen, N.; Beral, V.; Burton, P.; Danesh, J.; Downey, P.; Elliott, P.; Green, J.; Landray, M.; et al. UK biobank: An open access resource for identifying the causes of a wide range of complex diseases of middle and old age. PLoS Med. 2015, 12, e1001779. [Google Scholar] [CrossRef] [PubMed]
- Collins, R. What makes UK Biobank special? Lancet 2012, 379, 1173–1174. [Google Scholar] [CrossRef]
- Johnston, K.J.A.; Adams, M.J.; Nicholl, B.I.; Ward, J.; Strawbridge, R.J.; Ferguson, A.; McIntosh, A.M.; Bailey, M.E.S.; Smith, D.J. Genome-wide association study of multisite chronic pain in UK Biobank. PLoS Genet. 2019, 15, e1008164. [Google Scholar] [CrossRef]
- Verbanck, M.; Chen, C.Y.; Neale, B.; Do, R. Detection of widespread horizontal pleiotropy in causal relationships inferred from Mendelian randomization between complex traits and diseases. Nat. Genet. 2018, 50, 693–698. [Google Scholar] [CrossRef]
- Storey, J.D. The positive false discovery rate: A Bayesian interpretation and the q-value. Ann. Stat. 2003, 31, 2013–2035. [Google Scholar] [CrossRef]
- Christ, A.; Lauterbach, M.; Latz, E. Western Diet and the Immune System: An Inflammatory Connection. Immunity 2019, 51, 794–811. [Google Scholar] [CrossRef]
- Galland, L. Diet and inflammation. Nutr. Clin. Pract. 2010, 25, 634–640. [Google Scholar] [CrossRef] [PubMed]
- Lee, Y.M.; Han, S.I.; Song, B.C.; Yeum, K.J. Bioactives in Commonly Consumed Cereal Grains: Implications for Oxidative Stress and Inflammation. J. Med. Food 2015, 18, 1179–1186. [Google Scholar] [CrossRef] [PubMed]
- Soujanya, K.V.; Jayadeep, A.P. Obesity-associated biochemical markers of inflammation and the role of grain phytochemicals. J. Food Biochem. 2022, 46, e14257. [Google Scholar] [CrossRef]
- Wallace, T.C.; Bailey, R.L.; Blumberg, J.B.; Burton-Freeman, B.; Chen, C.O.; Crowe-White, K.M.; Drewnowski, A.; Hooshmand, S.; Johnson, E.; Lewis, R.; et al. Fruits, vegetables, and health: A comprehensive narrative, umbrella review of the science and recommendations for enhanced public policy to improve intake. Crit. Rev. Food Sci. Nutr. 2020, 60, 2174–2211. [Google Scholar] [CrossRef] [PubMed]
- Ramos-Lopez, O.; Milagro, F.I.; Riezu-Boj, J.I.; Martinez, J.A. Epigenetic signatures underlying inflammation: An interplay of nutrition, physical activity, metabolic diseases, and environmental factors for personalized nutrition. Inflamm. Res. 2021, 70, 29–49. [Google Scholar] [CrossRef]
- Azak, A.; Huddam, B.; Gonen, N.; Yilmaz, S.R.; Kocak, G.; Duranay, M. Salt intake is associated with inflammation in chronic heart failure. Int. Cardiovasc. Res. J. 2014, 8, 89–93. [Google Scholar]
- Kuang, R.; O’Keefe, S.J.D.; Ramos Del Aguila de Rivers, C.; Koutroumpakis, F.; Binion, D.G. Is Salt at Fault? Dietary Salt Consumption and Inflammatory Bowel Disease. Inflamm. Bowel Dis. 2023, 29, 140–150. [Google Scholar] [CrossRef]
- Zhang, M.; Song, S.; Zhao, D.; Shi, J.; Xu, X.; Zhou, G.; Li, C. High intake of chicken and pork proteins aggravates high-fat-diet-induced inflammation and disorder of hippocampal glutamatergic system. J. Nutr. Biochem. 2020, 85, 108487. [Google Scholar] [CrossRef]
- Ji, R.R.; Chamessian, A.; Zhang, Y.Q. Pain regulation by non-neuronal cells and inflammation. Science 2016, 354, 572–577. [Google Scholar] [CrossRef]
- Hu, M.J.; Tan, J.S.; Gao, X.J.; Yang, J.G.; Yang, Y.J. Effect of Cheese Intake on Cardiovascular Diseases and Cardiovascular Biomarkers. Nutrients 2022, 14, 2936. [Google Scholar] [CrossRef]
- Benedik, E. Sources of vitamin D for humans. Int. J. Vitam. Nutr. Res. 2022, 92, 118–125. [Google Scholar] [CrossRef] [PubMed]
- Agostini, D.; Zeppa Donati, S.; Lucertini, F.; Annibalini, G.; Gervasi, M.; Ferri Marini, C.; Piccoli, G.; Stocchi, V.; Barbieri, E.; Sestili, P. Muscle and Bone Health in Postmenopausal Women: Role of Protein and Vitamin D Supplementation Combined with Exercise Training. Nutrients 2018, 10, 1103. [Google Scholar] [CrossRef] [PubMed]
- Samraj, A.N.; Pearce, O.M.; Läubli, H.; Crittenden, A.N.; Bergfeld, A.K.; Banda, K.; Gregg, C.J.; Bingman, A.E.; Secrest, P.; Diaz, S.L.; et al. A red meat-derived glycan promotes inflammation and cancer progression. Proc. Natl. Acad. Sci. USA 2015, 112, 542–547. [Google Scholar] [CrossRef] [PubMed]


| ID or PMID | Food Types | Trait | Sample Size | Case | Control | SNPs (N) | Consortium (Author) | Population | Category | Year |
|---|---|---|---|---|---|---|---|---|---|---|
| ukb-b-2862 | Meat and Poultry | Beef intake | 461,053 | NA | NA | 9,851,867 | MRC-IEU (Elsworth et al.) | European | Categorical (single) | 2018 |
| ukb-b-11348 | Bread | Bread intake | 452,236 | NA | NA | 9,851,867 | MRC-IEU (Elsworth et al.) | European | Integer, slices/week | 2018 |
| ukb-b-15926 | Grains, Nuts, and Seeds | Cereal intake | 441,640 | NA | NA | 9,851,867 | MRC-IEU (Elsworth et al.) | European | Integer, bowls/week | 2018 |
| ukb-b-1489 | Dairy Products | Cheese intake | 451,486 | NA | NA | 9,851,867 | MRC-IEU (Elsworth et al.) | European | Categorical (single) | 2018 |
| ukb-b-5237 | Drinks | Coffee intake | 428,860 | NA | NA | 9,851,867 | MRC-IEU (Elsworth et al.) | European | Integer, cups/day | 2018 |
| ukb-b-8089 | Vegetable | Cooked vegetable intake | 448,651 | NA | NA | 9,851,867 | MRC-IEU (Elsworth et al.) | European | Integer, tablespoons/day | 2018 |
| ukb-b-16576 | Fruit | Dried fruit intake | 421,764 | NA | NA | 9,851,867 | MRC-IEU (Elsworth et al.) | European | Integer, pieces/day | 2018 |
| ukb-b-3881 | Fruit | Fresh fruit intake | 446,462 | NA | NA | 9,851,867 | MRC-IEU (Elsworth et al.) | European | Integer, pieces/day | 2018 |
| ukb-b-14179 | Meat and Poultry | Lamb/mutton intake | 460,006 | NA | NA | 9,851,867 | MRC-IEU (Elsworth et al.) | European | Categorical (single) | 2018 |
| ukb-b-17627 | Seafood | Non-oily fish intake | 460,880 | NA | NA | 9,851,867 | MRC-IEU (Elsworth et al.) | European | Categorical (single) | 2018 |
| ukb-b-2209 | Seafood | Oily fish intake | 460,443 | NA | NA | 9,851,867 | MRC-IEU (Elsworth et al.) | European | Categorical (single) | 2018 |
| ukb-b-5640 | Meat and Poultry | Pork intake | 460,162 | NA | NA | 9,851,867 | MRC-IEU (Elsworth et al.) | European | Categorical (single) | 2018 |
| ukb-b-8006 | Meat and Poultry | Poultry intake | 461,900 | NA | NA | 9,851,867 | MRC-IEU (Elsworth et al.) | European | Categorical (single) | 2018 |
| ukb-b-6324 | Meat and Poultry | Processed meat intake | 461,981 | NA | NA | 9,851,867 | MRC-IEU (Elsworth et al.) | European | Categorical (single) | 2018 |
| ukb-b-1996 | Vegetable | Salad/raw vegetable intake | 435,435 | NA | NA | 9,851,867 | MRC-IEU (Elsworth et al.) | European | Integer, tablespoons/day | 2018 |
| ukb-b-8121 | Food additive | Salt added to food | 462,630 | NA | NA | 9,851,867 | MRC-IEU (Elsworth et al.) | European | Categorical (single) | 2018 |
| ukb-b-14898 | Drinks | Water intake | 427,588 | NA | NA | 9,851,867 | MRC-IEU (Elsworth et al.) | European | Integer, glasses/day | 2018 |
| ukb-b-14203 | - | Hot drink temperature | 457,873 | NA | NA | 9,851,867 | MRC-IEU (Elsworth et al.) | European | Categorical (single) | 2018 |
| ukb-b-6066 | Drinks | Tea intake | 447,485 | NA | NA | 9,851,867 | MRC-IEU (Elsworth et al.) | European | Integer, cups/day | 2018 |
| ukb-b-5779 | Drinks | Alcohol intake frequency. | 462,346 | NA | NA | 9,851,867 | MRC-IEU (Elsworth et al.) | European | Categorical (single) | 2018 |
| 31194737 | - | Multisite chronic pain | 387,649 | NA | NA | 9,926,106 | Johnston et al. [27] | European | Categorical Ordered | 2019 |
| ukb-b-8463 | - | Back pain for 3+ months | 117,404 | 80,588 | 36,816 | 9,851,867 | MRC-IEU (Elsworth et al.) | European | Binary | 2018 |
| ukb-b-8906 | - | Knee pain for 3+ months | 97,889 | 76,910 | 20,979 | 9,851,867 | MRC-IEU (Elsworth et al.) | European | Binary | 2018 |
| ukb-b-16118 | - | Neck/shoulder pain for 3+ months | 105,396 | 72,887 | 32,509 | 9,851,867 | MRC-IEU (Elsworth et al.) | European | Binary | 2018 |
| ukb-b-13092 | - | Headache for 3+ months | 91,269 | 41,719 | 49,550 | 9,851,867 | MRC-IEU (Elsworth et al.) | European | Binary | 2018 |
| ukb-b-133 | - | Hip pain for 3+ months | 51,516 | 40,152 | 11,364 | 9,851,867 | MRC-IEU (Elsworth et al.) | European | Binary | 2018 |
| Exposure | Number of SNPs | β | SEβ | p-Value | Adjusted p-Value |
|---|---|---|---|---|---|
| Beef intake | 13 | 0.10 | 0.11 | 0.389 | 0.648 |
| Bread intake | 26 | −0.01 | 0.07 | 0.882 | 0.936 |
| Cereal intake | 30 | −0.17 | 0.06 | 0.004 | 0.015 |
| Cheese intake | 46 | −0.12 | 0.04 | 0.002 | 0.008 |
| Coffee intake | 29 | −0.04 | 0.06 | 0.554 | 0.791 |
| Cooked vegetable intake | 11 | 0.11 | 0.11 | 0.294 | 0.534 |
| Dried fruit intake | 29 | −0.22 | 0.07 | 0.001 | 0.008 |
| Fresh fruit intake | 39 | −0.17 | 0.07 | 0.017 | 0.041 |
| Lamb/mutton intake | 29 | −0.06 | 0.08 | 0.479 | 0.737 |
| Non-oily fish intake | 6 | −0.02 | 0.22 | 0.924 | 0.936 |
| Oily fish intake | 50 | −0.06 | 0.05 | 0.214 | 0.428 |
| Pork intake | 11 | 0.36 | 0.12 | 0.003 | 0.013 |
| Poultry intake | 3 | 0.73 | 0.14 | <0.001 | <0.001 |
| Processed meat intake | 18 | 0.01 | 0.08 | 0.936 | 0.936 |
| Salad/raw vegetable intake | 14 | −0.16 | 0.11 | 0.158 | 0.351 |
| Salt added to food | 87 | 0.10 | 0.03 | 0.006 | 0.016 |
| Water intake | 33 | −0.01 | 0.06 | 0.807 | 0.936 |
| Hot drink temperature | 57 | 0.02 | 0.07 | 0.777 | 0.936 |
| Tea intake | 31 | −0.03 | 0.07 | 0.685 | 0.914 |
| Alcohol intake frequency | 14 | 0.22 | 0.07 | 0.001 | 0.008 |
| Exposure | Number of SNPs | β | SEβ | p-Value | Adjusted p-Value |
|---|---|---|---|---|---|
| Beef intake | 13 | 0.08 | 0.05 | 0.09 | 0.301 |
| Bread intake | 27 | −0.01 | 0.03 | 0.795 | 0.837 |
| Cereal intake | 30 | −0.08 | 0.04 | 0.037 | 0.148 |
| Cheese intake | 46 | −0.06 | 0.02 | 0.007 | 0.069 |
| Coffee intake | 29 | −0.02 | 0.03 | 0.607 | 0.828 |
| Cooked vegetable intake | 11 | 0.06 | 0.06 | 0.34 | 0.617 |
| Dried fruit intake | 29 | −0.05 | 0.03 | 0.14 | 0.354 |
| Fresh fruit intake | 39 | −0.04 | 0.04 | 0.274 | 0.61 |
| Lamb/mutton intake | 29 | 0.01 | 0.04 | 0.749 | 0.837 |
| Non-oily fish intake | 6 | 0.11 | 0.08 | 0.142 | 0.354 |
| Oily fish intake | 50 | −0.02 | 0.02 | 0.329 | 0.617 |
| Pork intake | 11 | 0.23 | 0.06 | <0.001 | 0.01 |
| Poultry intake | 3 | 0.23 | 0.11 | 0.037 | 0.148 |
| Processed meat intake | 18 | −0.02 | 0.04 | 0.662 | 0.828 |
| Salad/raw vegetable intake | 14 | 0.02 | 0.06 | 0.779 | 0.837 |
| Salt added to food | 87 | 0.01 | 0.02 | 0.647 | 0.828 |
| Water intake | 34 | −0.02 | 0.03 | 0.55 | 0.828 |
| Hot drink temperature | 57 | 0 | 0.04 | 0.986 | 0.986 |
| Tea intake | 32 | −0.02 | 0.02 | 0.449 | 0.748 |
| Alcohol intake frequency | 15 | 0.06 | 0.03 | 0.023 | 0.148 |
Disclaimer/Publisher’s Note: The statements, opinions and data contained in all publications are solely those of the individual author(s) and contributor(s) and not of MDPI and/or the editor(s). MDPI and/or the editor(s) disclaim responsibility for any injury to people or property resulting from any ideas, methods, instructions or products referred to in the content. |
© 2023 by the authors. Licensee MDPI, Basel, Switzerland. This article is an open access article distributed under the terms and conditions of the Creative Commons Attribution (CC BY) license (https://creativecommons.org/licenses/by/4.0/).
Share and Cite
Zhou, R.; Zhang, L.; Sun, Y.; Yan, J.; Jiang, H. Causal Associations between Dietary Habits and Chronic Pain: A Two-Sample Mendelian Randomization Study. Nutrients 2023, 15, 3709. https://doi.org/10.3390/nu15173709
Zhou R, Zhang L, Sun Y, Yan J, Jiang H. Causal Associations between Dietary Habits and Chronic Pain: A Two-Sample Mendelian Randomization Study. Nutrients. 2023; 15(17):3709. https://doi.org/10.3390/nu15173709
Chicago/Turabian StyleZhou, Ren, Lei Zhang, Yu Sun, Jia Yan, and Hong Jiang. 2023. "Causal Associations between Dietary Habits and Chronic Pain: A Two-Sample Mendelian Randomization Study" Nutrients 15, no. 17: 3709. https://doi.org/10.3390/nu15173709
APA StyleZhou, R., Zhang, L., Sun, Y., Yan, J., & Jiang, H. (2023). Causal Associations between Dietary Habits and Chronic Pain: A Two-Sample Mendelian Randomization Study. Nutrients, 15(17), 3709. https://doi.org/10.3390/nu15173709