

Pharmacokinetic Analyses of Liposomal and Non-Liposomal Multivitamin/Mineral Formulations

 , , , , , ,

Abstract
1. Introduction
2. Methods
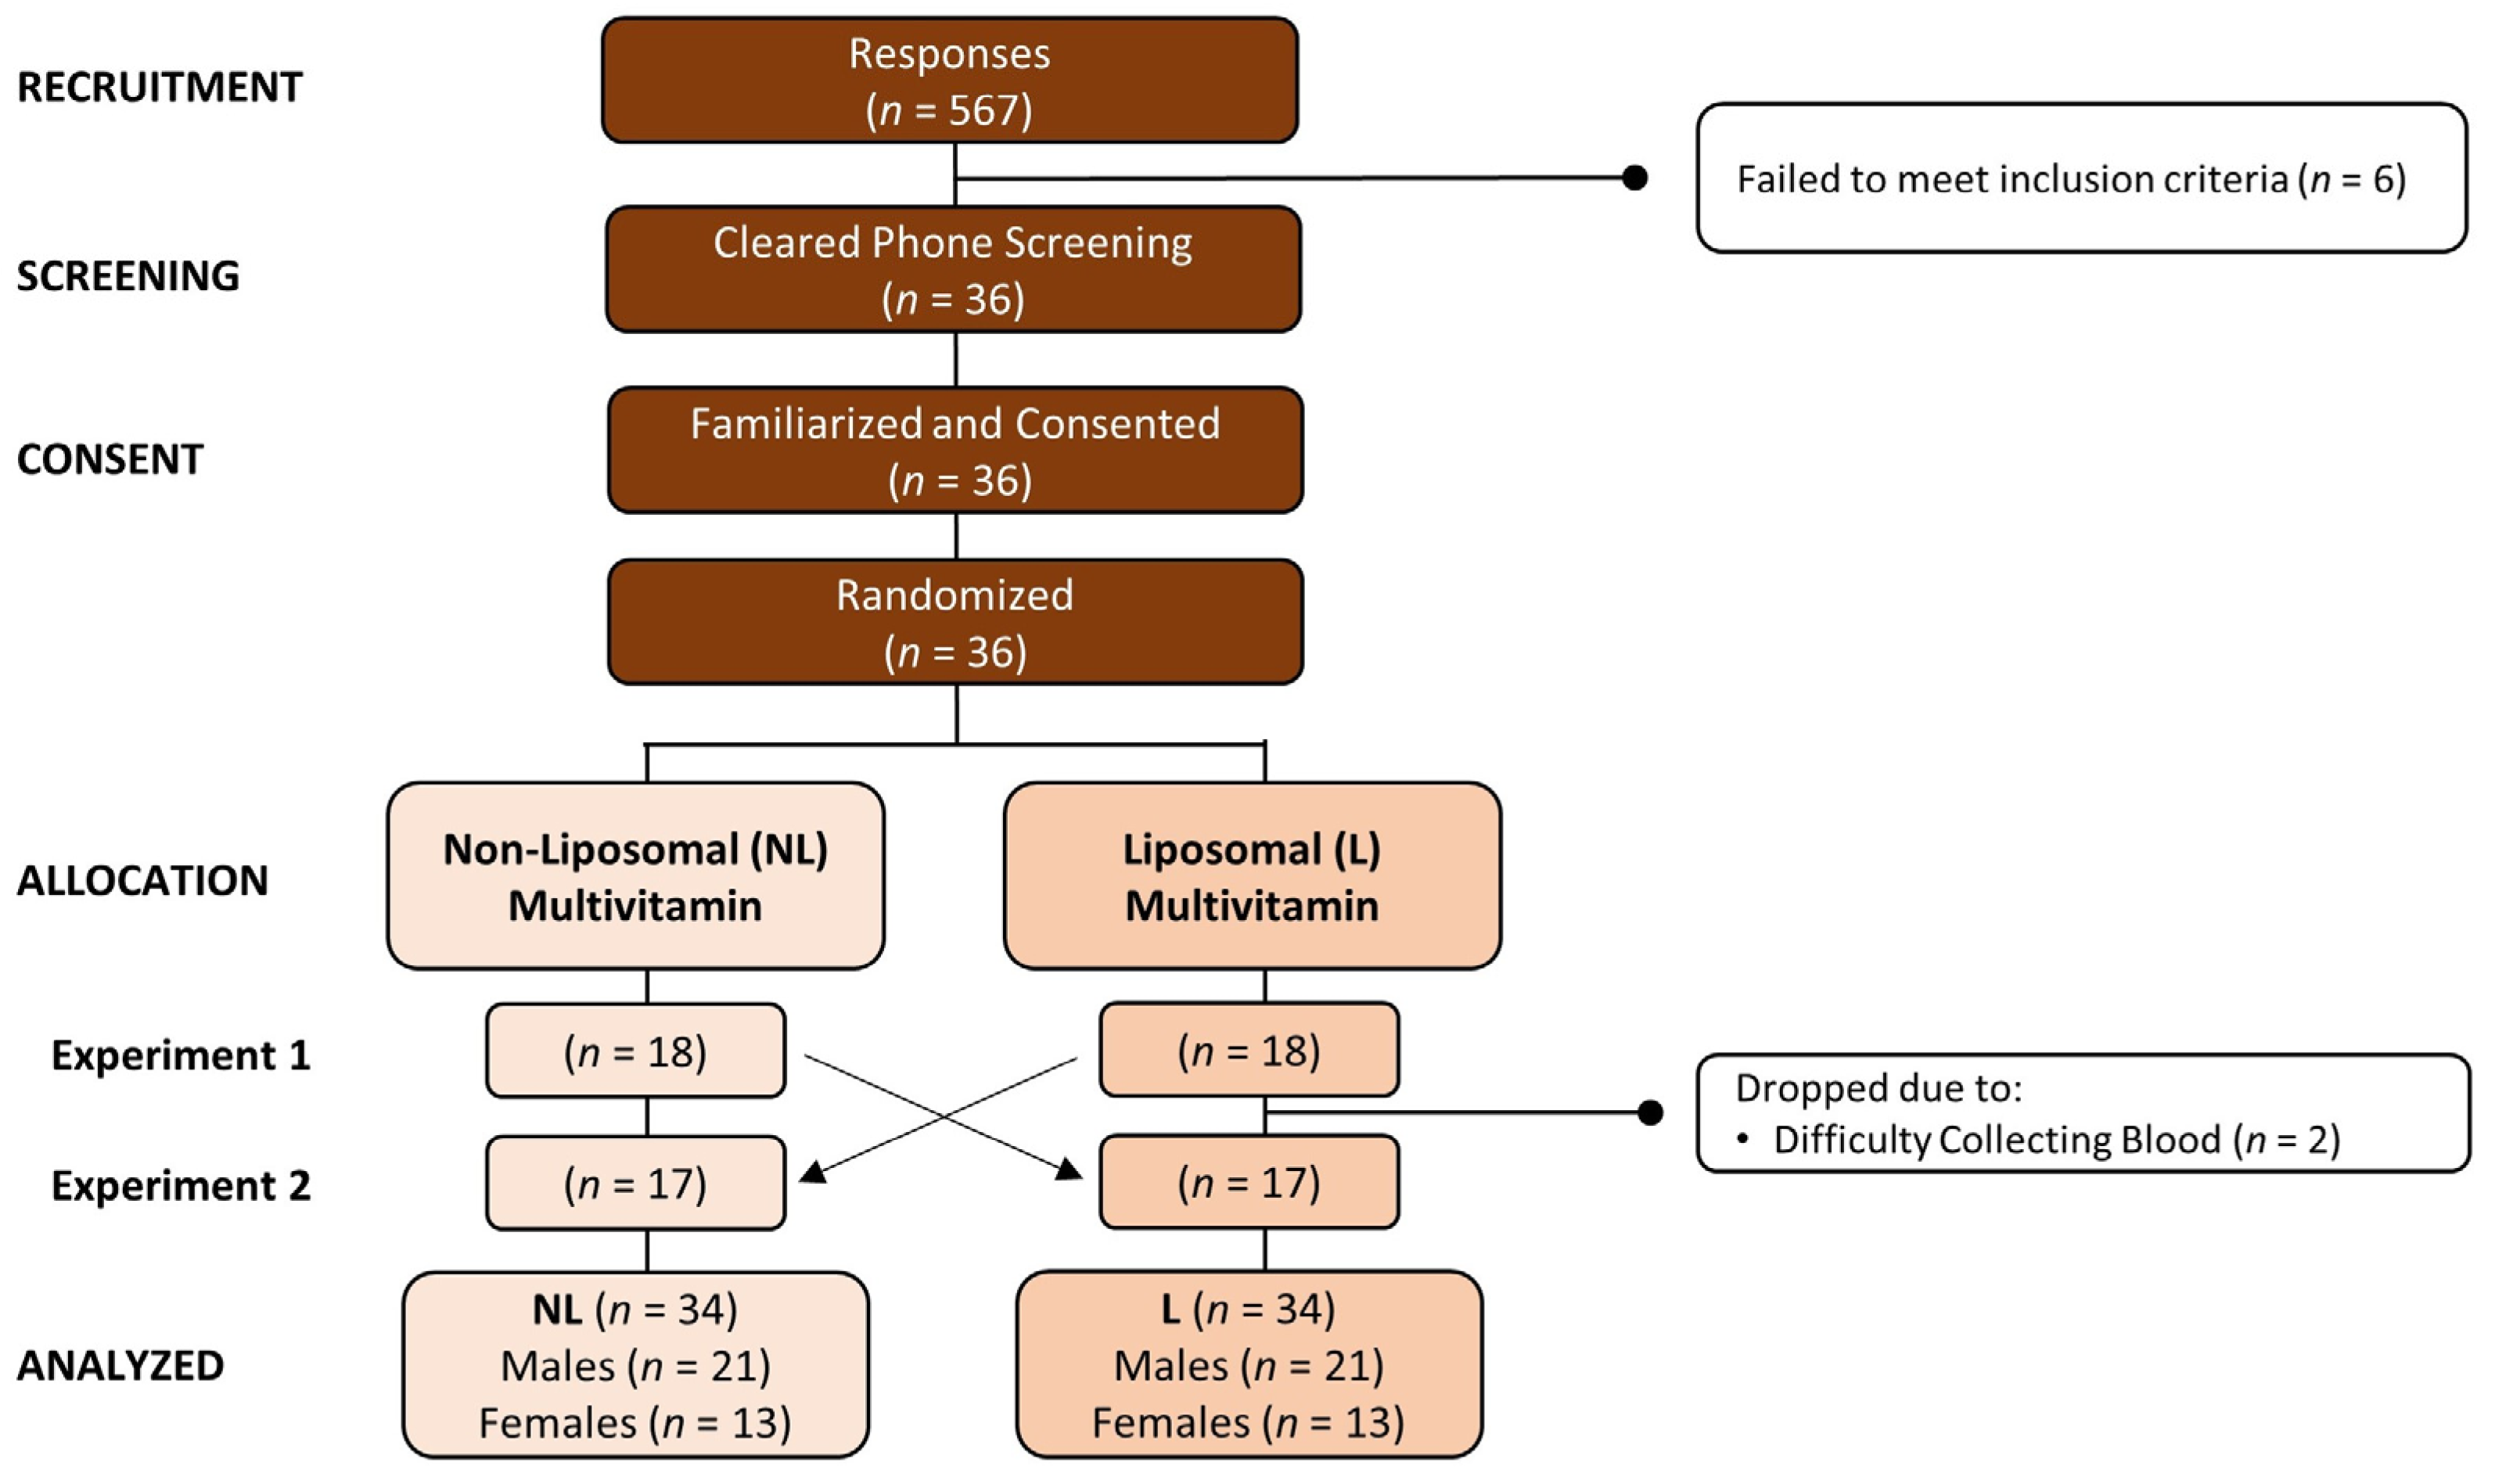
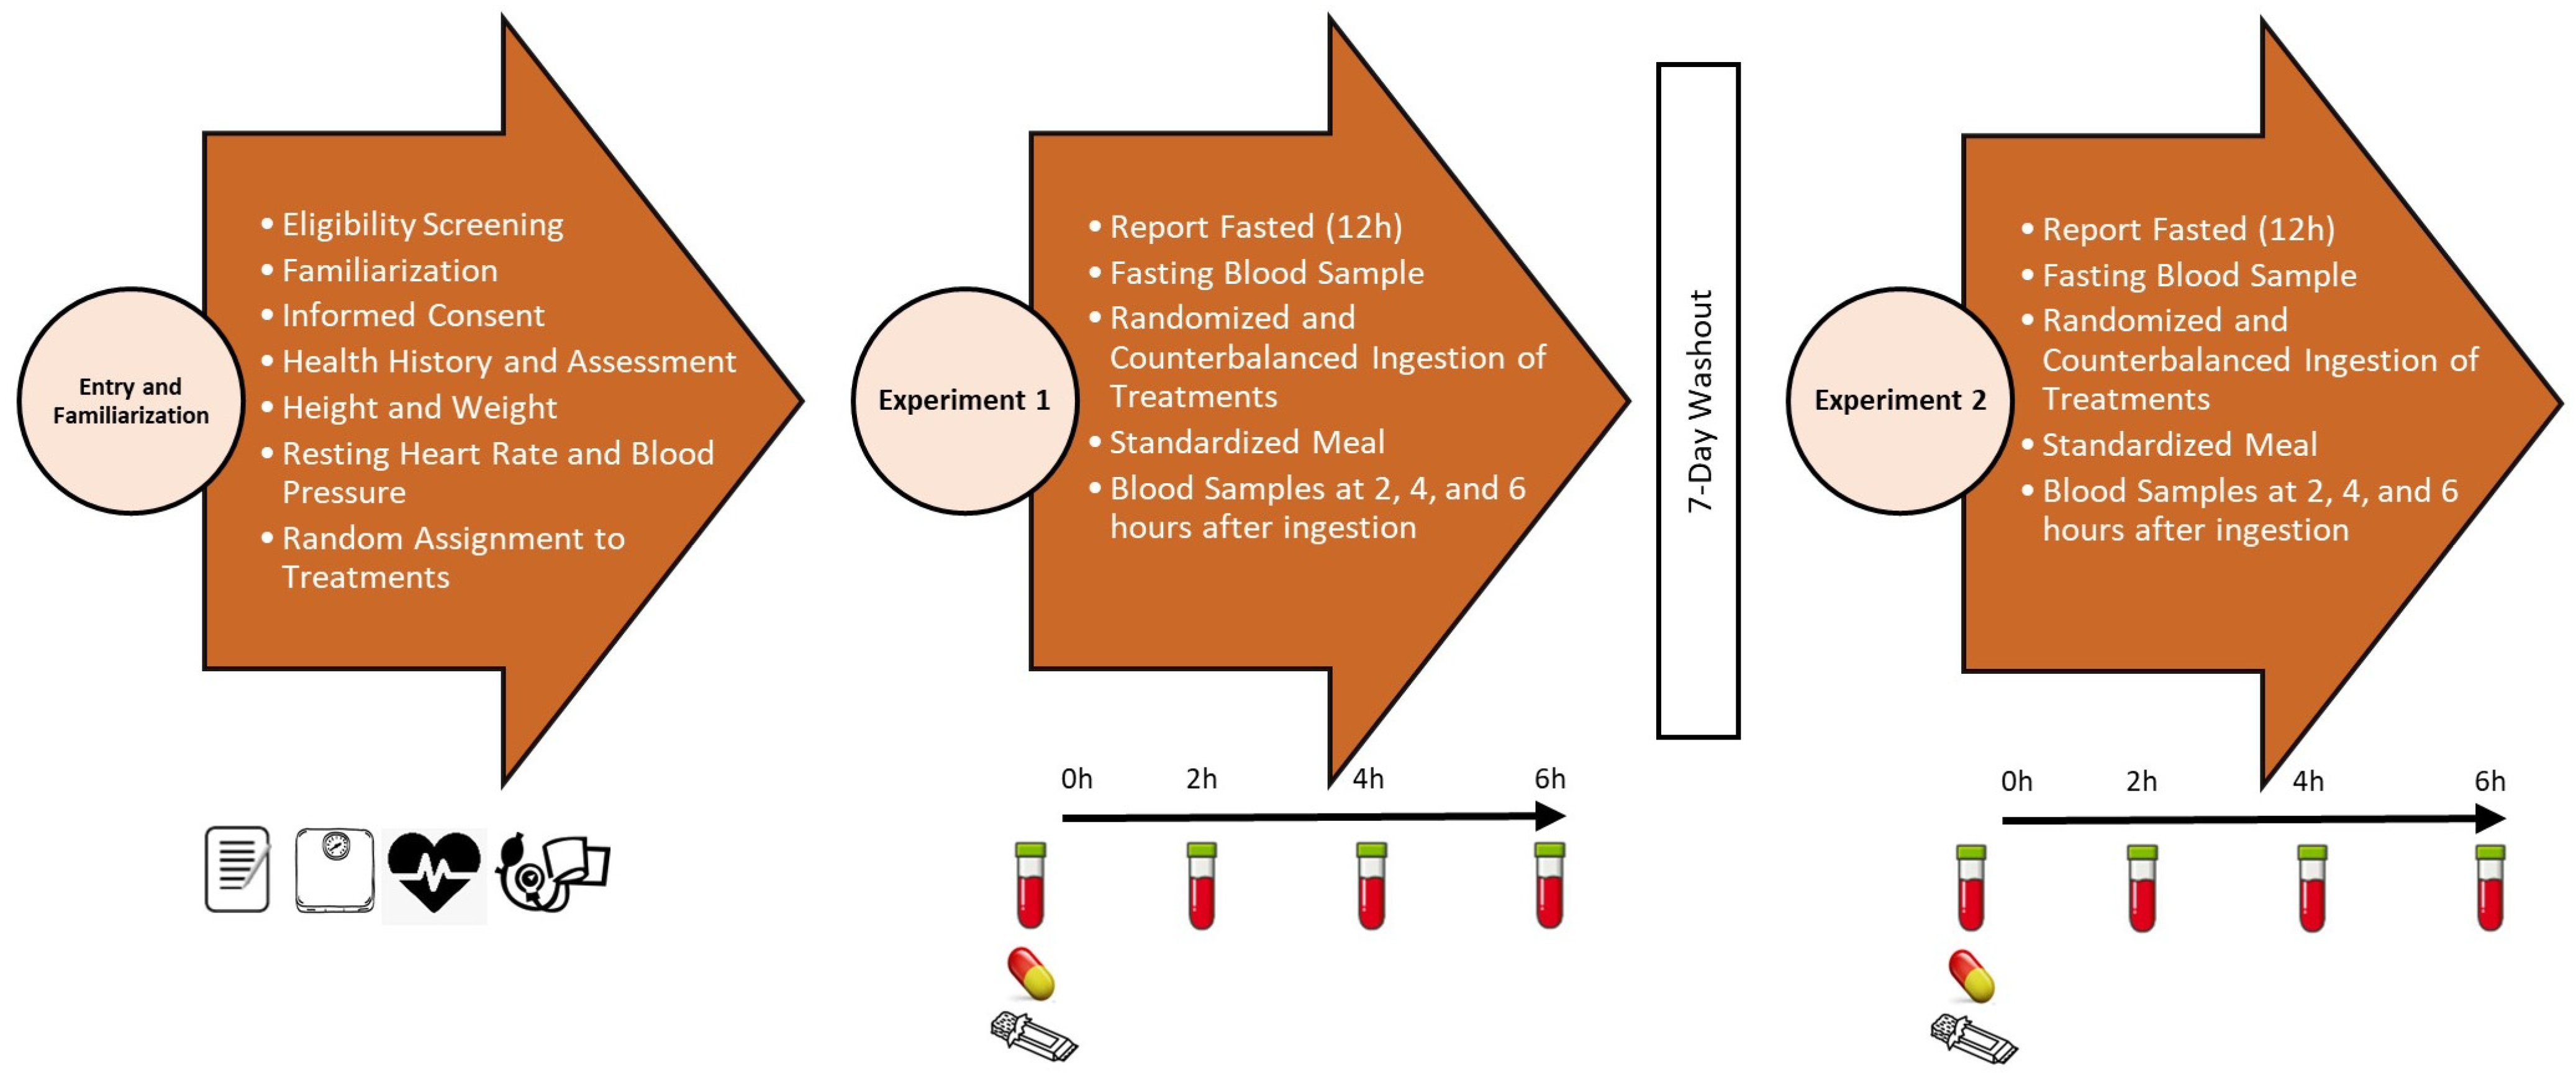
2.1. Experimental Design
2.2. Study Participants
2.3. Testing Protocol
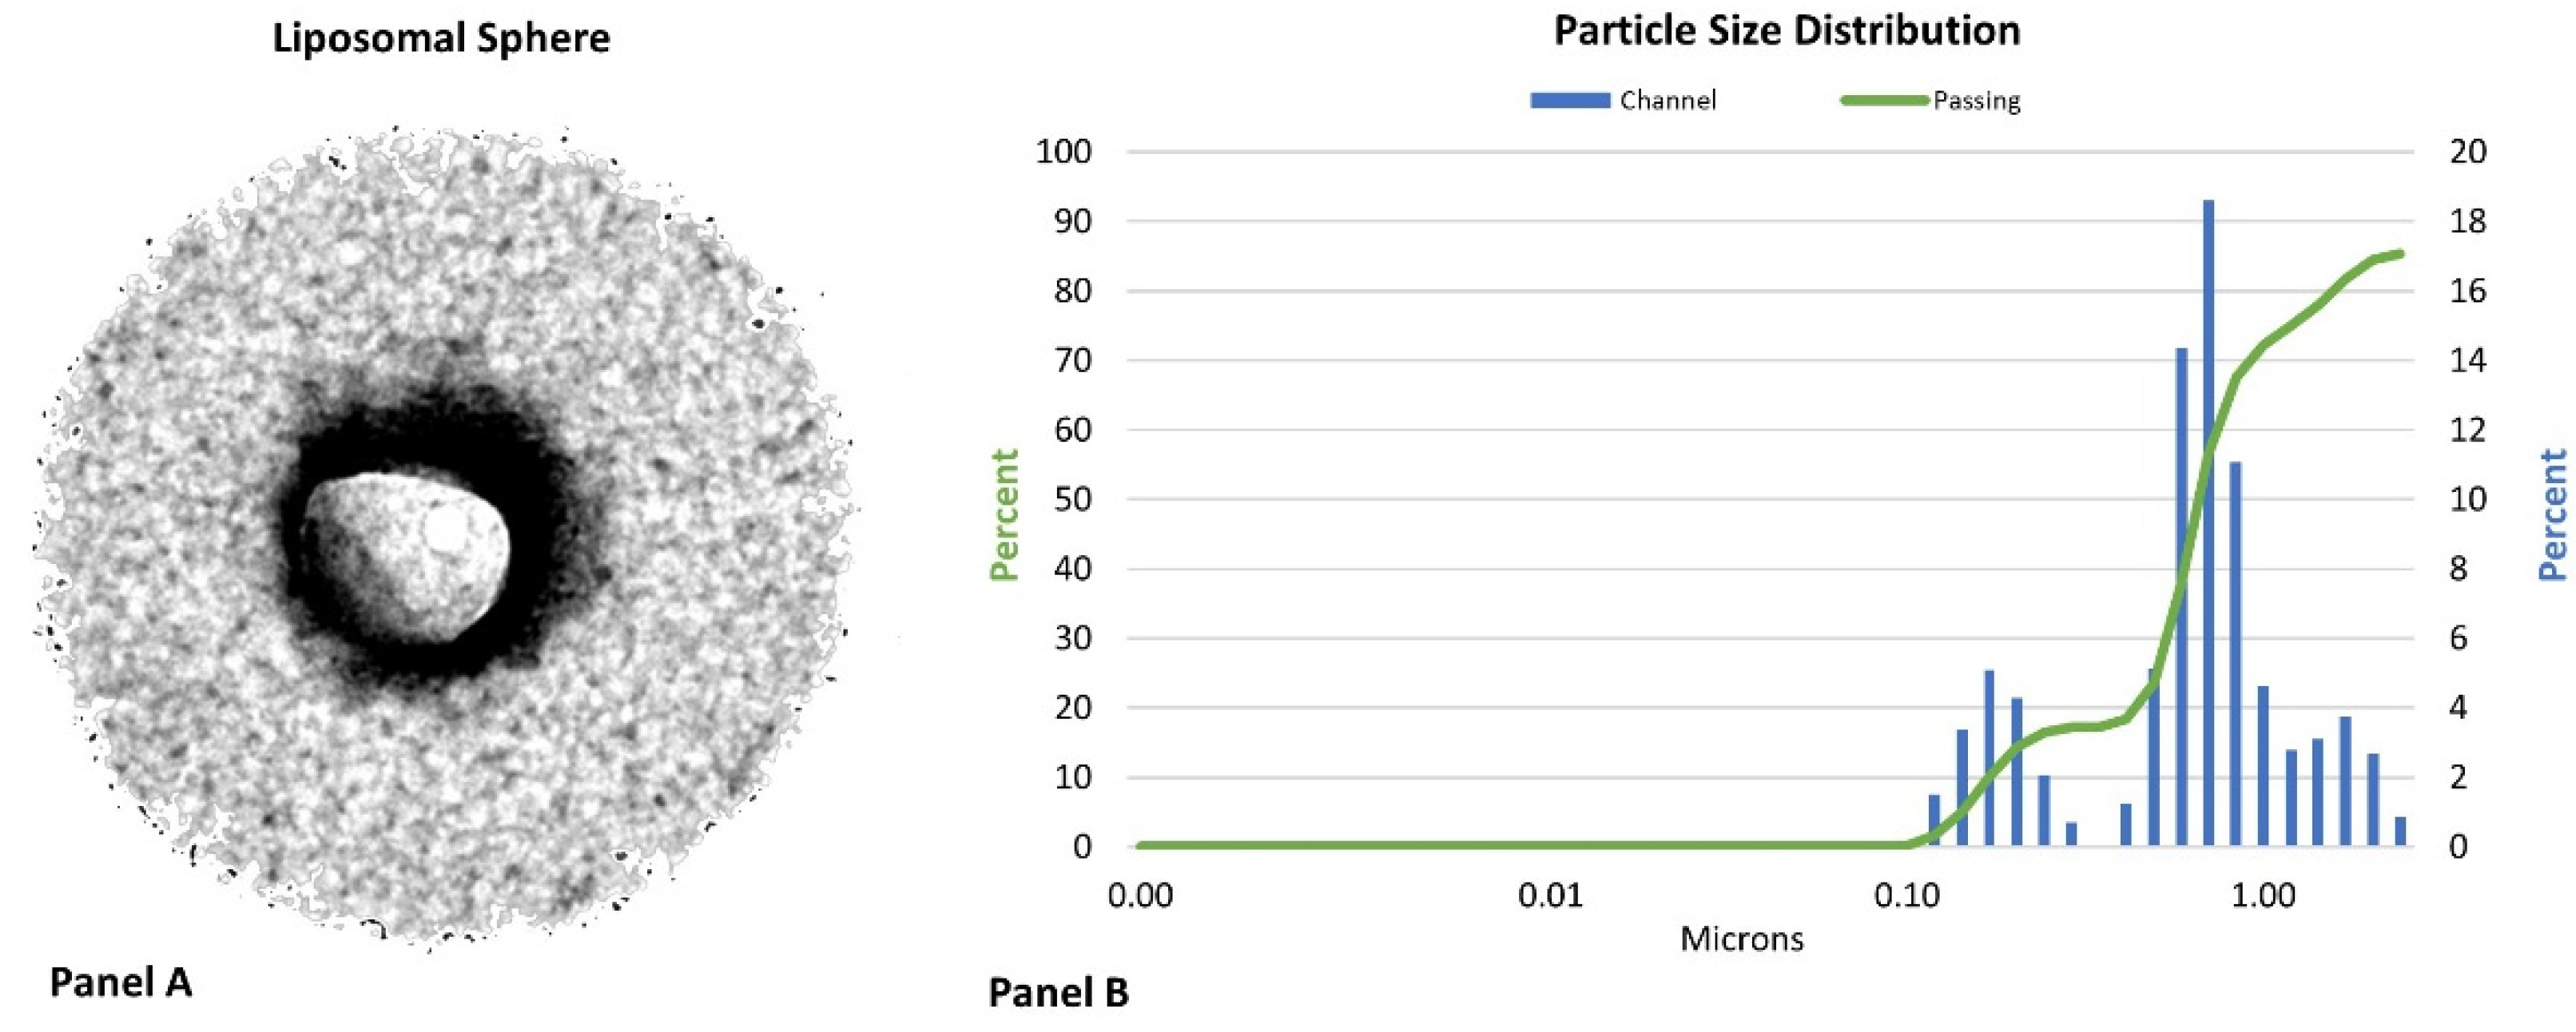
2.4. Liposomal Multivitamin Preparation
2.5. Supplementation Protocol
3. Procedures
3.1. Demographics
3.2. Blood Collection
3.3. Nutrient Assays
3.4. Pharmacokinetic Analysis
3.5. Statistical Analysis
4. Results
4.1. Demographic Data
4.2. Multivariate Analysis
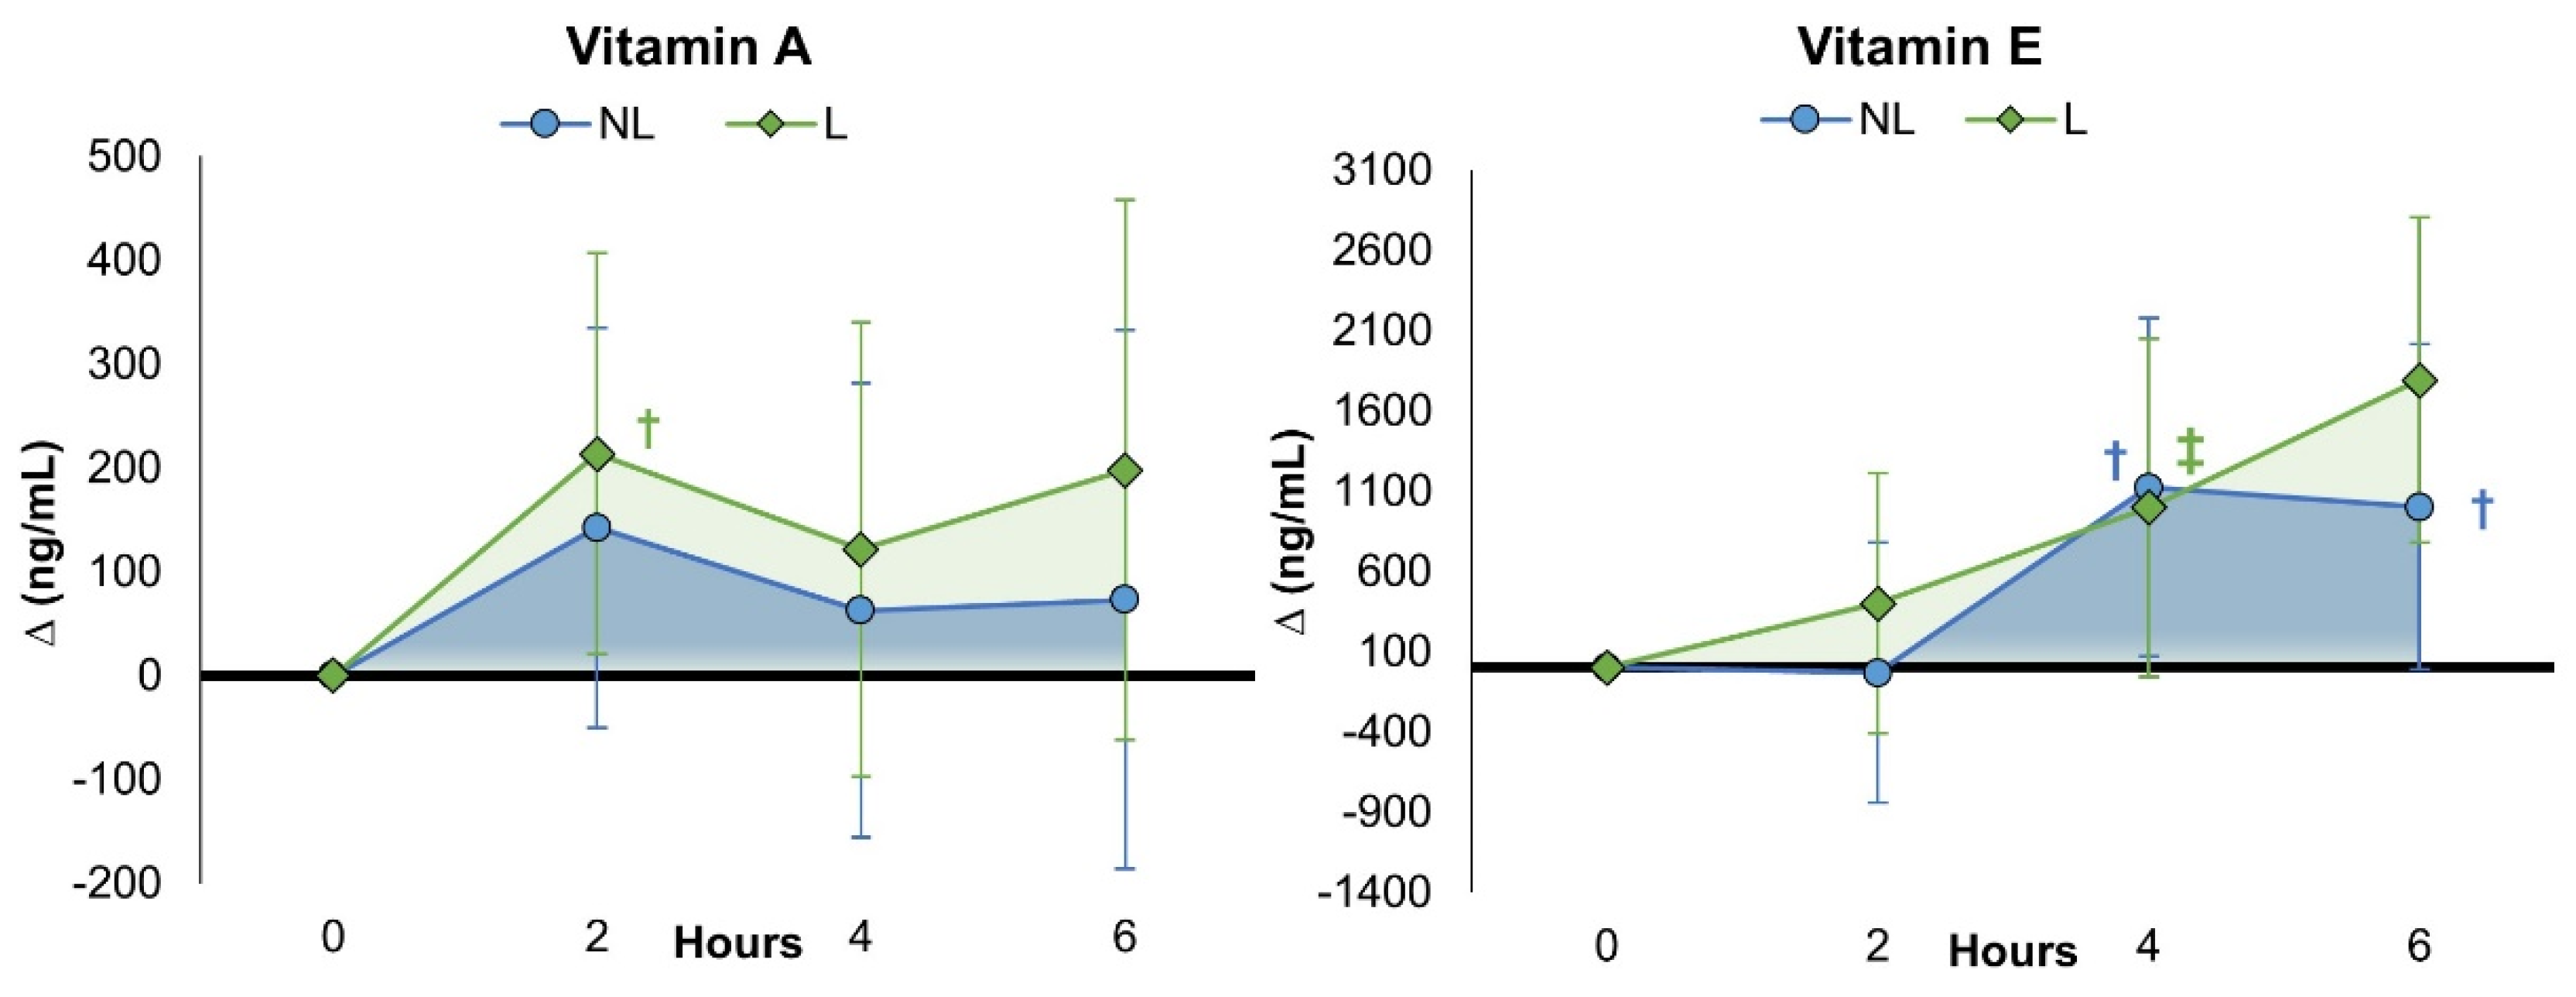
4.3. Fat-Soluble Vitamins
4.3.1. Vitamin A
4.3.2. Vitamin E
4.4. Water-Soluble Vitamins
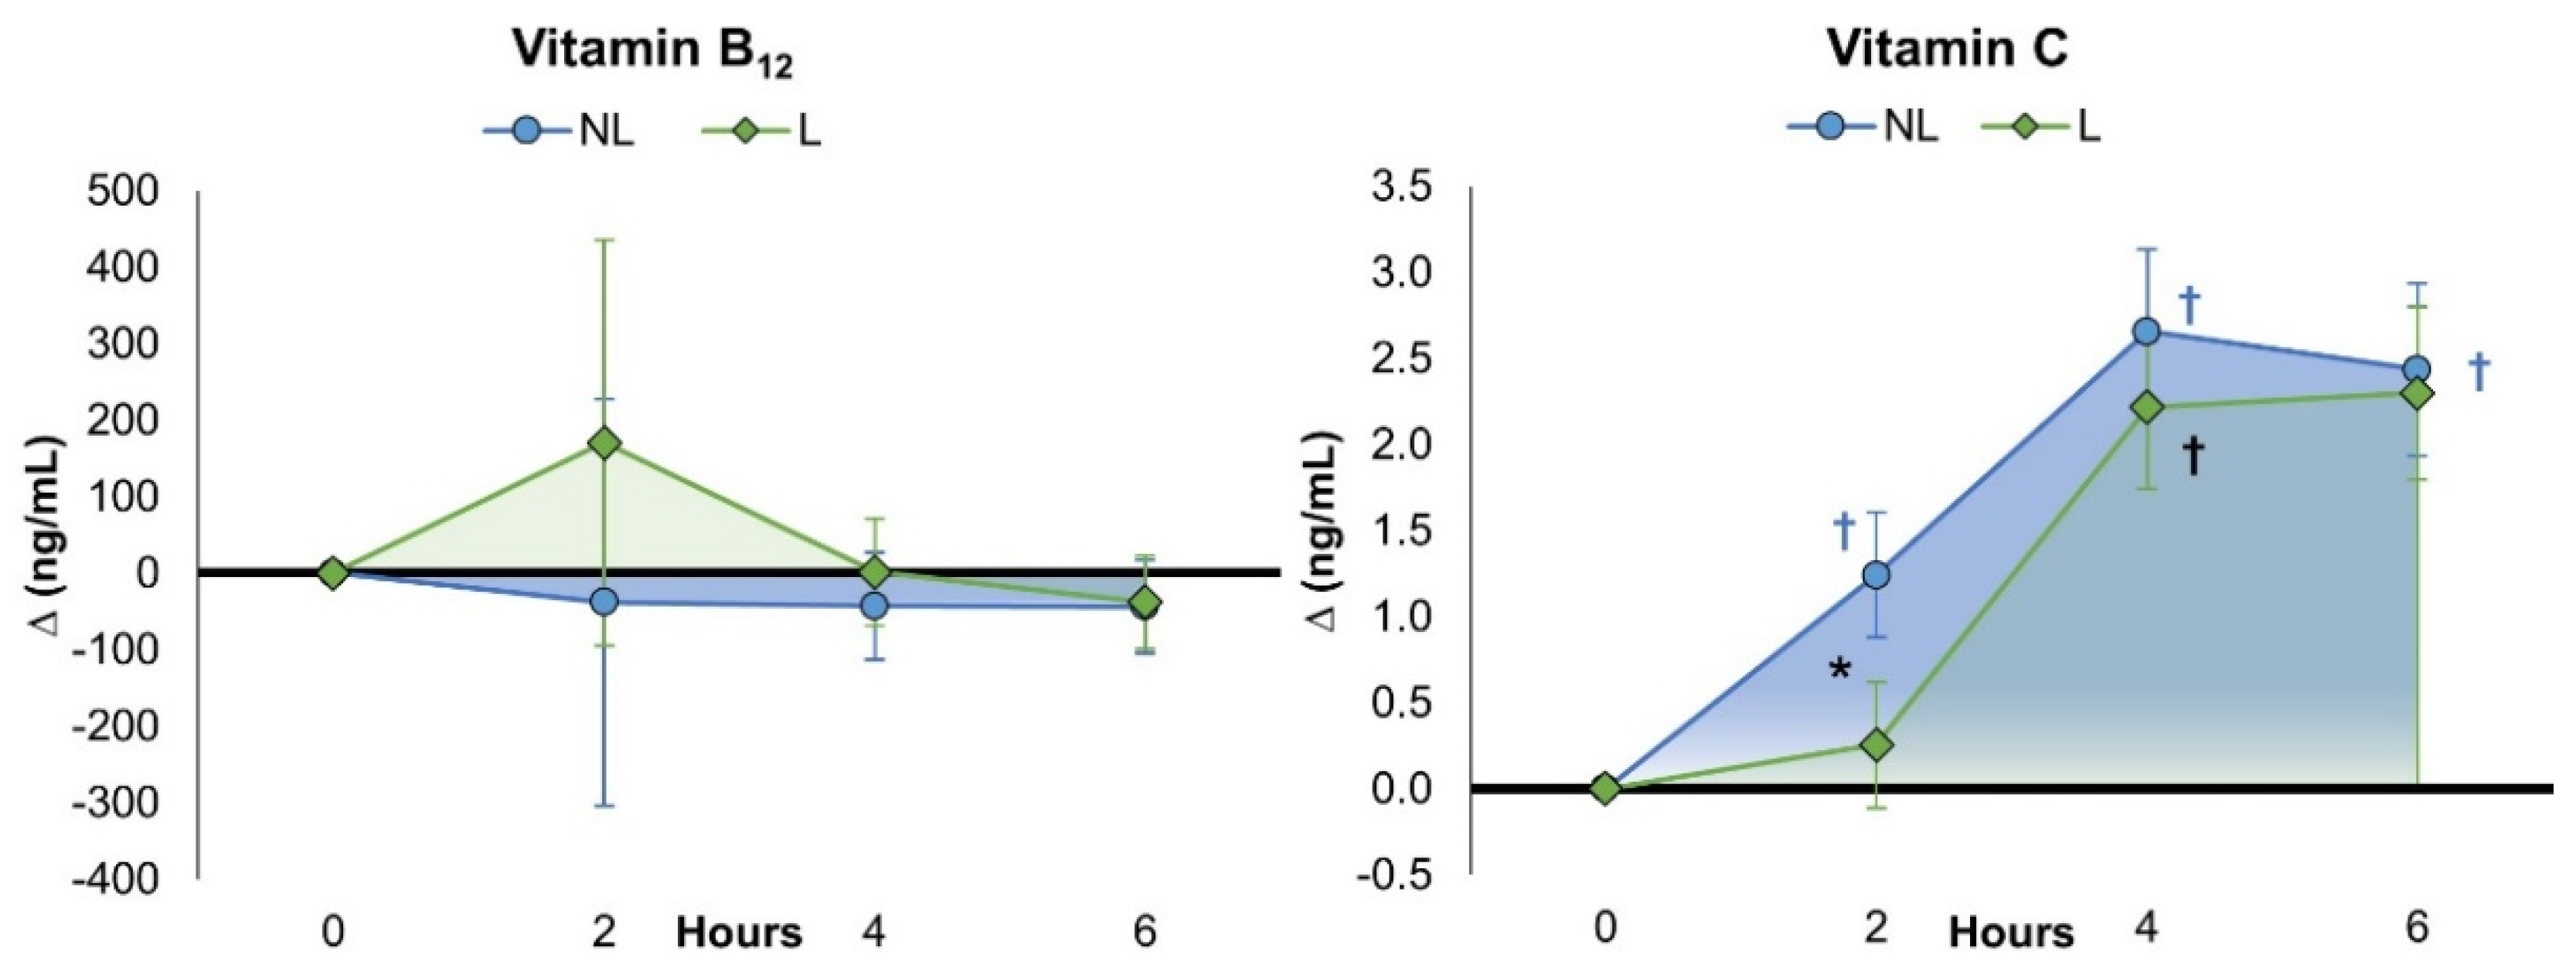
4.4.1. Vitamin B12
4.4.2. Vitamin C
4.5. Minerals
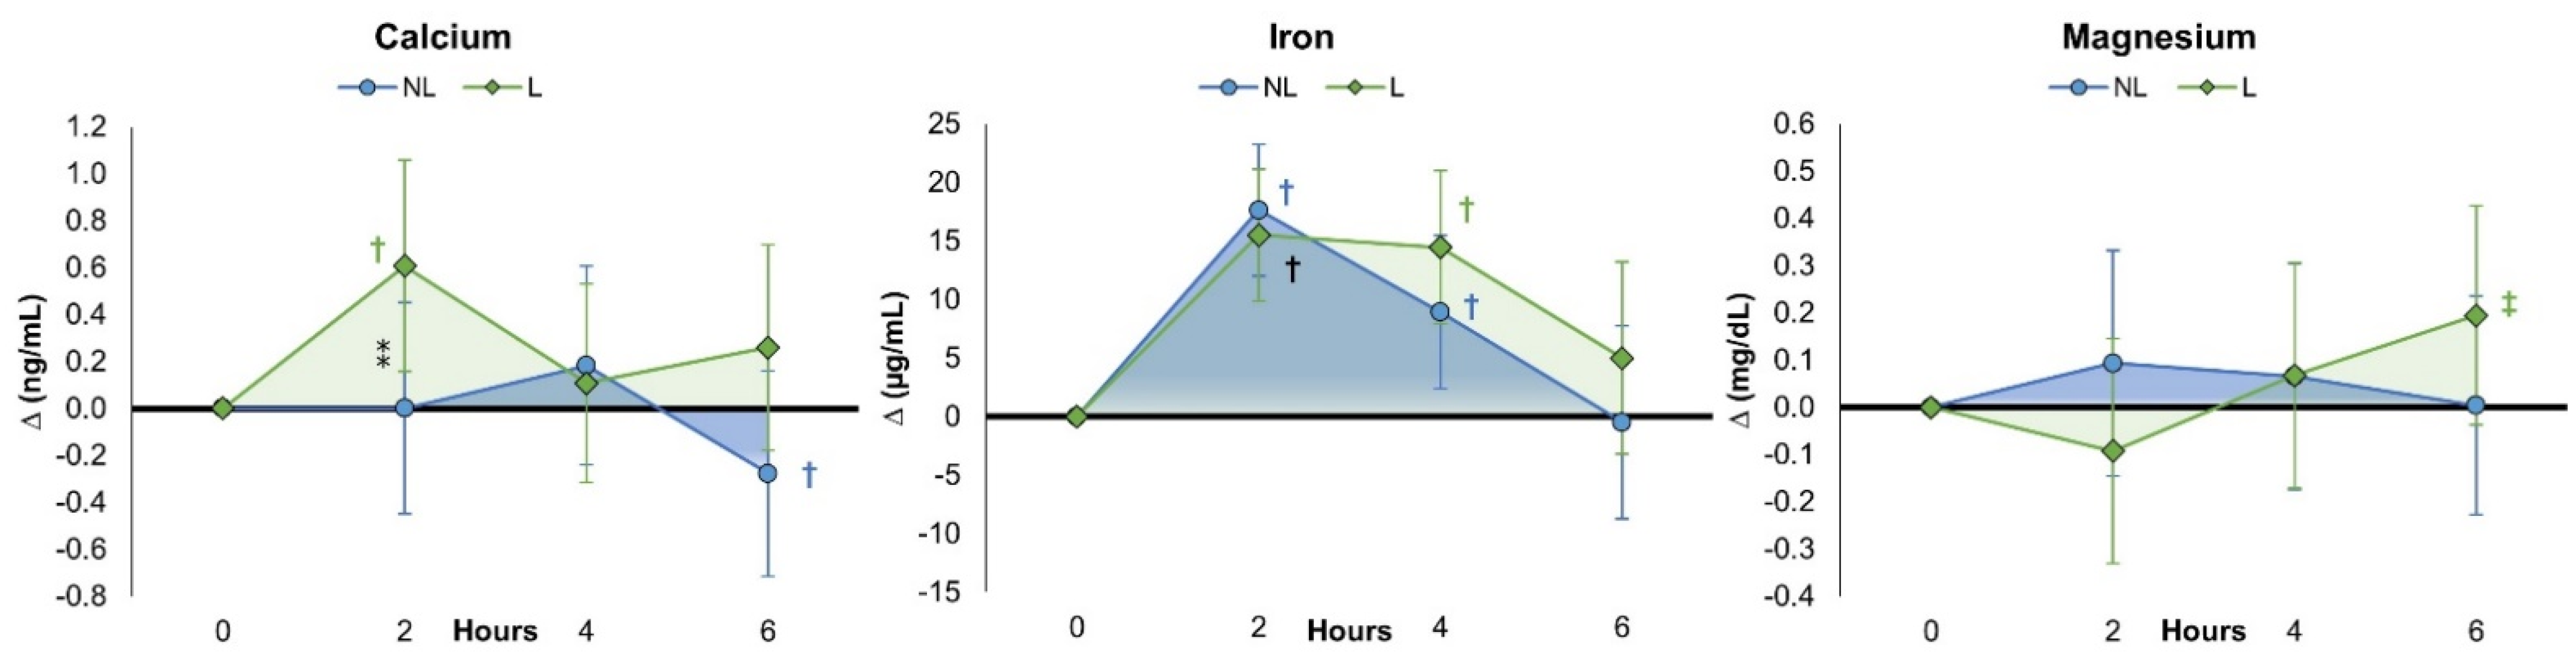
4.5.1. Calcium
4.5.2. Iron
4.5.3. Magnesium
4.6. Side Effects
5. Discussion
5.1. Vitamin and Mineral Blood Levels
5.2. Dose-Adjusted Pharmacokinetic Analysis
5.3. Limitations and Future Directions
6. Conclusions
Supplementary Materials
Author Contributions
Funding
Institutional Review Board Statement
Informed Consent Statement
Data Availability Statement
Acknowledgments
Conflicts of Interest
References
- Subramani, T.; Ganapathyswamy, H. An overview of liposomal nano-encapsulation techniques and its applications in food and nutraceutical. J. Food Sci. Technol. 2020, 57, 3545–3555. [Google Scholar] [CrossRef]
- Akbarzadeh, A.; Rezaei-Sadabady, R.; Davaran, S.; Joo, S.W.; Zarghami, N.; Hanifehpour, Y.; Samiei, M.; Kouhi, M.; Nejati-Koshki, K. Liposome: Classification, preparation, and applications. Nanoscale Res. Lett. 2013, 8, 102. [Google Scholar] [CrossRef]
- Al Asmari, A.K.; Ullah, Z.; Tariq, M.; Fatani, A. Preparation, characterization, and in vivo evaluation of intranasally administered liposomal formulation of donepezil. Drug Des. Dev. Ther. 2016, 10, 205–215. [Google Scholar] [CrossRef]
- Panahi, Y.; Farshbaf, M.; Mohammadhosseini, M.; Mirahadi, M.; Khalilov, R.; Saghfi, S.; Akbarzadeh, A. Recent advances on liposomal nanoparticles: Synthesis, characterization and biomedical applications. Artif. Cells Nanomed. Biotechnol. 2017, 45, 788–799. [Google Scholar] [CrossRef] [PubMed]
- Daraee, H.; Etemadi, A.; Kouhi, M.; Alimirzalu, S.; Akbarzadeh, A. Application of liposomes in medicine and drug delivery. Artif. Cells Nanomed. Biotechnol. 2016, 44, 381–391. [Google Scholar] [CrossRef]
- Lukawski, M.; Dalek, P.; Borowik, T.; Forys, A.; Langner, M.; Witkiewicz, W.; Przybylo, M. New oral liposomal vitamin C formulation: Properties and bioavailability. J. Liposome Res. 2020, 30, 227–234. [Google Scholar] [CrossRef]
- Davis, J.L.; Paris, H.L.; Beals, J.W.; Binns, S.E.; Giordano, G.R.; Scalzo, R.L.; Schweder, M.M.; Blair, E.; Bell, C. Liposomal-encapsulated Ascorbic Acid: Influence on Vitamin C Bioavailability and Capacity to Protect Against Ischemia-Reperfusion Injury. Nutr. Metab. Insights 2016, 9, 25–30. [Google Scholar] [CrossRef]
- Gopi, S.; Balakrishnan, P. Evaluation and clinical comparison studies on liposomal and non-liposomal ascorbic acid (vitamin C) and their enhanced bioavailability. J. Liposome Res. 2021, 31, 356–364. [Google Scholar] [CrossRef]
- Wen, C.J.; Chiang, C.F.; Lee, C.S.; Lin, Y.H.; Tsai, J.S. Double Nutri (Liposomal Encapsulation) Enhances Bioavailability of Vitamin C and Extends Its Half-Life in Plasma. J. Biomed. Nanotechnol. 2022, 18, 922–927. [Google Scholar] [CrossRef]
- Anderson, K.E.; Eliot, L.A.; Stevenson, B.R.; Rogers, J.A. Formulation and evaluation of a folic acid receptor-targeted oral vancomycin liposomal dosage form. Pharm. Res. 2001, 18, 316–322. [Google Scholar] [CrossRef] [PubMed]
- Ling, S.S.; Yuen, K.H.; Magosso, E.; Barker, S.A. Oral bioavailability enhancement of a hydrophilic drug delivered via folic acid-coupled liposomes in rats. J. Pharm. Pharmacol. 2009, 61, 445–449. [Google Scholar] [CrossRef] [PubMed]
- Jalali-Jivan, M.; Rostamabadi, H.; Assadpour, E.; Tomas, M.; Capanoglu, E.; Alizadeh-Sani, M.; Kharazmi, M.S.; Jafari, S.M. Recent progresses in the delivery of beta-carotene: From nano/microencapsulation to bioaccessibility. Adv. Colloid. Interface Sci. 2022, 307, 102750. [Google Scholar] [CrossRef] [PubMed]
- Rovoli, M.; Pappas, I.; Lalas, S.; Gortzi, O.; Kontopidis, G. In vitro and in vivo assessment of vitamin A encapsulation in a liposome-protein delivery system. J. Liposome Res. 2019, 29, 142–152. [Google Scholar] [CrossRef] [PubMed]
- Dalek, P.; Drabik, D.; Wolczanska, H.; Forys, A.; Jagas, M.; Jedruchniewicz, N.; Przybylo, M.; Witkiewicz, W.; Langner, M. Bioavailability by design—Vitamin D3 liposomal delivery vehicles. Nanomedicine 2022, 43, 102552. [Google Scholar] [CrossRef] [PubMed]
- Nowak, J.K.; Sobkowiak, P.; Drzymala-Czyz, S.; Krzyzanowska-Jankowska, P.; Sapiejka, E.; Skorupa, W.; Pogorzelski, A.; Nowicka, A.; Wojsyk-Banaszak, I.; Kurek, S.; et al. Fat-Soluble Vitamin Supplementation Using Liposomes, Cyclodextrins, or Medium-Chain Triglycerides in Cystic Fibrosis: A Randomized Controlled Trial. Nutrients 2021, 13, 4554. [Google Scholar] [CrossRef] [PubMed]
- Cheng, C.Y.; Barro, L.; Tsai, S.T.; Feng, T.W.; Wu, X.Y.; Chao, C.W.; Yu, R.S.; Chin, T.Y.; Hsieh, M.F. Epigallocatechin-3-Gallate-Loaded Liposomes Favor Anti-Inflammation of Microglia Cells and Promote Neuroprotection. Int. J. Mol. Sci. 2021, 22, 3037. [Google Scholar] [CrossRef] [PubMed]
- Kala, S.G.; Chinni, S. Bioavailability enhancement of vitamin E TPGS liposomes of nintedanib esylate: Formulation optimization, cytotoxicity and pharmacokinetic studies. Drug Deliv. Transl. Res. 2022, 12, 2856–2864. [Google Scholar] [CrossRef]
- Joseph, A.; Kumar, D.; Balakrishnan, A.; Shanmughan, P.; Maliakel, B.; Im, K. Surface-engineered liposomal particles of calcium ascorbate with fenugreek galactomannan enhanced the oral bioavailability of ascorbic acid: A randomized, double-blinded, 3-sequence, crossover study. RSC Adv. 2021, 11, 38161–38171. [Google Scholar] [CrossRef]
- Ahmad, A.; Vaghasiya, K.; Kumar, A.; Alam, P.; Raza, S.S.; Verma, R.K.; Khan, R. Enema based therapy using liposomal formulation of low molecular weight heparin for treatment of active ulcerative colitis: New adjunct therapeutic opportunity. Mater. Sci. Eng. C Mater. Biol. Appl. 2021, 121, 111851. [Google Scholar] [CrossRef]
- Tinsley, G.M.; Harty, P.S.; Stratton, M.T.; Siedler, M.R.; Rodriguez, C. Liposomal Mineral Absorption: A Randomized Crossover Trial. Nutrients 2022, 14, 3321. [Google Scholar] [CrossRef]
- Shariare, M.H.; Pinky, N.J.K.; Abedin, J.; Kazi, M.; Aldughaim, M.S.; Uddin, M.N. Liposomal Drug Delivery of Blumea lacera Leaf Extract: In-Vivo Hepatoprotective Effects. Nanomaterials 2022, 12, 2262. [Google Scholar] [CrossRef] [PubMed]
- Zhang, J.; Li, X.; Huang, L. Anticancer activities of phytoconstituents and their liposomal targeting strategies against tumor cells and the microenvironment. Adv. Drug Deliv. Rev. 2020, 154–155, 245–273. [Google Scholar] [CrossRef]
- Dutta, S.; Moses, J.A.; Anandharamakrishnan, C. Encapsulation of Nutraceutical Ingredients in Liposomes and Their Potential for Cancer Treatment. Nutr. Cancer 2018, 70, 1184–1198. [Google Scholar] [CrossRef]
- AlSawaftah, N.; Pitt, W.G.; Husseini, G.A. Dual-Targeting and Stimuli-Triggered Liposomal Drug Delivery in Cancer Treatment. ACS Pharmacol. Transl. Sci. 2021, 4, 1028–1049. [Google Scholar] [CrossRef] [PubMed]
- Force, U.S.P.S.T.; Mangione, C.M.; Barry, M.J.; Nicholson, W.K.; Cabana, M.; Chelmow, D.; Coker, T.R.; Davis, E.M.; Donahue, K.E.; Doubeni, C.A.; et al. Vitamin, Mineral, and Multivitamin Supplementation to Prevent Cardiovascular Disease and Cancer: US Preventive Services Task Force Recommendation Statement. JAMA 2022, 327, 2326–2333. [Google Scholar] [CrossRef]
- National Institutes of Health Office of Dietary Supplements Office of Dietary Supplements—Multivitamin/Mineral Supplements. Available online: https://ods.od.nih.gov/factsheets/MVMS-Consumer/ (accessed on 14 March 2023).
- Blumberg, J.B.; Cena, H.; Barr, S.I.; Biesalski, H.K.; Dagach, R.U.; Delaney, B.; Frei, B.; Moreno Gonzalez, M.I.; Hwalla, N.; Lategan-Potgieter, R.; et al. The Use of Multivitamin/Multimineral Supplements: A Modified Delphi Consensus Panel Report. Clin. Ther. 2018, 40, 640–657. [Google Scholar] [CrossRef]
- Kerksick, C.M.; Wilborn, C.D.; Roberts, M.D.; Smith-Ryan, A.; Kleiner, S.M.; Jager, R.; Collins, R.; Cooke, M.; Davis, J.N.; Galvan, E.; et al. ISSN exercise & sports nutrition review update: Research & recommendations. J. Int. Soc. Sports Nutr. 2018, 15, 38. [Google Scholar] [CrossRef]
- Raphael, M.P.; Sheehan, P.E.; Vora, G.J. A controlled trial for reproducibility. Nature 2020, 579, 190–192. [Google Scholar] [CrossRef]
- Zwaan, R.A.; Etz, A.; Lucas, R.E.; Donnellan, M.B. Making replication mainstream. Behav. Brain Sci. 2017, 41, e120. [Google Scholar] [CrossRef]
- FTC. Issues New Guidance on Health-Related Claims to Replace the Dietary Supplements Advertising Guide. In Covington Alert; FTC: Washington, DC, USA, 2023. [Google Scholar]
- Lattin, J.R.; Belnap, D.M.; Pitt, W.G. Formation of eLiposomes as a drug delivery vehicle. Colloids Surf. B Biointerfaces 2012, 89, 93–100. [Google Scholar] [CrossRef]
- Kim, B.; Stein, H. A spreadsheet program for making a balanced Latin Square design. Rev. Colomb. de Cienc. Pecu. 2009, 22, 591–596. [Google Scholar]
- Ferguson, B. ACSM’s Guidelines for Exercise Testing and Prescription 9th Ed. 2014. J. Can. Chiropr. Assoc. 2014, 58, 328. [Google Scholar]
- Bowling, J.L.; Katayev, A. An evaluation of the Roche Cobas c 111. Lab. Med. 2010, 41, 398–402. [Google Scholar] [CrossRef]
- Jenkins, D.J.; Wolever, T.M.; Taylor, R.H.; Barker, H.; Fielden, H.; Baldwin, J.M.; Bowling, A.C.; Newman, H.C.; Jenkins, A.L.; Goff, D.V. Glycemic index of foods: A physiological basis for carbohydrate exchange. Am. J. Clin. Nutr. 1981, 34, 362–366. [Google Scholar] [CrossRef] [PubMed]
- Bush, V.J.; Janu, M.R.; Bathur, F.; Wells, A.; Dasgupta, A. Comparison of BD Vacutainer SST Plus Tubes with BD SST II Plus Tubes for common analytes. Clin. Chim. Acta 2001, 306, 139–143. [Google Scholar] [CrossRef] [PubMed]
- Khan, A.; Khan, M.I.; Iqbal, Z.; Shah, Y.; Ahmad, L.; Watson, D.G. An optimized and validated RP-HPLC/UV detection method for simultaneous determination of all-trans-retinol (vitamin A) and alpha-tocopherol (vitamin E) in human serum: Comparison of different particulate reversed-phase HPLC columns. J. Chromatography. B Anal. Technol. Biomed. Life Sci. 2010, 878, 2339–2347. [Google Scholar] [CrossRef]
- Karlsen, A.; Blomhoff, R.; Gundersen, T.E. High-throughput analysis of vitamin C in human plasma with the use of HPLC with monolithic column and UV-detection. J. Chromatography. B Anal. Technol. Biomed. Life Sci. 2005, 824, 132–138. [Google Scholar] [CrossRef] [PubMed]
- Wagner, C.L.; Shary, J.R.; Nietert, P.J.; Wahlquist, A.E.; Ebeling, M.D.; Hollis, B.W. Bioequivalence Studies of Vitamin D Gummies and Tablets in Healthy Adults: Results of a Cross-Over Study. Nutrients 2019, 11, 1023. [Google Scholar] [CrossRef] [PubMed]
- Thayer, M.T.; Nelssen, J.L.; Langemeier, A.J.; Morton, J.M.; Gonzalez, J.M.; Kruger, S.R.; Ou, Z.; Makowski, A.J.; Bergstrom, J.R. The effects of maternal dietary supplementation of cholecalciferol (vitamin D(3)) and 25(OH)D(3) on sow and progeny performance. Transl. Anim. Sci. 2019, 3, 692–708. [Google Scholar] [CrossRef]
- Zayed, A.; Bustami, R.; Alabsi, W.; El-Elimat, T. Development and Validation of a Rapid High-Performance Liquid Chromatography⁻Tandem Mass Spectrometric Method for Determination of Folic Acid in Human Plasma. Pharmaceuticals 2018, 11, 52. [Google Scholar] [CrossRef]
- Frick, L.D.R. LC/MS/MS Quantitative Analysis of Water Soluble Vitamins in Blood. In Proceedings of the Mass Spectrometry: Applications to the Clinical Lab, San Diego, CA, USA, March 28 2015. [Google Scholar]
- Page, P. Beyond statistical significance: Clinical interpretation of rehabilitation research literature. Int. J. Sports Phys. Ther. 2014, 9, 726–736. [Google Scholar]
- Cohen, J. Statistical Power Analysis for the Social Sciences, 2nd ed.; Lawrence Erlbaum Associates: Hillsdale, NJ, USA, 1988. [Google Scholar]
- Mansoor, A.; Mahabadi, N. Volume of Distribution. In StatPearls; StatPearls Publishing LLC: Treasure Island, FL, USA, 2022. [Google Scholar]
- Jager, R.; Purpura, M.; Shao, A.; Inoue, T.; Kreider, R.B. Analysis of the efficacy, safety, and regulatory status of novel forms of creatine. Amino Acids 2011, 40, 1369–1383. [Google Scholar] [CrossRef] [PubMed]
- Kreider, R.B.; Jager, R.; Purpura, M. Bioavailability, Efficacy, Safety, and Regulatory Status of Creatine and Related Compounds: A Critical Review. Nutrients 2022, 14, 1035. [Google Scholar] [CrossRef] [PubMed]
- Agrawal, A.K.; Harde, H.; Thanki, K.; Jain, S. Improved stability and antidiabetic potential of insulin containing folic acid functionalized polymer stabilized multilayered liposomes following oral administration. Biomacromolecules 2014, 15, 350–360. [Google Scholar] [CrossRef] [PubMed]
- Jampilek, J.; Kralova, K. Potential of Nanonutraceuticals in Increasing Immunity. Nanomaterials 2020, 10, 2224. [Google Scholar] [CrossRef]
- Zimmermann, M.B. The potential of encapsulated iron compounds in food fortification: A review. Int. J. Vitam. Nutr. Res. 2004, 74, 453–461. [Google Scholar] [CrossRef] [PubMed]


| Vitamin/Mineral | Unit | Non-Liposomal | Liposomal | |
|---|---|---|---|---|
| Vitamins | Vitamin A (Beta Carotene) | Mcg | 950 | 1098 |
| Vitamin D3 | Mcg | 22.24 | 23.90 | |
| Vitamin E (d alpha tocopherol) | Mg | 16.38 | 16.30 | |
| Vitamin K1 | Mcg | 129.00 | 74.50 | |
| Vitamin B1-Thiamine | Mg | 0.99 | 0.91 | |
| Vitamin B2-Riboflavin | Mg | 0.93 | 1.10 | |
| Vitamin B6-Pyridoxine | Mg | 0.97 | 0.57 | |
| Vitamin B3-Niacin | Mg | 18.08 | 17.14 | |
| Vitamin B5-Pantothenic Acid | Mg | 6.37 | 5.08 | |
| Vitamin B7-Biotin | Mcg | 56.78 | 33.00 | |
| Vitamin B9-Folate (5-MTHF) | Mcg | 320.60 | 326.48 | |
| Vitamin B12 (Methyl cobalamin) | Mcg | 1258 | 1210 | |
| Vitamin C (Ascorbic Acid) | Mg | 108.40 | 112.70 | |
| Minerals | Calcium | % | 0.00 | 0.00 |
| Chromium (Glycinate) | Mcg | 54.72 | 58.00 | |
| Iodine (Potassium Iodine) | Mcg | 171.88 | 244.00 | |
| Iron (Glycinate) | Mg | 10.10 | 9.38 | |
| Magnesium (Glycinate) | Mg | 23.26 | 22.00 | |
| Manganese (Citrate) | Mg | 2.56 | 2.59 | |
| Molybdenum (Glycinate) | Mcg | 54.06 | 53.60 | |
| Selenium | Mcg | 54.70 | 51.80 | |
| Zinc | Mg | 12.82 | 15.00 | |
| Other | CoQ10 | Mg | 4.30 | 3.78 |
| Choline (from Bitartrate) | Mg | 57.60 | 44.82 | |
| Inositol | Mg | 19.24 | 22.32 | |
| Lutein | Mg | 1.28 | 1.26 | |
| Para-Aminobenzoic Acid (PABA) | Mg | 4.30 | 4.07 |
Disclaimer/Publisher’s Note: The statements, opinions and data contained in all publications are solely those of the individual author(s) and contributor(s) and not of MDPI and/or the editor(s). MDPI and/or the editor(s) disclaim responsibility for any injury to people or property resulting from any ideas, methods, instructions or products referred to in the content. |
© 2023 by the authors. Licensee MDPI, Basel, Switzerland. This article is an open access article distributed under the terms and conditions of the Creative Commons Attribution (CC BY) license (https://creativecommons.org/licenses/by/4.0/).
Share and Cite
Ko, J.; Yoo, C.; Xing, D.; Gonzalez, D.E.; Jenkins, V.; Dickerson, B.; Leonard, M.; Nottingham, K.; Kendra, J.; Sowinski, R.; et al. Pharmacokinetic Analyses of Liposomal and Non-Liposomal Multivitamin/Mineral Formulations. Nutrients 2023, 15, 3073. https://doi.org/10.3390/nu15133073
Ko J, Yoo C, Xing D, Gonzalez DE, Jenkins V, Dickerson B, Leonard M, Nottingham K, Kendra J, Sowinski R, et al. Pharmacokinetic Analyses of Liposomal and Non-Liposomal Multivitamin/Mineral Formulations. Nutrients. 2023; 15(13):3073. https://doi.org/10.3390/nu15133073
Chicago/Turabian StyleKo, Joungbo, Choongsung Yoo, Dante Xing, Drew E. Gonzalez, Victoria Jenkins, Broderick Dickerson, Megan Leonard, Kay Nottingham, Jacob Kendra, Ryan Sowinski, and et al. 2023. "Pharmacokinetic Analyses of Liposomal and Non-Liposomal Multivitamin/Mineral Formulations" Nutrients 15, no. 13: 3073. https://doi.org/10.3390/nu15133073
APA StyleKo, J., Yoo, C., Xing, D., Gonzalez, D. E., Jenkins, V., Dickerson, B., Leonard, M., Nottingham, K., Kendra, J., Sowinski, R., Rasmussen, C. J., & Kreider, R. B. (2023). Pharmacokinetic Analyses of Liposomal and Non-Liposomal Multivitamin/Mineral Formulations. Nutrients, 15(13), 3073. https://doi.org/10.3390/nu15133073