
A Pilot Study on the Efficacy of a Diabetic Diet Containing the Rare Sugar D-Allulose in Patients with Type 2 Diabetes Mellitus: A Prospective, Randomized, Single-Blind, Crossover Study

 ,
,
Abstract
1. Introduction
2. Methods
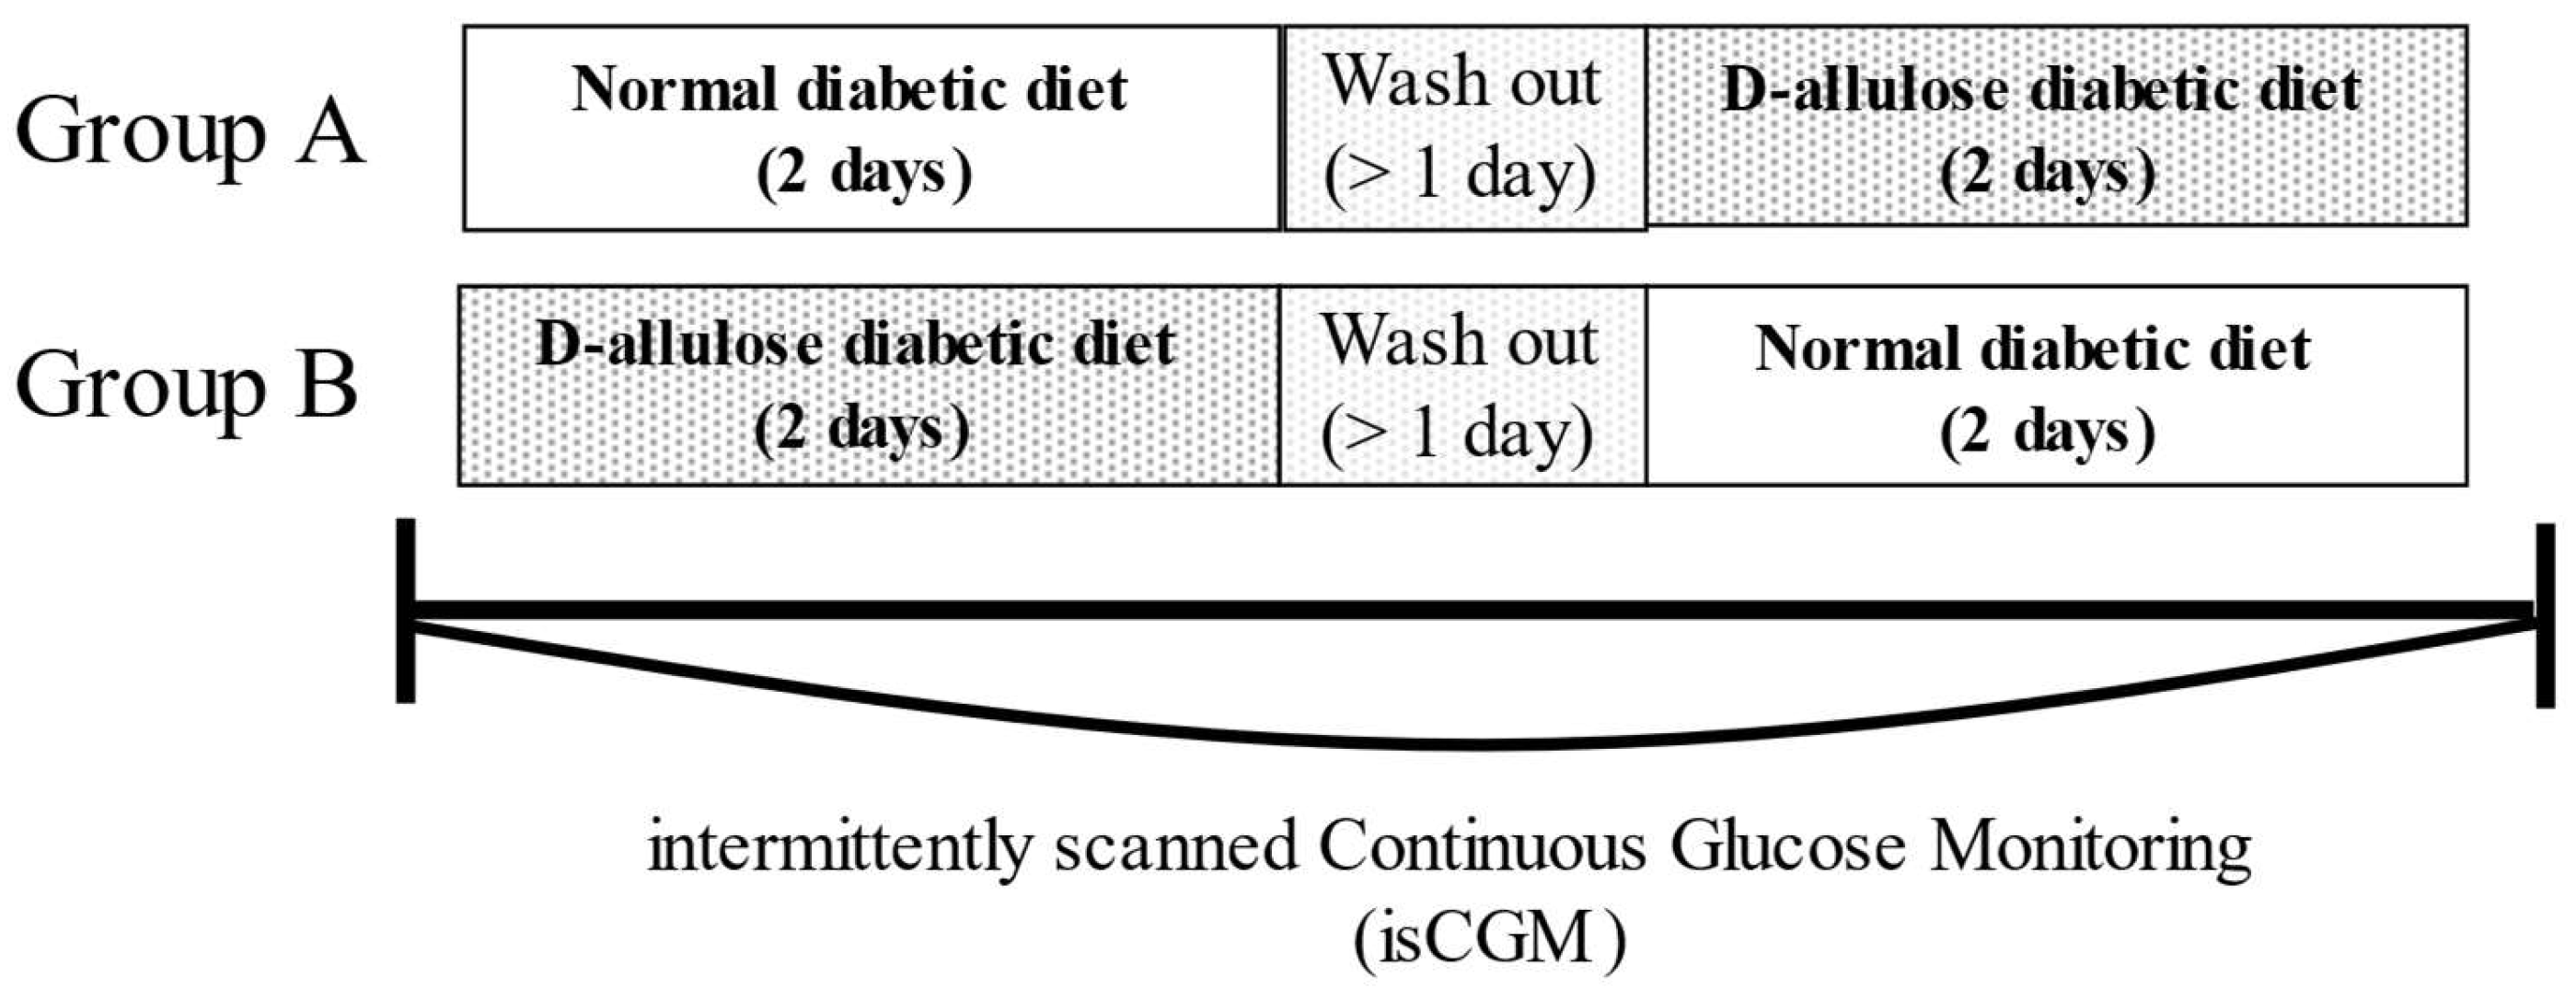
2.1. Study Design
2.2. Participants
2.3. Study Food
2.4. Glycemic Measures
2.5. Outcome Measures
2.6. Statistical Analysis
3. Results
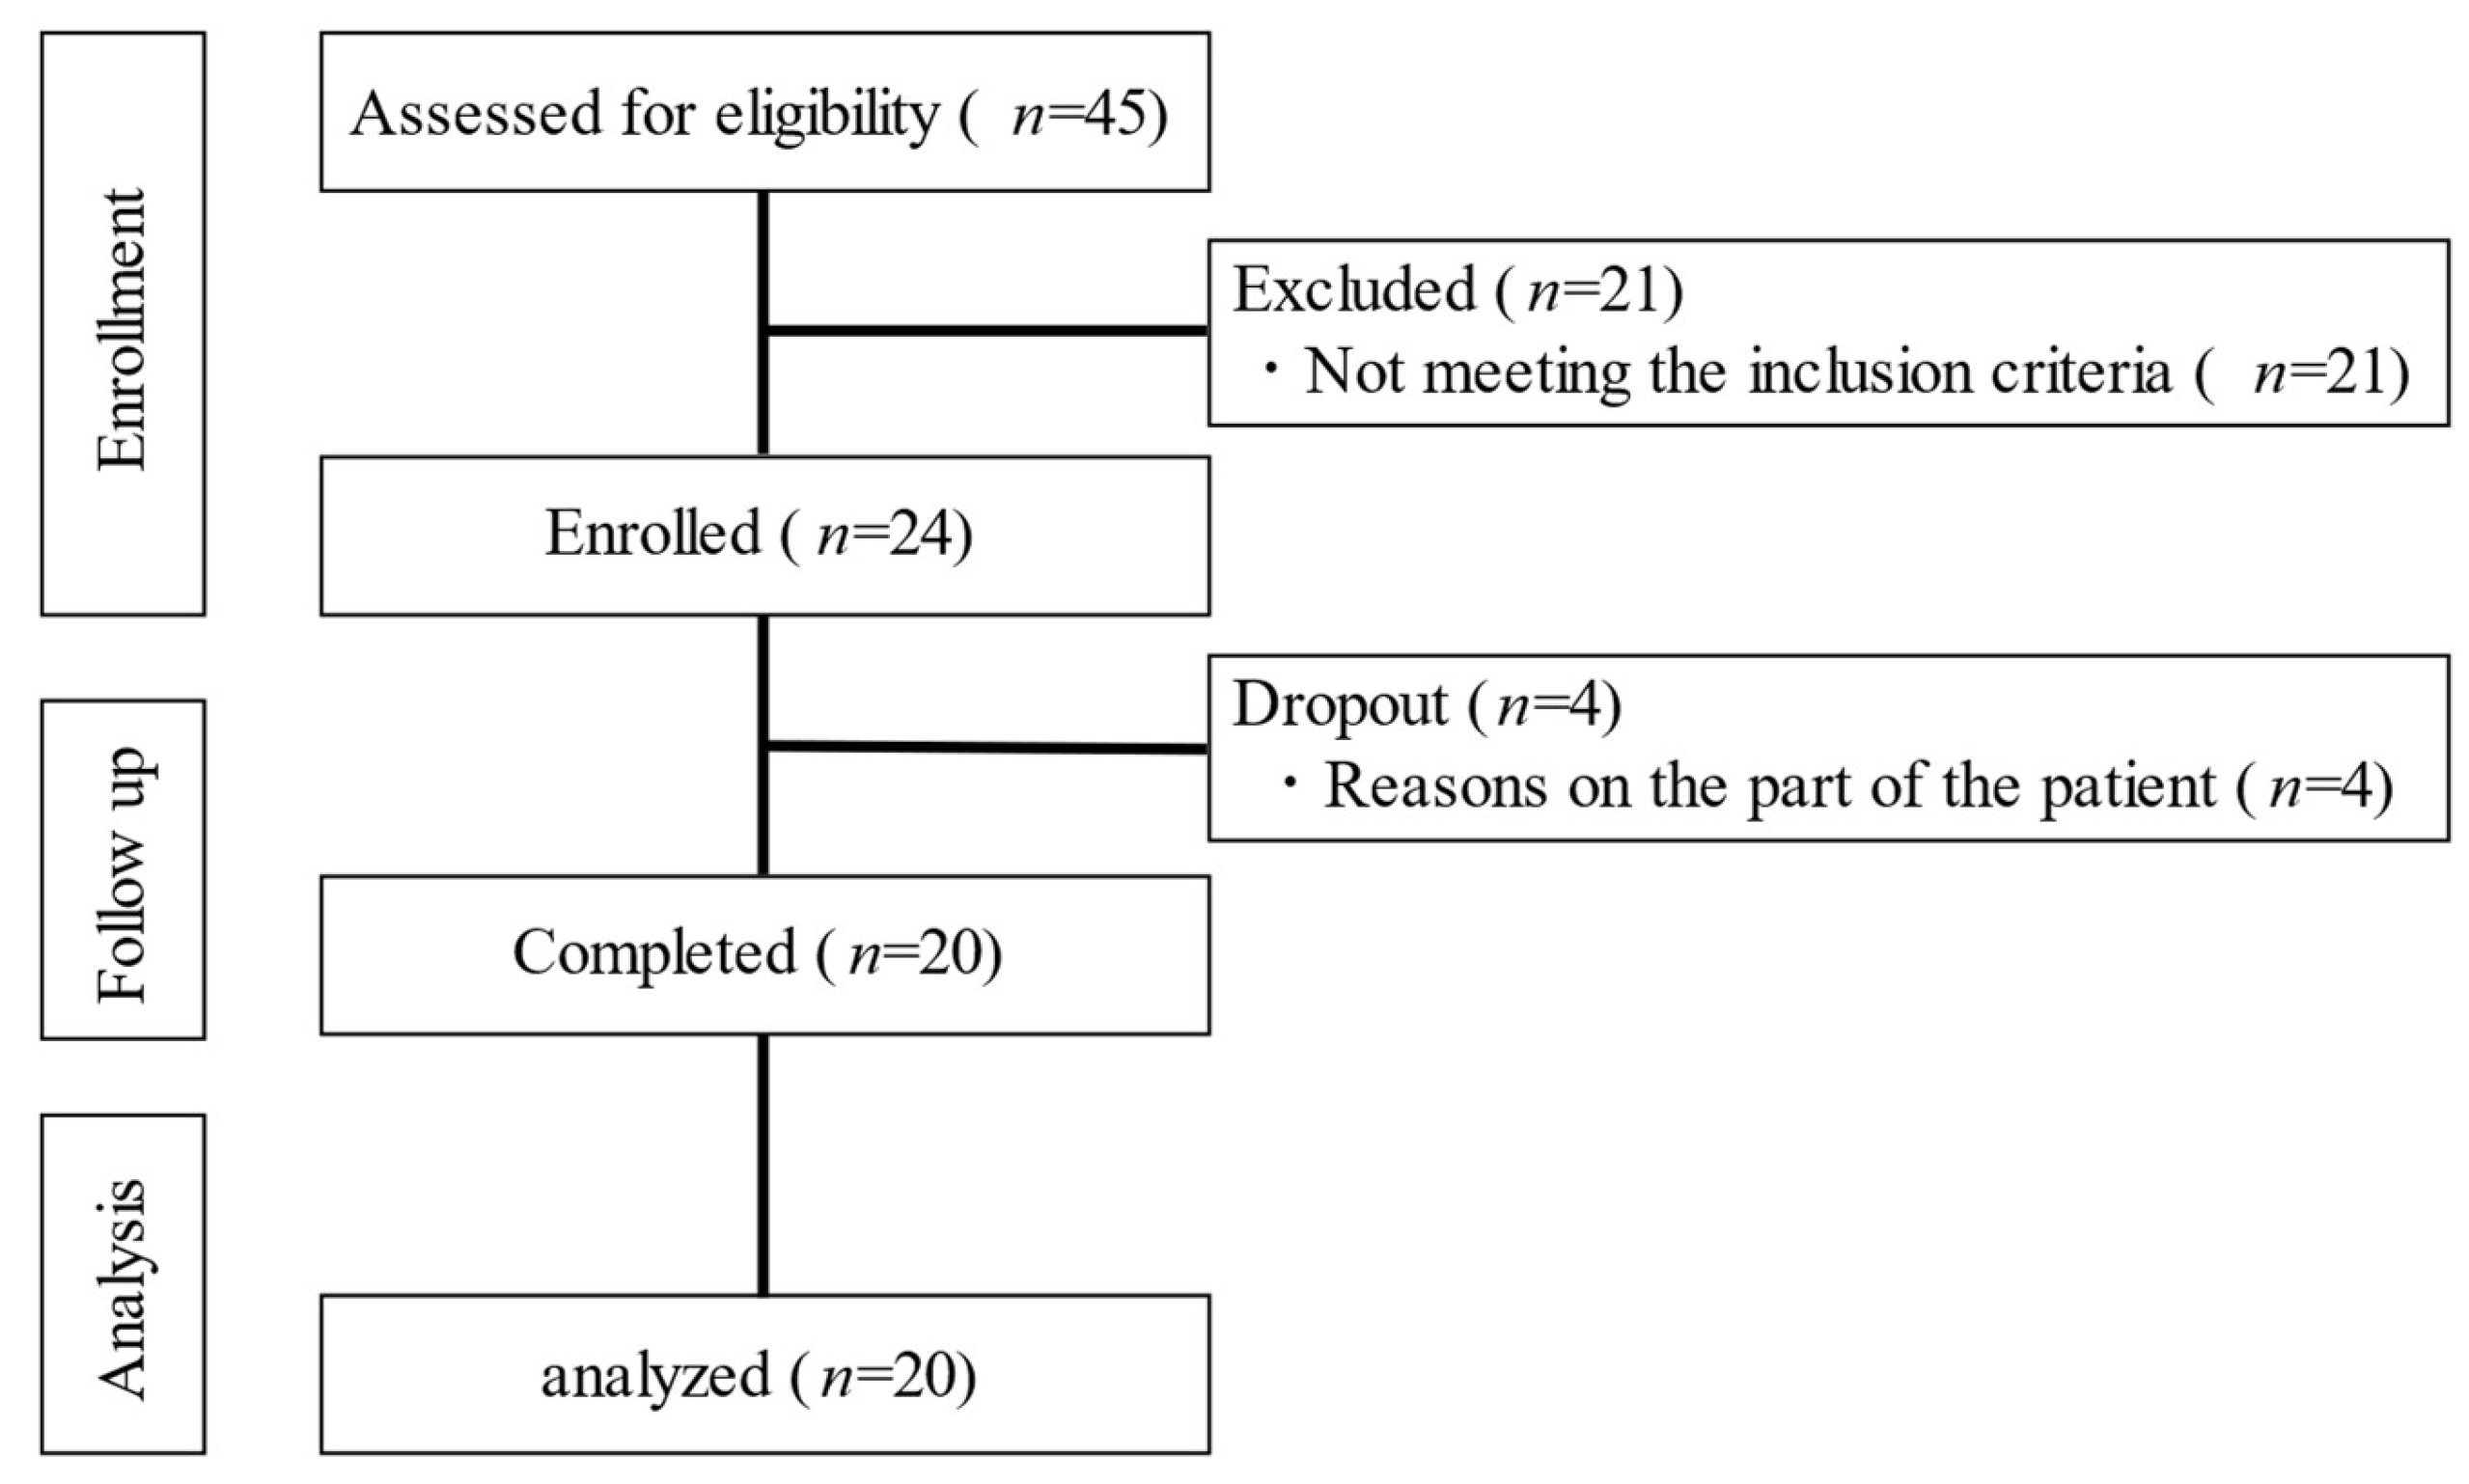
3.1. Participant Characteristics
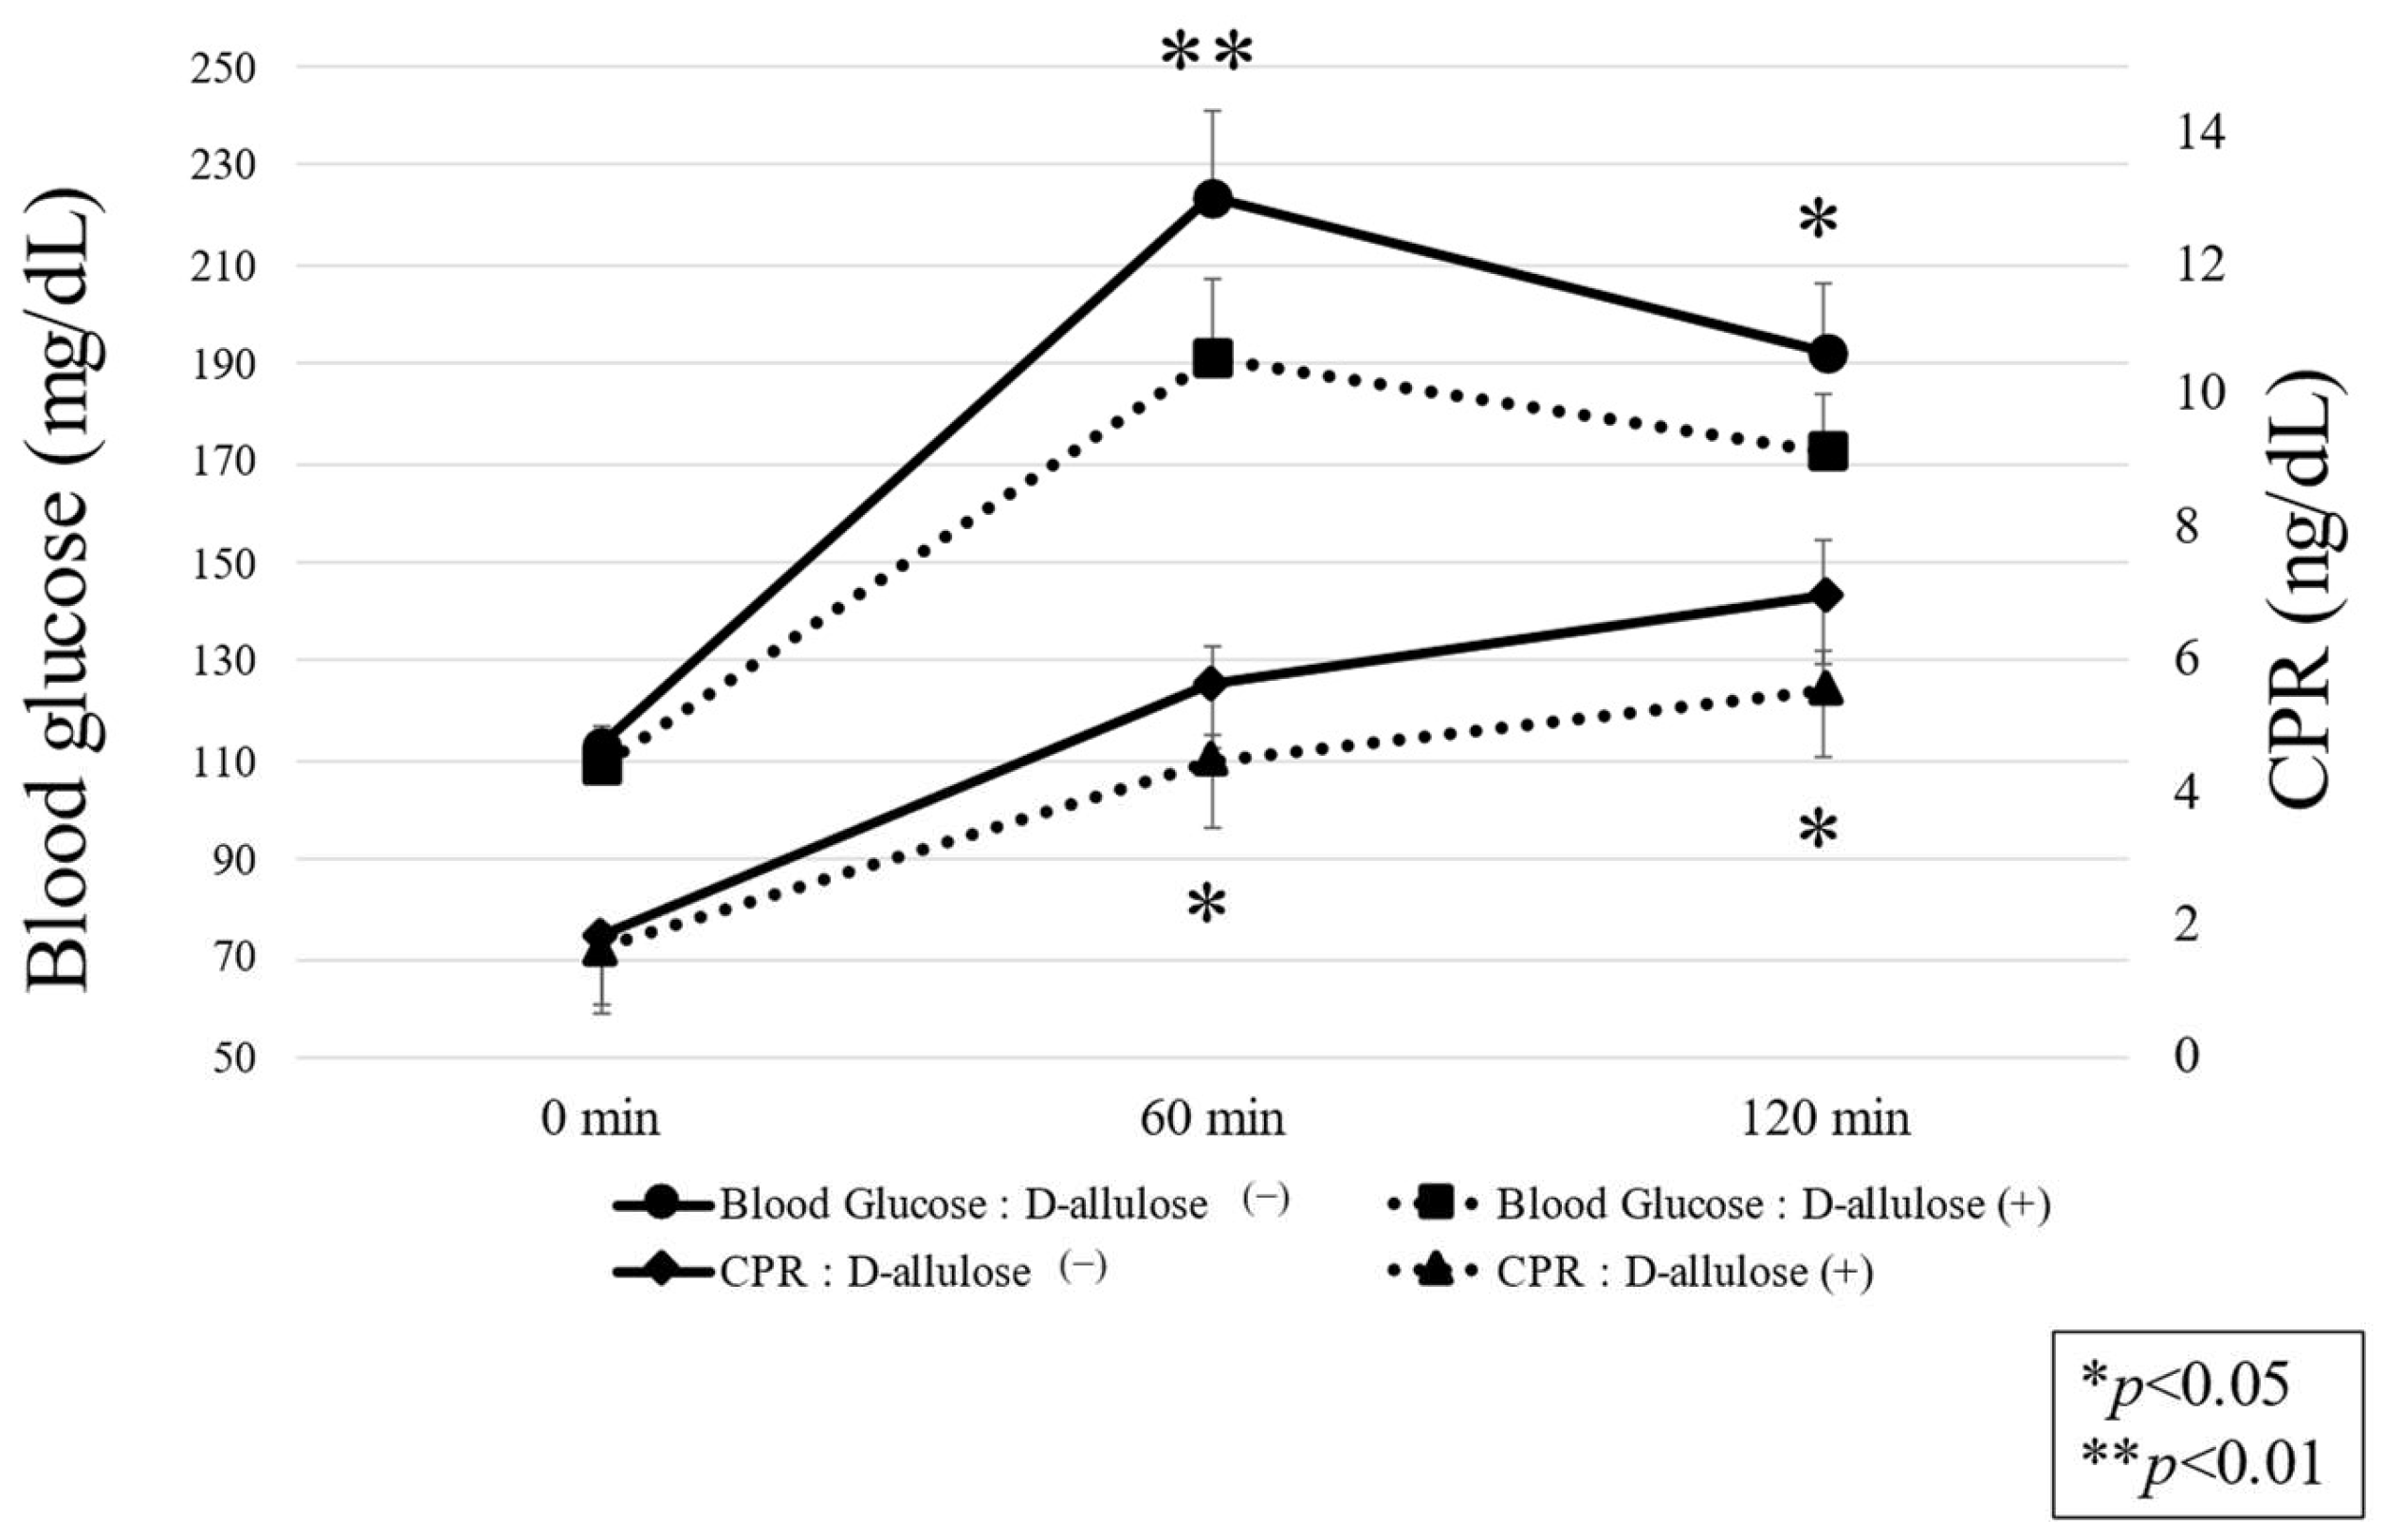
3.2. Effect of D-Allulose on Postprandial Peak Glucose
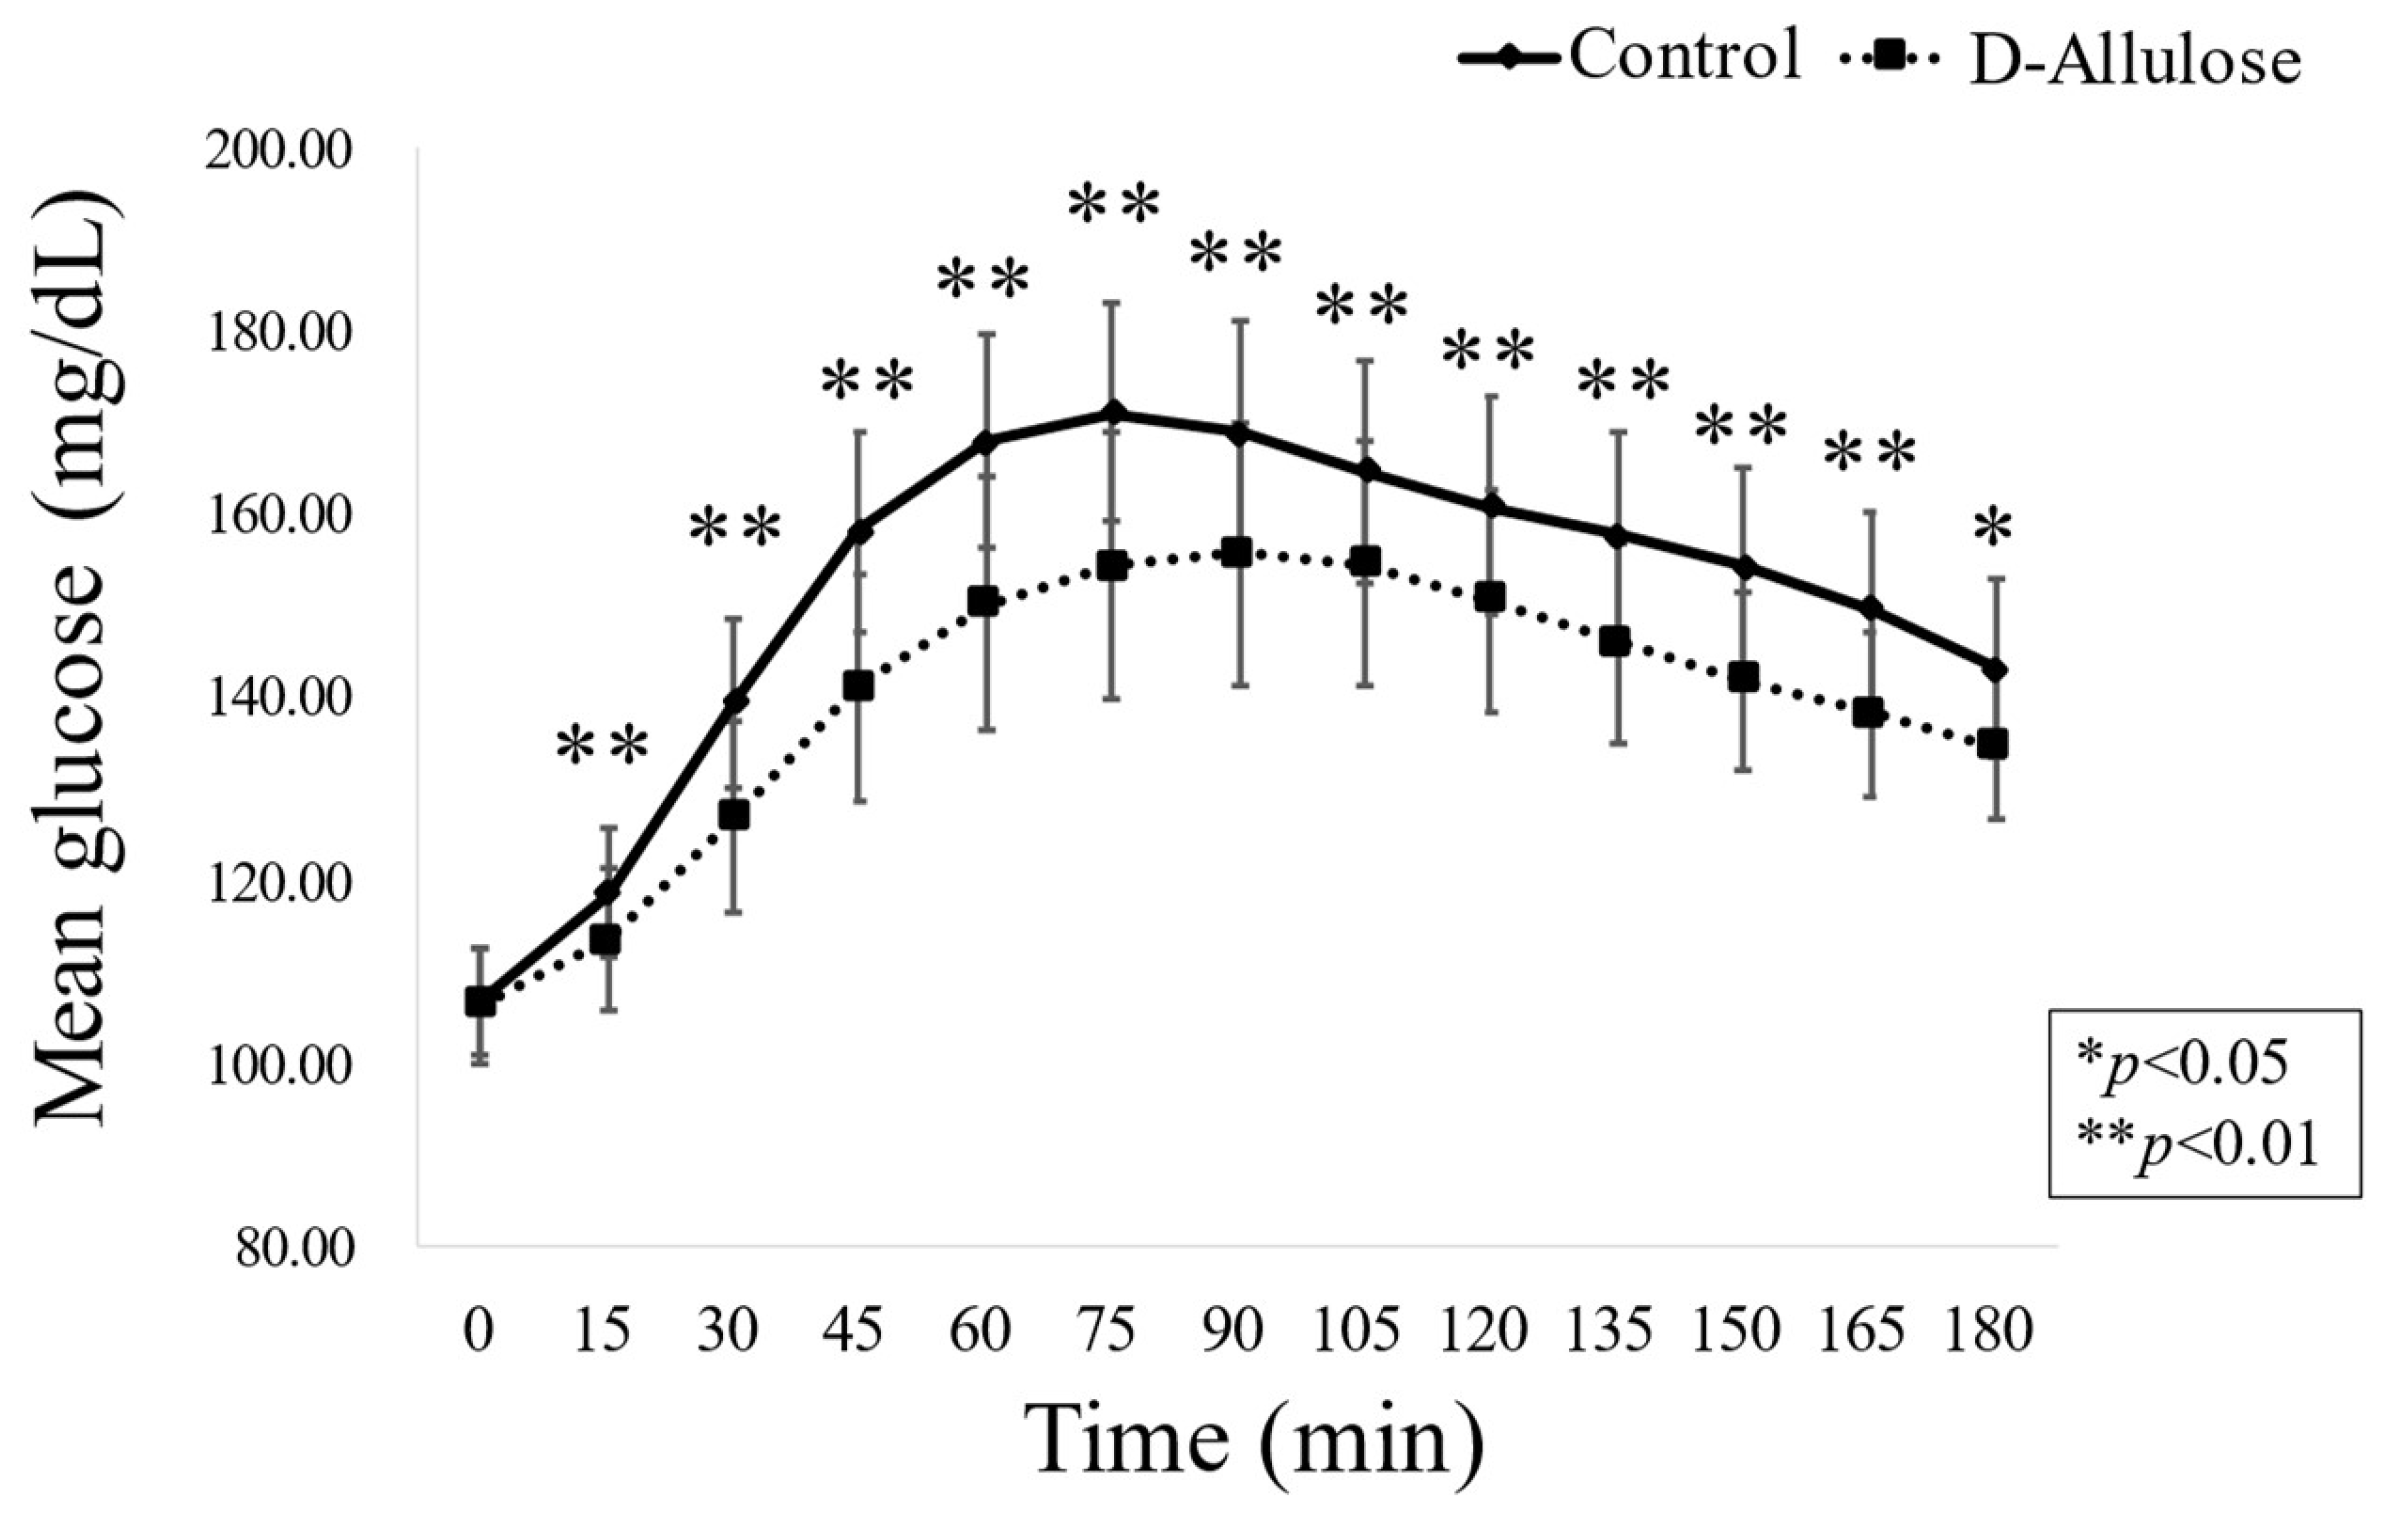
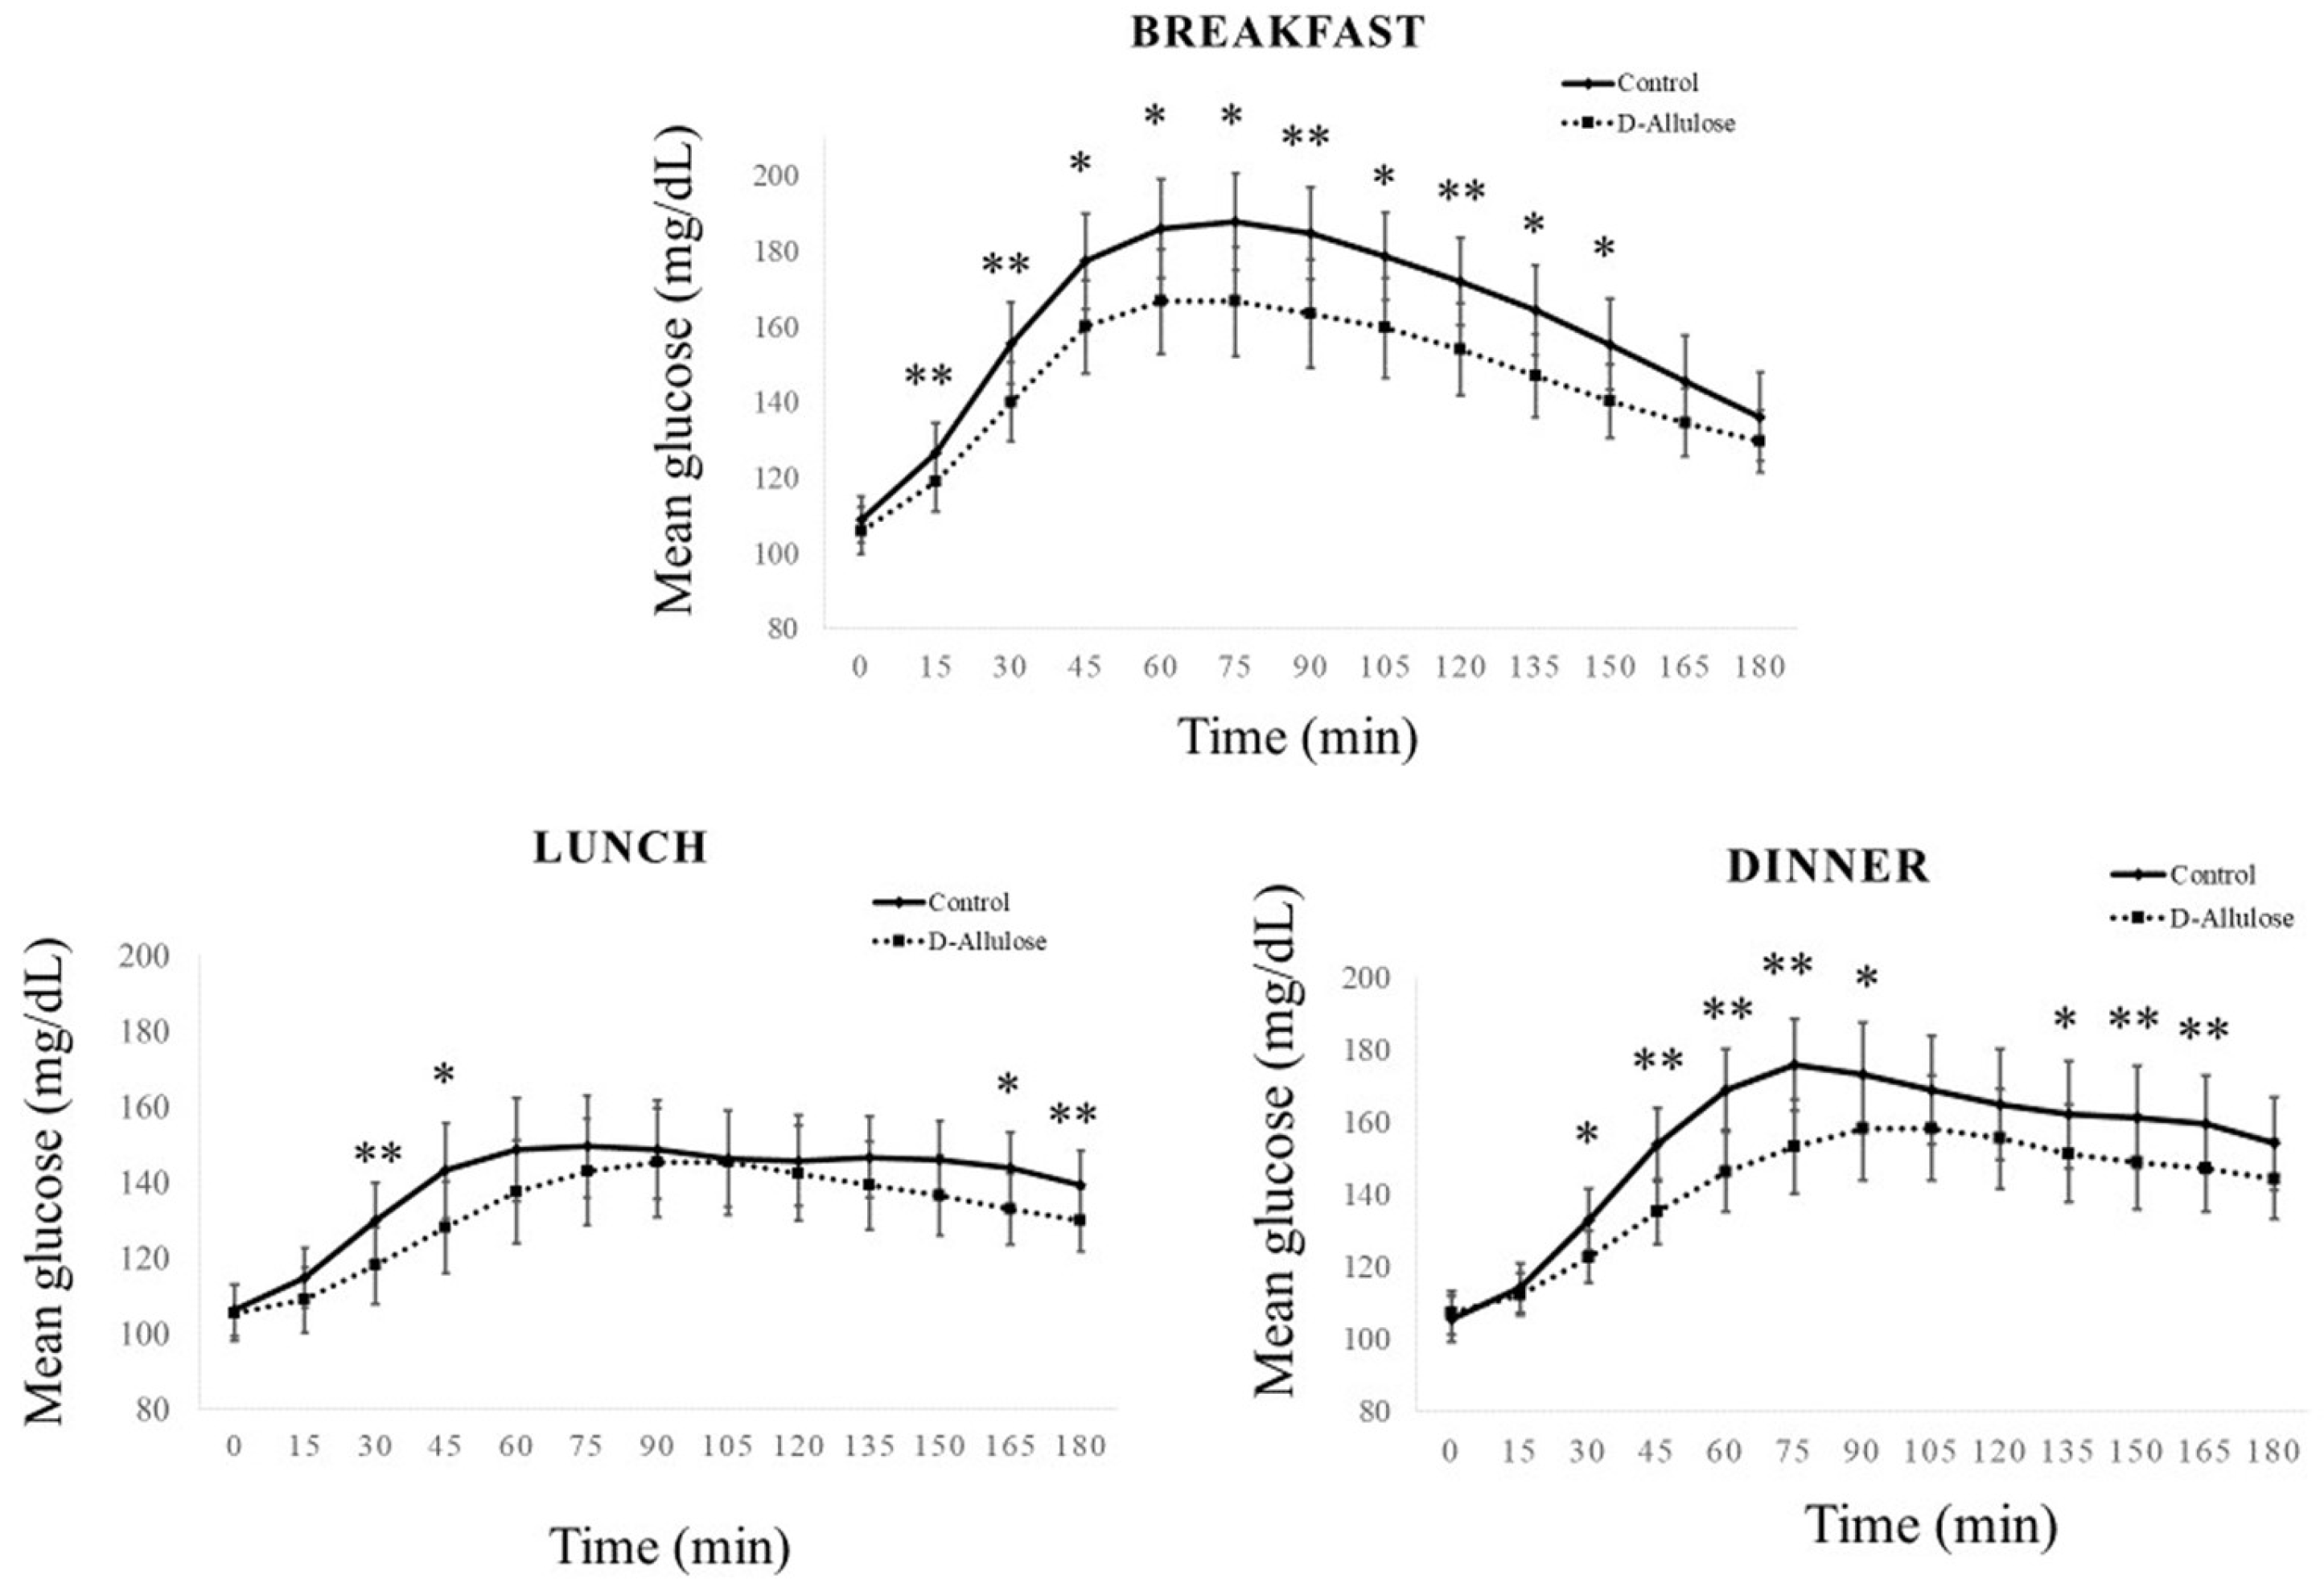
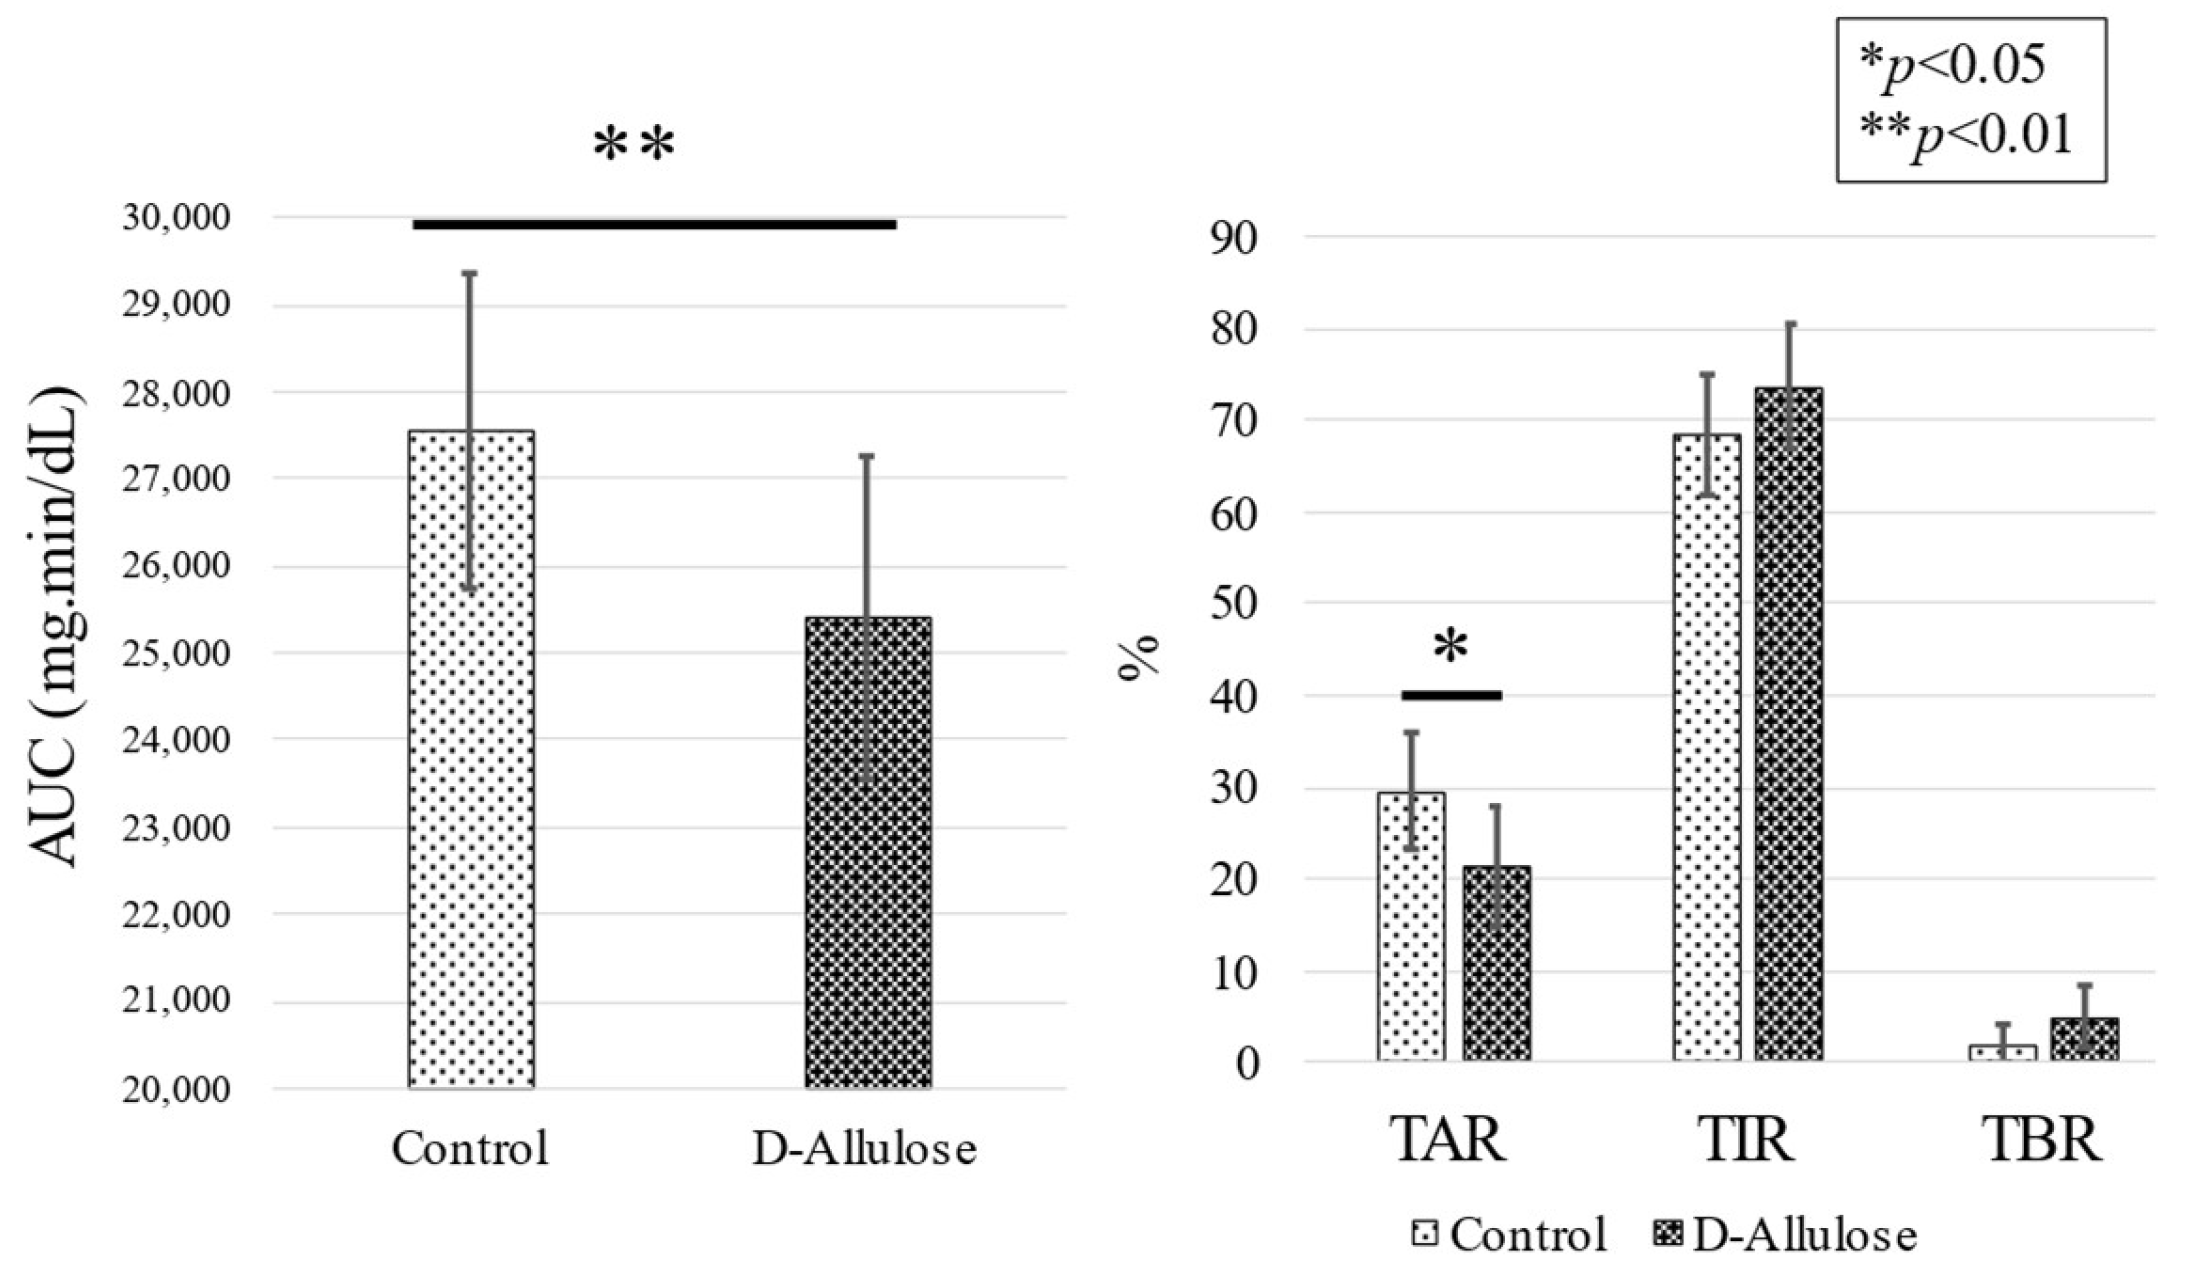
3.3. Postprandial Blood Glucose Levels When Using IsCGM
3.4. Patient Questionnaire on Seasoning
3.5. Side Effects of D-Allulose
4. Discussion
Author Contributions
Funding
Institutional Review Board Statement
Informed Consent Statement
Data Availability Statement
Acknowledgments
Conflicts of Interest
References
- Magliano, D.J.; Boyko, E.J.; IDF Diabetes Atlas 10th Edition Scientific Committee. IDF Diabetes Atlas, 10th ed.; International Diabetes Federation: Brussels, Belgium, 2021; ISBN 978-2-930229-98-0. [Google Scholar]
- Beulens, J.W.J.; de Bruijne, L.M.; Stolk, R.P.; Peeters, P.H.M.; Bots, M.L.; Grobbee, D.E.; van der Schouw, Y.T. High Dietary Glycemic Load and Glycemic Index Increase Risk of Cardiovascular Disease Among Middle-Aged Women: A Population-Based Follow-Up Study. J. Am. Coll. Cardiol. 2007, 50, 14–21. [Google Scholar] [CrossRef] [PubMed]
- Imamura, F.; O’Connor, L.; Ye, Z.; Mursu, J.; Hayashino, Y.; Bhupathiraju, S.N.; Forouhi, N.G. Consumption of Sugar Sweetened Beverages, Artificially Sweetened Beverages, and Fruit Juice and Incidence of Type 2 Diabetes: Systematic Review, Meta-Analysis, and Estimation of Population Attributable Fraction. BMJ 2015, 351, h3576. [Google Scholar] [CrossRef] [PubMed]
- Gardner, C.; Wylie-Rosett, J.; Gidding, S.S.; Steffen, L.M.; Johnson, R.K.; Reader, D.; Lichtenstein, A.H.; American Heart Association Nutrition Committee of the Council on Nutrition, Physical Activity and Metabolism, Council on Arteriosclerosis, Thrombosis and Vascular Biology, Council on Cardiovascular Disease in the Young; American Diabetes Association. Nonnutritive Sweeteners: Current Use and Health Perspectives: A Scientific Statement from the American Heart Association and the American Diabetes Association. Diabetes Care 2012, 35, 1798–1808. [Google Scholar] [CrossRef] [PubMed]
- Suez, J.; Korem, T.; Zeevi, D.; Zilberman-Schapira, G.; Thaiss, C.A.; Maza, O.; Israeli, D.; Zmora, N.; Gilad, S.; Weinberger, A.; et al. Artificial Sweeteners Induce Glucose Intolerance by Altering the Gut Microbiota. Nature 2014, 514, 181–186. [Google Scholar] [CrossRef]
- Suez, J.; Cohen, Y.; Valdés-Mas, R.; Mor, U.; Dori-Bachash, M.; Federici, S.; Zmora, N.; Leshem, A.; Heinemann, M.; Linevsky, R.; et al. Personalized Microbiome-Driven Effects of Non-Nutritive Sweeteners on Human Glucose Tolerance. Cell 2022, 185, 3307–3328.e19. [Google Scholar] [CrossRef]
- Fowler, S.P.; Williams, K.; Resendez, R.G.; Hunt, K.J.; Hazuda, H.P.; Stern, M.P. Fueling the Obesity Epidemic? Artificially Sweetened Beverage Use and Long-Term Weight Gain. Obesity 2008, 16, 1894–1900. [Google Scholar] [CrossRef]
- Elfhag, K.; Tynelius, P.; Rasmussen, F. Sugar-Sweetened and Artificially Sweetened Soft Drinks in Association to Restrained, External and Emotional Eating. Physiol. Behav. 2007, 91, 191–195. [Google Scholar] [CrossRef]
- Hossain, M.A.; Izuishi, K.; Maeta, H. Protective Effects of D-Allose against Ischemia Reperfusion Injury of the Rat Liver. J. Hepatobiliary Pancreat. Surg. 2003, 10, 218–225. [Google Scholar] [CrossRef]
- Tsukamoto, I.; Hossain, A.; Yamaguchi, F.; Hirata, Y.; Dong, Y.; Kamitori, K.; Sui, L.; Nonaka, M.; Ueno, M.; Nishimoto, K.; et al. Intestinal Absorption, Organ Distribution, and Urinary Excretion of the Rare Sugar D-Psicose. Drug Des. Devel. Ther. 2014, 8, 1955–1964. [Google Scholar] [CrossRef]
- Hishiike, T.; Ogawa, M.; Hayakawa, S.; Nakajima, D.; O’Charoen, S.; Ooshima, H.; Sun, Y. Transepithelial Transports of Rare Sugar D-Psicose in Human Intestine. J. Agric. Food Chem. 2013, 61, 7381–7386. [Google Scholar] [CrossRef]
- Kishida, K.; Martinez, G.; Iida, T.; Yamada, T.; Ferraris, R.P.; Toyoda, Y. D-Allulose Is a Substrate of Glucose Transporter Type 5 (GLUT5) in the Small Intestine. Food Chem. 2019, 277, 604–608. [Google Scholar] [CrossRef] [PubMed]
- Iida, T.; Kishimoto, Y.; Yoshikawa, Y.; Hayashi, N.; Okuma, K.; Tohi, M.; Yagi, K.; Matsuo, T.; Izumori, K. Acute D-Psicose Administration Decreases the Glycemic Responses to an Oral Maltodextrin Tolerance Test in Normal Adults. J. Nutr. Sci. Vitaminol. 2008, 54, 511–514. [Google Scholar] [CrossRef] [PubMed]
- Matsuo, T.; Tanaka, T.; Hashiguchi, M.; Izumori, K.; Suzuki, H. Metabolic Effects of D-Psicose in Rats: Studies on Faecal and Urinary Excretion and Caecal Fermentation. Asia Pac. J. Clin. Nutr. 2003, 12, 225–231. [Google Scholar]
- Hossain, A.; Yamaguchi, F.; Hirose, K.; Matsunaga, T.; Sui, L.; Hirata, Y.; Noguchi, C.; Katagi, A.; Kamitori, K.; Dong, Y.; et al. Rare Sugar D-Psicose Prevents Progression and Development of Diabetes in T2DM Model Otsuka Long-Evans Tokushima Fatty Rats. Drug Des. Devel. Ther. 2015, 9, 525–535. [Google Scholar] [CrossRef]
- Iwasaki, Y.; Sendo, M.; Dezaki, K.; Hira, T.; Sato, T.; Nakata, M.; Goswami, C.; Aoki, R.; Arai, T.; Kumari, P.; et al. GLP-1 Release and Vagal Afferent Activation Mediate the Beneficial Metabolic and Chronotherapeutic Effects of D-Allulose. Nat. Commun. 2018, 9, 113. [Google Scholar] [CrossRef] [PubMed]
- Hayashi, N.; Iida, T.; Yamada, T.; Okuma, K.; Takehara, I.; Yamamoto, T.; Yamada, K.; Tokuda, M. Study on the Postprandial Blood Glucose Suppression Effect of D-Psicose in Borderline Diabetes and the Safety of Long-Term Ingestion by Normal Human Subjects. Biosci. Biotechnol. Biochem. 2010, 74, 510–519. [Google Scholar] [CrossRef] [PubMed]
- Japar, S.; Fukunaga, K.; Kobayashi, T.; Imachi, H.; Sato, S.; Saheki, T.; Ibata, T.; Yoshimura, T.; Soh, K.L.; Ong, S.L.; et al. A Pilot Study on the Effect of D-Allulose on Postprandial Glucose Levels in Patients with Type 2 Diabetes Mellitus during Ramadan Fasting. Diabetol. Metab. Syndr. 2022, 14, 86. [Google Scholar] [CrossRef] [PubMed]
- Yuma, T.; Tokuda, M.; Nishimoto, N.; Yokoi, H.; Izumori, K. Allulose for the Attenuation of Postprandial Blood Glucose Levels in Healthy Humans: A Systematic Review and Meta-Analysis. PLoS ONE 2023, 18, e0281150. [Google Scholar] [CrossRef]
- Noronha, J.C.; Braunstein, C.R.; Glenn, A.J.; Khan, T.A.; Viguiliouk, E.; Noseworthy, R.; Blanco Mejia, S.; Kendall, C.W.C.; Wolever, T.M.S.; Leiter, L.A.; et al. The Effect of Small Doses of Fructose and Allulose on Postprandial Glucose Metabolism in Type 2 Diabetes: A Double-Blind, Randomized, Controlled, Acute Feeding, Equivalence Trial. Diabetes Obes. Metab. 2018, 20, 2361–2370. [Google Scholar] [CrossRef]
- Iida, T. Estimation of Maximum Non-Effective Level of D-Psicose in Causing Diarrhea in Human Subjects. J. Adv. Food Ingred. 2007, 10, 15–19. [Google Scholar]
- Han, Y.; Choi, B.R.; Kim, S.Y.; Kim, S.-B.; Kim, Y.H.; Kwon, E.-Y.; Choi, M.-S. Gastrointestinal Tolerance of D-Allulose in Healthy and Young Adults. A Non-Randomized Controlled Trial. Nutrients 2018, 10, 2010. [Google Scholar] [CrossRef]
- Araki, E.; Goto, A.; Kondo, T.; Noda, M.; Noto, H.; Origasa, H.; Osawa, H.; Taguchi, A.; Tanizawa, Y.; Tobe, K.; et al. Japanese Clinical Practice Guideline for Diabetes 2019. J. Diabetes Investig. 2020, 11, 1020–1076. [Google Scholar] [CrossRef]
- Rebrin, K.; Steil, G.M. Can Interstitial Glucose Assessment Replace Blood Glucose Measurements? Diabetes Technol. Ther. 2000, 2, 461–472. [Google Scholar] [CrossRef]
- Shintani, T.; Yamada, T.; Hayashi, N.; Iida, T.; Nagata, Y.; Ozaki, N.; Toyoda, Y. Rare Sugar Syrup Containing D-Allulose but Not High-Fructose Corn Syrup Maintains Glucose Tolerance and Insulin Sensitivity Partly via Hepatic Glucokinase Translocation in Wistar Rats. J. Agric. Food Chem. 2017, 65, 2888–2894. [Google Scholar] [CrossRef]
- Meier, J.J. GLP-1 Receptor Agonists for Individualized Treatment of Type 2 Diabetes Mellitus. Nat. Rev. Endocrinol. 2012, 8, 728–742. [Google Scholar] [CrossRef]
- Sun, Y.; Hayakawa, S.; Ogawa, M.; Fukada, K.; Izumori, K. Influence of a Rare Sugar, d-Psicose, on the Physicochemical and Functional Properties of an Aerated Food System Containing Egg Albumen. J. Agric. Food Chem. 2008, 56, 4789–4796. [Google Scholar] [CrossRef]
- Jürkenbeck, K.; Haarhoff, T.; Spiller, A.; Schulze, M. Does Allulose Appeal to Consumers? Results from a Discrete Choice Experiment in Germany. Nutrients 2022, 14, 3350. [Google Scholar] [CrossRef]
- Saraiva, A.; Carrascosa, C.; Raheem, D.; Ramos, F.; Raposo, A. Natural Sweeteners: The Relevance of Food Naturalness for Consumers, Food Security Aspects, Sustainability and Health Impacts. Int. J. Environ. Res. Public. Health 2020, 17, 6285. [Google Scholar] [CrossRef] [PubMed]
- Lim, S.-L.; Penrod, M.T.; Ha, O.-R.; Bruce, J.M.; Bruce, A.S. Calorie Labeling Promotes Dietary Self-Control by Shifting the Temporal Dynamics of Health- and Taste-Attribute Integration in Overweight Individuals. Psychol. Sci. 2018, 29, 447–462. [Google Scholar] [CrossRef] [PubMed]
- Tanaka, M.; Hayashi, N.; Iida, T. Safety Evaluation of 12-Week Continuous Ingestion of D-Allulose in Borderline Diabetes and Type 2 Diabetes. Fundam. Toxicol. Sci. 2019, 6, 225–234. [Google Scholar] [CrossRef]
- Tak, J.; Bok, M.; Rho, H.; Park, J.H.; Lim, Y.; Chon, S.; Lim, H. Effect of Diabetes-Specific Oral Nutritional Supplements with Allulose on Weight and Glycemic Profiles in Overweight or Obese Type 2 Diabetic Patients. Nutr. Res. Pract. 2023, 17, 241–256. [Google Scholar] [CrossRef] [PubMed]


| Overall | Control First Group | D-Allulose First Group | p-Value | |
|---|---|---|---|---|
| Gender | ||||
| Male | 14 (70.0%) | 6 (60.0%) | 8 (80.0%) | |
| Female | 6 (30.0%) | 4 (40.0%) | 2 (20.0%) | |
| Age (years old) | 61.0 (11.9) | 65.3 (7.3) | 56.3 (14.0) | 0.08 |
| Duration of diabetes | 10.6 (11.5) | 12.0 (13.5) | 9.2 (9.6) | 0.60 |
| Height (cm) | 159.6 (8.3) | 159.1 (10.0) | 160.1 (6.7) | 0.78 |
| Weight (kg) | 65.6 (14.2) | 61.1 (11.5) | 70.1 (15.8) | 0.16 |
| BMI (kg/m2) | 25.6 (4.2) | 24.2 (3.1) | 27.1 (4.8) | 0.11 |
| Grip strength (kg) | ||||
| Right (kg) | 30.2 (9.8) | 28.1 (9.6) | 32.3 (10.1) | 0.37 |
| Left (kg) | 29.8 (9.7) | 27.6 (8.0) | 31.9 (11.6) | 0.36 |
| sBP (mmHg) | 127 (19) | 128 (21) | 125 (16) | 0.72 |
| dBP (mmHg) | 73 (12) | 72 (14) | 73 (11) | 0.75 |
| Chemistry | ||||
| HbA1c (%) | 9.2 (1.8) | 9.3 (2.2) | 9.0 (1.4) | 0.69 |
| Fasting blood glucose (mg/dL) | 148 (39) | 152 (36) | 144 (45) | 0.69 |
| fasting IRI | 9.7 (5.5) | 10.2 (5.7) | 9.2 (5.6) | 0.72 |
| fasting CPR (ng/dL) | 2.15 (1.28) | 2.55 (1.63) | 1.76 (0.66) | 0.18 |
| Urinary CPR | 52.4 (35.0) | 55.2 (38.3) | 49.6 (33.1) | 0.73 |
| UACR (mg/g·Cre) | 38.1 (39.7) | 42.5 (50.7) | 33.7 (26.6) | 0.64 |
| Total cholesterol (mg/dL) | 159 (33) | 157 (20) | 161 (42) | 0.78 |
| LDL cholesterol (mg/dL) | 92 (30) | 89 (17) | 95 (40) | 0.69 |
| HDL cholesterol (mg/dL) | 40(12) | 39 (16) | 41 (8) | 0.70 |
| Triglyceride (mg/dL) | 137 (77) | 145 (60) | 128 (93) | 0.64 |
| BUN (mg/dL) | 17 (6) | 18 (8) | 15 (4) | 0.33 |
| Cre (mg/dL) | 0.75 (0.16) | 0.72 (0.19) | 0.78 (0.13) | 0.39 |
| eGFR (mL/min) | 78.9 (18.1) | 79.9 (21.9) | 77.9 (14.6) | 0.81 |
| AST (U/L) | 30 (23) | 35 (30) | 25 (13) | 0.32 |
| ALT (U/L) | 36 (34) | 42 (41) | 31 (25) | 0.48 |
| CVR-R (%) | 2.42 (1.09) | 1.96 (0.99) | 2.89 (1.03) | 0.05 |
| R-CAVI | 8.3 (1.6) | 8.9 (1.3) | 7.7 (1.8) | 0.08 |
| L-CABI | 7.92 (2.15) | 8.75 (1.15) | 7.10 (2.63) | 0.09 |
| R-ABI | 1.10 (0.14) | 1.12 (0.07) | 1.09 (0.19) | 0.70 |
| L-ABI | 1.10 (0.15) | 1.12 (0.11) | 1.08 (0.19) | 0.62 |
| Diabetec treatment | ||||
| OHAs | 9 (45%) | 5 (25%) | 4 (20%) | |
| GLP-1 RA and OHAs | 8 (40%) | 3 (15%) | 5 (25%) | |
| Insulin monotherapy | 1 (5%) | 1 (5%) | 0 | |
| Insulin and GLP-1 RA | 1 (5%) | 0 | 1 (5%) | |
| Insulin and GLP-1 RA | 1 (5%) | 1 (5%) | 0 | |
| and OHAs | ||||
| study foods | ||||
| energy (kcal/day) | target body weight [kg] × energy coefficient [kcal/kg] | |||
| carbohydrates (%energy) | 50–60% | |||
| proteins (%energy) | approximately 20% | |||
| fats (%energy) | remaining | |||
| n (%); Mean (SD) | ||||
| n | Control | D-Allulose | p-Value | ||
|---|---|---|---|---|---|
| quantity | 107 | 0.6 | |||
| many | 10 (19%) | 12 (23%) | |||
| just right | 38 (70%) | 38 (72%) | |||
| Not enough | 6 (11%) | 3 (5.7%) | |||
| seasoning | 101 | 0.322 | |||
| Very tasty | 4 (8.0%) | 3 (5.9%) | |||
| Delicious | 22 (44%) | 27 (53%) | |||
| Neither | 21 (42%) | 14 (27%) | |||
| Not tasty | 3 (6.0%) | 7 (14%) | |||
| coloring | 106 | 0.906 | |||
| Very good | 4 (7.5%) | 4 (7.5%) | |||
| Good | 15 (28%) | 18 (34%) | |||
| usually | 33 (62%) | 31 (58%) | |||
| bad | 1 (1.9%) | 0 (0%) | |||
| smell | 107 | 1 | |||
| Good | 16 (30%) | 15 (28%) | |||
| not mind about | 37 (69%) | 38 (72%) | |||
| stinky | 1 (1.9%) | 0 (0%) | |||
| Fisher’s exact test | |||||
Disclaimer/Publisher’s Note: The statements, opinions and data contained in all publications are solely those of the individual author(s) and contributor(s) and not of MDPI and/or the editor(s). MDPI and/or the editor(s) disclaim responsibility for any injury to people or property resulting from any ideas, methods, instructions or products referred to in the content. |
© 2023 by the authors. Licensee MDPI, Basel, Switzerland. This article is an open access article distributed under the terms and conditions of the Creative Commons Attribution (CC BY) license (https://creativecommons.org/licenses/by/4.0/).
Share and Cite
Fukunaga, K.; Yoshimura, T.; Imachi, H.; Kobayashi, T.; Saheki, T.; Sato, S.; Saheki, N.; Jiang, W.; Murao, K. A Pilot Study on the Efficacy of a Diabetic Diet Containing the Rare Sugar D-Allulose in Patients with Type 2 Diabetes Mellitus: A Prospective, Randomized, Single-Blind, Crossover Study. Nutrients 2023, 15, 2802. https://doi.org/10.3390/nu15122802
Fukunaga K, Yoshimura T, Imachi H, Kobayashi T, Saheki T, Sato S, Saheki N, Jiang W, Murao K. A Pilot Study on the Efficacy of a Diabetic Diet Containing the Rare Sugar D-Allulose in Patients with Type 2 Diabetes Mellitus: A Prospective, Randomized, Single-Blind, Crossover Study. Nutrients. 2023; 15(12):2802. https://doi.org/10.3390/nu15122802
Chicago/Turabian StyleFukunaga, Kensaku, Takafumi Yoshimura, Hitomi Imachi, Toshihiro Kobayashi, Takanobu Saheki, Seisuke Sato, Nao Saheki, Wenyi Jiang, and Koji Murao. 2023. "A Pilot Study on the Efficacy of a Diabetic Diet Containing the Rare Sugar D-Allulose in Patients with Type 2 Diabetes Mellitus: A Prospective, Randomized, Single-Blind, Crossover Study" Nutrients 15, no. 12: 2802. https://doi.org/10.3390/nu15122802
APA StyleFukunaga, K., Yoshimura, T., Imachi, H., Kobayashi, T., Saheki, T., Sato, S., Saheki, N., Jiang, W., & Murao, K. (2023). A Pilot Study on the Efficacy of a Diabetic Diet Containing the Rare Sugar D-Allulose in Patients with Type 2 Diabetes Mellitus: A Prospective, Randomized, Single-Blind, Crossover Study. Nutrients, 15(12), 2802. https://doi.org/10.3390/nu15122802