
Prevalence of Undernutrition, Frailty and Sarcopenia in Community-Dwelling People Aged 50 Years and Above: Systematic Review and Meta-Analysis

 , ,
, ,  , ,
, ,  and
and
Abstract
:1. Introduction
2. Materials and Methods
2.1. Search Strategy
2.2. Data Extraction
2.3. Quality Appraisal
2.4. Risk of Bias Assessment
2.5. Data Synthesis
3. Results
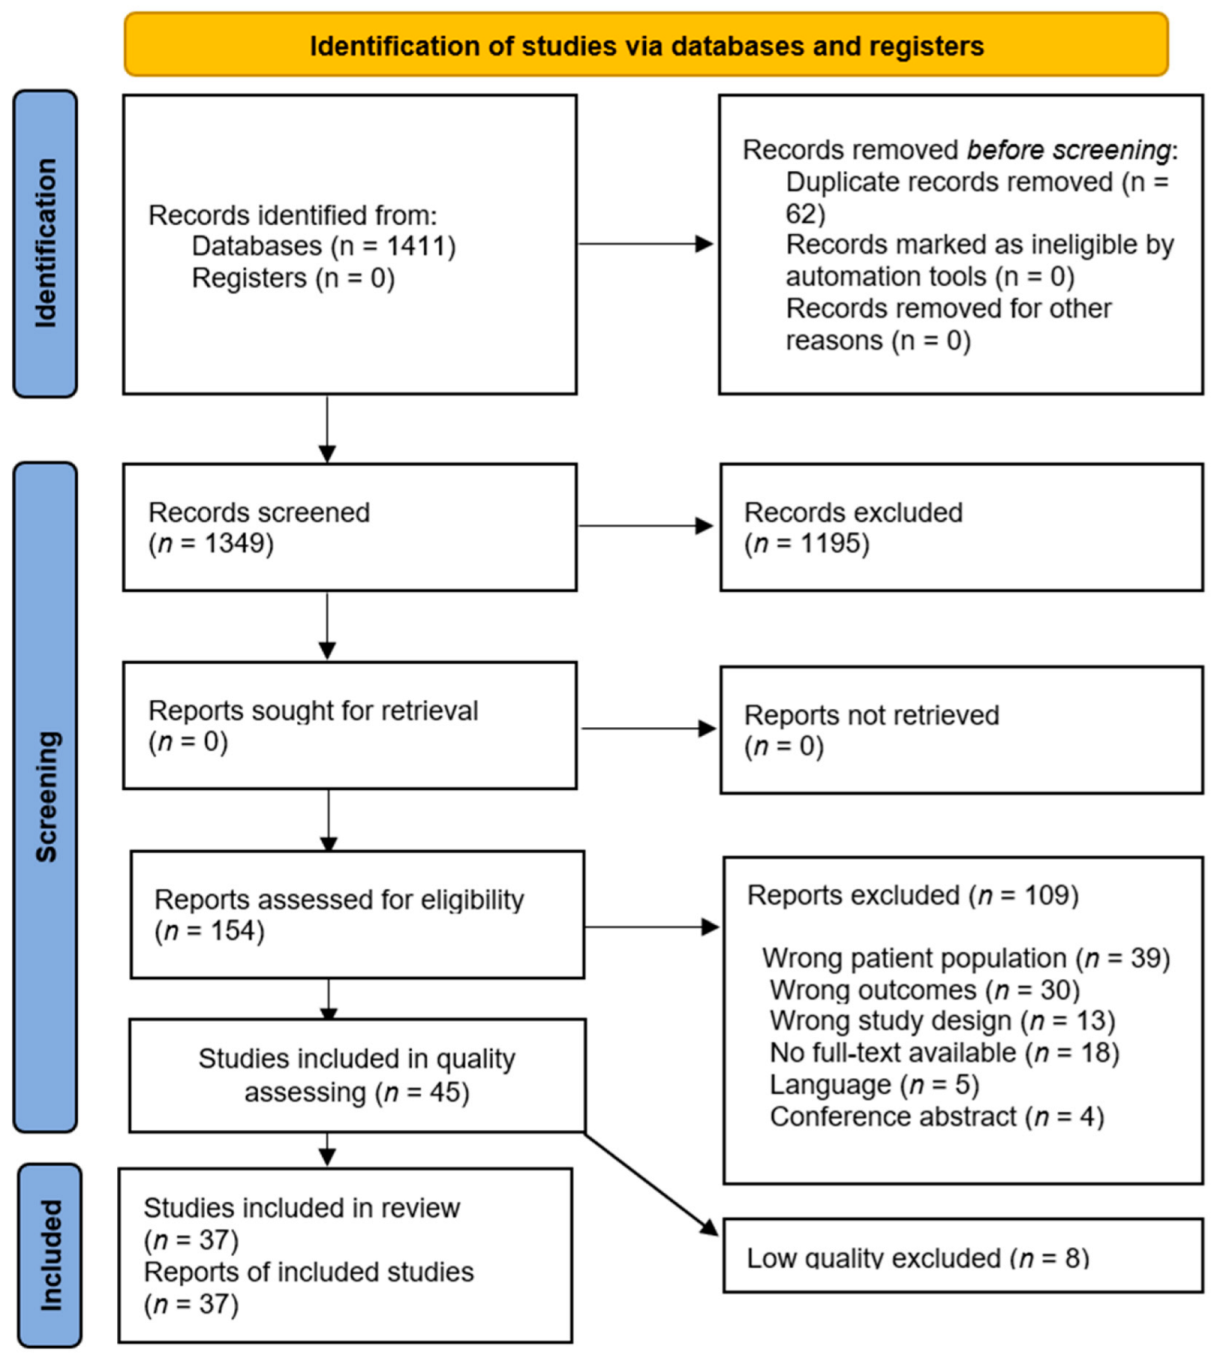
3.1. Search Results
3.2. Study Characteristics
3.3. Participants
3.4. Outcomes
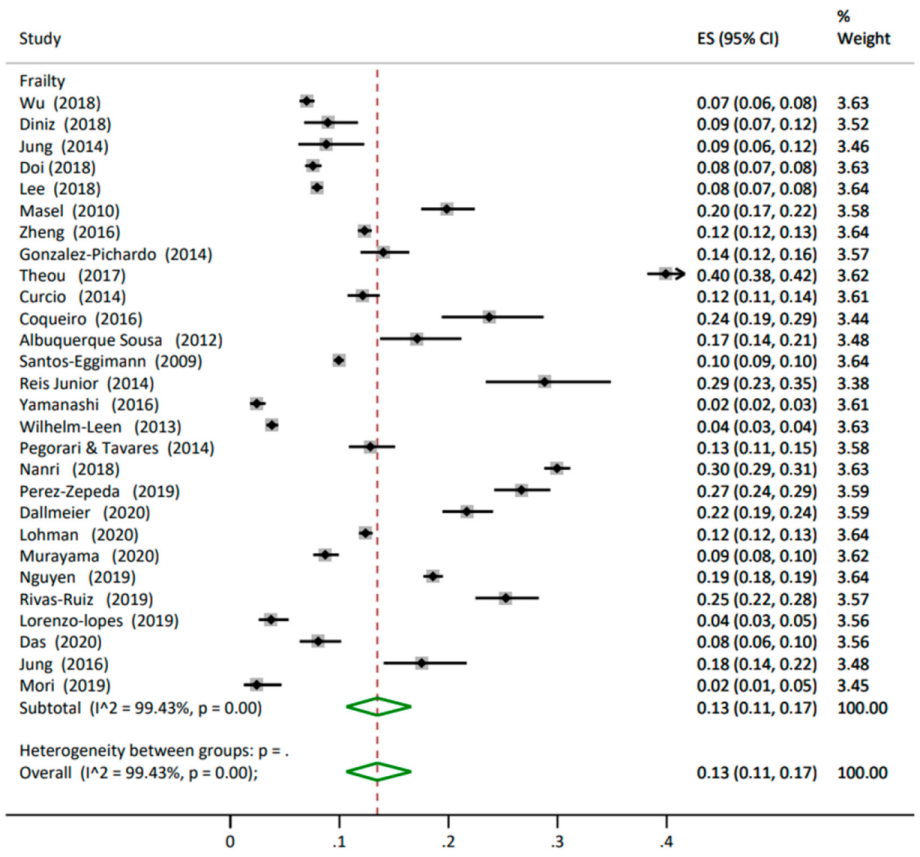
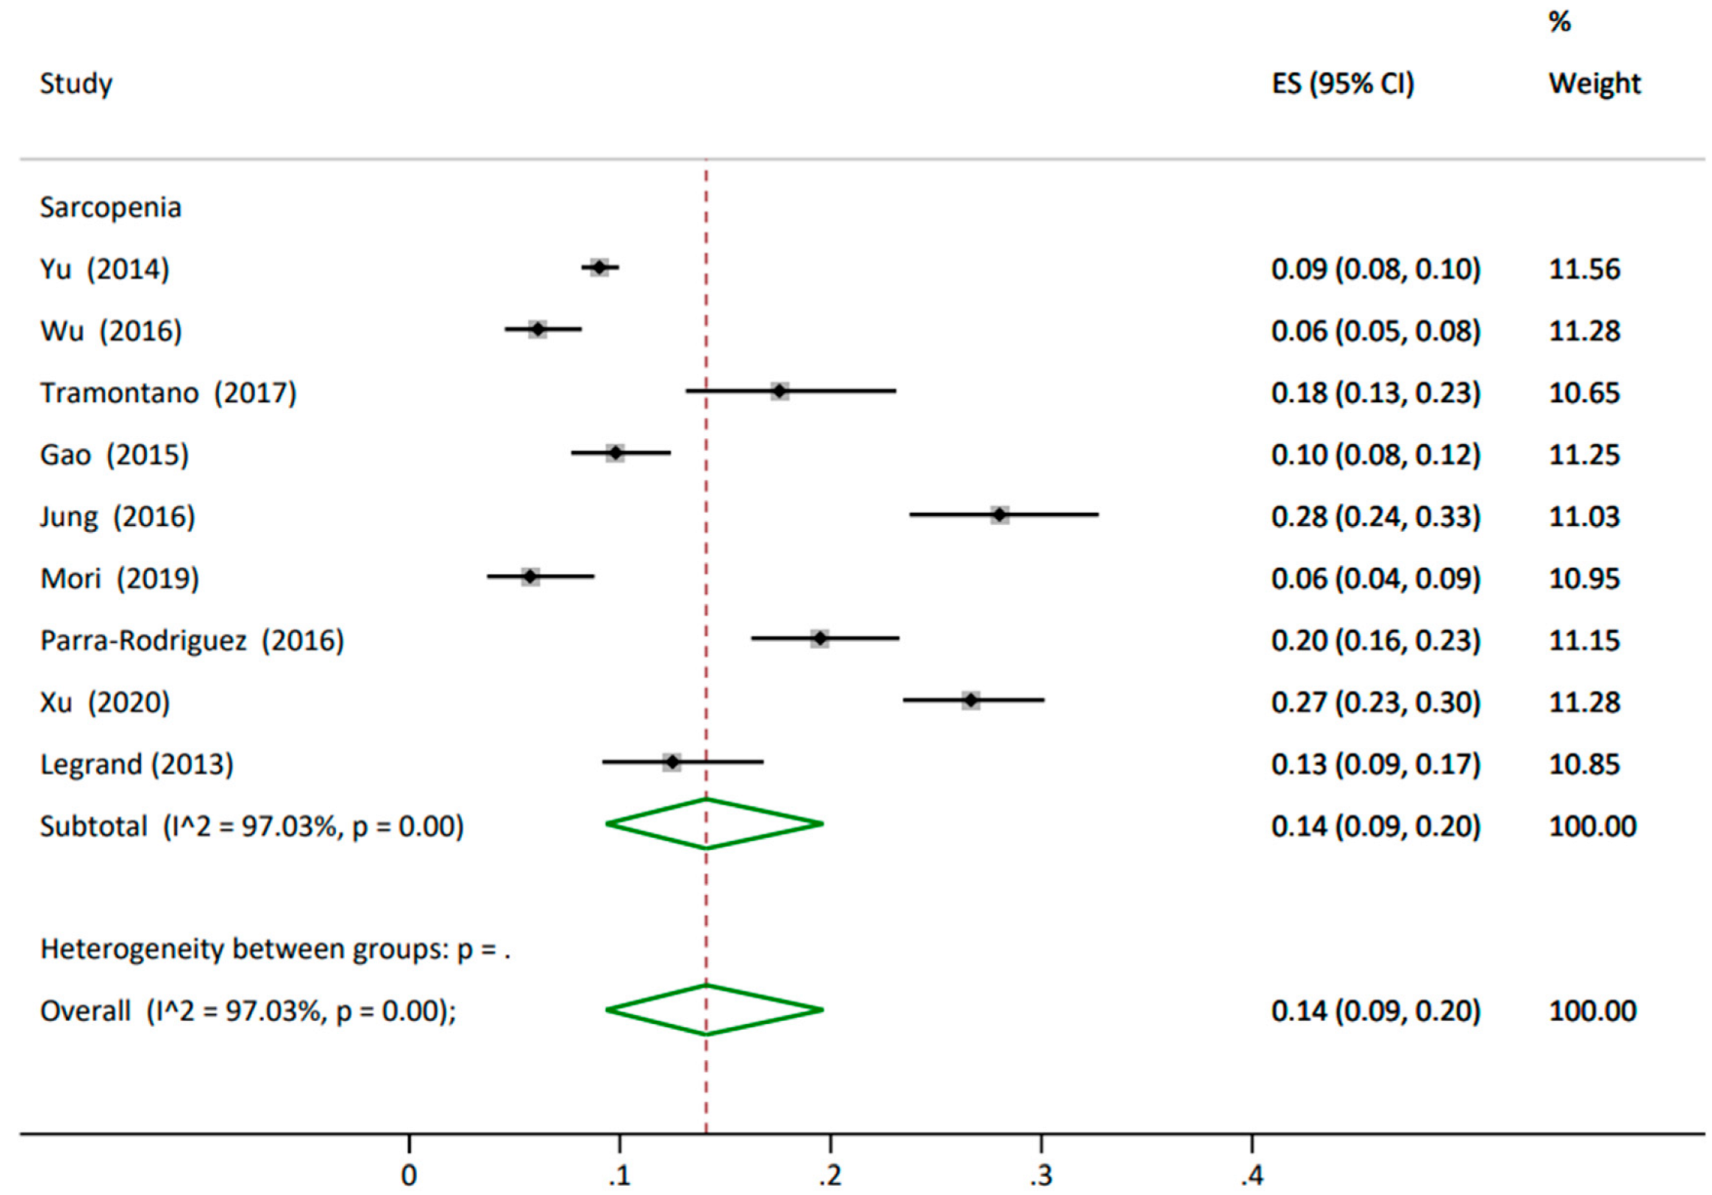
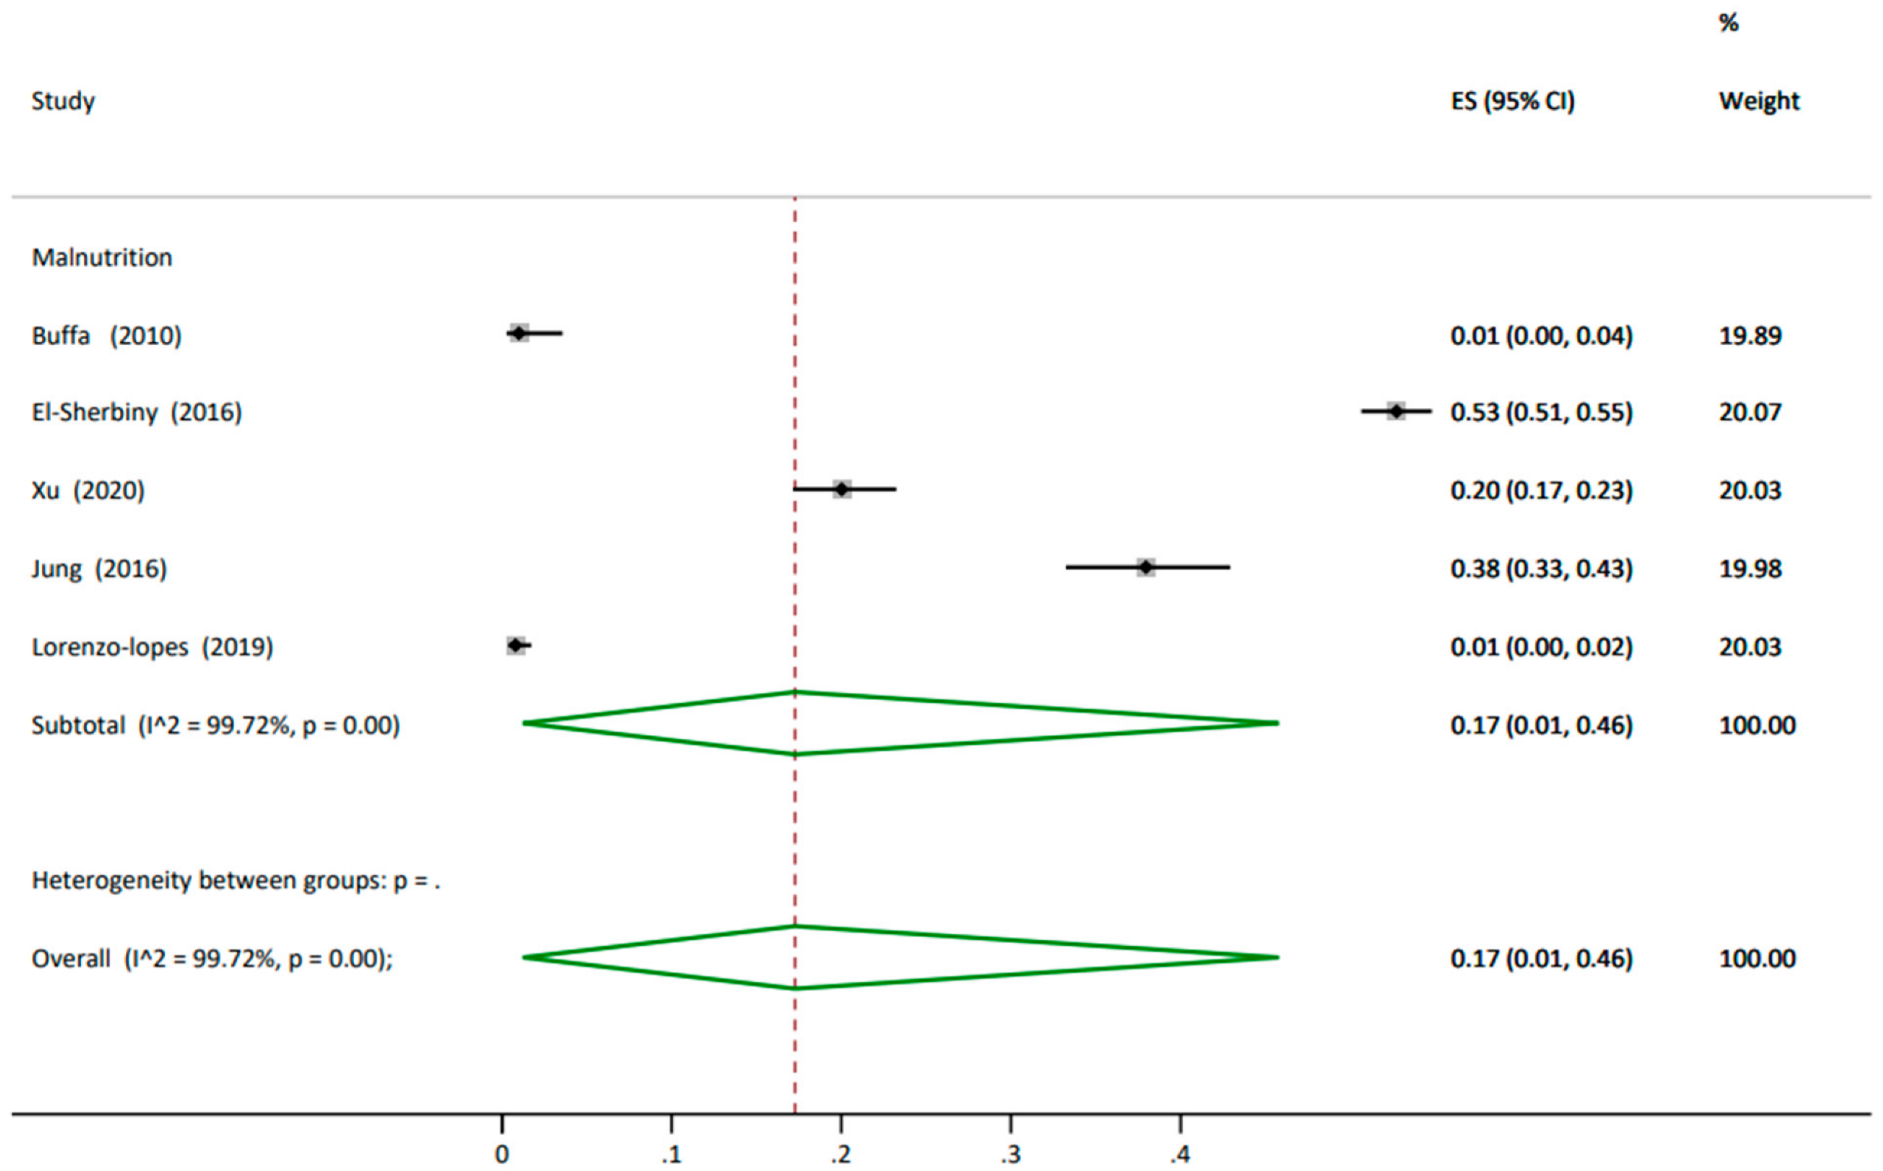
3.4.1. Prevalence
3.4.2. Incidence
3.4.3. Subgroup Analysis
3.5. Quality Appraisal
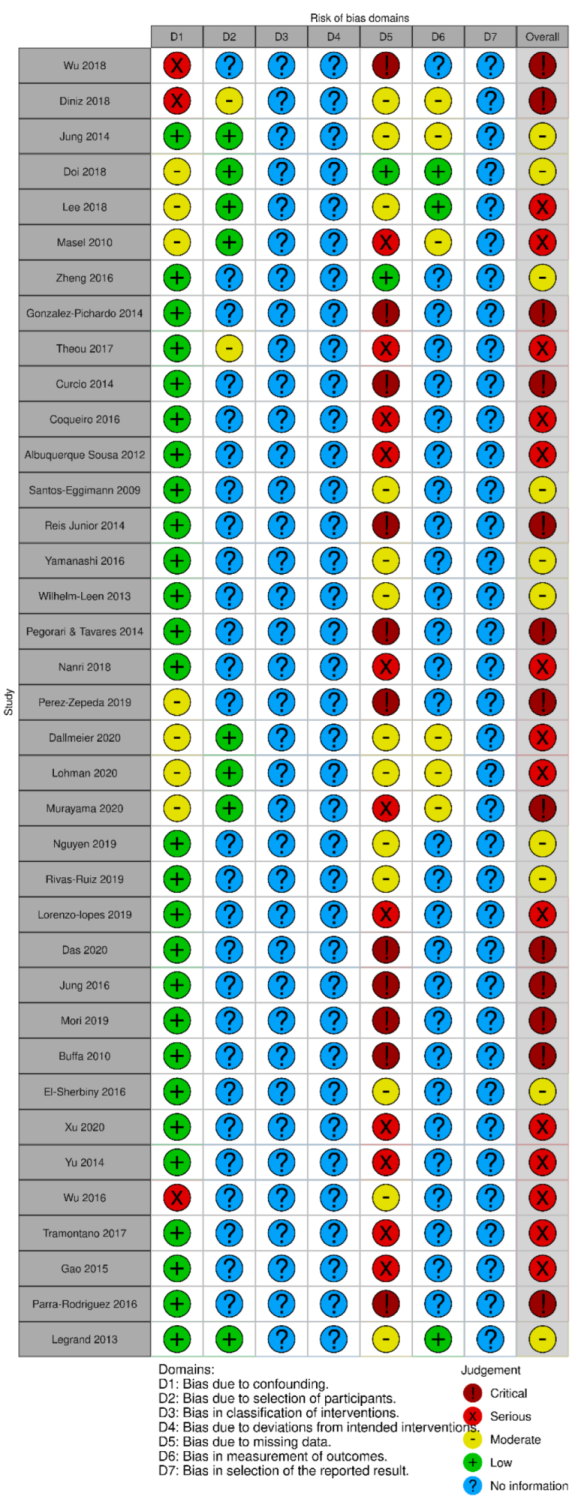
3.6. Risk of Bias Assessment
4. Discussion
5. Conclusions
Supplementary Materials
Author Contributions
Funding
Institutional Review Board Statement
Informed Consent Statement
Data Availability Statement
Acknowledgments
Conflicts of Interest
References
- Lunenfeld, B.; Stratton, P. The clinical consequences of an ageing world and preventive strategies. Best Pract. Res. Clin. Obstet. Gynaecol. 2013, 27, 643–659. [Google Scholar] [CrossRef] [PubMed] [Green Version]
- United Nations. World Population Prospects 2019 Highlights. 2019. Available online: https://population.un.org/wpp/Publications/Files/WPP2019_Highlights.pdf (accessed on 21 March 2022).
- UK Government, Office for National Statistics. Overview of the UK Population: January 2021. 2021. Available online: https://www.ons.gov.uk/peoplepopulationandcommunity/populationandmigration/populationestimates/articles/overviewoftheukpopulation/january2021 (accessed on 18 January 2022).
- World Health Organization. Decade of Healthy Ageing: Plan of Action. 2020. Available online: https://www.who.int/publications/m/item/decade-of-healthy-ageing-plan-of-action (accessed on 13 June 2020).
- MacNee, W.; Rabinovich, R.A.; Choudhury, G. Ageing and the border between health and disease. Eur. Respir. J. 2014, 44, 1332–1352. [Google Scholar] [CrossRef] [PubMed] [Green Version]
- Cruz-Jentoft, A.J.; Kiesswetter, E.; Drey, M.; Sieber, C.C. Nutrition, frailty, and sarcopenia. Aging Clin. Exp. Res. 2017, 29, 43–48. [Google Scholar] [CrossRef] [PubMed]
- Russell, C.; Elia, M. Combating Malnutrition: Recommendations for Action; BAPEN: Redditch, UK, 2008; Available online: https://www.bapen.org.uk/pdfs/reports/advisory_group_report.pdf (accessed on 8 March 2022).
- Robinson, S.M. Improving nutrition to support healthy ageing: What are the opportunities for intervention? Proc. Nutr. Soc. 2018, 77, 257–264. [Google Scholar] [CrossRef]
- Laur, C.V.; McNicholl, T.; Valaitis, R.; Keller, H.H. Malnutrition or frailty? Overlap and evidence gaps in the diagnosis and treatment of frailty and malnutrition. Appl. Physiol. Nutr. Metab. 2017, 42, 449–458. [Google Scholar] [CrossRef] [Green Version]
- Jeejeebhoy, K.N. Malnutrition, fatigue, frailty, vulnerability, sarcopenia and cachexia: Overlap of clinical features. Curr. Opin. Clin. Nutr. Metab. Care 2012, 15, 213–219. [Google Scholar] [CrossRef]
- Van Kan, G.A.; Vellas, B. Is the mini nutritional assessment an appropriate tool to assess frailty in older adults? J. Nutr. Health Aging 2011, 15, 159–161. [Google Scholar] [CrossRef]
- Dorner, T.; Luger, E.; Tschinderle, J.; Stein, K.; Haider, S.; Kapan, A.; Lackinger, C.; Schindler, K. Association between nutritional status (MNA®-SF) and frailty (SHARE-FI) in acute hospitalised elderly patients. J. Nutr. Health Aging 2014, 18, 264–269. [Google Scholar] [CrossRef]
- Valentini, A.; Federici, M.; Cianfarani, M.A.; Tarantino, U.; Bertoli, A. Frailty and nutritional status in older people: The Mini Nutritional Assessment as a screening tool for the identification of frail subjects. Clin. Interv. Aging 2018, 13, 1237. [Google Scholar] [CrossRef] [Green Version]
- Gale, C.R.; Cooper, C.; Aihie Sayer, A. Prevalence of frailty and disability: Findings from the English Longitudinal Study of Ageing. Age Ageing 2014, 44, 162–165. [Google Scholar] [CrossRef] [Green Version]
- Santos-Eggimann, B.; Cuénoud, P.; Spagnoli, J.; Junod, J. Prevalence of frailty in middle-aged and older community-dwelling Europeans living in 10 countries. J. Gerontol. A Biol. Sci. Med. Sci. 2009, 64, 675–681. [Google Scholar] [CrossRef] [PubMed] [Green Version]
- Hanlon, P.; Nicholl, B.I.; Jani, B.D.; Lee, D.; McQueenie, R.; Mair, F.S. Frailty and pre-frailty in middle-aged and older adults and its association with multimorbidity and mortality: A prospective analysis of 493 737 UK Biobank participants. Lancet Public Health 2018, 3, e323–e332. [Google Scholar] [CrossRef]
- Gordon, S.; Baker, N.; Kidd, M.; Maeder, A.; Grimmer, K. Pre-frailty factors in community-dwelling 40–75 year olds: Opportunities for successful ageing. BMC Geriatr. 2020, 20, 96. [Google Scholar] [CrossRef] [PubMed]
- Cruz-Jentoft, A.J.; Bahat, G.; Bauer, J.; Boirie, Y.; Bruyère, O.; Cederholm, T.; Cooper, C.; Landi, F.; Rolland, Y.; Sayer, A.A. Sarcopenia: Revised European consensus on definition and diagnosis. Age Ageing 2018, 48, 16–31. [Google Scholar] [CrossRef] [Green Version]
- Mijnarends, D.M.; Schols, J.M.; Meijers, J.M.; Tan, F.E.; Verlaan, S.; Luiking, Y.C.; Morley, J.E.; Halfens, R.J. Instruments to assess sarcopenia and physical frailty in older people living in a community (care) setting: Similarities and discrepancies. J. Am. Med. Dir. Assoc. 2015, 16, 301–308. [Google Scholar] [CrossRef]
- Reijnierse, E.M.; Trappenburg, M.C.; Blauw, G.J.; Verlaan, S.; de van der Schueren, M.A.; Meskers, C.G.; Maier, A.B. Common ground? The concordance of sarcopenia and frailty definitions. J. Am. Med. Dir. Assoc. 2016, 17, 371.e7–371.e12. [Google Scholar] [CrossRef]
- Dhillon, R.J.; Hasni, S. Pathogenesis and Management of Sarcopenia. Clin. Geriatr. Med. 2017, 33, 17–26. [Google Scholar] [CrossRef] [Green Version]
- Papadopoulou, S.K. Sarcopenia: A contemporary health problem among older adult populations. Nutrients 2020, 12, 1293. [Google Scholar] [CrossRef]
- Visvanathan, R.; Newbury, J.W.; Chapman, I. Malnutrition in older people—Screening and management strategies. Aust. Fam. Physician 2004, 33, 799–805. [Google Scholar]
- Miller, M.D.; Thomas, J.M.; Cameron, I.D.; Chen, J.S.; Sambrook, P.N.; March, L.M.; Cumming, R.G.; Lord, S.R. BMI: A simple, rapid and clinically meaningful index of under-nutrition in the oldest old? Br. J. Nutr. 2009, 101, 1300–1305. [Google Scholar] [CrossRef] [Green Version]
- Misu, S.; Asai, T.; Doi, T.; Sawa, R.; Ueda, Y.; Saito, T.; Nakamura, R.; Murata, S.; Sugimoto, T.; Yamada, M. Association between gait abnormality and malnutrition in a community-dwelling elderly population. Geriatr. Gerontol. Int. 2017, 17, 1155–1160. [Google Scholar] [CrossRef] [PubMed]
- Gn, Y.M.; Abdullah, H.R.; Loke, W.; Sim, Y.E. Prevalence and risk factors of preoperative malnutrition risk in older patients and its impact on surgical outcomes: A retrospective observational study. Can. J. Anaesth. 2021, 68, 622–632. [Google Scholar] [CrossRef] [PubMed]
- Sanchez-Rodriguez, D.; Locquet, M.; Reginster, J.Y.; Cavalier, E.; Bruyère, O.; Beaudart, C. Mortality in malnourished older adults diagnosed by ESPEN and GLIM criteria in the SarcoPhAge study. J. Cachexia Sarcopenia Muscle 2020, 11, 1200–1211. [Google Scholar] [CrossRef] [PubMed]
- Hernández-Galiot, A.; Goñi, I. Quality of life and risk of malnutrition in a home-dwelling population over 75 years old. Nutrition 2017, 35, 81–86. [Google Scholar] [CrossRef] [PubMed]
- Fried, L.P.; Tangen, C.M.; Walston, J.; Newman, A.B.; Hirsch, C.; Gottdiener, J.; Seeman, T.; Tracy, R.; Kop, W.J.; Burke, G. Frailty in older adults: Evidence for a phenotype. J. Gerontol. A Biol. Sci. Med. Sci. 2001, 56, M146–M157. [Google Scholar] [CrossRef]
- Topinková, E. Aging, disability and frailty. Ann. Nutr. Metab. 2008, 52, 6–11. [Google Scholar] [CrossRef]
- Walters, K.; Frost, R.; Kharicha, K.; Avgerinou, C.; Gardner, B.; Ricciardi, F.; Hunter, R.; Liljas, A.; Manthorpe, J.; Drennan, V. Home-based health promotion for older people with mild frailty: The HomeHealth intervention development and feasibility RCT. Health Technol Assess 2017, 21, 1. [Google Scholar] [CrossRef] [Green Version]
- Muscedere, J.; Waters, B.; Varambally, A.; Bagshaw, S.M.; Boyd, J.G.; Maslove, D.; Sibley., S.; Rockwood, K. The impact of frailty on intensive care unit outcomes: A systematic review and meta-analysis. Intensive Care Med. 2017, 43, 1105–1122. [Google Scholar] [CrossRef] [Green Version]
- Buch, A.; Carmeli, E.; Boker, L.K.; Marcus, Y.; Shefer, G.; Kis, O.; Berner, Y.; Stern, N. Muscle function and fat content in relation to sarcopenia, obesity and frailty of old age—An overview. Exp. Gerontol. 2016, 76, 25–32. [Google Scholar] [CrossRef]
- Cruz-Jentoft, A.J.; Baeyens, J.P.; Bauer, J.M.; Boirie, Y.; Cederholm, T.; Landi, F.; Martin, F.C.; Michel, J.-P.; Rolland, Y.; Schneider, S.M. Sarcopenia: European consensus on definition and diagnosisReport of the European Working Group on Sarcopenia in Older People. Age Ageing 2010, 39, 412–423. [Google Scholar] [CrossRef] [Green Version]
- Manrique-Espinoza, B.; Salinas-Rodríguez, A.; Rosas-Carrasco, O.; Gutiérrez-Robledo, L.M.; Avila-Funes, J.A. Sarcopenia is associated with physical and mental components of health-related quality of life in older adults. J. Am. Med. Dir. Assoc. 2017, 18, 636.e1–636.e5. [Google Scholar] [CrossRef] [PubMed]
- Verlaan, S.; Aspray, T.J.; Bauer, J.M.; Cederholm, T.; Hemsworth, J.; Hill, T.R.; McPhee, J.S.; Piasecki, M.; Seal, C.; Sieber, C.C. Nutritional status, body composition, and quality of life in community-dwelling sarcopenic and non-sarcopenic older adults: A case-control study. Clin. Nutr. 2017, 36, 267–274. [Google Scholar] [CrossRef] [PubMed] [Green Version]
- Chang, K.-V.; Hsu, T.-H.; Wu, W.-T.; Huang, K.-C.; Han, D.-S. Association between sarcopenia and cognitive impairment: A systematic review and meta-analysis. J. Am. Med. Dir. Assoc. 2016, 17, 1164.e7–1164.e15. [Google Scholar] [CrossRef] [PubMed]
- Beaudart, C.; Rizzoli, R.; Bruyère, O.; Reginster, J.-Y.; Biver, E. Sarcopenia: Burden and challenges for public health. Arch. Public Health 2014, 72, 45. [Google Scholar] [CrossRef] [PubMed] [Green Version]
- Gingrich, A.; Volkert, D.; Kiesswetter, E.; Thomanek, M.; Bach, S.; Sieber, C.C.; Zopf, Y. Prevalence and overlap of sarcopenia, frailty, cachexia and malnutrition in older medical inpatients. BMC Geriatr 2019, 19, 1–10. [Google Scholar] [CrossRef] [Green Version]
- Sipila, S.; Narici, M.; Kjaer, M.; Pollanen, E.; Atkinson, R.A.; Hansen, M.; Kovanen, V. Sex hormones and skeletal muscle weakness. Biogerontology 2013, 14, 231–245. [Google Scholar] [CrossRef]
- Park, S.; Ham, J.O.; Lee, B.K. A positive association of vitamin D deficiency and sarcopenia in 50 year old women, but not men. Clin. Nutr. 2014, 33, 900–905. [Google Scholar] [CrossRef]
- Bijlsma, A.Y.; Meskers, C.G.; Ling, C.H.; Narici, M.; Kurrle, S.E.; Cameron, I.D.; Westendorp, R.G.; Maier, A.B. Defining sarcopenia: The impact of different diagnostic criteria on the prevalence of sarcopenia in a large middle aged cohort. Age 2013, 35, 871–881. [Google Scholar] [CrossRef] [Green Version]
- Corcoran, C.; Murphy, C.; Culligan, E.P.; Walton, J.; Sleator, R.D. Malnutrition in the elderly. Sci. Prog. 2019, 102, 171–180. [Google Scholar] [CrossRef]
- Page, M.J.; McKenzie, J.E.; Bossuyt, P.M.; Boutron, I.; Hoffmann, T.C.; Mulrow, C.D.; Shamseer, L.; Tetzlaff, J.M.; Akl, E.A.; Brennan, S.E.; et al. The PRISMA 2020 statement: An updated guideline for reporting systematic reviews. BMJ 2021, 372, n71. [Google Scholar] [CrossRef]
- Babineau, J. Product Review: Covidence (Systematic Review Software). J. Can. Health Lib. Ass. 2014, 35, 68–71. [Google Scholar] [CrossRef]
- Sterne, J.; Hernán, M.; McAleenan, A.; Higgins, J.; Thomas, J.; Chandler, J. Chapter 25: Assessing risk of bias in a non-randomized study. In Cochrane Handbook for Systematic Reviews of Interventions, 2nd ed.; Cochrane Collaboration: London, UK, 2019. [Google Scholar]
- Gonzalez-Pichardo, A.; Navarrete-Reyes, A.; Adame-Encarnación, H.; Aguilar-Navarro, S.; García-Lara, J.; Amieva, H.; Avila-Funes, J. Association between self-reported health status and frailty in community-dwelling elderly. J. Frailty Aging 2014, 3, 104–108. [Google Scholar] [CrossRef] [PubMed]
- Curcio, C.-L.; Henao, G.-M.; Gomez, F. Frailty among rural elderly adults. BMC Geriatr. 2014, 14, 2. [Google Scholar] [CrossRef] [PubMed] [Green Version]
- Da Silva Coqueiro, R.; de Queiroz, B.M.; Oliveira, D.S.; das Merces, M.C.; Oliveira Carneiro, J.A.; Pereira, R.; Fernandes, M.H. Cross-sectional relationships between sedentary behavior and frailty in older adults. J. Sports Med. Phys. Fit. 2016, 57, 825–830. [Google Scholar] [CrossRef]
- Mori, H.; Tokuda, Y. Differences and overlap between sarcopenia and physical frailty in older community-dwelling Japanese. Asia Pac. J. Clin. Nutr. 2019, 28, 157. [Google Scholar] [CrossRef]
- Perez-Zepeda, M.U.; García-Peña, C.; Carrillo-Vega, M.F. Individual and cumulative association of commonly used biomarkers on frailty: A cross-sectional analysis of the Mexican Health and Aging Study. Aging Clin. Exp. Res. 2019, 31, 1429–1434. [Google Scholar] [CrossRef]
- Yamanashi, H.; Shimizu, Y.; Koyamatsu, J.; Nobuyoshi, M.; Nagayoshi, M.; Kadota, K.; Tamai, M.; Maeda, T. Multiple somatic symptoms and frailty: Cross-sectional study in Japanese community-dwelling elderly people. Fam. Pract. 2016, 33, 453–460. [Google Scholar] [CrossRef] [Green Version]
- Wilhelm-Leen, E.R.; Hall, Y.N.; Horwitz, R.I.; Chertow, G.M. Phase angle, frailty and mortality in older adults. J. Gen. Intern. Med. 2014, 29, 147–154. [Google Scholar] [CrossRef] [Green Version]
- Tramontano, A.; Veronese, N.; Sergi, G.; Manzato, E.; Rodriguez-Hurtado, D.; Maggi, S.; Trevisan, C.; De Zaiacomo, F.; Giantin, V. Prevalence of sarcopenia and associated factors in the healthy older adults of the Peruvian Andes. Arch. Gerontol. Geriatr. 2017, 68, 49–54. [Google Scholar] [CrossRef]
- Reis Junior, W.M.; Carneiro, J.A.O.; Coqueiro, R.d.S.; Santos, K.T.; Fernandes, M.H. Pre-frailty and frailty of elderly residents in a municipality with a low Human Development Index. Rev. Lat. Am. Enferm. 2014, 22, 654–661. [Google Scholar] [CrossRef] [Green Version]
- Xu, W.; Chen, T.; Cai, Y.; Hu, Y.; Fan, L.; Wu, C. Sarcopenia in Community-Dwelling Oldest Old is Associated with Disability and Poor Physical Function. J. Nutr. Health Aging 2020, 24, 339–345. [Google Scholar] [CrossRef] [PubMed]
- Rivas-Ruiz, F.; Machón, M.; Contreras-Fernández, E.; Vrotsou, K.; Padilla-Ruiz, M.; Díez Ruiz, A.I.; de Mesa Berenguer, Y.; Vergara, I. Prevalence of frailty among community-dwelling elderly persons in Spain and factors associated with it. Eur. J. Gen. Pract. 2019, 25, 190–196. [Google Scholar] [CrossRef] [PubMed]
- Pegorari, M.S.; Tavares, D.M.d.S. Factors associated with the frailty syndrome in elderly individuals living in the urban area. Rev. Lat. Am. Enferm. 2014, 22, 874–882. [Google Scholar] [CrossRef] [PubMed] [Green Version]
- Parra-Rodríguez, L.; Szlejf, C.; García-González, A.I.; Malmstrom, T.K.; Cruz-Arenas, E.; Rosas-Carrasco, O. Cross-cultural adaptation and validation of the Spanish-language version of the SARC-F to assess sarcopenia in Mexican community-dwelling older adults. J. Am. Med. Dir. Assoc. 2016, 17, 1142–1146. [Google Scholar] [CrossRef] [PubMed]
- Nanri, H.; Yamada, Y.; Yoshida, T.; Okabe, Y.; Nozawa, Y.; Itoi, A.; Yoshimura, E.; Watanabe, Y.; Yamaguchi, M.; Yokoyama, K. Sex difference in the association between protein intake and frailty: Assessed using the Kihon Checklist Indexes among older adults. J. Am. Med. Dir. Assoc. 2018, 19, 801–805. [Google Scholar] [CrossRef]
- Jung, H.W.; Jang, I.Y.; Lee, Y.S.; Lee, C.K.; Cho, E.I.; Kang, W.Y.; Chae, J.H.; Lee, E.J.; Kim, D.H. Prevalence of Frailty and Aging-Related Health Conditions in Older Koreans in Rural Communities: A Cross-Sectional Analysis of the Aging Study of Pyeongchang Rural Area. J. Korean Med. Sci. 2016, 31, 345–352. [Google Scholar] [CrossRef]
- Gao, L.; Jiang, J.; Yang, M.; Hao, Q.; Luo, L.; Dong, B. Prevalence of sarcopenia and associated factors in Chinese community-dwelling elderly: Comparison between rural and urban areas. J. Am. Med. Dir. Assoc. 2015, 16, 1003.e1–1003.e6. [Google Scholar] [CrossRef]
- El-Sherbiny, N.A.; Younis, A.; Masoud, M. A comprehensive assessment of the physical, nutritional, and psychological health status of the elderly populace in the Fayoum Governorate (Egypt). Arch. Gerontol. Geriatr. 2016, 66, 119–126. [Google Scholar] [CrossRef]
- De Albuquerque Sousa, A.C.P.; Dias, R.C.; Maciel, Á.C.C.; Guerra, R.O. Frailty syndrome and associated factors in community-dwelling elderly in Northeast Brazil. Arch. Gerontol. Geriatr. 2012, 54, e95–e101. [Google Scholar] [CrossRef]
- Buffa, R.; Floris, G.; Lodde, M.; Cotza, M.; Marini, E. Nutritional status in the healthy longeval population from Sardinia (Italy). J. Nutr. Health Aging 2010, 14, 97–102. [Google Scholar] [CrossRef]
- Jung, H.W.; Kim, S.W.; Lim, J.Y.; Kim, K.W.; Jang, H.C.; Kim, C.H.; Kim, K.I. Frailty status can predict further lean body mass decline in older adults. J. Am. Geriatr. Soc. 2014, 62, 2110–2117. [Google Scholar] [CrossRef] [PubMed]
- Lee, Y.; Kim, J.; Chon, D.; Lee, K.-E.; Kim, J.-H.; Myeong, S.; Kim, S. The effects of frailty and cognitive impairment on 3-year mortality in older adults. Maturitas 2018, 107, 50–55. [Google Scholar] [CrossRef] [PubMed]
- Theou, O.; Blodgett, J.M.; Godin, J.; Rockwood, K. Association between sedentary time and mortality across levels of frailty. CMAJ 2017, 189, E1056–E1064. [Google Scholar] [CrossRef] [Green Version]
- Legrand, D.; Vaes, B.; Mathei, C.; Swine, C.; Degryse, J. The prevalence of sarcopenia in very old individuals according to the European consensus definition: Insights from the BELFRAIL study. Age Ageing 2013, 42, 727–734. [Google Scholar] [CrossRef] [PubMed] [Green Version]
- Lohman, M.C.; Sonnega, A.J.; Resciniti, N.V.; Leggett, A.N. Frailty Phenotype and Cause-Specific Mortality in the United States. J. Gerontol. A Biol. Sci. Med. Sci. 2020, 75, 1935–1942. [Google Scholar] [CrossRef] [PubMed]
- Lorenzo-López, L.; López-López, R.; Maseda, A.; Buján, A.; Rodríguez-Villamil, J.L.; Millán-Calenti, J.C. Changes in frailty status in a community-dwelling cohort of older adults: The VERISAÚDE study. Maturitas 2019, 119, 54–60. [Google Scholar] [CrossRef]
- Murayama, H.; Kobayashi, E.; Okamoto, S.; Fukaya, T.; Ishizaki, T.; Liang, J.; Shinkai, S. National prevalence of frailty in the older Japanese population: Findings from a nationally representative survey. Arch. Gerontol. Geriatr. 2020, 91, 104220. [Google Scholar] [CrossRef]
- Wu, C.; Smit, E.; Xue, Q.-L.; Odden, M.C. Prevalence and correlates of frailty among community-dwelling Chinese older adults: The China Health and Retirement Longitudinal Study. J. Gerontol. A Biol. Sci. Med. Sci. 2018, 73, 102–108. [Google Scholar] [CrossRef] [Green Version]
- Diniz, M.A.; Rodrigues, R.A.P.; Fhon, J.R.S.; Haas, V.J.; Fabricio-Wehbe, S.C.C.; Giacomini, S.B.L.; Almeida, V.C. Frailty and its relationship to mortality among older adults from a Brazilian community: A cohort study. J. Clin. Gerontol. Geriatr. 2018, 9, 27–33. [Google Scholar] [CrossRef] [Green Version]
- Doi, T.; Makizako, H.; Tsutsumimoto, K.; Nakakubo, S.; Kim, M.J.; Kurita, S.; Hotta, R.; Shimada, H. Transitional status and modifiable risk of frailty in Japanese older adults: A prospective cohort study. Geriatr. Gerontol. Int. 2018, 18, 1562–1566. [Google Scholar] [CrossRef]
- Masel, M.; Ostir, G.V.; Ottenbacher, K.J. Frailty, mortality, and health-related quality of life in older Mexican Americans. J. Am. Geriatr. Soc. 2010, 58, 2149–2153. [Google Scholar] [CrossRef] [PubMed] [Green Version]
- Zheng, Z.; Guan, S.; Ding, H.; Wang, Z.; Zhang, J.; Zhao, J.; Ma, J.; Chan, P. Prevalence and incidence of frailty in community-dwelling older people: Beijing Longitudinal Study of Aging II. J. Am. Geriatr. Soc. 2016, 64, 1281–1286. [Google Scholar] [CrossRef] [PubMed]
- Das, A.; Cumming, R.G.; Naganathan, V.; Blyth, F.; Ribeiro, R.V.; Couteur, D.G.L.; Handelsman, D.J.; Waite, L.M.; Simpson, S.J.; Hirani, V. Prospective Associations Between Dietary Antioxidant Intake and Frailty in Older Australian Men: The Concord Health and Ageing in Men Project. J. Gerontol. A Biol. Sci. Med. Sci. 2020, 75, 348–356. [Google Scholar] [CrossRef] [PubMed]
- Nguyen, Q.D.; Wu, C.; Odden, M.C.; Kim, D.H. Multimorbidity Patterns, Frailty, and Survival in Community-Dwelling Older Adults. J. Gerontol. A Biol. Sci. Med. Sci. 2019, 74, 1265–1270. [Google Scholar] [CrossRef] [Green Version]
- Dallmeier, D.; Braisch, U.; Rapp, K.; Klenk, J.; Rothenbacher, D.; Denkinger, M.; Group, A.S. Frailty Index and Sex-Specific 6-Year Mortality in Community-Dwelling Older People: The ActiFE Study. J. Gerontol. A Biol. Sci. Med. Sci. 2020, 75, 366–373. [Google Scholar] [CrossRef]
- Yu, R.; Wong, M.; Leung, J.; Lee, J.; Auyeung, T.W.; Woo, J. Incidence, reversibility, risk factors and the protective effect of high body mass index against sarcopenia in community-dwelling older Chinese adults. Geriatr. Gerontol. Int. 2014, 14, 15–28. [Google Scholar] [CrossRef]
- Wu, T.-Y.; Liaw, C.-K.; Chen, F.-C.; Kuo, K.-L.; Chie, W.-C.; Yang, R.-S. Sarcopenia screened with SARC-F questionnaire is associated with quality of life and 4-year mortality. J. Am. Med. Dir. Assoc. 2016, 17, 1129–1135. [Google Scholar] [CrossRef]
- Lee, J.; Finucane, T. Thought for food: Is nutritional supplementation an effective treatment for malnutrition? J. Am. Geriatr. Soc. 2013, 61, S161. [Google Scholar] [CrossRef]
- Carey, E.; Covinsky, K.; Lui, L.; Eng, C.; Sands, L.; Walter, L. Prediction of Mortality in Community-Living Frail Elderly People with Long-Term Care Needs. J. Am. Geriatr. Soc. 2008, 56, 68–75. [Google Scholar] [CrossRef]
- Mitoku, K.; Shimanouchi, S. Home modification and prevention of frailty progression in older adults: A Japanese prospective cohort study. J. Gerontol. Nurs. 2014, 40, 40–47. [Google Scholar] [CrossRef] [Green Version]
- Sim, M.; Prince, R.L.; Scott, D.; Daly, R.M.; Duque, G.; Inderjeeth, C.A.; Zhu, K.; Woodman, R.J.; Hodgson, J.M.; Lewis, J.R. Sarcopenia definitions and their associations with mortality in older Australian women. J. Am. Med. Dir. Assoc. 2019, 20, 76–82.e2. [Google Scholar] [CrossRef] [PubMed]
- Ambagtsheer, R.C.; Beilby, J.; Dabravolskaj, J.; Abbasi, M.; Archibald, M.M.; Dent, E. Application of an electronic Frailty Index in Australian primary care: Data quality and feasibility assessment. Aging Clin. Exp. Res. 2019, 31, 653–660. [Google Scholar] [CrossRef] [PubMed]
- Kabir, Z.N.; Ferdous, T.; Cederholm, T.; Khanam, M.A.; Streatfied, K.; Wahlin, Å. Mini Nutritional Assessment of rural elderly people in Bangladesh: The impact of demographic, socio-economic and health factors. Public Health Nutr. 2006, 9, 968–974. [Google Scholar] [CrossRef] [PubMed] [Green Version]
- Kurkcu, M.; Meijer, R.; Lonterman, S.; Muller, M.; de van der Schueren, M. The association between nutritional status and frailty characteristics among geriatric outpatients. Clin. Nutr. ESPEN 2018, 23, 112–116. [Google Scholar] [CrossRef]
- Huang, C.-Y.; Lee, W.-J.; Lin, H.-P.; Chen, R.-C.; Lin, C.-H.; Peng, L.-N.; Chen, L.-K. Epidemiology of frailty and associated factors among older adults living in rural communities in Taiwan. Arch. Gerontol. Geriatr. 2020, 87, 103986. [Google Scholar] [CrossRef]
- Cereda, E.; Pedrolli, C.; Klersy, C.; Bonardi, C.; Quarleri, L.; Cappello, S.; Turri, A.; Rondanelli, M.; Caccialanza, R. Nutritional status in older persons according to healthcare setting: A systematic review and meta-analysis of prevalence data using MNA®. Clin. Nutr. 2016, 35, 1282–1290. [Google Scholar] [CrossRef]
- Isautier, J.M.; Bosnić, M.; Yeung, S.S.; Trappenburg, M.C.; Meskers, C.G.; Whittaker, A.C.; Maier, A.B. Validity of nutritional screening tools for community-dwelling older adults: A systematic review and meta-analysis. J. Am. Med. Dir. Assoc. 2019, 20, 1351.e13–1351.e25. [Google Scholar] [CrossRef]
- Schilp, J.; Kruizenga, H.M.; Wijnhoven, H.A.; Leistra, E.; Evers, A.M.; van Binsbergen, J.J.; Deeg, D.J.; Visser, M. High prevalence of undernutrition in Dutch community-dwelling older individuals. Nutrition 2012, 28, 1151–1156. [Google Scholar] [CrossRef] [Green Version]
- Collard, R.M.; Boter, H.; Schoevers, R.A.; Oude Voshaar, R.C. Prevalence of frailty in community-dwelling older persons: A systematic review. J. Am. Geriatr. Soc. 2012, 60, 1487–1492. [Google Scholar] [CrossRef]
- Makizako, H.; Nakai, Y.; Tomioka, K.; Taniguchi, Y. Prevalence of sarcopenia defined using the Asia working Group for Sarcopenia criteria in Japanese community-dwelling older adults: A systematic review and meta-analysis. Phys. Res. 2019, 22, 53–57. [Google Scholar] [CrossRef] [Green Version]
- Shafiee, G.; Keshtkar, A.; Soltani, A.; Ahadi, Z.; Larijani, B.; Heshmat, R. Prevalence of sarcopenia in the world: A systematic review and meta-analysis of general population studies. J. Diabetes Metab. Disord 2017, 16, 1–10. [Google Scholar] [CrossRef] [PubMed] [Green Version]
- Papadopoulou, S.; Tsintavis, P.; Potsaki, G.; Papandreou, D. Differences in the prevalence of sarcopenia in community-dwelling, nursing home and hospitalized individuals. A systematic review and meta-analysis. J. Nutr. Health Aging 2020, 24, 83–90. [Google Scholar] [CrossRef] [PubMed]
- Liu, P.; Hao, Q.; Hai, S.; Wang, H.; Cao, L.; Dong, B. Sarcopenia as a predictor of all-cause mortality among community-dwelling older people: A systematic review and meta-analysis. Maturitas 2017, 103, 16–22. [Google Scholar] [CrossRef] [PubMed]
- Dent, E.; Hoogendijk, E.; Visvanathan, R.; Wright, O. Malnutrition screening and assessment in hospitalised older people: A review. J. Nutr. Health Aging 2019, 23, 431–441. [Google Scholar] [CrossRef]
- Mayhew, A.; Amog, K.; Phillips, S.; Parise, G.; McNicholas, P.; De Souza, R.; Thabane, L.; Raina, P. The prevalence of sarcopenia in community-dwelling older adults, an exploration of differences between studies and within definitions: A systematic review and meta-analyses. Age Ageing 2019, 48, 48–56. [Google Scholar] [CrossRef] [Green Version]
- Bredella, M.A. Sex differences in body composition. Adv. Exp. Med. Biol. 2017, 1043, 9–27. [Google Scholar] [CrossRef]
- Lemieux, S.; Prud’homme, D.; Bouchard, C.; Tremblay, A.; Després, J.-P. Sex differences in the relation of visceral adipose tissue accumulation to total body fatness. Am. J. Clin. Nutr. 1993, 58, 463–467. [Google Scholar] [CrossRef]
- Kushwaha, S.; Kiran, T.; Srivastava, R.; Jain, R.; Khanna, P.; Singh, T. Estimates of malnutrition and risk of malnutrition among the elderly (≥60 years) in India: A systematic review and meta-analysis. Ageing Res. Rev. 2020, 63, 101137. [Google Scholar] [CrossRef]
- Gordon, E.; Peel, N.; Samanta, M.; Theou, O.; Howlett, S.; Hubbard, R. Sex differences in frailty: A systematic review and meta-analysis. Exp. Gerontol. 2017, 89, 30–40. [Google Scholar] [CrossRef]
- Porter Starr, K.N.; McDonald, S.R.; Bales, C.W. Nutritional Vulnerability in Older Adults: A Continuum of Concerns. Curr. Nutr. Rep. 2015, 4, 176–184. [Google Scholar] [CrossRef] [Green Version]
- Ligthart-Melis, G.C.; Luiking, Y.C.; Kakourou, A.; Cederholm, T.; Maier, A.B.; de van der Schueren, M.A.E. Frailty, Sarcopenia, and Malnutrition Frequently (Co-)occur in Hospitalized Older Adults: A Systematic Review and Meta-analysis. J. Am. Med. Dir. Assoc. 2020, 21, 1216–1228. [Google Scholar] [CrossRef] [PubMed]
- DiPietro, N.A. Methods in epidemiology: Observational study designs. Pharmacotherapy 2010, 30, 973–984. [Google Scholar] [CrossRef] [Green Version]
- Damayanthi, H.D.W.T.; Moy, F.M.; Abdullah, K.L.; Dharmaratne, S.D. Prevalence of malnutrition and associated factors among community-dwelling older persons in Sri Lanka: A cross-sectional study. BMC Geriatr. 2018, 18, 199. [Google Scholar] [CrossRef] [PubMed]
- Lahiri, S.; Biswas, A.; Santra, S.; Lahiri, S.K. Assessment of nutritional status among elderly population in a rural area of West Bengal, India. Int. J. Med. Sci. Public Health 2015, 4, 569–572. [Google Scholar] [CrossRef] [Green Version]
- Syddall, H.; Roberts, H.C.; Evandrou, M.; Cooper, C.; Bergman, H.; Sayer, A.A. Prevalence and correlates of frailty among community-dwelling older men and women: Findings from the Hertfordshire Cohort Study. Age Ageing 2010, 39, 197–203. [Google Scholar] [CrossRef] [PubMed] [Green Version]
- Han, C.Y.; Miller, M.; Yaxley, A.; Baldwin, C.; Woodman, R.; Sharma, Y. Effectiveness of combined exercise and nutrition interventions in prefrail or frail older hospitalised patients: A systematic review and meta-analysis. BMJ Open 2020, 10, e040146. [Google Scholar] [CrossRef] [PubMed]


| Author (Year) | Sample N | Age in Years Mean (SD) | Gender n (%) | BMI kg/m2 Mean (SD) |
|---|---|---|---|---|
| Undernutrition | ||||
| Buffa (2010) [65] | 200 | 81 (7) | M 100 (50) F 100 (50) | 26.6 (3) |
| El-Sherbiny (2016) [63] | 2219 | 69 (7) | M 1165 (53) F 1054 (48) | |
| Frailty | ||||
| Wu (2018) [73] | 5301 | 60≤ | M 2682 (51) F 2619 (49) | |
| Diniz (2018) [74] | T1 515 T2 262 | T1 75 (7) T2 79 (6) Death 79 (8) | T1:M 168 (33) F 347 (67) T2:M 88 (34) F 174 (66) | |
| Doi (2018) [75] | 4676 | R 71 (4) PF 72 (6) Frail 77 (6) | M 2316 (50) F 2360 (51) | R 24 (3), PF 24 (3), Frail 23 (4) |
| Jung (2014) [66] | 341 | LMI, Median (IQR): No Decline 69 (72–67) Decline 70 (74–67) | M 178 (52) F 163 (48) | LMI, Median (IQR): No Decline 24 (22–26) Decline 25 (23–27) |
| Lee (2018) [67] | 11,266 | 73 (7) | M 4540 (40) F 6726 (60) | |
| Masel (2010) [76] | 1008 | 82 (5) | M 371 (37) F 637 (63) | N (%): underwt 13 (1), healthy 332 (33), overwt 404 (40), obese 259 (26). |
| Zheng (2016) [77] | 10,039 | 71 (8) | M 3885 (39) F 6154 (61) | |
| Gonzales-Pichardo (2013) [47] | 927 | 78 (6) | M 418 (45) F 509 (55) | |
| Theou (2017) [68] | 3141 | 63 (10) | M 1426 (45) F 1715 (55) | |
| Curcio (2014) [48] | 1878 | 71 (7) | M 897 (48) F 981 (52) | 24 (5) |
| Coqueiro (2017) [49] | 316 | 74 (10) | M 143 (45) F 173 (55) | - |
| Albuquerque (2012) [64] | 391 | 74 (7) | M 151 (37) F 240 (61) | - |
| Santos-Eggimann (2009) [15] | 18,227 | Two grps 50–64 and ≥65 | - | - |
| Reis Junior (2014) [55] | 236 | Three grps 60–69, 70–79 ≥80 | M 97 (41) F 139 (59) | N (%): Frail-Underwt 22 (29), Healthywt34 (27), Overwt 10 (13) PF-Underwt 46 (61), Healthywt 64 (50) Overwt 57 (71) |
| Yamanashi (2016) [52] | 1818 | 72.2 (8) | M 662 (36) F 1156 (64) | 23 (3) |
| Wilhelm-Leen (2013) [53] | 4667 | 60≤ | M 2288 (49) F 2379 (51) | - |
| Pegorari (2014) [58] | 958 | 74 (7) | M 341 (36) F 617 (64) | - |
| Nanri (2018) [60] | 5638 | M 73 (6) F 74 (6) | M 2707 (48) F 2931 (52) | M 23 (3) F 23 (3) |
| Perez-Zepeda (2019) [51] | 1128 | 69 (8) | M 550 (49) F 578 (51) | 28 (5) |
| Dallmeier (2020) [80] | 1204 | Median (IQR1,3) M 74 (70,82) F 73 (70, 80) | M 692 (58) F 512 (43) | M 28 (4) F 27 (5) |
| Lohman (2020) [70] | 10,490 | R 71 (0.1), PF 74 (0.2) Frail 79 (0.3) | M 4579 (44) F 5914 (56) | - |
| Murayama (2020) [72] | 2206 | Five grps: (65–69), (70–74), (75–79), (80–84), (85≤) | M 962 (44) F 1244 (56) | - |
| Nguyen (2019) [79] | 7197 | Six grps: 65–69 392 (19), 70–74 1541 (21), 75–79 1461 (20), 80–84 1422 (20), 85–89 859 (12), >90 522 (7) | M 3050 (42) F 4147 (58) | - |
| Rivas-Ruiz (2019) [57] | 855 | 78 (5) | M 402 (47) F 453 (53) | 29 (4) |
| Sarcopenia | ||||
| Yu (2014) [81] | 4000 | 73 (5) | M 2000 (50) F 2000 (50) | 24 (3) |
| Wu (2016) [82] | 670 | 76 (6) | M 340 (51) F 330 (49) | 24 (3) |
| Tramontan (2017) [54] | 222 | ≥65 | M 102 (46) F 120 (54) | Sarcopenia 21.1 (2.3) w/o Sarcopenia 24 (4.2) |
| Legrand (2013) [69] | 288 | 84.8 (3.6) | M 103 (35.8) F 185 (64.2) | Sarcopenia 23 (4.1) w/o Sarcopenia 27.8 (4.2) |
| Combination of two or more of undernutrition, frailty or sarcopenia | ||||
| Xu (2020) [56] | 664 | 86 (4) | M 281 (42) F 383 (58) | n(%)-Underwt 33 (5) Healthywt 299 (45) Overwt 256 (39) Obese 76 (12) |
| Gao (2015) [62] | 612 | Healthy 71 (6) Sarcopenia 77 (7) | M 254 (42) F 358 (58) | Sarcopenia 22 (3) w/o Sarcopenia 23 (3) |
| Jung (2016) [61] | 382 | 74 (7) | M 167 (44) F 215 (56) | - |
| Mori (2019) [50] | 331 | 72 (5) | M 93 (28) F 238 (72) | 23 (3) |
| Parra-Rodriguez (2016) [59] | 487 | 73 (8) | M 97 (20) F 390 (80) | 28 (5) |
| Lorenzo-lopes (2019) [71] | T1 749 T2 537 | T1 76 (7) T2 76 (7) | T1 M 295 (39) F 454 (61) T2 M 206 (38) F 331 (62) | MNA-SF n (%): T1 healthy 642 (86), at-risk 101 (14), maln 6 (0.4) T2 healthy 472 (88), at-risk 62 (12), maln 2 (0.4) |
| Das (2020) [78] | T1 794 T2 781 | 81 (5) | M 794 (100) F 781 (100) | 28 (4) |
| Author (Year) | Prevalence | |||
|---|---|---|---|---|
| Undernutrition | Tools Used | Normal n (%) | At Risk n (%) | Undernutrition n (%) |
| Buffa (2010) [65] | MNA | 107 (63) | 61 (36) | 2 (1) |
| El-Sherbiny (2016) [63] | MNASF | - | - | <70 years 648 (48) >70 years 522 (60) |
| Frailty | Tools used | Robust n (%) | Prefrailty n (%) | Frailty n (%) |
| Wu (2018) [73] | Physical Frailty Phenotype | 2216 (42) | 2714 (51) | 371 (7) |
| Diniz (2018) [74] | Edmonton Frail Scale | T1 156 (59) T2 75 (29) | T1 60 (23) T2 55 (21) | T146 (18) T2 58 (46) |
| Doi (2018) [75] | Fried Phenotype | 1978(42) | 2344 (50) | 354 (8) |
| Jung (2014) [66] | Fried Phenotype and LMI | No LMI 67 (43) LMI 59 (32) | No LMI 81 (52) LMI 104 (57) | No LMI 9 (5) LMI 21 (11) |
| Lee (2018) [67] | Fried Phenotype | 4654 (41) | 5716 (51) | 896 (8) |
| Masel (2010) [76] | Fried Phenotype | 263 (26) | 545 (54) | 200 (20) |
| Zheng (2016) [77] | Cumulative Deficit | 8803 (88) | - | 1236 (12) |
| Gonzales-Pichardo (2013) [47] | Fried Phenotype | 450 (49) | 347 (37) | 130 (14) |
| Theou (2017) [68] | 46-item FI | 766 (24) | 1121 (36) | 1254 (40) |
| Curcio (2014) [48] | Fried Phenotype | 654 (35) | 996 (53) | 228 (12) |
| Coqueiro (2017) [49] | Fried Phenotype | 241 (76) | - | 75 (24) |
| Albuquerque (2012) [64] | Fried Phenotype | 89 (23) | 235 (60) | 67 (17) |
| Santos-Eggimann (2009) [15] | Fried Phenotype | 50–64 years 5308 (59) 65+ years 3056 (41) | 50–64 years 3394 (37) 65+ years 3177 (42) | 50–64 years 372 (4) 65+ years 1277 (17) |
| Reis Junior (2014) [55] | Fried Phenotype | 41 (18) | 139 (59) | 56 (24) |
| Yamanashi (2016) [52] | Fried Phenotype | 1139 (63) | 635 (35) | 44 (2) |
| Wilhelm-Leen (2013) [53] | Fried Phenotype | M 2227 (97) F 2262 (95) | - | M 61 (3) F 117 (5) |
| Pegorari (2014) [58] | Fried Phenotype | M 122 (39) F 191 (61) | M 187 (36) F 353 (64) | M 32 (26) F 91 (74) |
| Nanri (2018) [60] | Kihon Checklist | M 1241 (46) F 1295 (44) | M 678 (25) F 735 (25) | M 788 (29) F 901 (31) |
| Perez-Zepeda (2019) [51] | 31-item FI | 827 (73) | - | 301 (27) |
| Dallmeier (2020) [80] | eFI | - | - | M 128 (18.5) F 133 (26) |
| Lohman (2020) [70] | Fried Phenotype | 3934 (38): M 1795 (50) F 1774 (50) | 5255 (50): M 2295 (43) F 3093 (57) | 1301 (12): M 489 (32) F 1044 (68) |
| Murayama (2020) [72] | Fried Phenotype | 1279 (50) | 1033 (41) | 220 (9) |
| Nguyen (2019) [79] | Fried Phenotype | 2213 (31) | 3647 (51) | 1337 (19) |
| Rivas-Ruiz (2019) [57] | Fried Phenotype | - | - | 216 (26) |
| Sarcopenia | Tools used | w/o Sarcopenia n (%) | Sarcopenia n (%) | |
| Yu (2014) [81] | EWGSOP Criteria | - | 361 (9) | |
| Wu (2016) [82] | SARC-F | 629 (94) | 41 (6) | |
| Tramontan (2017) [54] | EWGSOP Criteria | 183 (82) | 39 (18) | |
| Legrand (2013) [69] | EWGSOP Criteria | 252 (88) | 36 (12) | |
| Authors (Year) | Tool Used | Nutrition Status n (%) | Frailty n (%) | Sarcopenia n (%) | Combination n (%) |
|---|---|---|---|---|---|
| Xu (2020) [56] | MNA AWGS | Normal 466 (80) Under 116 (20) | - | S 427 (73) S 155 (27) | Normal + S 29 (19) Normal no S 347 (81) Under + S 78 (51) Under no S 211 (50) |
| Gao (2015) [62] | MNA-SF AWGS criteria | - | - | No S 552 (90) S 60 (10) | MNA no S M (SD)12.4 (2) MNA + S M (SD) 11.6 (2) |
| Jung (2016) [61] | MNA-SF Fried Phenotype AWGS | Under 145 (38) | R 76 (20) Prefrailty 201 (53) Frailty 67 (17) | S 107 (28) | No frailty and S 69 (22) No frailty and at risk 143 (46) Frailty and S 40 (60) Frailty and at risk 55 (83) |
| Mori (2019) [50] | Fried Phenotype AWGS | - | R 292 (88) Frailty 8 (2) | S 19 (6) | S or frailty 39 (12) S and frailty 12 (4) |
| Parra-Rodriguez (2016) [59] | MNA Fried Phenotype SARC-F | MNA, M (SD) 25 (3) | M (SD) 1 (1) | M(SD) 2 (2): No S 392 (81) S 95 (20) | - |
| Lorenzo-lopes (2019) [71] | MNA-SF Fried Phenotype | T1: Healthy 642 (86) At-risk 101 (14) Maln 6 (0.4) | T1: R183 (24) Prefrailty 538 (72) Frailty 28 (4) | - | - |
| Das (2020) [78] | BMI Fried Phenotype | Under 42 (5) Healthy 506 (65) Over 200 (26) | T1R 341 (44) Prefrailty 362 (47) Frailty 64 (8) | - | - |
Publisher’s Note: MDPI stays neutral with regard to jurisdictional claims in published maps and institutional affiliations. |
© 2022 by the authors. Licensee MDPI, Basel, Switzerland. This article is an open access article distributed under the terms and conditions of the Creative Commons Attribution (CC BY) license (https://creativecommons.org/licenses/by/4.0/).
Share and Cite
Almohaisen, N.; Gittins, M.; Todd, C.; Sremanakova, J.; Sowerbutts, A.M.; Aldossari, A.; Almutairi, A.; Jones, D.; Burden, S. Prevalence of Undernutrition, Frailty and Sarcopenia in Community-Dwelling People Aged 50 Years and Above: Systematic Review and Meta-Analysis. Nutrients 2022, 14, 1537. https://doi.org/10.3390/nu14081537
Almohaisen N, Gittins M, Todd C, Sremanakova J, Sowerbutts AM, Aldossari A, Almutairi A, Jones D, Burden S. Prevalence of Undernutrition, Frailty and Sarcopenia in Community-Dwelling People Aged 50 Years and Above: Systematic Review and Meta-Analysis. Nutrients. 2022; 14(8):1537. https://doi.org/10.3390/nu14081537
Chicago/Turabian StyleAlmohaisen, Nada, Matthew Gittins, Chris Todd, Jana Sremanakova, Anne Marie Sowerbutts, Amal Aldossari, Asrar Almutairi, Debra Jones, and Sorrel Burden. 2022. "Prevalence of Undernutrition, Frailty and Sarcopenia in Community-Dwelling People Aged 50 Years and Above: Systematic Review and Meta-Analysis" Nutrients 14, no. 8: 1537. https://doi.org/10.3390/nu14081537
APA StyleAlmohaisen, N., Gittins, M., Todd, C., Sremanakova, J., Sowerbutts, A. M., Aldossari, A., Almutairi, A., Jones, D., & Burden, S. (2022). Prevalence of Undernutrition, Frailty and Sarcopenia in Community-Dwelling People Aged 50 Years and Above: Systematic Review and Meta-Analysis. Nutrients, 14(8), 1537. https://doi.org/10.3390/nu14081537