
Selected Organ and Endocrine Complications According to BMI and the Metabolic Category of Obesity: A Single Endocrine Center Study

 , , , and
Abstract
:1. Introduction
2. Materials and Methods
Statistical Analysis
3. Results
4. Discussion
5. Conclusions
Author Contributions
Funding
Institutional Review Board Statement
Informed Consent Statement
Data Availability Statement
Conflicts of Interest
References
- Hajek, A.; Brettschneider, C.; van der Leeden, C.; Lühmann, D.; Oey, A.; Wiese, B.; Weyerer, S.; Werle, J.; Fuchs, A.; Pentzek, M.; et al. Prevalence and factors associated with obesity among the oldest old. Arch. Gerontol. Geriatr. 2020, 89, 104069. [Google Scholar] [CrossRef]
- Pasquali, R.; Casanueva, F.; Haluzik, M.; van Hulsteijn, L.; Ledoux, S.; Monteiro, M.P.; Salvador, J.; Santini, F.; Toplak, H.; Dekkers, O.M. European Society of Endocrinology Clinical Practice Guideline: Endocrine work-up in obesity. Eur. J. Endocrinol. 2020, 182, G1–G32. [Google Scholar] [CrossRef] [Green Version]
- Garvey, W.T.; Mechanick, J.I.; Brett, E.M.; Garber, A.J.; Hurley, D.L.; Jastreboff, A.M.; Nadolsky, K.; Pessah-Pollack, R.; Plodkowski, R. American Association of Clinical Endocrinologists and American College of Endocrinology Comprehensive Clinical Practice Guidelines for Medical Care of Patients with Obesity. Endocr. Pract. 2016, 22 (Suppl. 3), 1–203. [Google Scholar] [CrossRef] [PubMed] [Green Version]
- Wolin, K.Y.; Carson, K.; Colditz, G.A. Obesity and cancer. Oncologist 2010, 15, 556–565. [Google Scholar] [CrossRef]
- Ackerman, S.E.; Blackburn, O.A.; Marchildon, F.; Cohen, P. Insights into the Link Between Obesity and Cancer. Curr. Obes. Rep. 2017, 6, 195–203. [Google Scholar] [CrossRef] [PubMed]
- Van Dijk, S.B.; Takken, T.; Prinsen, E.C.; Wittink, H. Different anthropometric adiposity measures and their association with cardiovascular disease risk factors: A meta-analysis. Neth. Heart J. 2012, 20, 208–218. [Google Scholar] [CrossRef] [Green Version]
- Savva, S.C.; Lamnisos, D.; Kafatos, A.G. Predicting cardiometabolic risk: Waist-to-height ratio or BMI. A meta-analysis. Diabetes Metab. Syndr. Obes. 2013, 6, 403–419. [Google Scholar] [CrossRef] [Green Version]
- Alberti, K.G.; Eckel, R.H.; Grundy, S.M.; Zimmet, P.Z.; Cleeman, J.I.; Donato, K.A.; Fruchart, J.-C.; James, W.P.T.; Loria, C.M.; Smith, S.C. Harmonizing the metabolic syndrome: A joint interim statement of the International Diabetes Federation Task Force on Epidemiology and Prevention; National Heart, Lung, and Blood Institute; American Heart Association; World Heart Federation; International Atherosclerosis Society; and International Association for the Study of Obesity. Circulation 2009, 120, 1640–1645. [Google Scholar] [PubMed] [Green Version]
- Vague, J. The degree of masculine differentiation of obesities: A factor determining predisposition to diabetes, atherosclerosis, gout, and uric calculous disease. Am. J. Clin. Nutr. 1956, 4, 20–34. [Google Scholar] [CrossRef] [PubMed]
- Lavie, C.J.; Laddu, D.; Arena, R.; Ortega, F.B.; Alpert, M.A.; Kushner, R.F. Healthy Weight and Obesity Prevention: JACC Health Promotion Series. J. Am. Coll. Cardiol. 2018, 72, 1506–1531. [Google Scholar] [CrossRef] [PubMed]
- Van Vliet-Ostaptchouk, J.V.; Nuotio, M.L.; Slagter, S.N.; Doiron, D.; Fischer, K.; Foco, L.; Gaye, A.; Gögele, M.; Heier, M.; Hiekkalinna, T.; et al. The prevalence of metabolic syndrome and metabolically healthy obesity in Europe: A collaborative analysis of ten large cohort studies. BMC Endocr. Disord. 2014, 14, 9. [Google Scholar] [CrossRef] [Green Version]
- Stefan, N.; Schick, F.; Haring, H.U. Causes, Characteristics, and Consequences of Metabolically Unhealthy Normal Weight in Humans. Cell Metab. 2017, 26, 292–300. [Google Scholar] [CrossRef] [PubMed]
- Bluher, M. Adipose tissue dysfunction contributes to obesity related metabolic diseases. Best Pract. Res. Clin. Endocrinol. Metab. 2013, 27, 163–177. [Google Scholar] [CrossRef] [PubMed]
- Bluher, M. Metabolically Healthy Obesity. Endocr. Rev. 2020, 41, 405–420. [Google Scholar] [CrossRef] [PubMed] [Green Version]
- Kanagasabai, T.; Dhanoa, R.; Kuk, J.L.; Ardern, C.I. Association between Sleep Habits and Metabolically Healthy Obesity in Adults: A Cross-Sectional Study. J. Obes. 2017, 2017, 5272984. [Google Scholar] [CrossRef] [PubMed] [Green Version]
- Mongraw-Chaffin, M.; Foster, M.C.; Anderson, C.A.M.; Burke, G.L.; Haq, N.; Kalyani, R.R.; Ouyang, P.; Sibley, C.T.; Tracy, R.; Woodward, M.; et al. Metabolically Healthy Obesity, Transition to Metabolic Syndrome, and Cardiovascular Risk. J. Am. Coll. Cardiol. 2018, 71, 1857–1865. [Google Scholar] [CrossRef]
- Lin, H.; Zhang, L.; Zheng, R.; Zheng, Y. The prevalence, metabolic risk and effects of lifestyle intervention for metabolically healthy obesity: A systematic review and meta-analysis: A PRISMA-compliant article. Medicine 2017, 96, e8838. [Google Scholar] [CrossRef] [PubMed]
- Kramer, C.K.; Zinman, B.; Retnakaran, R. Are metabolically healthy overweight and obesity benign conditions? A systematic review and meta-analysis. Ann. Intern. Med. 2013, 159, 758–769. [Google Scholar] [CrossRef] [PubMed]
- Matthews, D.R.; Hosker, J.P.; Rudenski, A.S.; Naylor, B.A.; Treacher, D.F.; Turner, R.C. Homeostasis model assessment: Insulin resistance and beta-cell function from fasting plasma glucose and insulin concentrations in man. Diabetologia 1985, 28, 412–419. [Google Scholar] [CrossRef] [PubMed] [Green Version]
- Teede, H.J.; Misso, M.L.; Costello, M.F.; Dokras, A.; Laven, J.; Moran, L.; Piltonen, T.; Norman, R.J. International PCOS Network. Recommendations from the international evidence-based guideline for the assessment and management of polycystic ovary syndrome. Fertil. Steril. 2018, 110, 364–379. [Google Scholar] [CrossRef] [PubMed] [Green Version]
- Parnowski, T.; Jernajczyk, W. Beck’s depression inventory in the rating of mood in normal subjects and in patients with affective disturbances. Psychiatr. Pol. 1977, 11, 417–421. [Google Scholar] [PubMed]
- Yin, Q.; Chen, X.; Li, L.; Zhou, R.; Huang, J.; Yang, D. Apolipoprotein B/apolipoprotein A1 ratio is a good predictive marker of metabolic syndrome and pre-metabolic syndrome in Chinese adolescent women with polycystic ovary syndrome. J. Obstet. Gynaecol. Res. 2013, 39, 203–209. [Google Scholar] [CrossRef] [PubMed]
- Vidigal Fde, C.; Ribeiro, A.Q.; Babio, N.; Salas-Salvadó, J.; Bressan, J. Prevalence of metabolic syndrome and pre-metabolic syndrome in health professionals: LATINMETS Brazil study. Diabetol. Metab. Syndr. 2015, 7, 6. [Google Scholar] [CrossRef] [PubMed] [Green Version]
- Yin, Q.; Zheng, J.; Cao, Y.; Yan, X.; Zhang, H. Evaluation of Novel Obesity and Lipid-Related Indices as Indicators for the Diagnosis of Metabolic Syndrome and Premetabolic Syndrome in Chinese Women with Polycystic Ovary Syndrome. Int. J. Endocrinol. 2021, 2021, 7172388. [Google Scholar] [CrossRef] [PubMed]
- Sogabe, M.; Okahisa, T.; Kurihara, T.; Takehara, M.; Kagemoto, K.; Okazaki, J.; Kida, Y.; Hirao, A.; Tanaka, H.; Tomonari, T.; et al. Differences among patients with and without nonalcoholic fatty liver disease having elevated alanine aminotransferase levels at various stages of metabolic syndrome. PLoS ONE 2020, 15, e0238388. [Google Scholar] [CrossRef] [PubMed]
- Hwang, Y.C.; Hayashi, T.; Fujimoto, W.Y.; Kahn, S.E.; Leonetti, D.L.; McNeely, M.J.; Boyko, E.J. Visceral abdominal fat accumulation predicts the conversion of metabolically healthy obese subjects to an unhealthy phenotype. Int. J. Obes. 2015, 39, 1365–1370. [Google Scholar] [CrossRef] [PubMed] [Green Version]
- Kang, Y.M.; Jung, C.H.; Cho, Y.K.; Jang, J.E.; Hwang, J.Y.; Kim, E.H.; Lee, W.J.; Park, J.-Y.; Kim, H.-K. Visceral adiposity index predicts the conversion of metabolically healthy obesity to an unhealthy phenotype. PLoS ONE 2017, 12, e0179635. [Google Scholar] [CrossRef] [PubMed]
- Eshtiaghi, R.; Keihani, S.; Hosseinpanah, F.; Barzin, M.; Azizi, F. Natural course of metabolically healthy abdominal obese adults after 10 years of follow-up: The Tehran Lipid and Glucose Study. Int. J. Obes. 2015, 39, 514–519. [Google Scholar] [CrossRef] [PubMed]
- Ballestri, S.; Zona, S.; Targher, G.; Romagnoli, D.; Baldelli, E.; Nascimbeni, F.; Roverato, A.; Guaraldi, G.; Lonardo, A. Nonalcoholic fatty liver disease is associated with an almost twofold increased risk of incident type 2 diabetes and metabolic syndrome. Evidence from a systematic review and meta-analysis. J. Gastroenterol. Hepatol. 2016, 31, 936–944. [Google Scholar] [CrossRef] [PubMed]
- Dongiovanni, P.; Paolini, E.; Corsini, A.; Sirtori, C.R.; Ruscica, M. Nonalcoholic fatty liver disease or metabolic dysfunction-associated fatty liver disease diagnoses and cardiovascular diseases: From epidemiology to drug approaches. Eur. J. Clin. Investig. 2021, 51, e13519. [Google Scholar] [CrossRef] [PubMed]
- Cai, J.; Zhang, X.J.; Ji, Y.X.; Zhang, P.; She, Z.G.; Li, H. Nonalcoholic Fatty Liver Disease Pandemic Fuels the Upsurge in Cardiovascular Diseases. Circ. Res. 2020, 126, 679–704. [Google Scholar] [CrossRef] [PubMed]
- Nakahara, T.; Hyogo, H.; Yoneda, M.; Sumida, Y.; Eguchi, Y.; Fujii, H.; Ono, M.; Kawaguchi, T.; Imajo, K.; Aikata, H.; et al. Type 2 diabetes mellitus is associated with the fibrosis severity in patients with nonalcoholic fatty liver disease in a large retrospective cohort of Japanese patients. J. Gastroenterol. 2014, 49, 1477–1484. [Google Scholar] [CrossRef] [Green Version]
- Aller, R.; Siguenza, R.; Pina, M.; Laserna, C.; Antolín, B.; Burgueño, B.; Durà, M.; Izaola, O.; Primo, D.; de Luis, D.A. Insulin resistance is related with liver fibrosis in type 2 diabetic patients with non-alcoholic fatty liver disease proven biopsy and Mediterranean diet pattern as a protective factor. Endocrine 2020, 68, 557–563. [Google Scholar] [CrossRef]
- Zybek-Kocik, A.; Sawicka-Gutaj, N.; Domin, R.; Szczepanek-Parulska, E.; Krauze, T.; Guzik, P.; Ruchała, M. Titin and dystrophin serum concentration changes in patients affected by thyroid disorders. Endokrynol. Pol. 2021, 72, 1–7. [Google Scholar] [CrossRef] [PubMed]
- Santini, F.; Marzullo, P.; Rotondi, M.; Ceccarini, G.; Pagano, L.; Ippolito, S.; Chiovat, L.; Biondi, B. Mechanisms in endocrinology: The crosstalk between thyroid gland and adipose tissue: Signal integration in health and disease. Eur. J. Endocrinol. 2014, 171, R137–R152. [Google Scholar] [CrossRef] [PubMed]
- Biondi, B.; Kahaly, G.J.; Robertson, R.P. Thyroid Dysfunction and Diabetes Mellitus: Two Closely Associated Disorders. Endocr. Rev. 2019, 40, 789–824. [Google Scholar] [CrossRef] [PubMed] [Green Version]
- Yang, Q.; Wan, Y.H.; Hu, S.; Cao, Y.H. Associations between the levels of thyroid hormones and abdominal obesity in euthyroid post-menopausal women. Endokrynol. Pol. 2020, 71, 299–305. [Google Scholar] [CrossRef]
- Duntas, L.H.; Biondi, B. The interconnections between obesity, thyroid function, and autoimmunity: The multifold role of leptin. Thyroid 2013, 23, 646–653. [Google Scholar] [CrossRef] [PubMed]
- Roef, G.L.; Rietzschel, E.R.; Van Daele, C.M.; Taes, Y.E.; De Buyzere, M.L.; Gillebert, T.C.; Kaufman, J.M. Triiodothyronine and free thyroxine levels are differentially associated with metabolic profile and adiposity-related cardiovascular risk markers in euthyroid middle-aged subjects. Thyroid 2014, 24, 223–231. [Google Scholar] [CrossRef] [PubMed] [Green Version]
- Stepanek, L.; Horakova, D.; Stepanek, L.; Janout, V.; Janoutová, J.; Bouchalová, K.; Martiník, K. Free triiodothyronine/free thyroxine (FT3/FT4) ratio is strongly associated with insulin resistance in euthyroid and hypothyroid adults: A cross-sectional study. Endokrynol. Pol. 2021, 72, 8–13. [Google Scholar] [CrossRef] [PubMed]
- Rezzonico, J.; Rezzonico, M.; Pusiol, E.; Pitoia, F.; Niepomniszcze, H. Introducing the thyroid gland as another victim of the insulin resistance syndrome. Thyroid 2008, 18, 461–464. [Google Scholar] [CrossRef] [PubMed]
- Borges-Canha, M.; Neves, J.S.; Mendonca, F.; Silva, M.M.; Costa, C.; Cabral, P.M.; Guerreiro, V.; Lourenço, R.; Meira, P.; Salazar, D.; et al. Thyroid Function and the Risk of Non-Alcoholic Fatty Liver Disease in Morbid Obesity. Front. Endocrinol. 2020, 11, 572128. [Google Scholar] [CrossRef] [PubMed]
- Huang, B.; Yang, S.; Ye, S. Association between Thyroid Function and Nonalcoholic Fatty Liver Disease in Euthyroid Type 2 Diabetes Patients. J. Diabetes Res. 2020, 2020, 6538208. [Google Scholar] [CrossRef] [PubMed]
- Landi, F.; Calvani, R.; Picca, A.; Tosato, M.; Martone, A.M.; Ortolani, E.; Sisto, A.; D’Angelo, E.; Serafini, E.; Desideri, G.; et al. Body Mass Index is Strongly Associated with Hypertension: Results from the Longevity Check-up 7+ Study. Nutrients 2018, 10, 1976. [Google Scholar] [CrossRef] [Green Version]
- Gus, M.; Fuchs, S.C.; Moreira, L.B.; Moraes, R.S.; Wiehe, M.; Silva, A.F.; Albers, F.; Fuchs, F.D. Association between different measurements of obesity and the incidence of hypertension. Am. J. Hypertens. 2004, 17, 50–53. [Google Scholar] [CrossRef] [PubMed] [Green Version]
- Sullivan, C.A.; Kahn, S.E.; Fujimoto, W.Y.; Hayashi, T.; Leonetti, D.L.; Boyko, E.J. Change in Intra-Abdominal Fat Predicts the Risk of Hypertension in Japanese Americans. Hypertension 2015, 66, 134–140. [Google Scholar] [CrossRef] [PubMed] [Green Version]
- Chen, Y.; Liang, X.; Zheng, S.; Wang, Y.; Lu, W. Association of Body Fat Mass and Fat Distribution with the Incidence of Hypertension in a Population-Based Chinese Cohort: A 22-Year Follow-Up. J. Am. Heart Assoc. 2018, 7, e007153. [Google Scholar] [CrossRef] [PubMed] [Green Version]

| Parameter | Grade I Obesity n = 45 Me (Q1–Q3) | Grade II Obesity n =37 Me (Q1–Q3) | Grade III Obesity n =23 Me (Q1–Q3) | H | p |
|---|---|---|---|---|---|
| Age (years) | 34 (26–44) | 37 (28–46) | 28 (25–41) | 3.85 | 0.15 |
| WC (cm) | 98 (94–104) | 104 (99–110) | 121 (113–124) | 41.76 | <0.001 |
| TC (mg/dL) | 186 (164.5–206.5) | 189 (171–218) | 190 (172–224) | 0.54 | 0.76 |
| TG (mg/dL) | 113.5 (83.5–166) | 146 (114–189) | 160 (103–209) | 3.47 | 0.18 |
| HDL (mg/dL) | 52.5 (43–67.5) | 51 (44–63) | 45 (41–55) | 3.32 | 0.19 |
| LDL (mg/dL) | 115.5 (99–143.5) | 126.5 (105–145.5) | 126 (116–159) | 2.11 | 0.35 |
| VLDL (mg/dL) | 22 (16.6–33) | 29.2 (22.8–37.8) | 32 (20.6–41.8) | 4.11 | 0.13 |
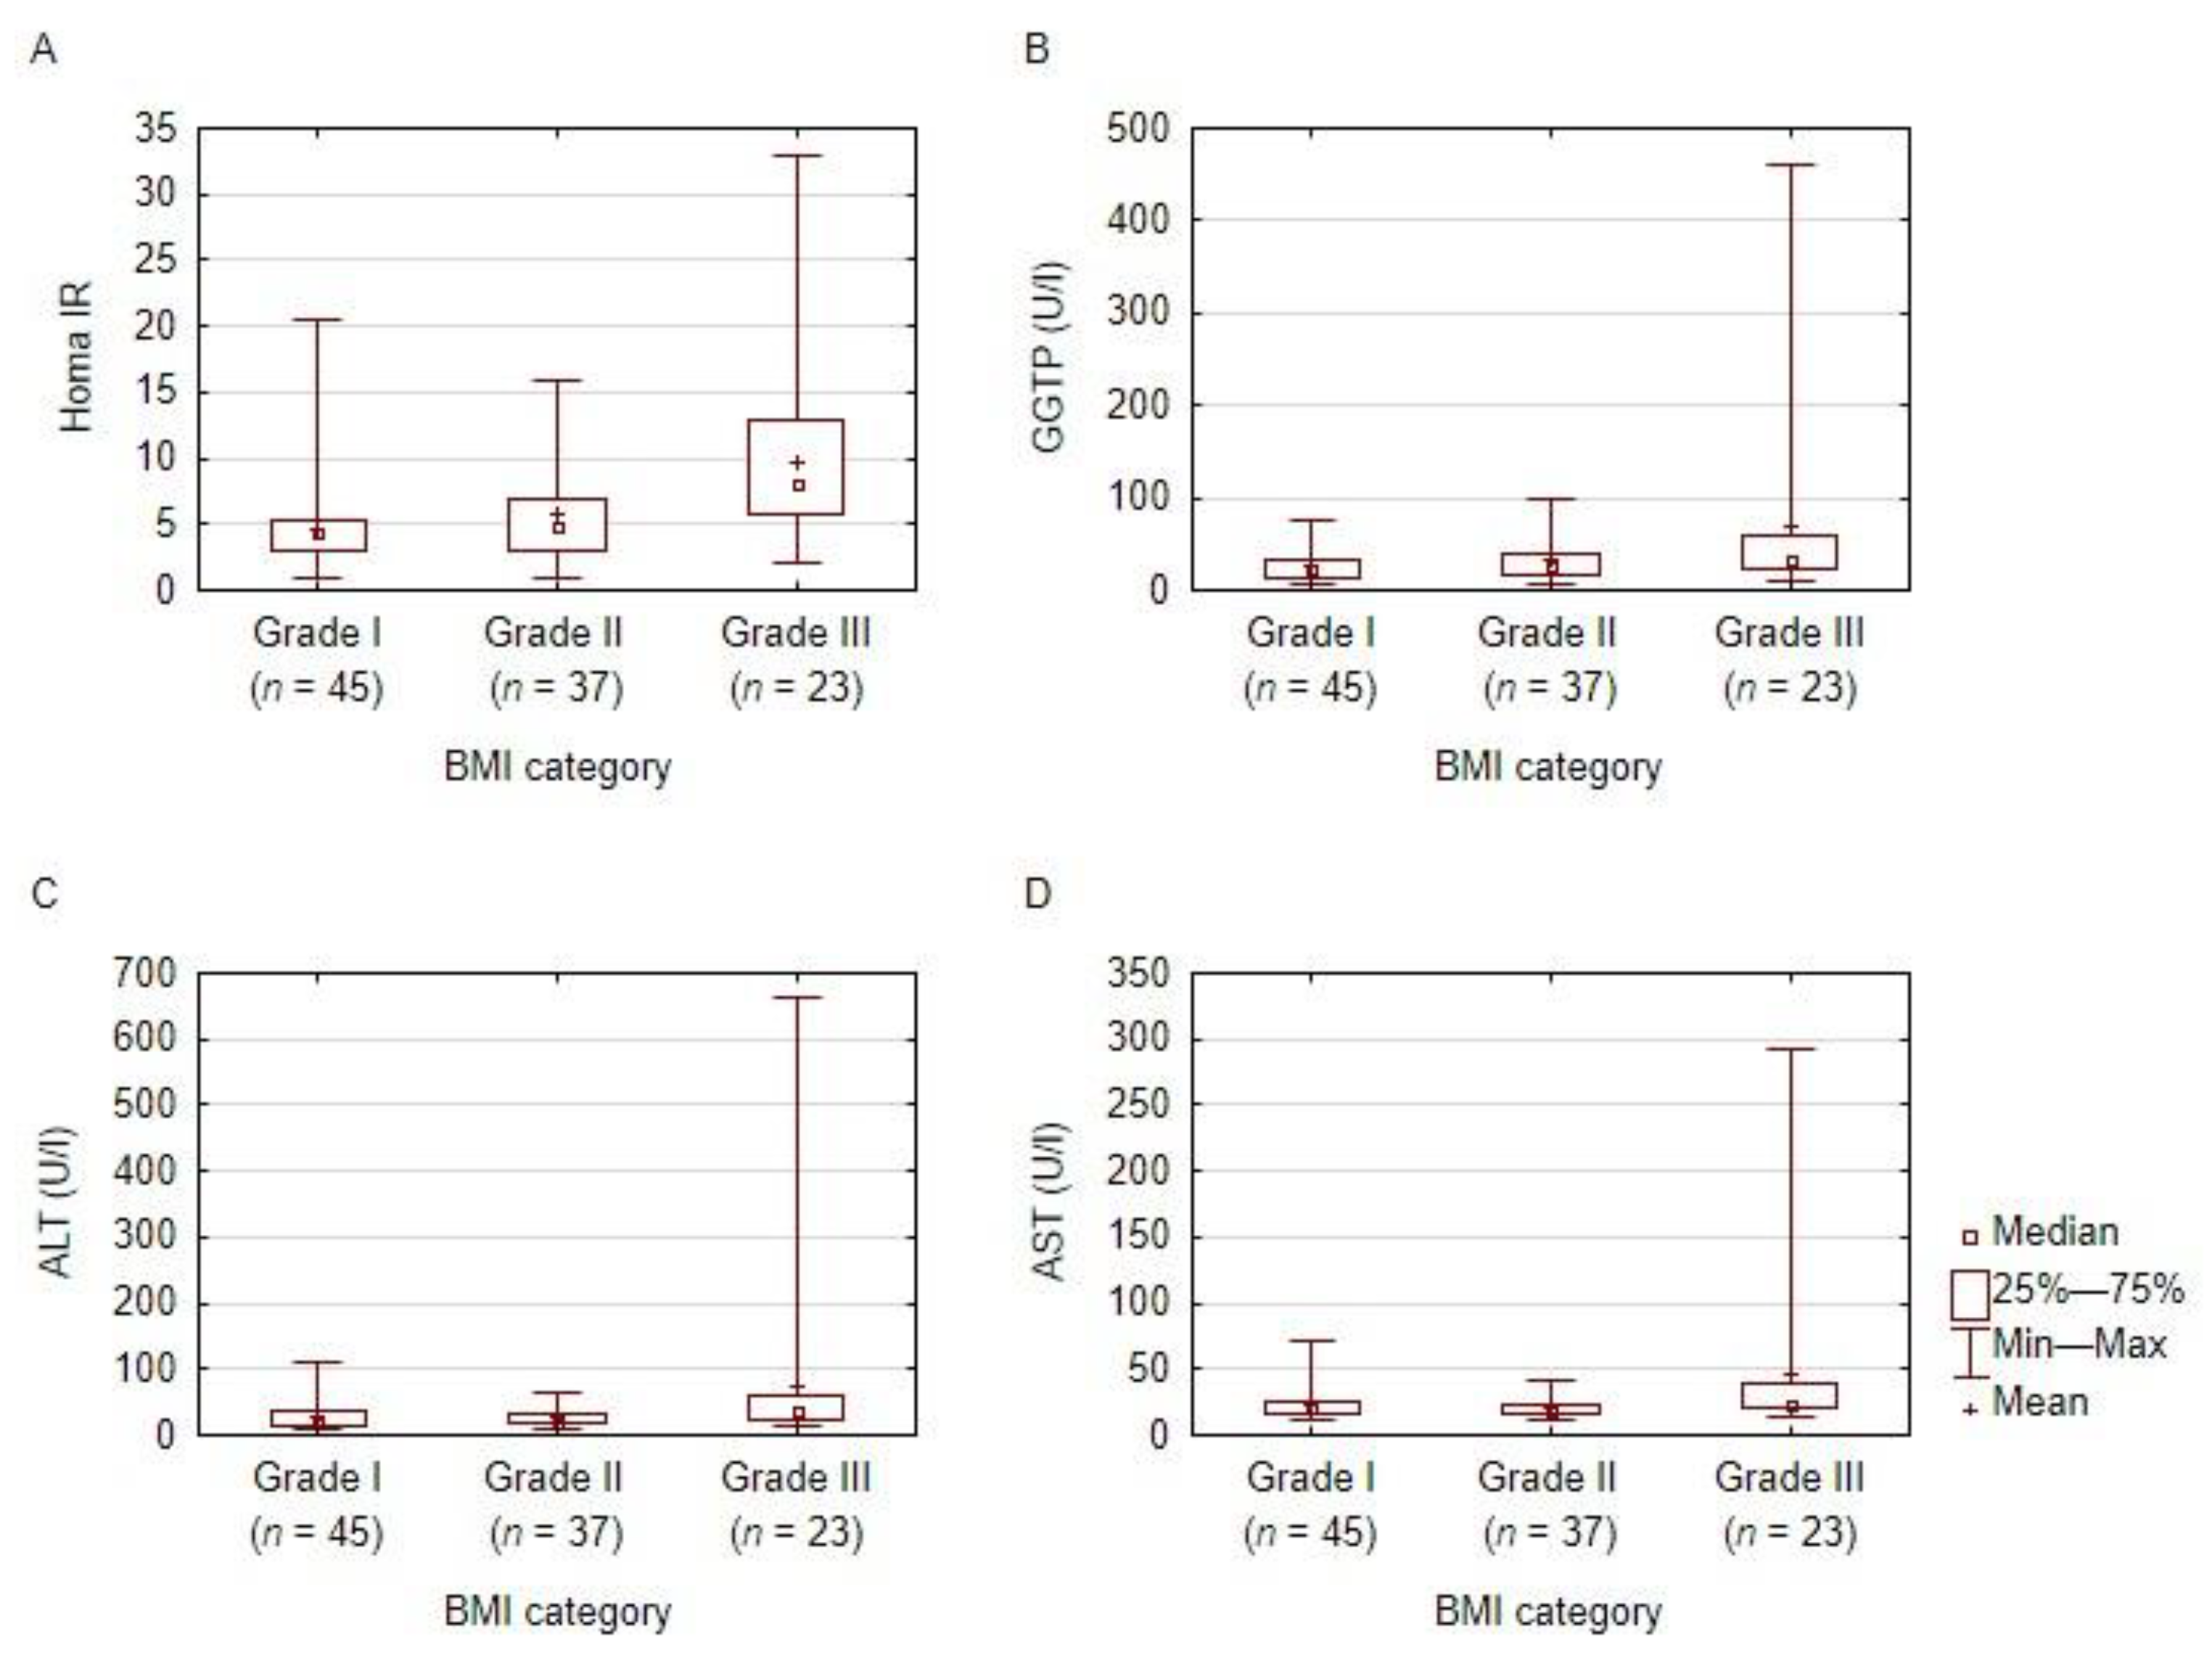
| ALT (U/I) | 21 (15–35) | 21 (17–32) | 36 (25–59) | 11.90 | 0.003 |
| AST (U/I) | 21 (17–26) | 19 (16–23) | 24 (20–40) | 9.04 | 0.01 |
| GGTP (U/I) | 22 (15–34) | 27 (16–39) | 33 (23–61) | 5.75 | 0.06 |
| G-0 | 96 (91–99) | 96 (93–104) | 98 (91–113) | 1.64 | 0.44 |
| G-120 | 109 (96–130) | 110 (93–126) | 130 (85–153) | 1.79 | 0.41 |
| HOMA-IR | 4.4 (2.9–5.3) | 4.85 (3–6.9) | 8.1 (5.7–12.8) | 19.60 | <0.001 |
| Disorder | Grade I Obesity n = 45 | Grade II Obesity n = 37 | Grade III Obesity n = 23 | X2 | p |
|---|---|---|---|---|---|
| Hyperlipidemia | 51.11% | 67.57% | 73.91% | 4.16 | 0.12 |
| Hypothyroidism | 42.22% | 43.24% | 60.87% | 2.4 | 0.30 |
| Depression | 42.22% | 43.24% | 39.13% | 0.10 | 0.95 |
| NAFLD | 31.11% | 40.54% | 60.87% | 5.56 | 0.06 |
| Prediabetes | 35.56% | 37.84% | 56.52% | 2.96 | 0.23 |
| Type 2 diabetes de novo | 6.67% | 5.41% | 4.35% | 0.17 | 0.92 |
| Hypertension | 15.56% | 45.95% | 39.13% | 9.98 | 0.01 |
| PCOS | 42.5% | 34.29% | 46.67% | 0.86 | 0.65 |
| Infertility | 5% | 11.43% | 13.33% | 1.45 | 0.48 |
| Male hypogonadism | 80% | 100% | 87.5% | 0.75 | 0.69 |
| OSA | 2.22% | 10.81% | 21.74% | 7.02 | 0.03 |
| Asthma | 0% | 2.7% | 13.04% | 6.98 | 0.03 |
| Disorder | Grade I Obesity n = 45 | Grade II & III Obesity n = 60 | X2 | p |
|---|---|---|---|---|
| Hyperlipidemia | 51.11% | 70% | 3.89 | 0.049 |
| Hypothyroidism | 42.22% | 50% | 0.63 | 0.43 |
| Depression | 42.22% | 41.67% | 0.00 | 0.95 |
| NAFLD | 31.11% | 48.33% | 3.19 | 0.07 |
| Prediabetes | 35.56% | 45% | 0.95 | 0.33 |
| Type 2 diabetes de novo | 6.67% | 5% | 0.13 | 0.72 |
| Hypertension | 15.56% | 43.33% | 9.71 | 0.002 |
| PCOS | 42.5% | 38% | 0.19 | 0.67 |
| Infertility | 5% | 12% | 1.42 | 0.23 |
| Male hypogonadism | 80% | 90% | 0.27 | 0.60 |
| OSA | 2.22% | 15% | 5.73 | 0.02 |
| Asthma | 0% | 6.67% | 4.60 | 0.03 |
| Parameter | pre-MetS n = 40 Me (Q1–Q3) | MetS n = 47 Me (Q1–Q3) | MHO n = 18 Me (Q1–Q3) | H | p |
|---|---|---|---|---|---|
| Age (years) | 30 (24.5–39.5) | 38 (27–45) | 40 (30–46) | 2.81 | 0.25 |
| BMI | 35.5 (32–39) | 37 (34–40) | 32.5 (31–35) | 15.82 | <0.001 |
| WC (cm) | 99.5 (95–110) | 108 (100–120) | 96 (91–101) | 22.47 | <0.001 |
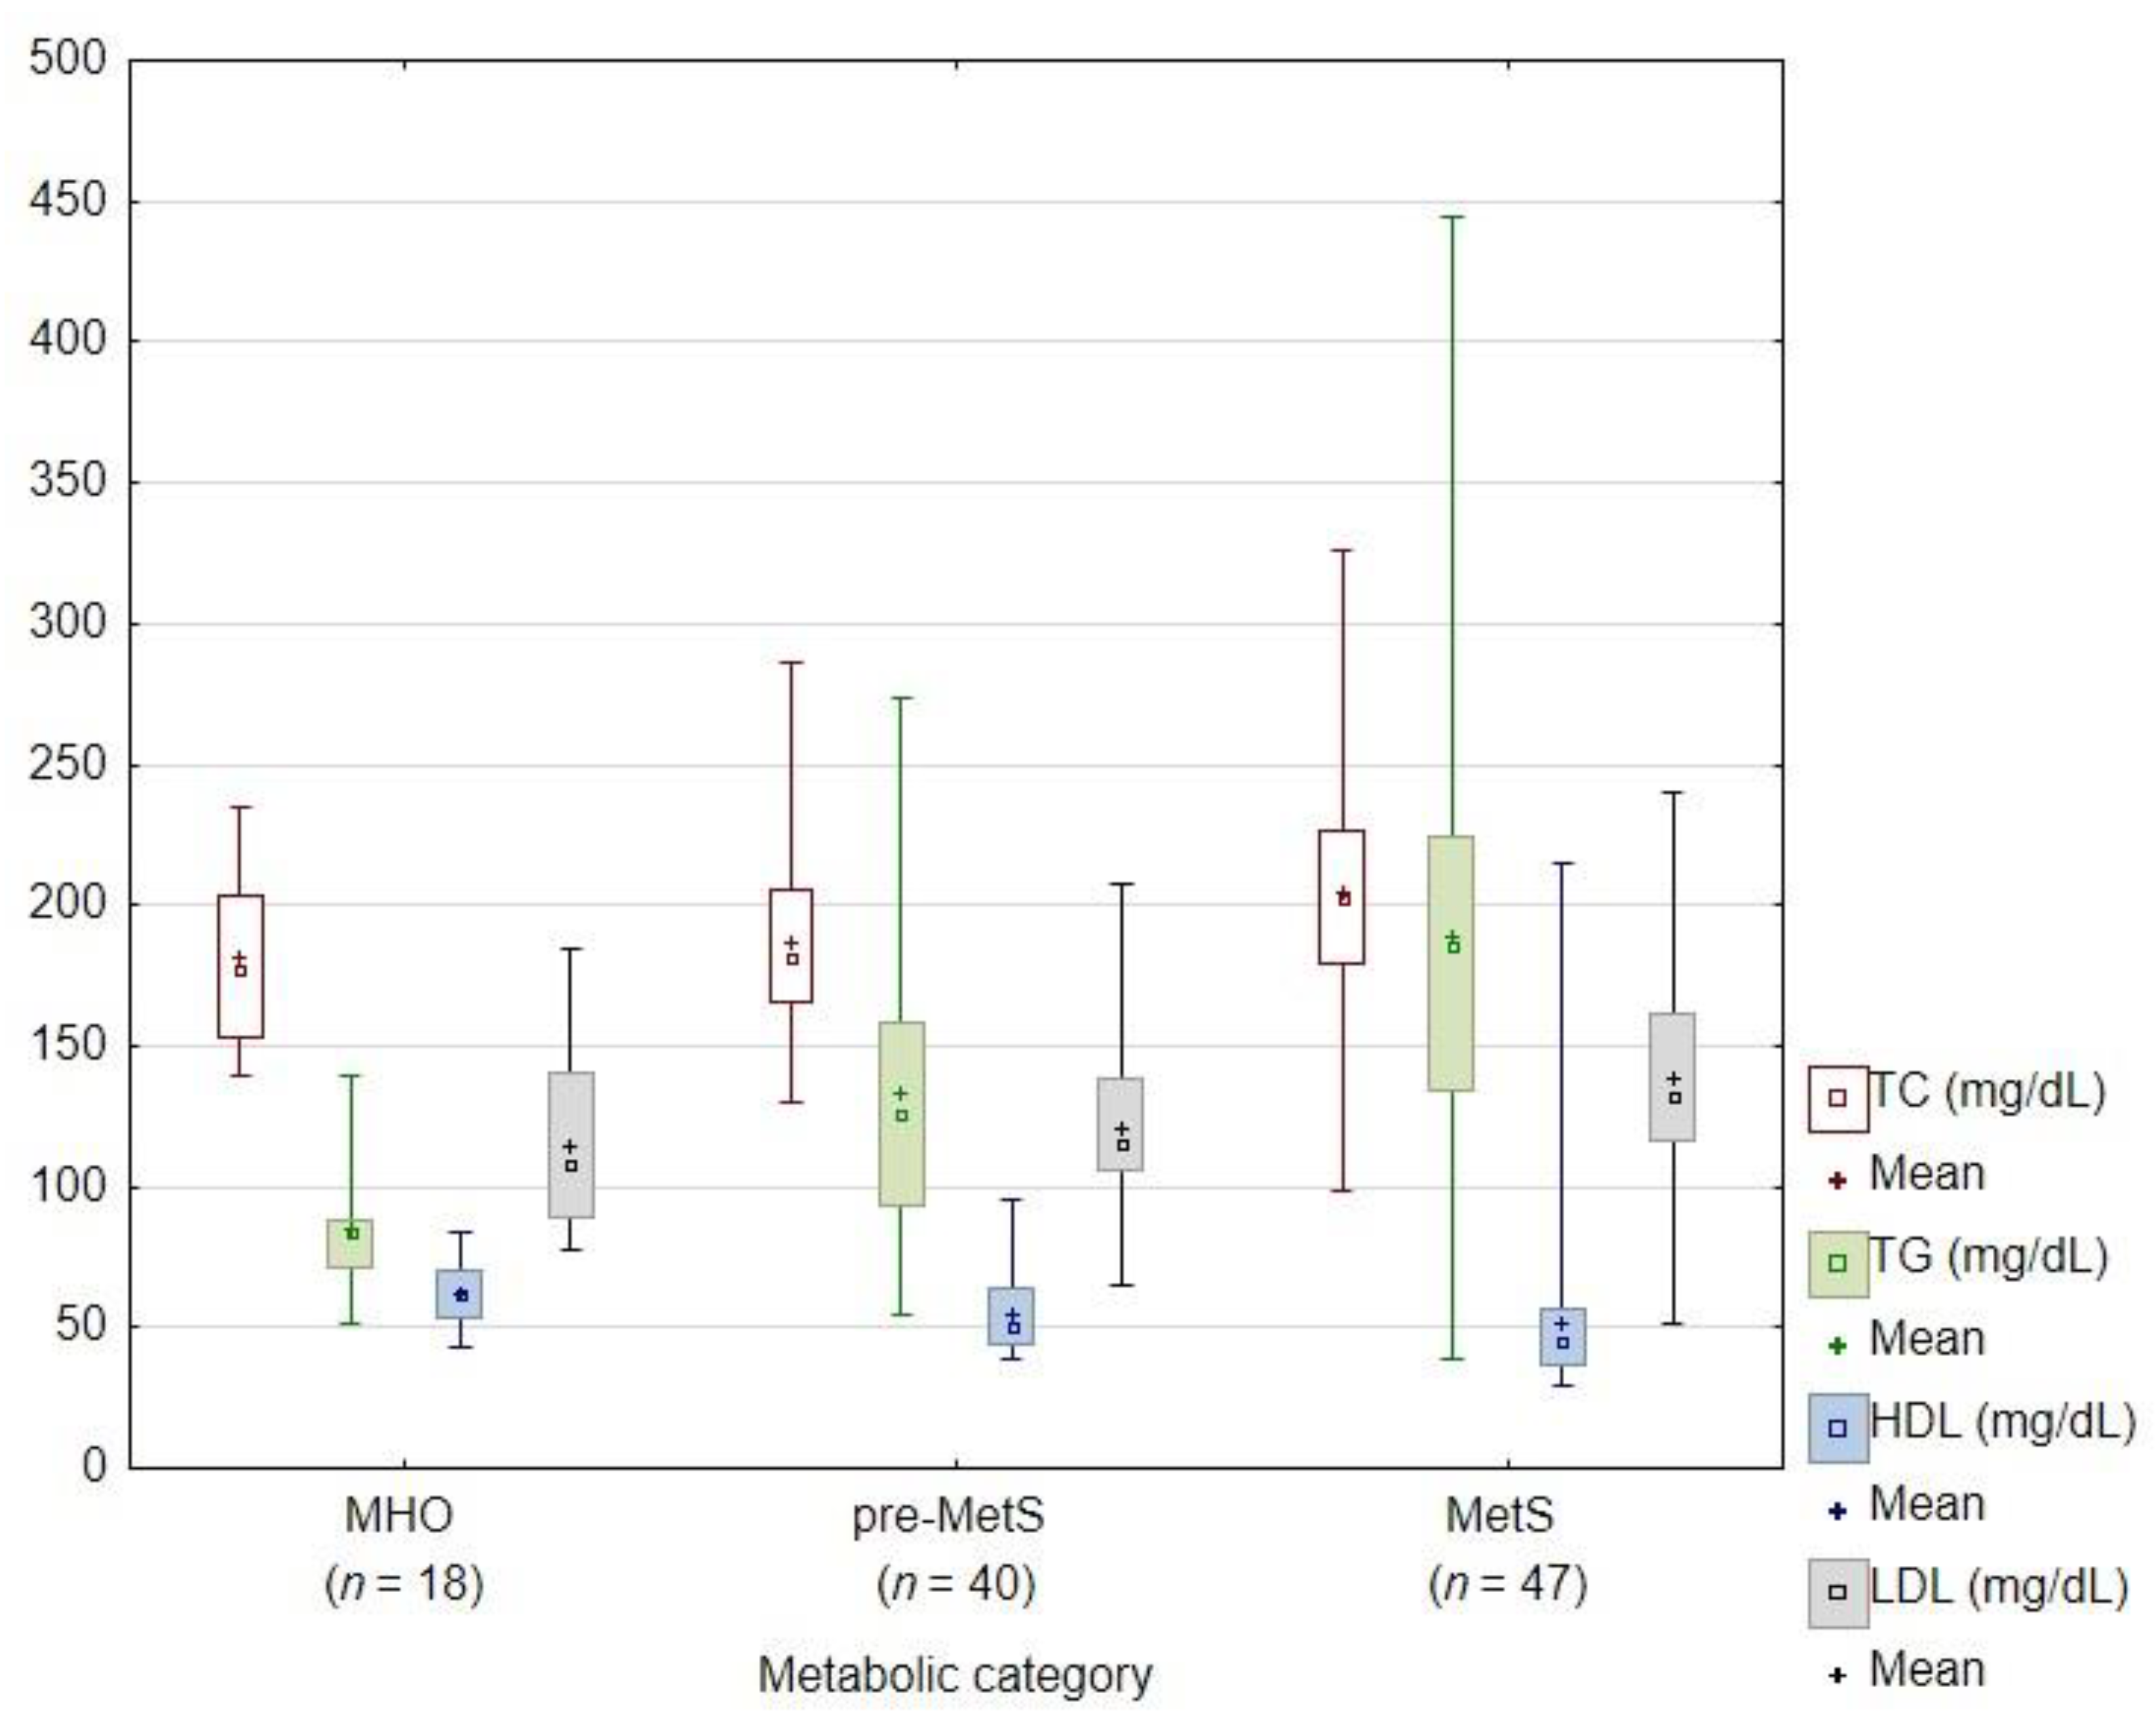
| TC (mg/dL) | 181 (165.5–205) | 202.5 (179–226) | 177 (153–203) | 8.11 | 0.02 |
| TG (mg/dL) | 125.5 (93.5–158) | 186 (134–224) | 83.5 (71–88) | 33.27 | <0.001 |
| HDL (mg/dL) | 50.5 (44–64) | 45.5 (37–57) | 62 (53–70) | 14.32 | 0.001 |
| LDL (mg/dL) | 115.5 (106–138.5) | 132 (116–161) | 108 (89–141) | 9.75 | 0.01 |
| VLDL (mg/dL) | 25.1 (18.7–31.6) | 36.6 (26.6–44.8) | 16.7 (14.2–17.6) | 30.58 | <0.001 |
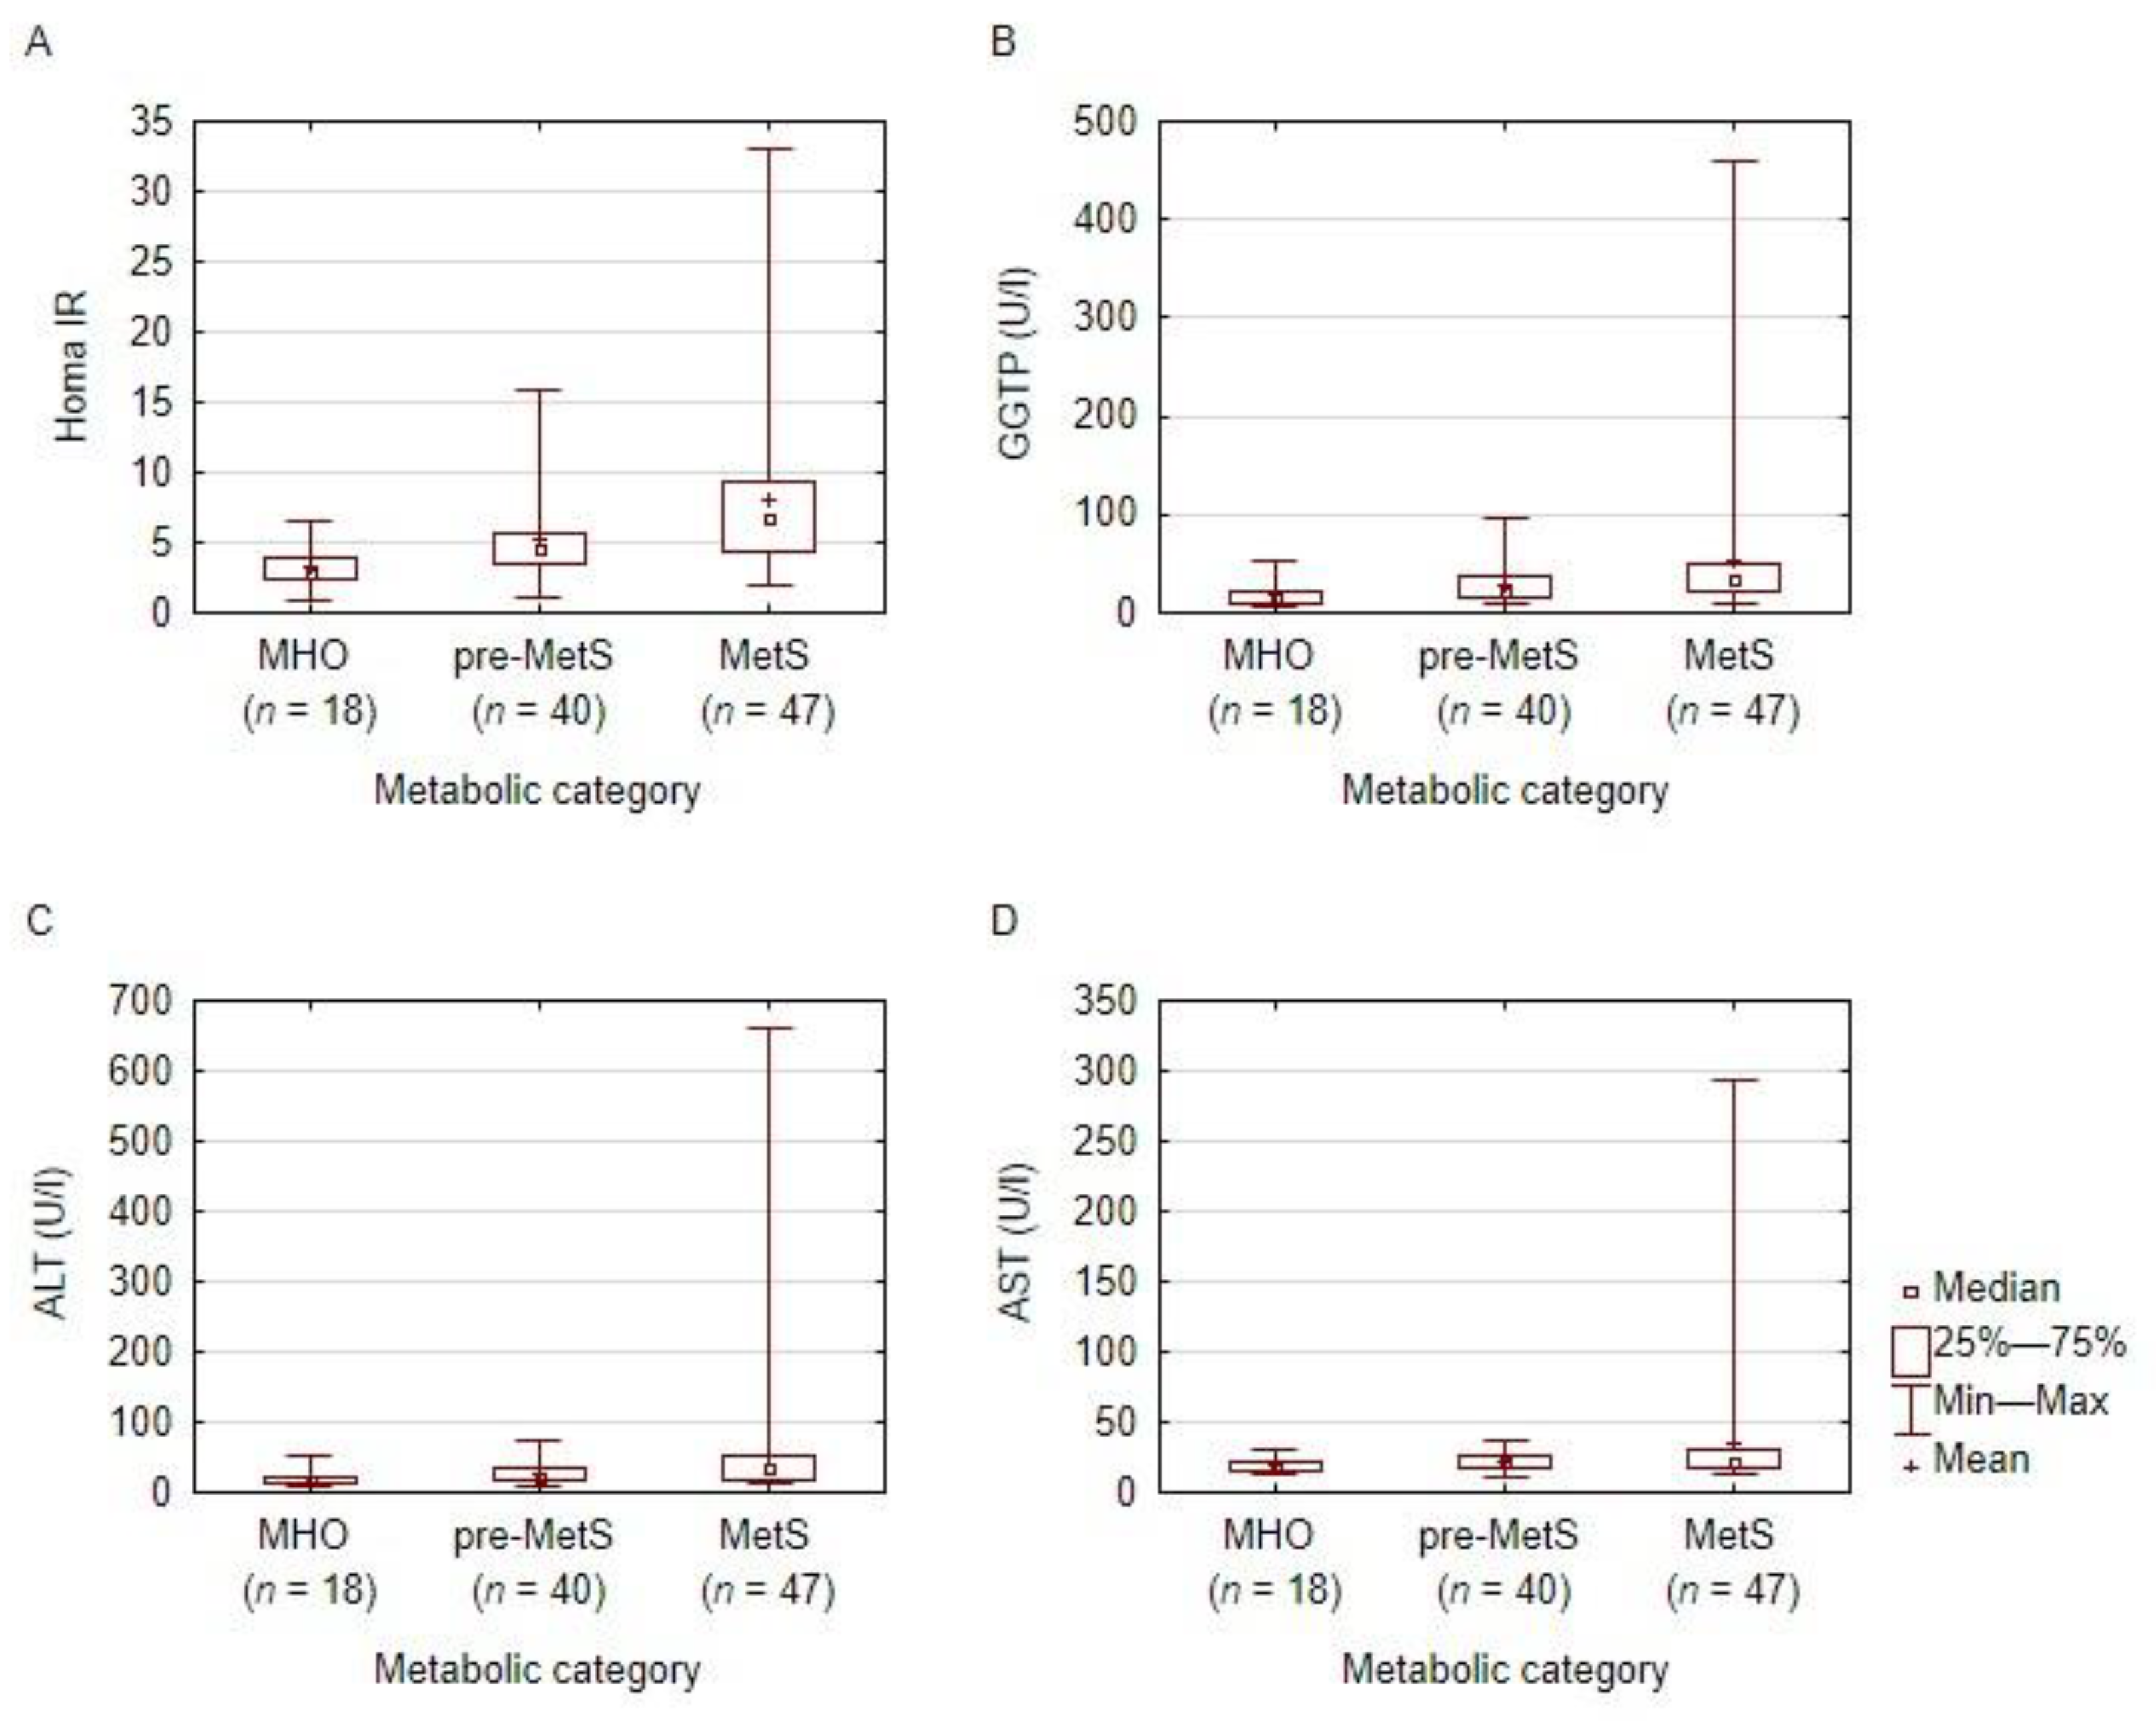
| ALT (U/I) | 23.5 (17–33.5) | 33 (19–52) | 18 (14–22) | 13.12 | 0.001 |
| AST (U/I) | 21.5 (18–26.5) | 21 (17–31) | 18 (15–22) | 6.96 | 0.03 |
| GGTP (U/I) | 22 (15–36) | 33 (23.5–51.5) | 16 (11–23) | 19.57 | <0.001 |
| G-0 (mg/dL) | 95 (92–100) | 99 (94–108) | 94 (88–98) | 9.54 | 0.01 |
| G-120 (mg/dL) | 109 (88–119) | 126 (107–165) | 102.5 (93–113) | 14.74 | <0.001 |
| HOMA-IR | 4.5 (3.6–5.75) | 6.75 (4.4–9.4) | 2.95 (2.4–3.95) | 21.98 | <0.001 |
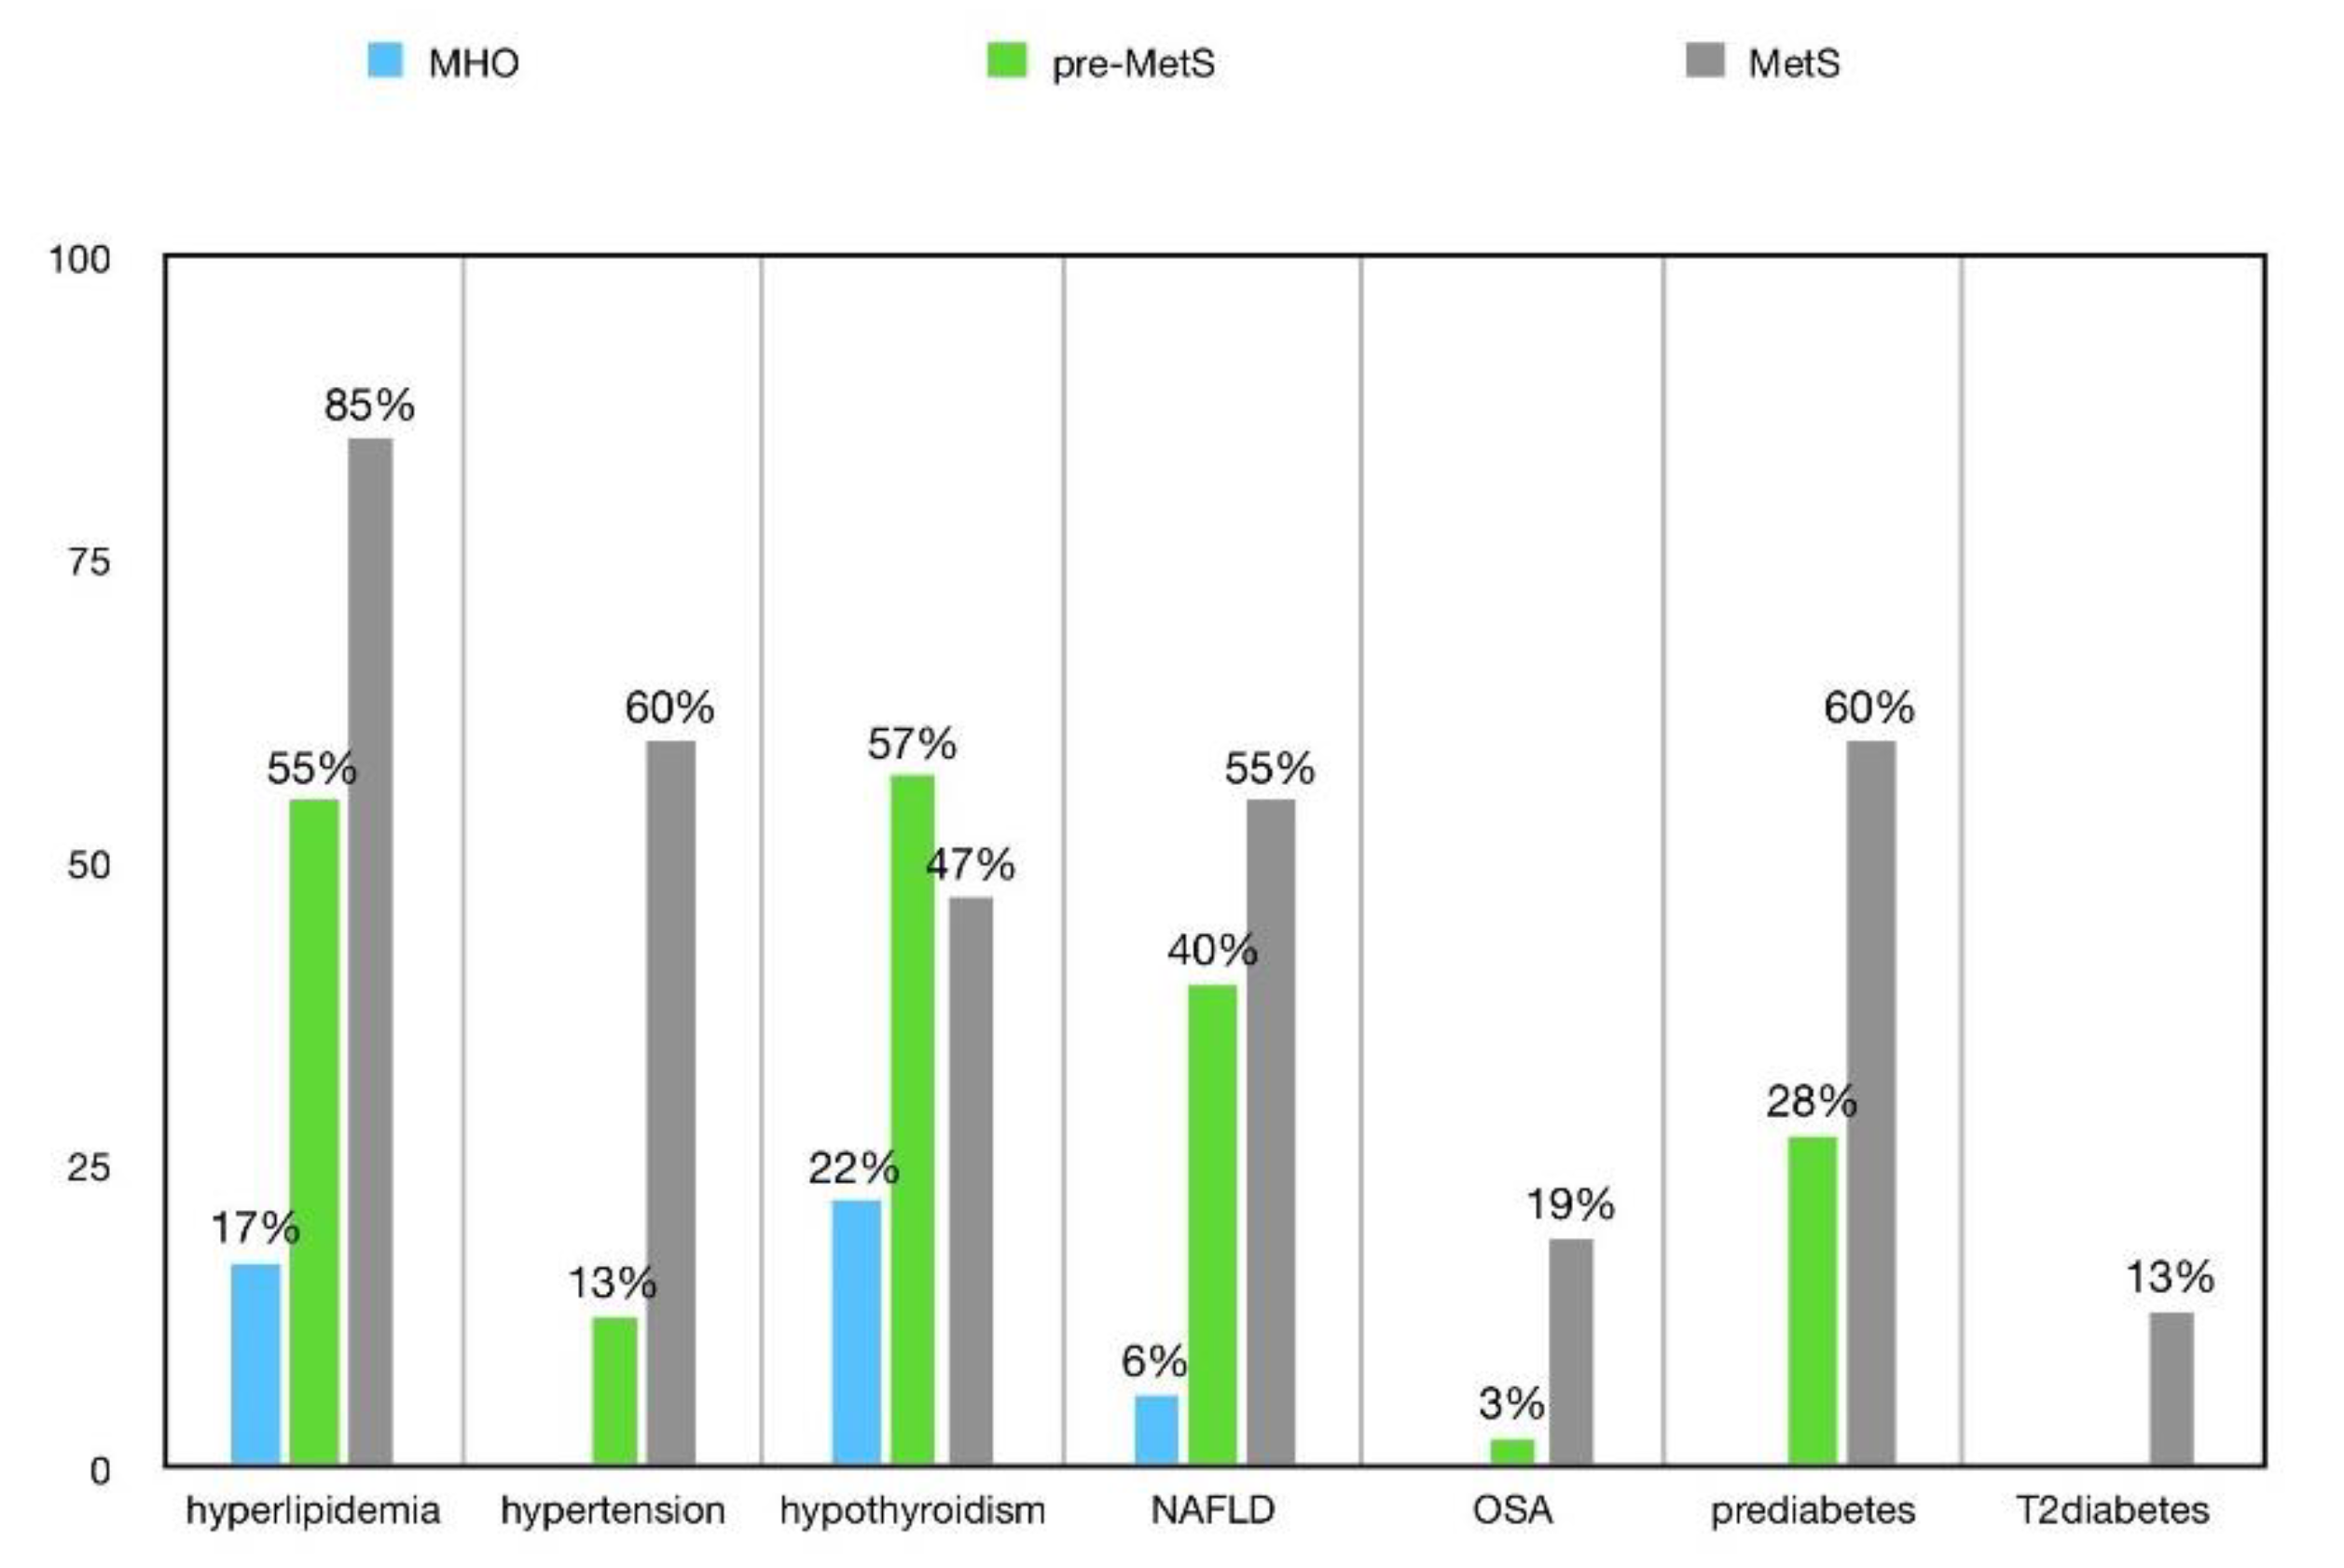
| Disorder | pre-MetS n = 40 | MetS n = 47 | MHO n = 18 | X2 | p |
|---|---|---|---|---|---|
| Hyperlipidemia | 55% | 85.11% | 16.67% | 28.72 | <0.001 |
| Hypothyroidism | 57.5% | 46.81% | 22.22% | 6.51 | 0.04 |
| Depression | 37.5% | 44.68% | 44.44% | 0.52 | 0.77 |
| NAFLD | 40% | 55.32% | 5.56% | 15.92 | <0.001 |
| Prediabetes | 37.5% | 59.57% | 0% | 25.76 | <0.001 |
| Type 2 diabetes de novo | 0% | 12.77% | 0% | 10.10 | 0.01 |
| Hypertension | 12.5% | 59.57% | 0% | 37.16 | <0.001 |
| PCOS | 48.72% | 28.57% | 43.75% | 3.29 | 0.19 |
| Infertility | 5.13% | 14.29% | 6.25% | 2.03 | 0.36 |
| Male hypogonadism | 100% | 83.33% | 100% | 0.97 | 0.62 |
| OSA | 2.5% | 19.15% | 0% | 10.78 | 0.005 |
| Asthma | 2.5% | 4.26% | 5.56% | 0.37 | 0.83 |
Publisher’s Note: MDPI stays neutral with regard to jurisdictional claims in published maps and institutional affiliations. |
© 2022 by the authors. Licensee MDPI, Basel, Switzerland. This article is an open access article distributed under the terms and conditions of the Creative Commons Attribution (CC BY) license (https://creativecommons.org/licenses/by/4.0/).
Share and Cite
Milewska, E.M.; Szczepanek-Parulska, E.; Marciniak, M.; Krygier, A.; Dobrowolska, A.; Ruchala, M. Selected Organ and Endocrine Complications According to BMI and the Metabolic Category of Obesity: A Single Endocrine Center Study. Nutrients 2022, 14, 1307. https://doi.org/10.3390/nu14061307
Milewska EM, Szczepanek-Parulska E, Marciniak M, Krygier A, Dobrowolska A, Ruchala M. Selected Organ and Endocrine Complications According to BMI and the Metabolic Category of Obesity: A Single Endocrine Center Study. Nutrients. 2022; 14(6):1307. https://doi.org/10.3390/nu14061307
Chicago/Turabian StyleMilewska, Ewa Malwina, Ewelina Szczepanek-Parulska, Martyna Marciniak, Aleksandra Krygier, Agnieszka Dobrowolska, and Marek Ruchala. 2022. "Selected Organ and Endocrine Complications According to BMI and the Metabolic Category of Obesity: A Single Endocrine Center Study" Nutrients 14, no. 6: 1307. https://doi.org/10.3390/nu14061307
APA StyleMilewska, E. M., Szczepanek-Parulska, E., Marciniak, M., Krygier, A., Dobrowolska, A., & Ruchala, M. (2022). Selected Organ and Endocrine Complications According to BMI and the Metabolic Category of Obesity: A Single Endocrine Center Study. Nutrients, 14(6), 1307. https://doi.org/10.3390/nu14061307