
Liquiritigenin Inhibits Lipid Accumulation in 3T3-L1 Cells via mTOR-Mediated Regulation of the Autophagy Mechanism

 , ,
, ,  and
and
Abstract
:1. Introduction
2. Materials and Methods
2.1. Chemicals and Reagents
2.2. T3-L1 Preadipocyte Culture and Differentiation
2.3. Cell Viability Assay
2.4. Lipid Content Assays
2.5. Western Blotting Analysis
2.6. Quantitative Real-Time Reverse Transcription Polymerase Chain Reaction (RT-PCR)
2.7. Statistical Analysis
3. Results
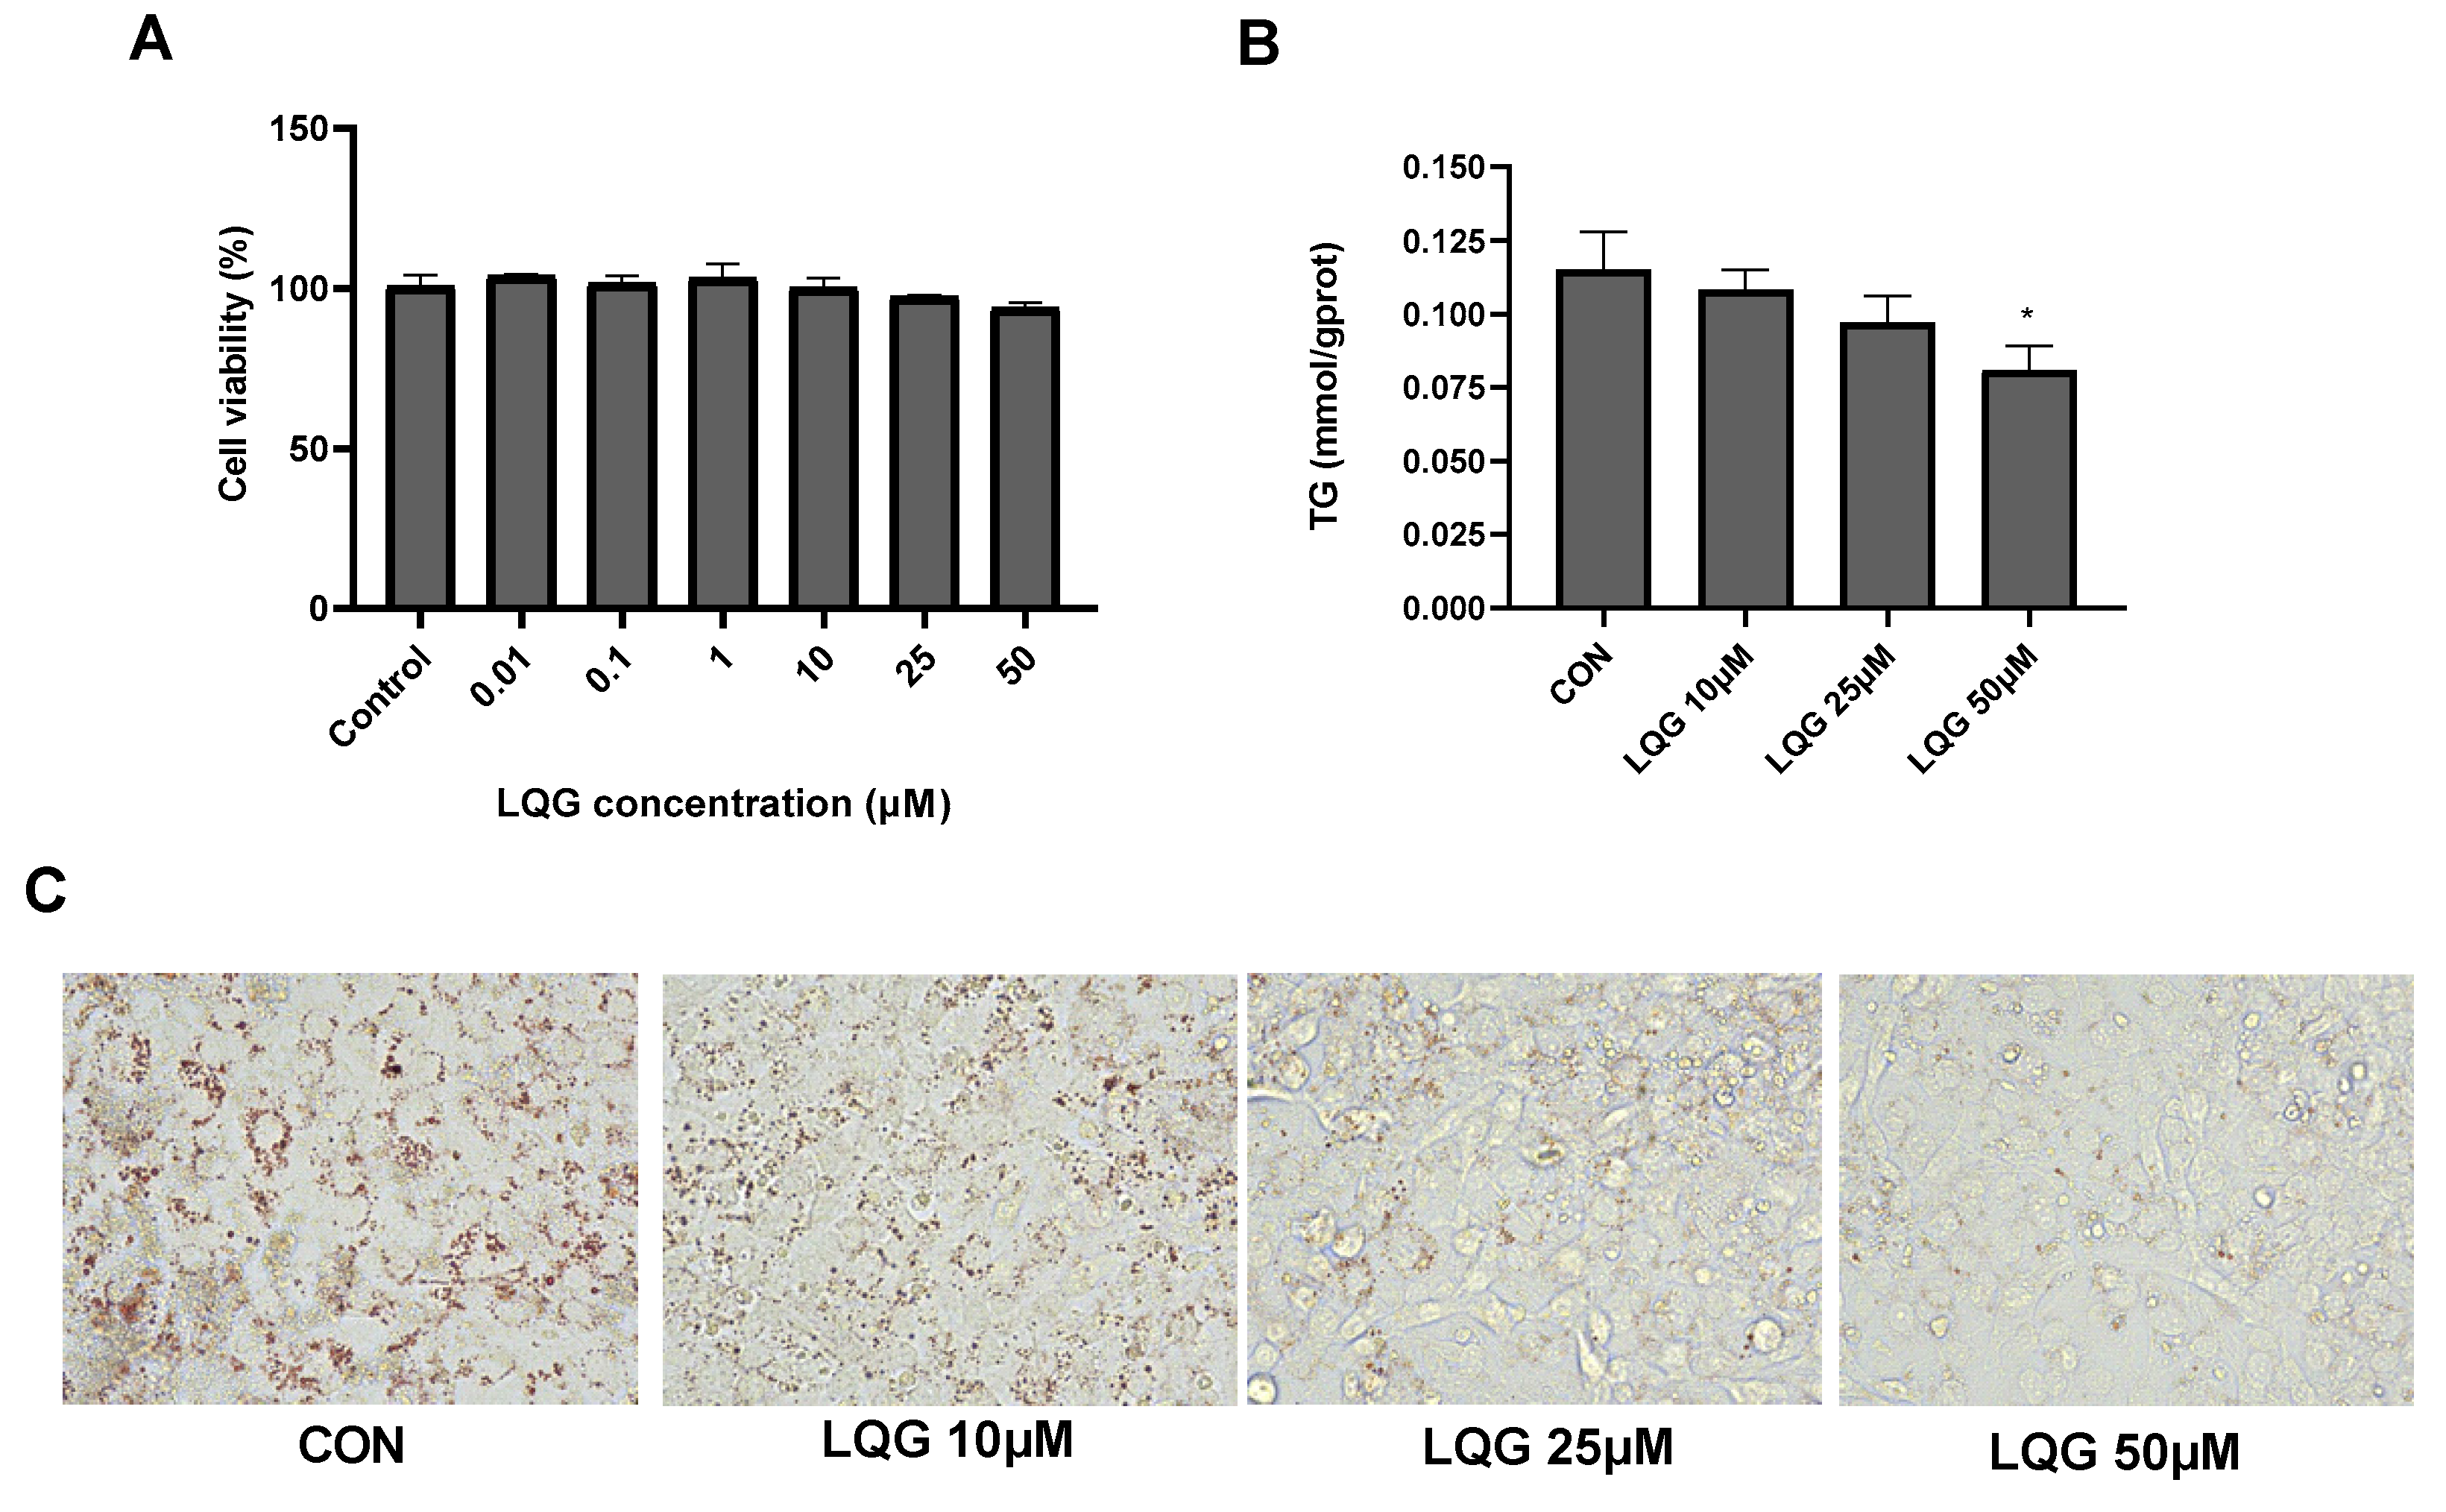
3.1. Effects of LQG on Lipid Accumulation in 3T3-L1 White Adipocytes
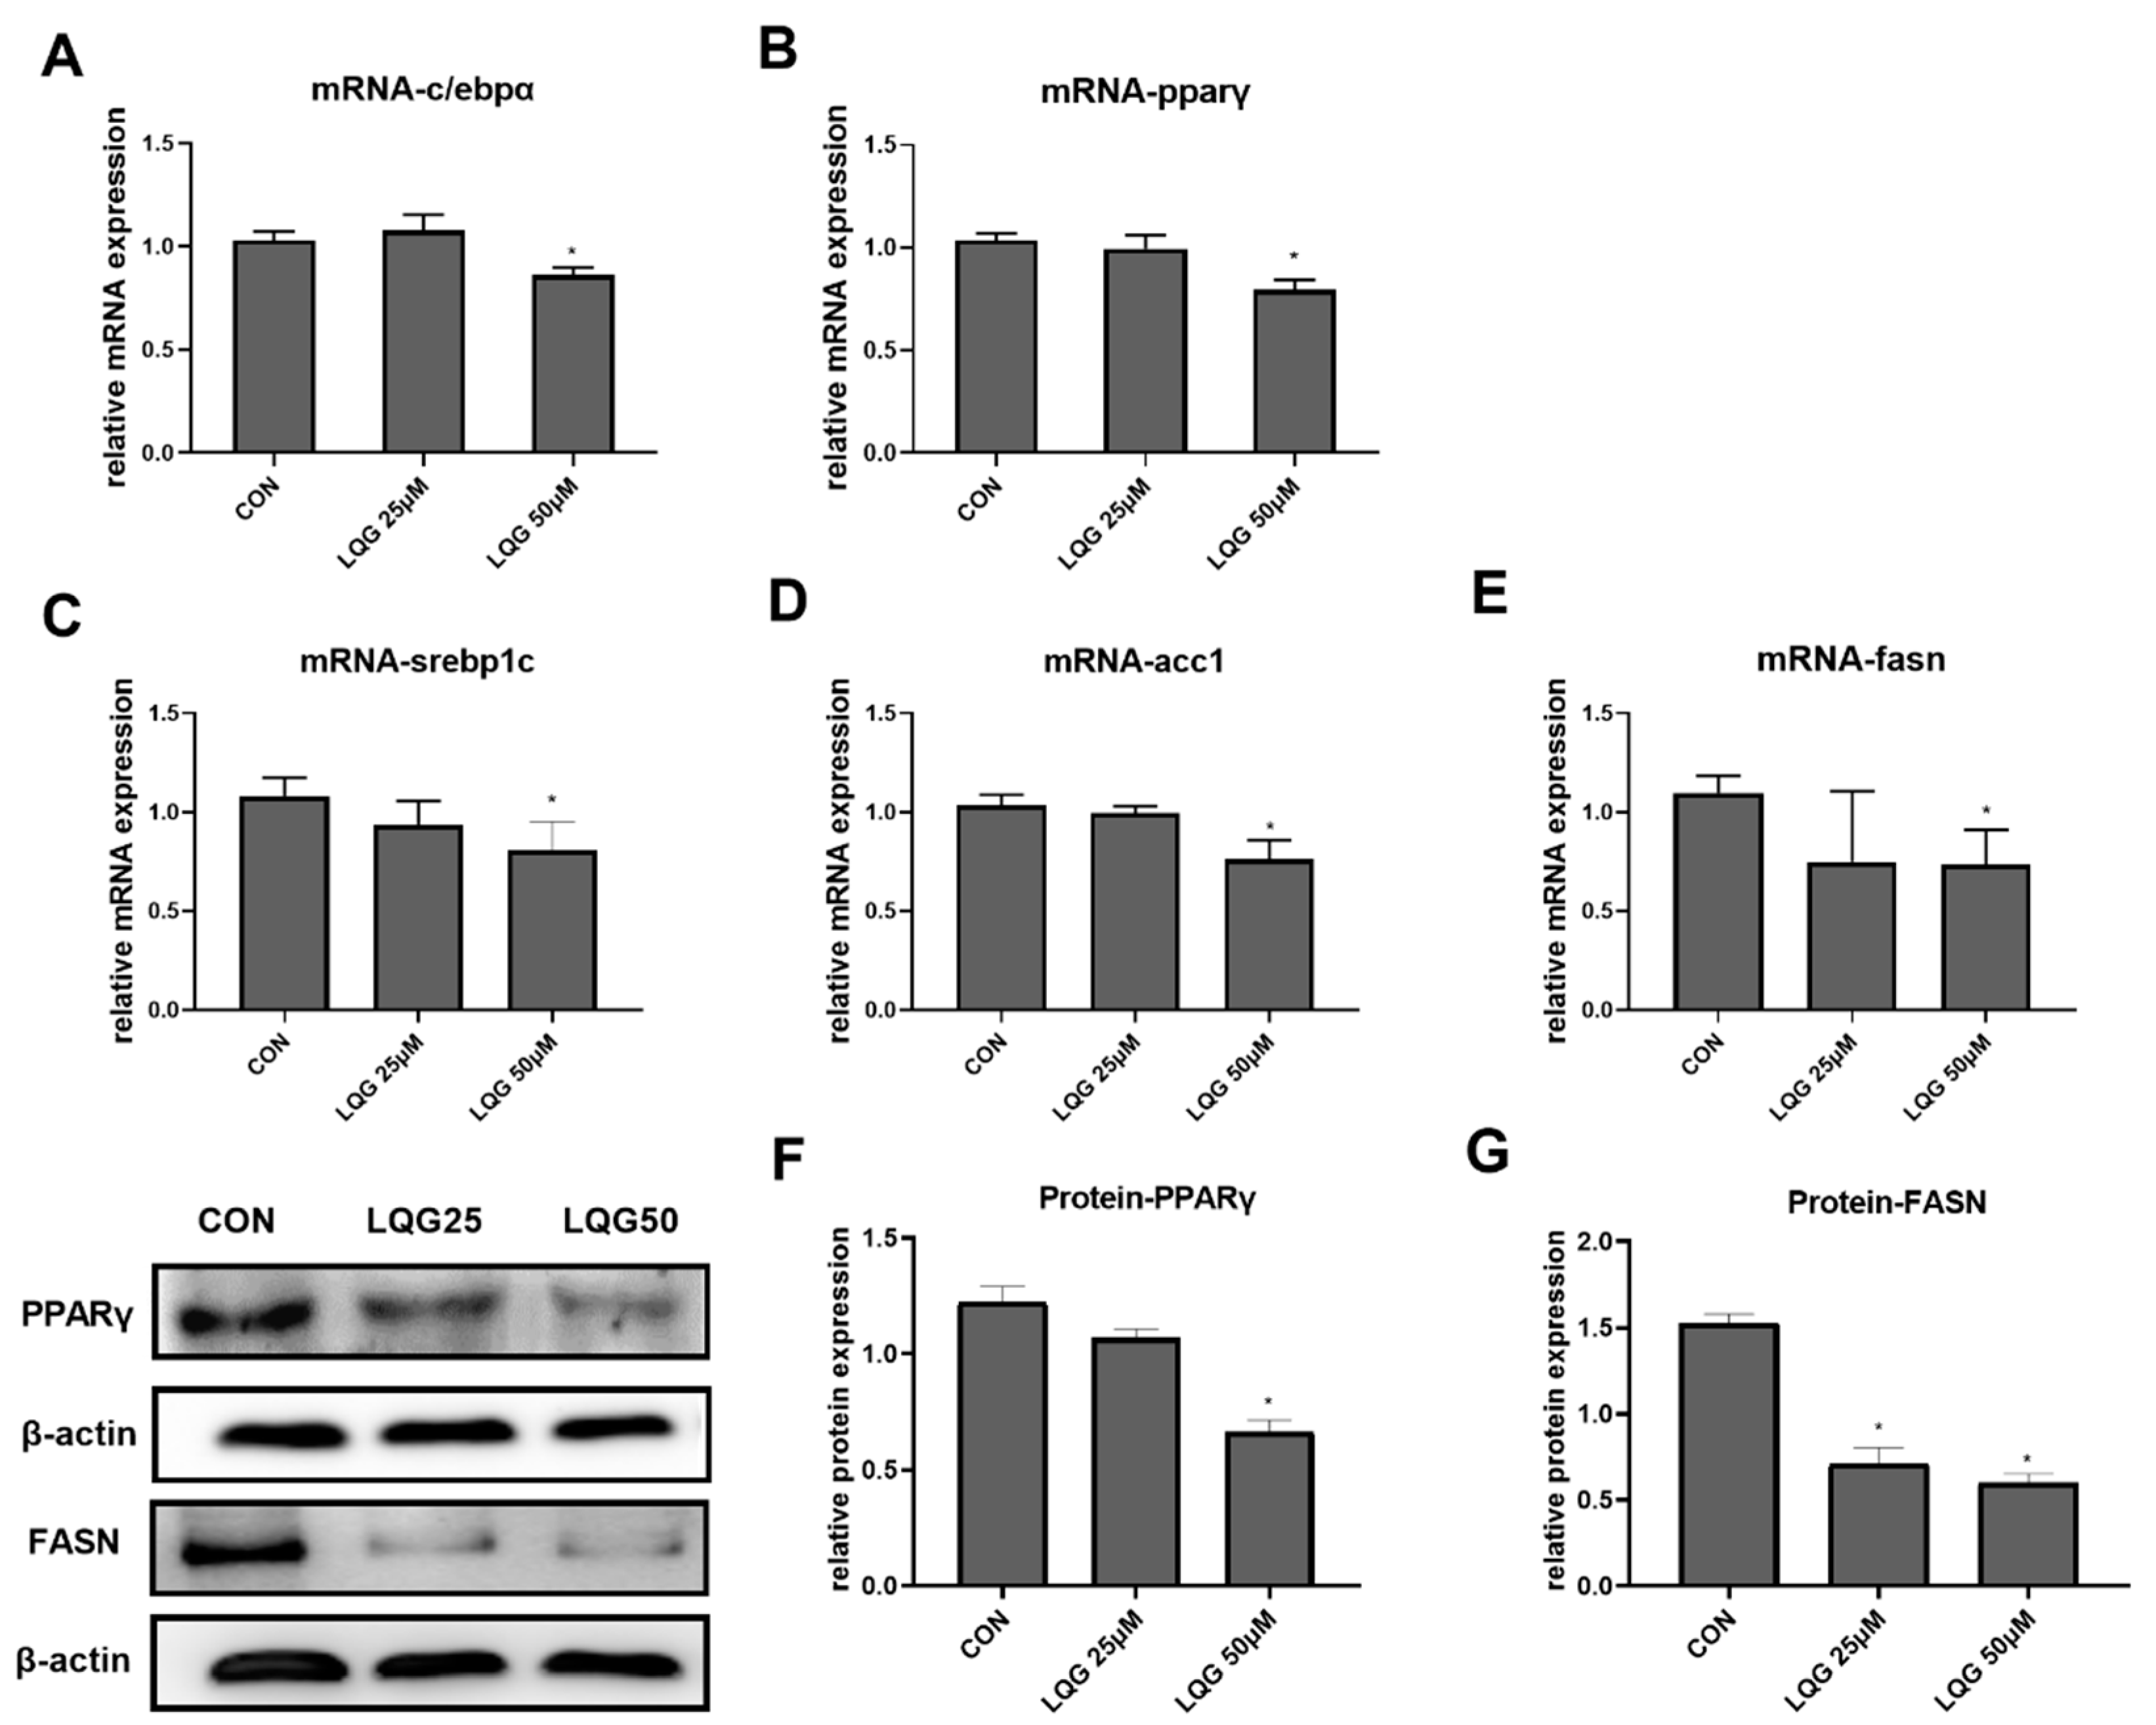
3.2. Effects of LQG on Modulating Molecular Regulators of Lipid Synthesis in 3T3-L1 Adipocytes
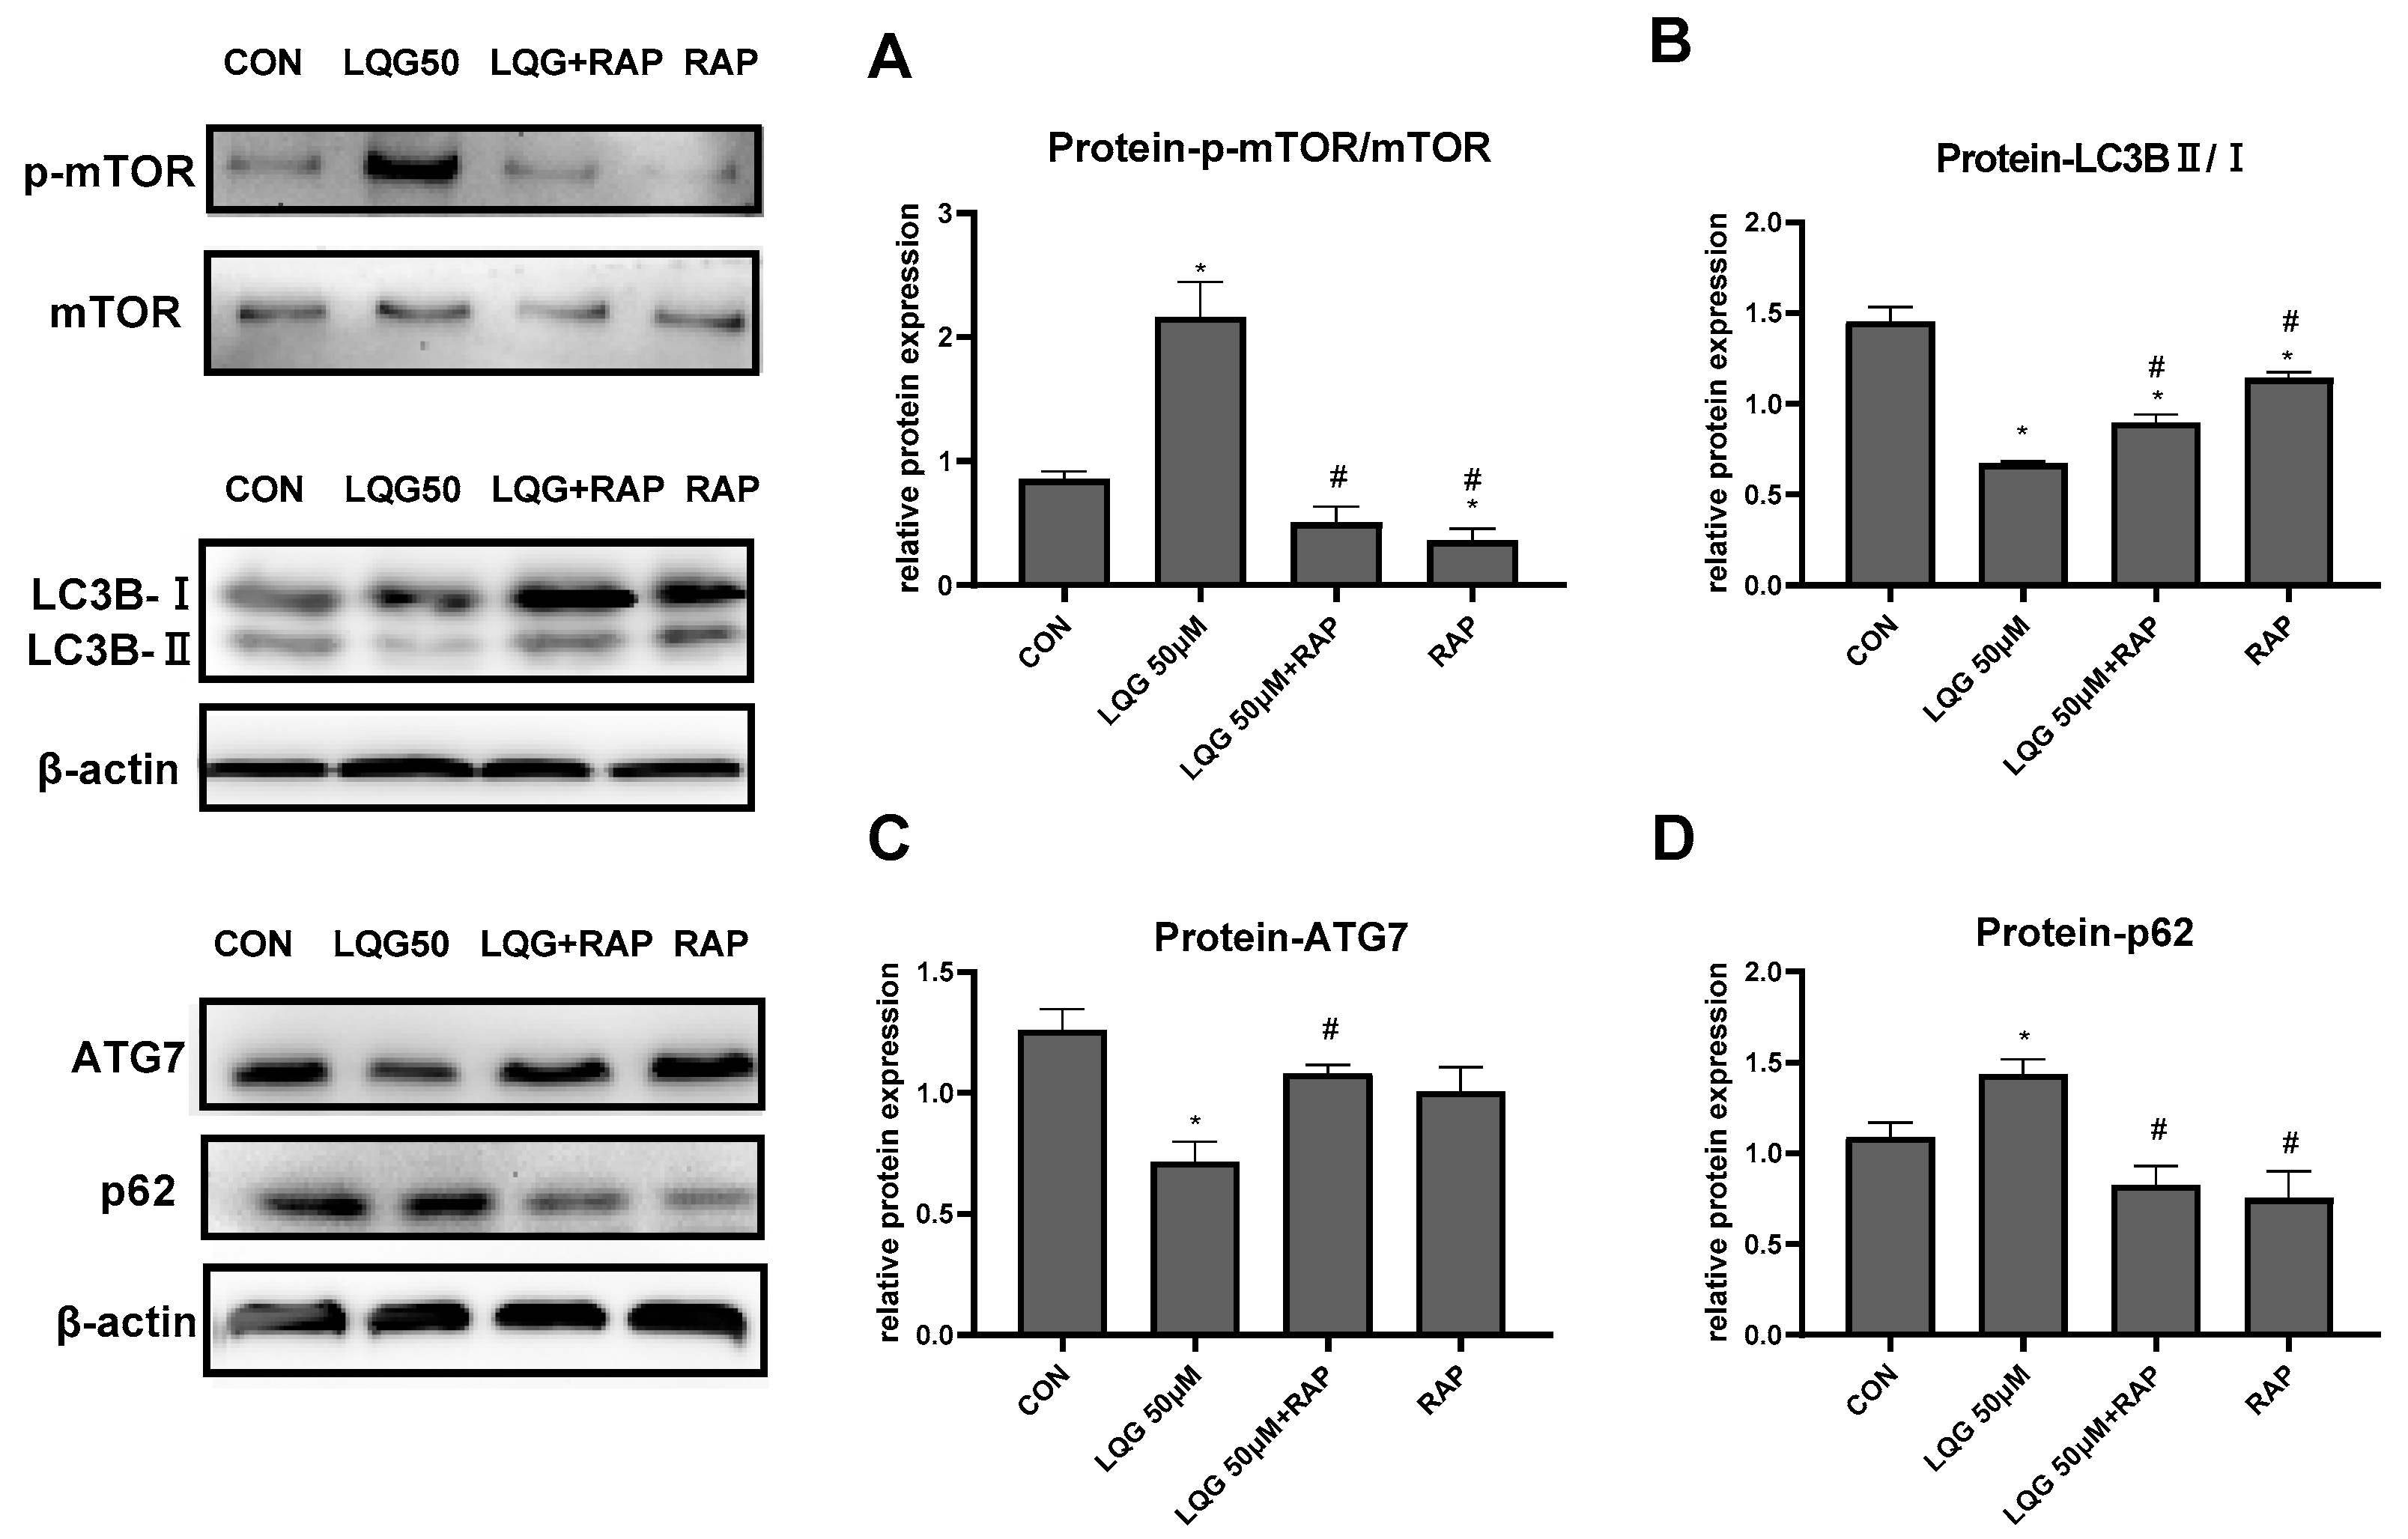
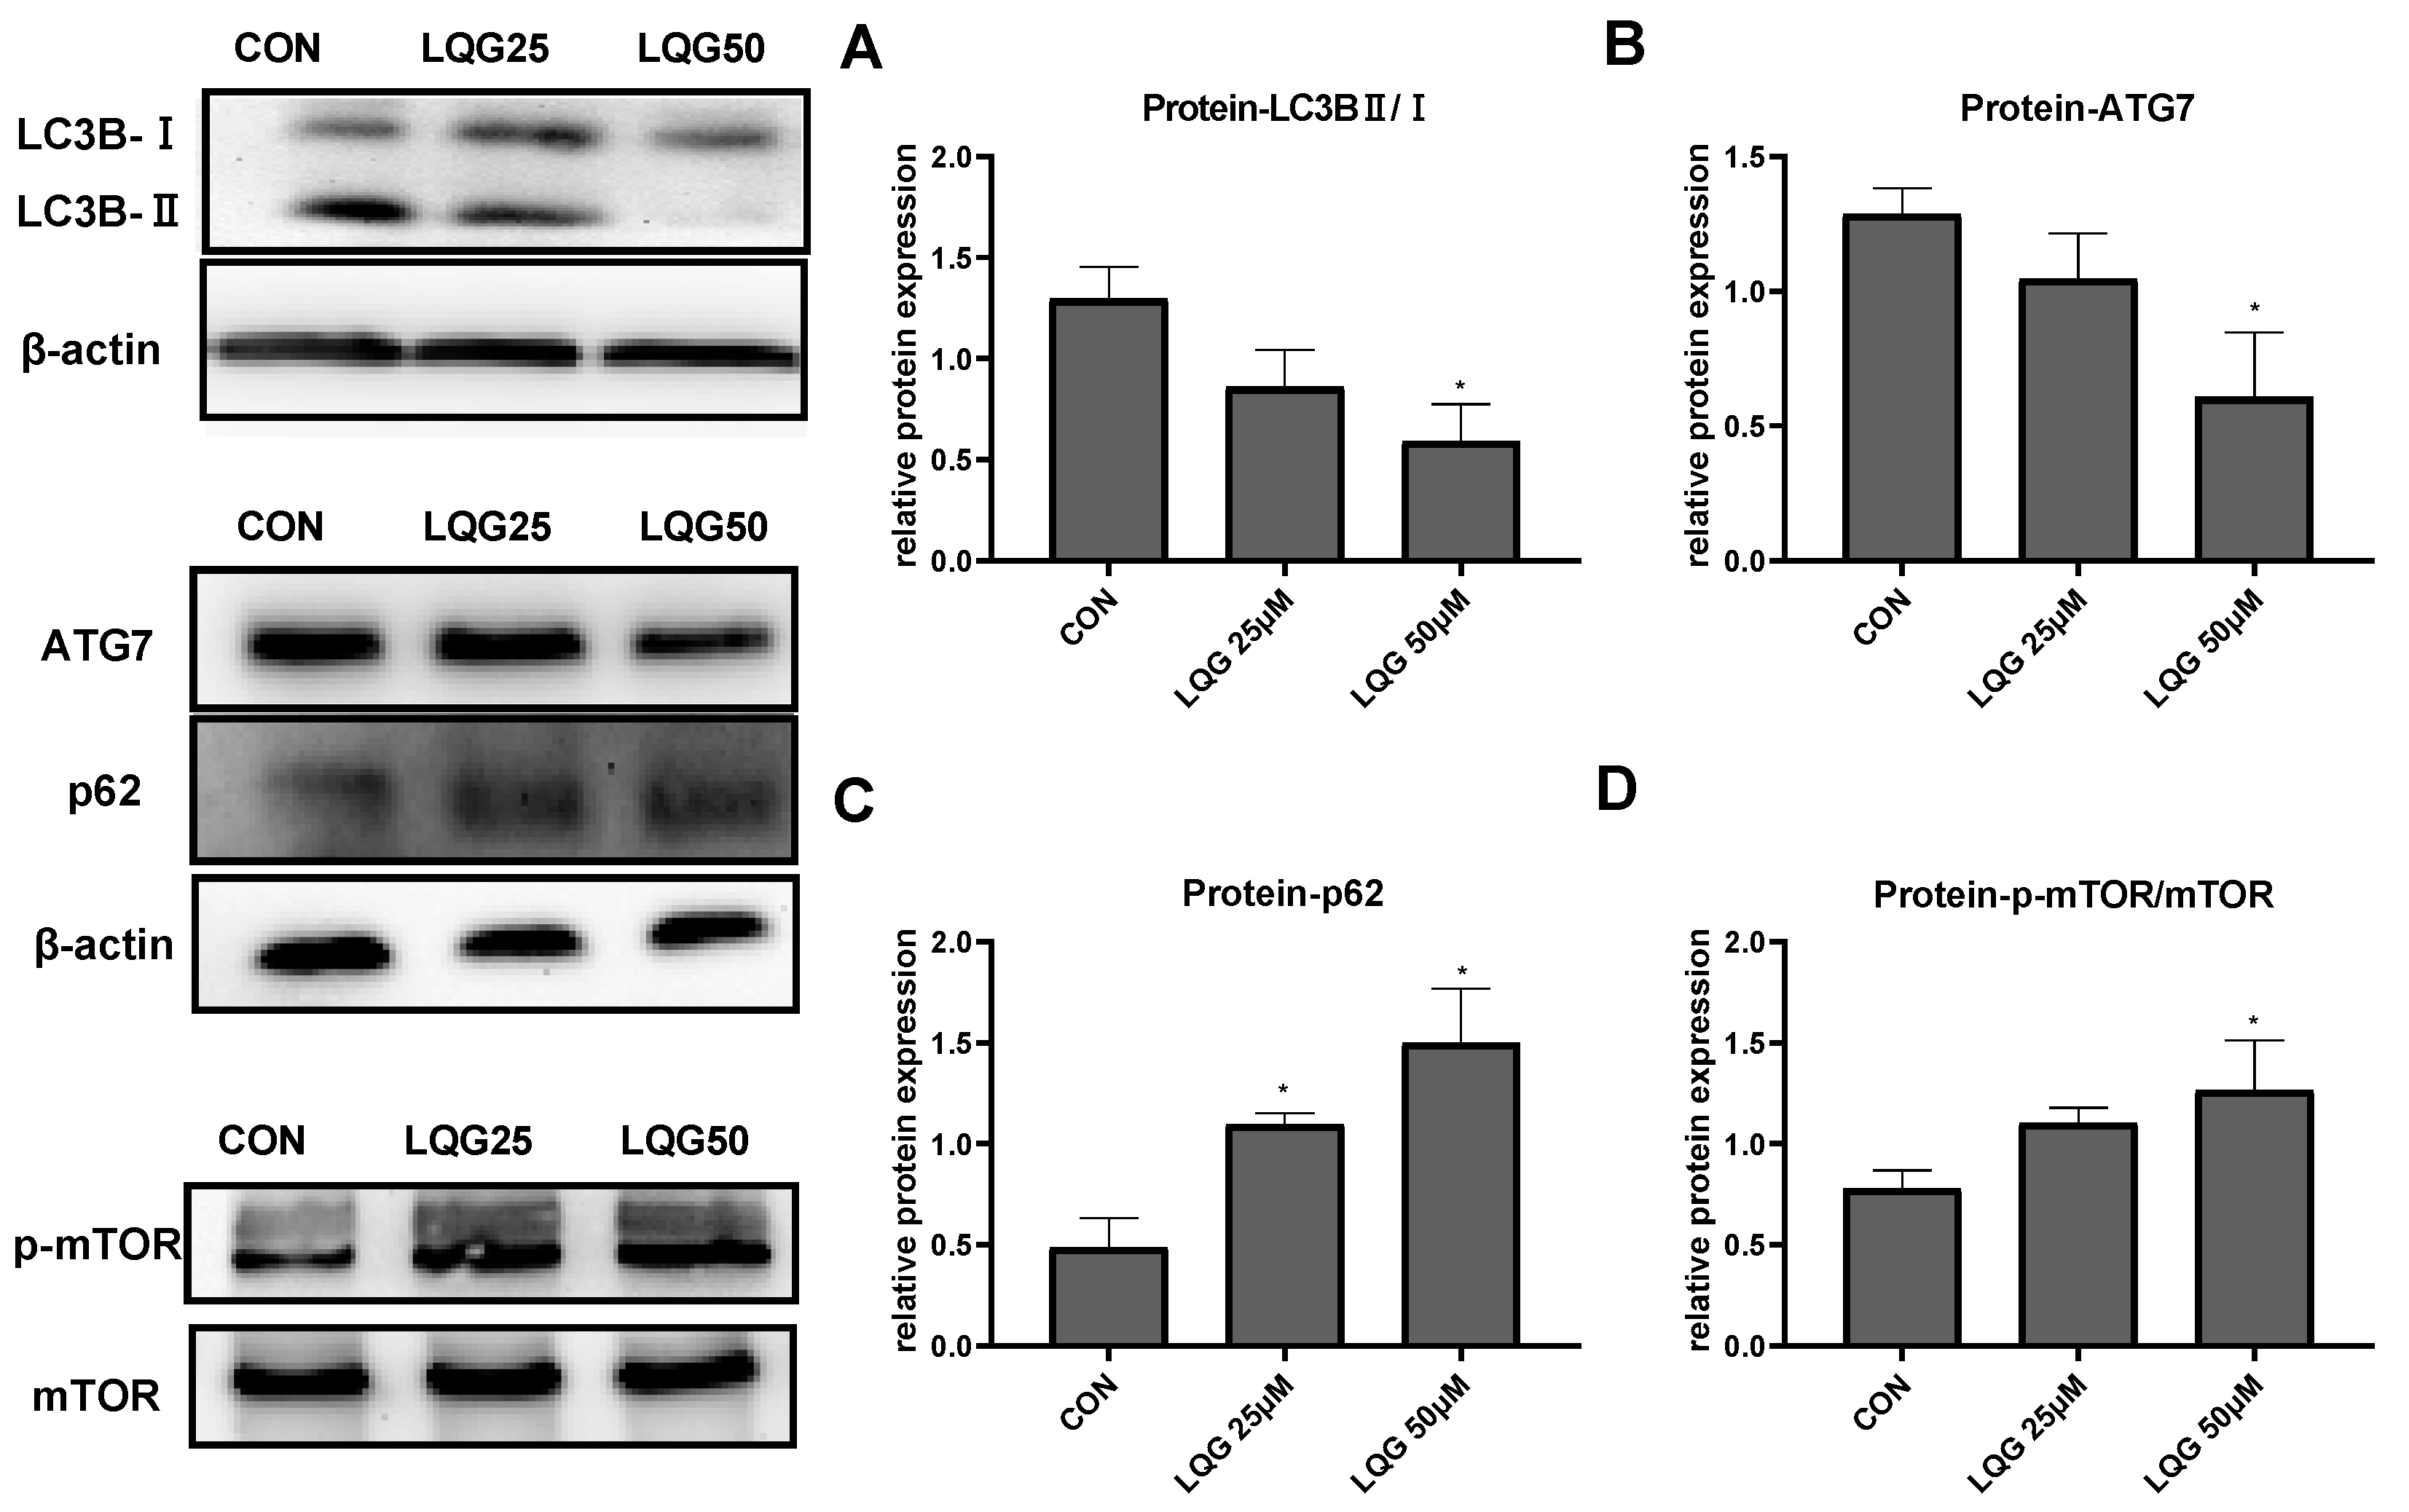
3.3. Effects of LQG on Autophagy-Related Protein Expression in 3T3-L1 Adipocytes
3.4. LQG Regulated Autophagy via mTOR in 3T3-L1 Adipocytes
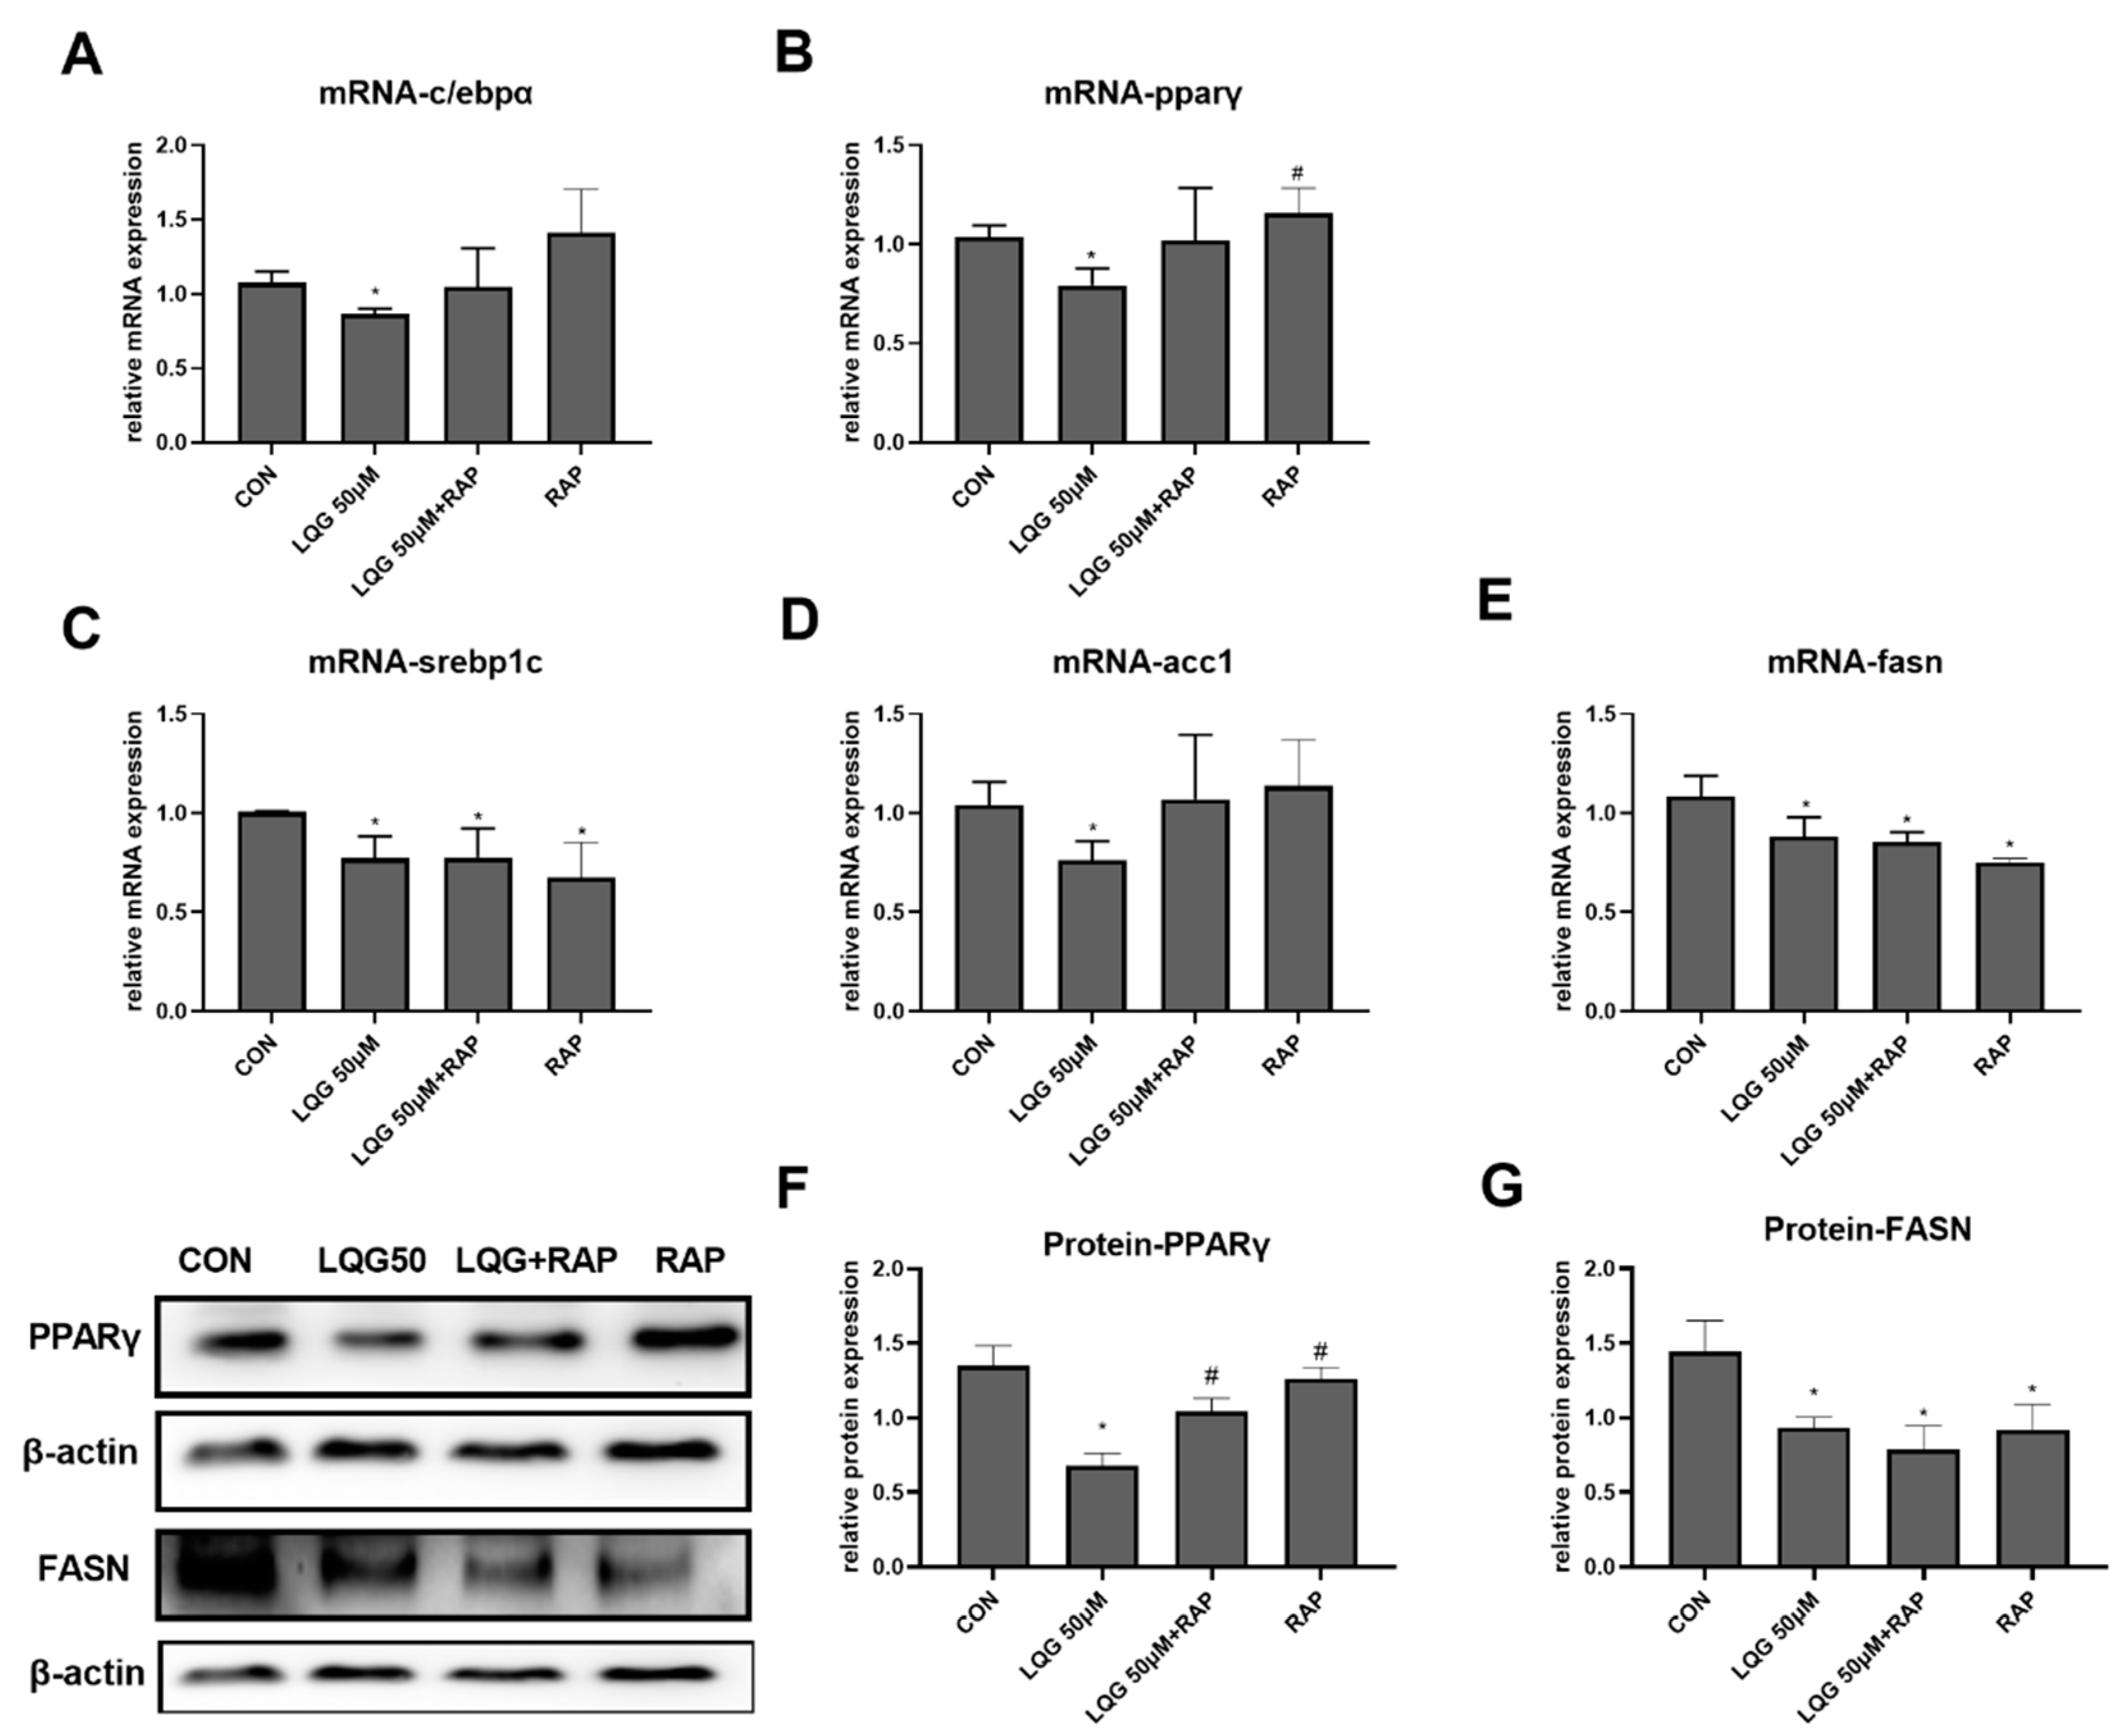
3.5. The Role of mTOR in Lipogenic Regulatory Factors in LQG-Treated Adipocytes
4. Discussion
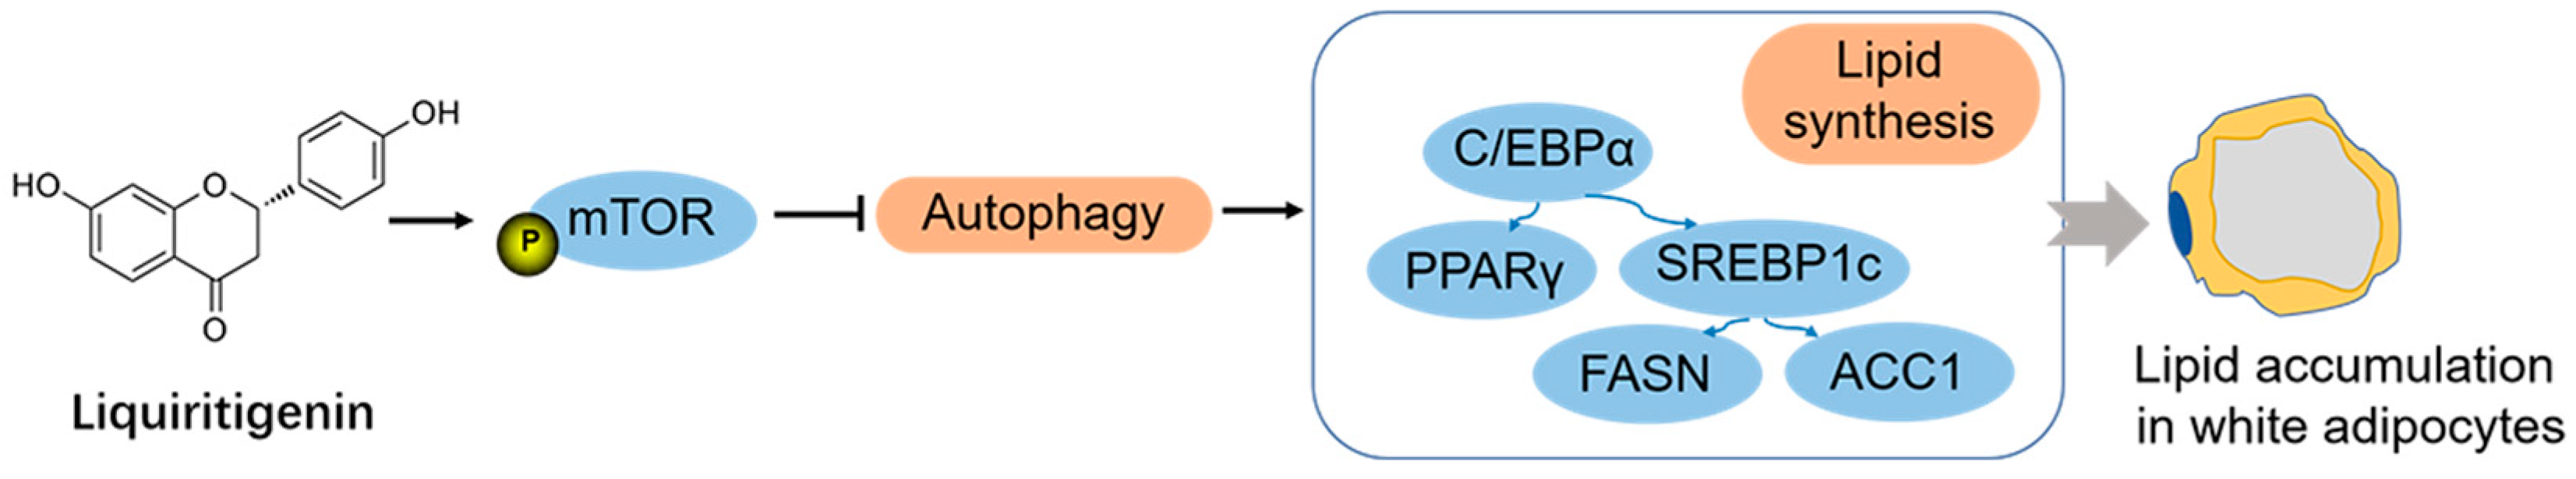
5. Conclusions
Author Contributions
Funding
Conflicts of Interest
References
- Kopelman, P.G. Obesity as a medical problem. Nature 2000, 404, 635–643. [Google Scholar] [CrossRef] [PubMed]
- Saunders, K.H.; Umashanker, D.; Igel, L.I.; Kumar, R.B.; Aronne, L.J. Obesity Pharmacotherapy. Med. Clin. N. Am. 2018, 102, 135–148. [Google Scholar] [CrossRef]
- Derosa, G.; Maffioli, P. Anti-obesity drugs: A review about their effects and their safety. Expert Opin. Drug Saf. 2012, 11, 459–471. [Google Scholar] [CrossRef] [PubMed]
- Hall, K.D.; Guo, J. Obesity Energetics: Body Weight Regulation and the Effects of Diet Composition. Gastroenterology 2017, 152, 1718–1727.e3. [Google Scholar] [CrossRef] [Green Version]
- Rosen, E.D.; MacDougald, O.A. Adipocyte differentiation from the inside out. Nat. Rev. Mol. Cell Biol. 2006, 7, 885–896. [Google Scholar] [CrossRef]
- Hammarstedt, A.; Gogg, S.; Hedjazifar, S.; Nerstedt, A.; Smith, U. Impaired Adipogenesis and Dysfunctional Adipose Tissue in Human Hypertrophic Obesity. Physiol. Rev. 2018, 98, 1911–1941. [Google Scholar] [CrossRef] [PubMed]
- Choi, Y.R.; Shim, J.; Kim, M.J. Genistin: A Novel Potent Anti-Adipogenic and Anti-Lipogenic Agent. Molecules 2020, 25, 2042. [Google Scholar] [CrossRef]
- Kubota, N.; Terauchi, Y.; Miki, H.; Tamemoto, H.; Yamauchi, T.; Komeda, K.; Satoh, S.; Nakano, R.; Ishii, C.; Sugiyama, T.; et al. PPAR gamma mediates high-fat diet-induced adipocyte hypertrophy and insulin resistance. Mol. Cell 1999, 4, 597–609. [Google Scholar] [CrossRef]
- Sewter, C.; Blows, F.; Considine, R.; Vidal-Puig, A.; O’Rahilly, S. Differential effects of adiposity on peroxisomal proliferator-activated receptor gamma1 and gamma2 messenger ribonucleic acid expression in human adipocytes. J. Clin. Endocrinol. Metab. 2002, 87, 4203–4207. [Google Scholar] [CrossRef] [Green Version]
- Mota de Sá, P.; Richard, A.J.; Hang, H.; Stephens, J.M. Transcriptional Regulation of Adipogenesis. Compr. Physiol. 2017, 7, 635–674. [Google Scholar]
- Mizushima, N.; Levine, B.; Cuervo, A.M.; Klionsky, D.J. Autophagy fights disease through cellular self-digestion. Nature 2008, 451, 1069–1075. [Google Scholar] [CrossRef] [PubMed] [Green Version]
- Cecconi, F.; Levine, B. The role of autophagy in mammalian development: Cell makeover rather than cell death. Dev. Cell 2008, 15, 344–357. [Google Scholar] [CrossRef] [Green Version]
- Goldman, S.J.; Zhang, Y.; Jin, S. Autophagic degradation of mitochondria in white adipose tissue differentiation. Antioxid. Redox Signal. 2011, 14, 1971–1978. [Google Scholar] [CrossRef] [Green Version]
- Dong, H.; Czaja, M.J. Regulation of lipid droplets by autophagy. Trends Endocrinol. Metab. TEM 2011, 22, 234–240. [Google Scholar] [CrossRef] [Green Version]
- Singh, R.; Xiang, Y.; Wang, Y.; Baikati, K.; Cuervo, A.M.; Luu, Y.K.; Tang, Y.; Pessin, J.E.; Schwartz, G.J.; Czaja, M.J. Autophagy regulates adipose mass and differentiation in mice. J. Clin. Investig. 2009, 119, 3329–3339. [Google Scholar] [CrossRef] [PubMed] [Green Version]
- Kovsan, J.; Blüher, M.; Tarnovscki, T.; Klöting, N.; Kirshtein, B.; Madar, L.; Shai, I.; Golan, R.; Harman-Boehm, I.; Schön, M.R.; et al. Altered autophagy in human adipose tissues in obesity. J. Clin. Endocrinol. Metab. 2011, 96, E268–E277. [Google Scholar] [CrossRef] [PubMed]
- Kao, T.C.; Wu, C.H.; Yen, G.C. Bioactivity and potential health benefits of licorice. J. Agric. Food Chem. 2014, 62, 542–553. [Google Scholar] [CrossRef]
- Kim, Y.W.; Zhao, R.J.; Park, S.J.; Lee, J.R.; Cho, I.J.; Yang, C.H.; Kim, S.G.; Kim, S.C. Anti-inflammatory effects of liquiritigenin as a consequence of the inhibition of NF-kappaB-dependent iNOS and proinflammatory cytokines production. Br. J. Pharmacol. 2008, 154, 165–173. [Google Scholar] [CrossRef] [Green Version]
- Kim, G.-H.; Ju, J.-Y.; Chung, K.-S.; Cheon, S.-Y.; Gil, T.-Y.; Cominguez, D.C.; Cha, Y.-Y.; Lee, J.-H.; Roh, S.-S.; An, H.-J. Rice Hull Extract (RHE) Suppresses Adiposity in High-Fat Diet-Induced Obese Mice and Inhibits Differentiation of 3T3-L1 Preadipocytes. Nutrients 2019, 11, 1162. [Google Scholar] [CrossRef] [Green Version]
- Yuan, X.; Wang, Z.; Zhang, L.; Sui, R.; Khan, S. Exploring the inhibitory effects of liquiritigenin against tau fibrillation and related neurotoxicity as a model of preventive care in Alzheimer’s disease. Int. J. Biol. Macromol. 2021, 183, 1184–1190. [Google Scholar] [CrossRef]
- Lee, H.E.; Yang, G.; Han, S.H.; Lee, J.H.; An, T.J.; Jang, J.K.; Lee, J.Y. Anti-obesity potential of Glycyrrhiza uralensis and licochalcone A through induction of adipocyte browning. Biochem. Biophys. Res. Commun. 2018, 503, 2117–2123. [Google Scholar] [CrossRef] [PubMed]
- Madak-Erdogan, Z.; Gong, P.; Zhao, Y.C.; Xu, L.; Wrobel, K.U.; Hartman, J.A.; Wang, M.; Cam, A.; Iwaniec, U.T.; Turner, R.T.; et al. Dietary licorice root supplementation reduces diet-induced weight gain, lipid deposition, and hepatic steatosis in ovariectomized mice without stimulating reproductive tissues and mammary gland. Mol. Nutr. Food Res. 2016, 60, 369–380. [Google Scholar] [CrossRef] [Green Version]
- Fan, L.; Xu, H.; Yang, R.; Zang, Y.; Chen, J.; Qin, H. Combination of Capsaicin and Capsiate Induces Browning in 3T3-L1 White Adipocytes via Activation of the Peroxisome Proliferator-Activated Receptor γ/β(3)-Adrenergic Receptor Signaling Pathways. J. Agric. Food Chem. 2019, 67, 6232–6240. [Google Scholar] [CrossRef] [PubMed] [Green Version]
- Eckel, R.H.; Grundy, S.M.; Zimmet, P.Z. The metabolic syndrome. Lancet 2005, 365, 1415–1428. [Google Scholar] [CrossRef]
- Gong, X.M.; Li, Y.F.; Luo, J.; Wang, J.Q.; Wei, J.; Wang, J.Q.; Xiao, T.; Xie, C.; Hong, J.; Ning, G.; et al. Gpnmb secreted from liver promotes lipogenesis in white adipose tissue and aggravates obesity and insulin resistance. Nat. Metab. 2019, 1, 570–583. [Google Scholar] [CrossRef] [PubMed]
- Song, Z.; Xiaoli, A.M.; Yang, F. Regulation and Metabolic Significance of De Novo Lipogenesis in Adipose Tissues. Nutrients 2018, 10, 1383. [Google Scholar] [CrossRef] [Green Version]
- Heinonen, S.; Jokinen, R.; Rissanen, A.; Pietiläinen, K.H. White adipose tissue mitochondrial metabolism in health and in obesity. Obes. Rev. Off. J. Int. Assoc. Study Obes. 2020, 21, e12958. [Google Scholar] [CrossRef]
- Kim, Y.W.; Ki, S.H.; Lee, J.R.; Lee, S.J.; Kim, C.W.; Kim, S.C.; Kim, S.G. Liquiritigenin, an aglycone of liquiritin in Glycyrrhizae radix, prevents acute liver injuries in rats induced by acetaminophen with or without buthionine sulfoximine. Chem.-Biol. Interact. 2006, 161, 125–138. [Google Scholar] [CrossRef]
- Strable, M.S.; Ntambi, J.M. Genetic control of de novo lipogenesis: Role in diet-induced obesity. Crit. Rev. Biochem. Mol. Biol. 2010, 45, 199–214. [Google Scholar] [CrossRef] [Green Version]
- Ameer, F.; Scandiuzzi, L.; Hasnain, S.; Kalbacher, H.; Zaidi, N. De novo lipogenesis in health and disease. Metabolism 2014, 63, 895–902. [Google Scholar] [CrossRef]
- Tontonoz, P.; Spiegelman, B.M. Fat and beyond: The diverse biology of PPARgamma. Annu. Rev. Biochem. 2008, 77, 289–312. [Google Scholar] [CrossRef] [PubMed]
- Magaña, M.M.; Lin, S.S.; Dooley, K.A.; Osborne, T.F. Sterol regulation of acetyl coenzyme A carboxylase promoter requires two interdependent binding sites for sterol regulatory element binding proteins. J. Lipid Res. 1997, 38, 1630–1638. [Google Scholar] [CrossRef]
- Payne, V.A.; Au, W.S.; Lowe, C.E.; Rahman, S.M.; Friedman, J.E.; O’Rahilly, S.; Rochford, J.J. C/EBP transcription factors regulate SREBP1c gene expression during adipogenesis. Biochem. J. 2009, 425, 215–223. [Google Scholar] [CrossRef] [PubMed] [Green Version]
- Watanabe, M.; Hisatake, M.; Fujimori, K. Fisetin Suppresses Lipid Accumulation in Mouse Adipocytic 3T3-L1 Cells by Repressing GLUT4-Mediated Glucose Uptake through Inhibition of mTOR-C/EBPα Signaling. J. Agric. Food Chem. 2015, 63, 4979–4987. [Google Scholar] [CrossRef] [PubMed]
- Chen, J.; Zhao, H.; Ma, X.; Zhang, Y.; Lu, S.; Wang, Y.; Zong, C.; Qin, D.; Wang, Y.; Yingfeng Yang, Y.; et al. GLP-1/GLP-1R Signaling in Regulation of Adipocyte Differentiation and Lipogenesis. Cell. Physiol. Biochem. Int. J. Exp. Cell. Physiol. Biochem. Pharmacol. 2017, 42, 1165–1176. [Google Scholar] [CrossRef] [PubMed]
- Chen, J.; Ren, J.; Jing, Q.; Lu, S.; Zhang, Y.; Liu, Y.; Yu, C.; Gao, P.; Zong, C.; Li, X.; et al. TSH/TSHR Signaling Suppresses Fatty Acid Synthase (FASN) Expression in Adipocytes. J. Cell Physiol. 2015, 230, 2233–2239. [Google Scholar] [CrossRef] [PubMed]
- Levine, B.; Yuan, J. Autophagy in cell death: An innocent convict? J. Clin. Investig. 2005, 115, 2679–2688. [Google Scholar] [CrossRef] [PubMed]
- Zhang, Y.; Goldman, S.; Baerga, R.; Zhao, Y.; Komatsu, M.; Jin, S. Adipose-specific deletion of autophagy-related gene 7 (atg7) in mice reveals a role in adipogenesis. Proc. Natl. Acad. Sci. USA 2009, 106, 19860–19865. [Google Scholar] [CrossRef] [PubMed] [Green Version]
- Baerga, R.; Zhang, Y.; Chen, P.H.; Goldman, S.; Jin, S. Targeted deletion of autophagy-related 5 (atg5) impairs adipogenesis in a cellular model and in mice. Autophagy 2009, 5, 1118–1130. [Google Scholar] [CrossRef] [Green Version]
- Leu, S.Y.; Chen, Y.C.; Tsai, Y.C.; Hung, Y.W.; Hsu, C.H.; Lee, Y.M.; Cheng, P.Y. Raspberry Ketone Reduced Lipid Accumulation in 3T3-L1 Cells and Ovariectomy-Induced Obesity in Wistar Rats by Regulating Autophagy Mechanisms. J. Agric. Food Chem. 2017, 65, 10907–10914. [Google Scholar] [CrossRef]
- Bartlett, B.J.; Isakson, P.; Lewerenz, J.; Sanchez, H.; Kotzebue, R.W.; Cumming, R.C.; Harris, G.L.; Nezis, I.P.; Schubert, D.R.; Simonsen, A.; et al. p62, Ref(2)P and ubiquitinated proteins are conserved markers of neuronal aging, aggregate formation and progressive autophagic defects. Autophagy 2011, 7, 572–583. [Google Scholar] [CrossRef] [PubMed] [Green Version]
- Kim, Y.C.; Guan, K.L. mTOR: A pharmacologic target for autophagy regulation. J. Clin. Investig. 2015, 125, 25–32. [Google Scholar] [CrossRef] [PubMed] [Green Version]
- Zhang, M.; Xue, Y.; Zheng, B.; Li, L.; Chu, X.; Zhao, Y.; Wu, Y.; Zhang, J.; Han, X.; Wu, Z.; et al. Liquiritigenin protects against arsenic trioxide-induced liver injury by inhibiting oxidative stress and enhancing mTOR-mediated autophagy. Biomed. Pharmacother. 2021, 143, 112167. [Google Scholar] [CrossRef] [PubMed]
- Singh, R. Autophagy and regulation of lipid metabolism. Results Probl. Cell Differ. 2010, 52, 35–46. [Google Scholar] [PubMed] [Green Version]
- Bae, J.; Jang, Y.; Kim, H.; Mahato, K.; Schaecher, C.; Kim, I.M.; Kim, E.; Ro, S.H. Arsenite exposure suppresses adipogenesis, mitochondrial biogenesis and thermogenesis via autophagy inhibition in brown adipose tissue. Sci. Rep. 2019, 9, 14464. [Google Scholar] [CrossRef]
- Liu, Z.; Liao, W.; Yin, X.; Zheng, X.; Li, Q.; Zhang, H.; Zheng, L.; Feng, X. Resveratrol-induced brown fat-like phenotype in 3T3-L1 adipocytes partly via mTOR pathway. Food Nutr. Res. 2020, 64, 3656. [Google Scholar] [CrossRef] [Green Version]
- Lamming, D.W.; Sabatini, D.M. A Central role for mTOR in lipid homeostasis. Cell Metab. 2013, 18, 465–469. [Google Scholar] [CrossRef] [Green Version]
- Peterson, T.R.; Sengupta, S.S.; Harris, T.E.; Carmack, A.E.; Kang, S.A.; Balderas, E.; Guertin, D.A.; Madden, K.L.; Carpenter, A.E.; Finck, B.N.; et al. mTOR complex 1 regulates lipin 1 localization to control the SREBP pathway. Cell 2011, 146, 408–420. [Google Scholar] [CrossRef] [Green Version]
- Zhang, P.; Takeuchi, K.; Csaki, L.S.; Reue, K. Lipin-1 phosphatidic phosphatase activity modulates phosphatidate levels to promote peroxisome proliferator-activated receptor γ (PPARγ) gene expression during adipogenesis. J. Biol. Chem. 2012, 287, 3485–3494. [Google Scholar] [CrossRef] [Green Version]
- Bakan, I.; Laplante, M. Connecting mTORC1 signaling to SREBP-1 activation. Curr. Opin. Lipidol. 2012, 23, 226–234. [Google Scholar] [CrossRef]
- Qin, H.; Song, Z.; Shaukat, H.; Zheng, W. Genistein Regulates Lipid Metabolism via Estrogen Receptor β and Its Downstream Signal Akt/mTOR in HepG2 Cells. Nutrients 2021, 13, 4015. [Google Scholar] [CrossRef] [PubMed]
- Gagnon, A.; Lau, S.; Sorisky, A. Rapamycin-sensitive phase of 3T3-L1 preadipocyte differentiation after clonal expansion. J. Cell Physiol. 2001, 189, 14–22. [Google Scholar] [CrossRef] [PubMed]
- Li, S.; Brown, M.S.; Goldstein, J.L. Bifurcation of insulin signaling pathway in rat liver: mTORC1 required for stimulation of lipogenesis, but not inhibition of gluconeogenesis. Proc. Natl. Acad. Sci. USA 2010, 107, 3441–3446. [Google Scholar] [CrossRef] [PubMed] [Green Version]
- Yecies, J.L.; Zhang, H.H.; Menon, S.; Liu, S.; Yecies, D.; Lipovsky, A.I.; Gorgun, C.; Kwiatkowski, D.J.; Hotamisligil, G.S.; Lee, C.H.; et al. Akt stimulates hepatic SREBP1c and lipogenesis through parallel mTORC1-dependent and independent pathways. Cell Metab. 2011, 14, 21–32. [Google Scholar] [CrossRef] [PubMed] [Green Version]


| Name | Primer Sequence (5′ to 3′) |
|---|---|
| pparγ | forward: TCTCCCCACATCCTTTCT |
| reverse: CTGCCGTTGTCTGTCACT | |
| c/ebpα | forward: CTGGAAAGAAGGCCACCTC |
| reverse: AAGAGAAGGAAGCGGTCCA | |
| srebp1c | forward: GCAACACAGCAACCAGAA |
| reverse: GAAAGGTGAGCCAGCATC | |
| acc1 | forward: AAAACAGGGAGGAAGCAA |
| reverse: TCACCCCGAATAGACAGC | |
| fasn | forward: GCCCAAGGGAAGCACATT |
| reverse: CGAAGCCACCCAGACCAC | |
| β-actin | forward: TTGCGTTACACCCTTTCT |
| reverse: ACCTTCACCGTTCCAGTT |
Publisher’s Note: MDPI stays neutral with regard to jurisdictional claims in published maps and institutional affiliations. |
© 2022 by the authors. Licensee MDPI, Basel, Switzerland. This article is an open access article distributed under the terms and conditions of the Creative Commons Attribution (CC BY) license (https://creativecommons.org/licenses/by/4.0/).
Share and Cite
Qin, H.; Song, Z.; Zhao, C.; Yang, J.; Xia, F.; Wang, L.; Ali, A.; Zheng, W. Liquiritigenin Inhibits Lipid Accumulation in 3T3-L1 Cells via mTOR-Mediated Regulation of the Autophagy Mechanism. Nutrients 2022, 14, 1287. https://doi.org/10.3390/nu14061287
Qin H, Song Z, Zhao C, Yang J, Xia F, Wang L, Ali A, Zheng W. Liquiritigenin Inhibits Lipid Accumulation in 3T3-L1 Cells via mTOR-Mediated Regulation of the Autophagy Mechanism. Nutrients. 2022; 14(6):1287. https://doi.org/10.3390/nu14061287
Chicago/Turabian StyleQin, Hong, Ziyu Song, Chunyu Zhao, Jinxin Yang, Fan Xia, Lewen Wang, Anwar Ali, and Wenya Zheng. 2022. "Liquiritigenin Inhibits Lipid Accumulation in 3T3-L1 Cells via mTOR-Mediated Regulation of the Autophagy Mechanism" Nutrients 14, no. 6: 1287. https://doi.org/10.3390/nu14061287
APA StyleQin, H., Song, Z., Zhao, C., Yang, J., Xia, F., Wang, L., Ali, A., & Zheng, W. (2022). Liquiritigenin Inhibits Lipid Accumulation in 3T3-L1 Cells via mTOR-Mediated Regulation of the Autophagy Mechanism. Nutrients, 14(6), 1287. https://doi.org/10.3390/nu14061287