
Ketogenic Effects of Multiple Doses of a Medium Chain Triglycerides Enriched Ketogenic Formula in Healthy Men under the Ketogenic Diet: A Randomized, Double-Blinded, Placebo-Controlled Study

 ,
,  , ,
, ,
Abstract
:1. Introduction
2. Materials and Methods
2.1. Subjects
2.2. Case Registration and Randomization
2.3. Test Meals
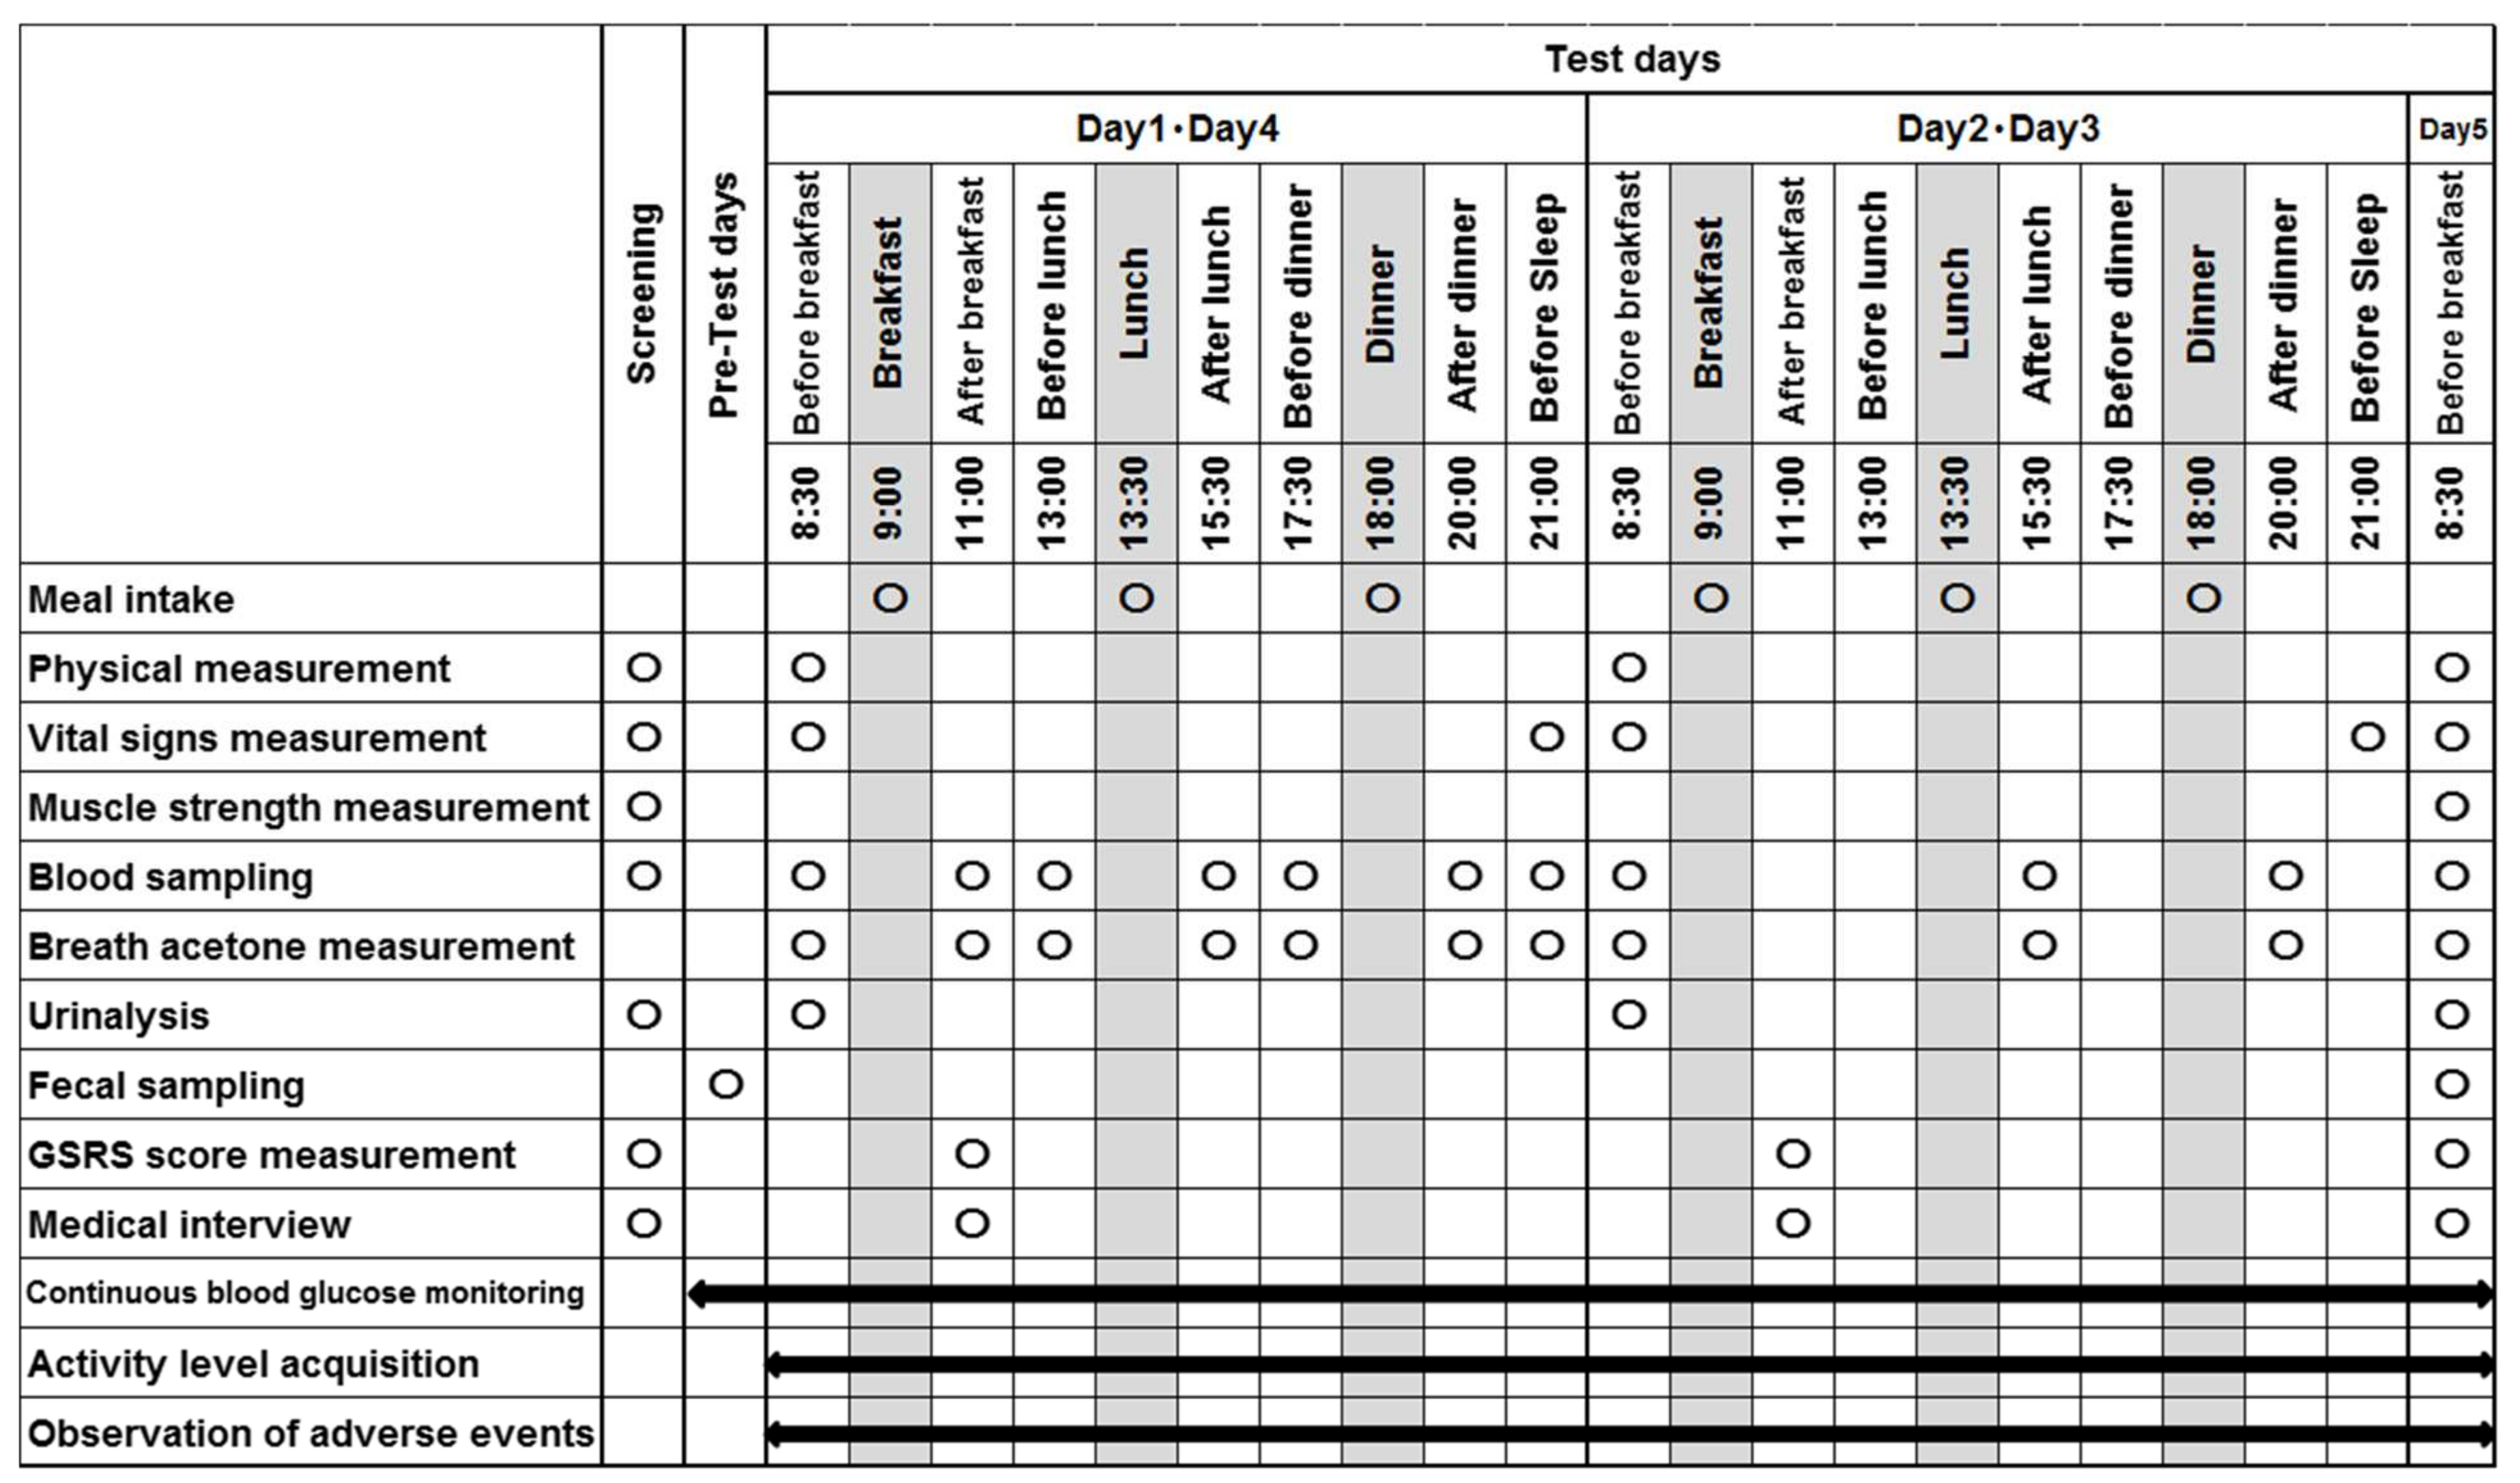
2.4. Study Design
2.5. Experimental Measurements
2.5.1. Physical Measurements
2.5.2. Blood Test
2.5.3. Other Measurement
2.5.4. Gut Microbiota Analysis
2.6. Evaluation (Endpoints)
2.6.1. Primary Outcome
2.6.2. Secondary Outcome
2.6.3. Safety Evaluation
2.7. Statistical Analyses
3. Results
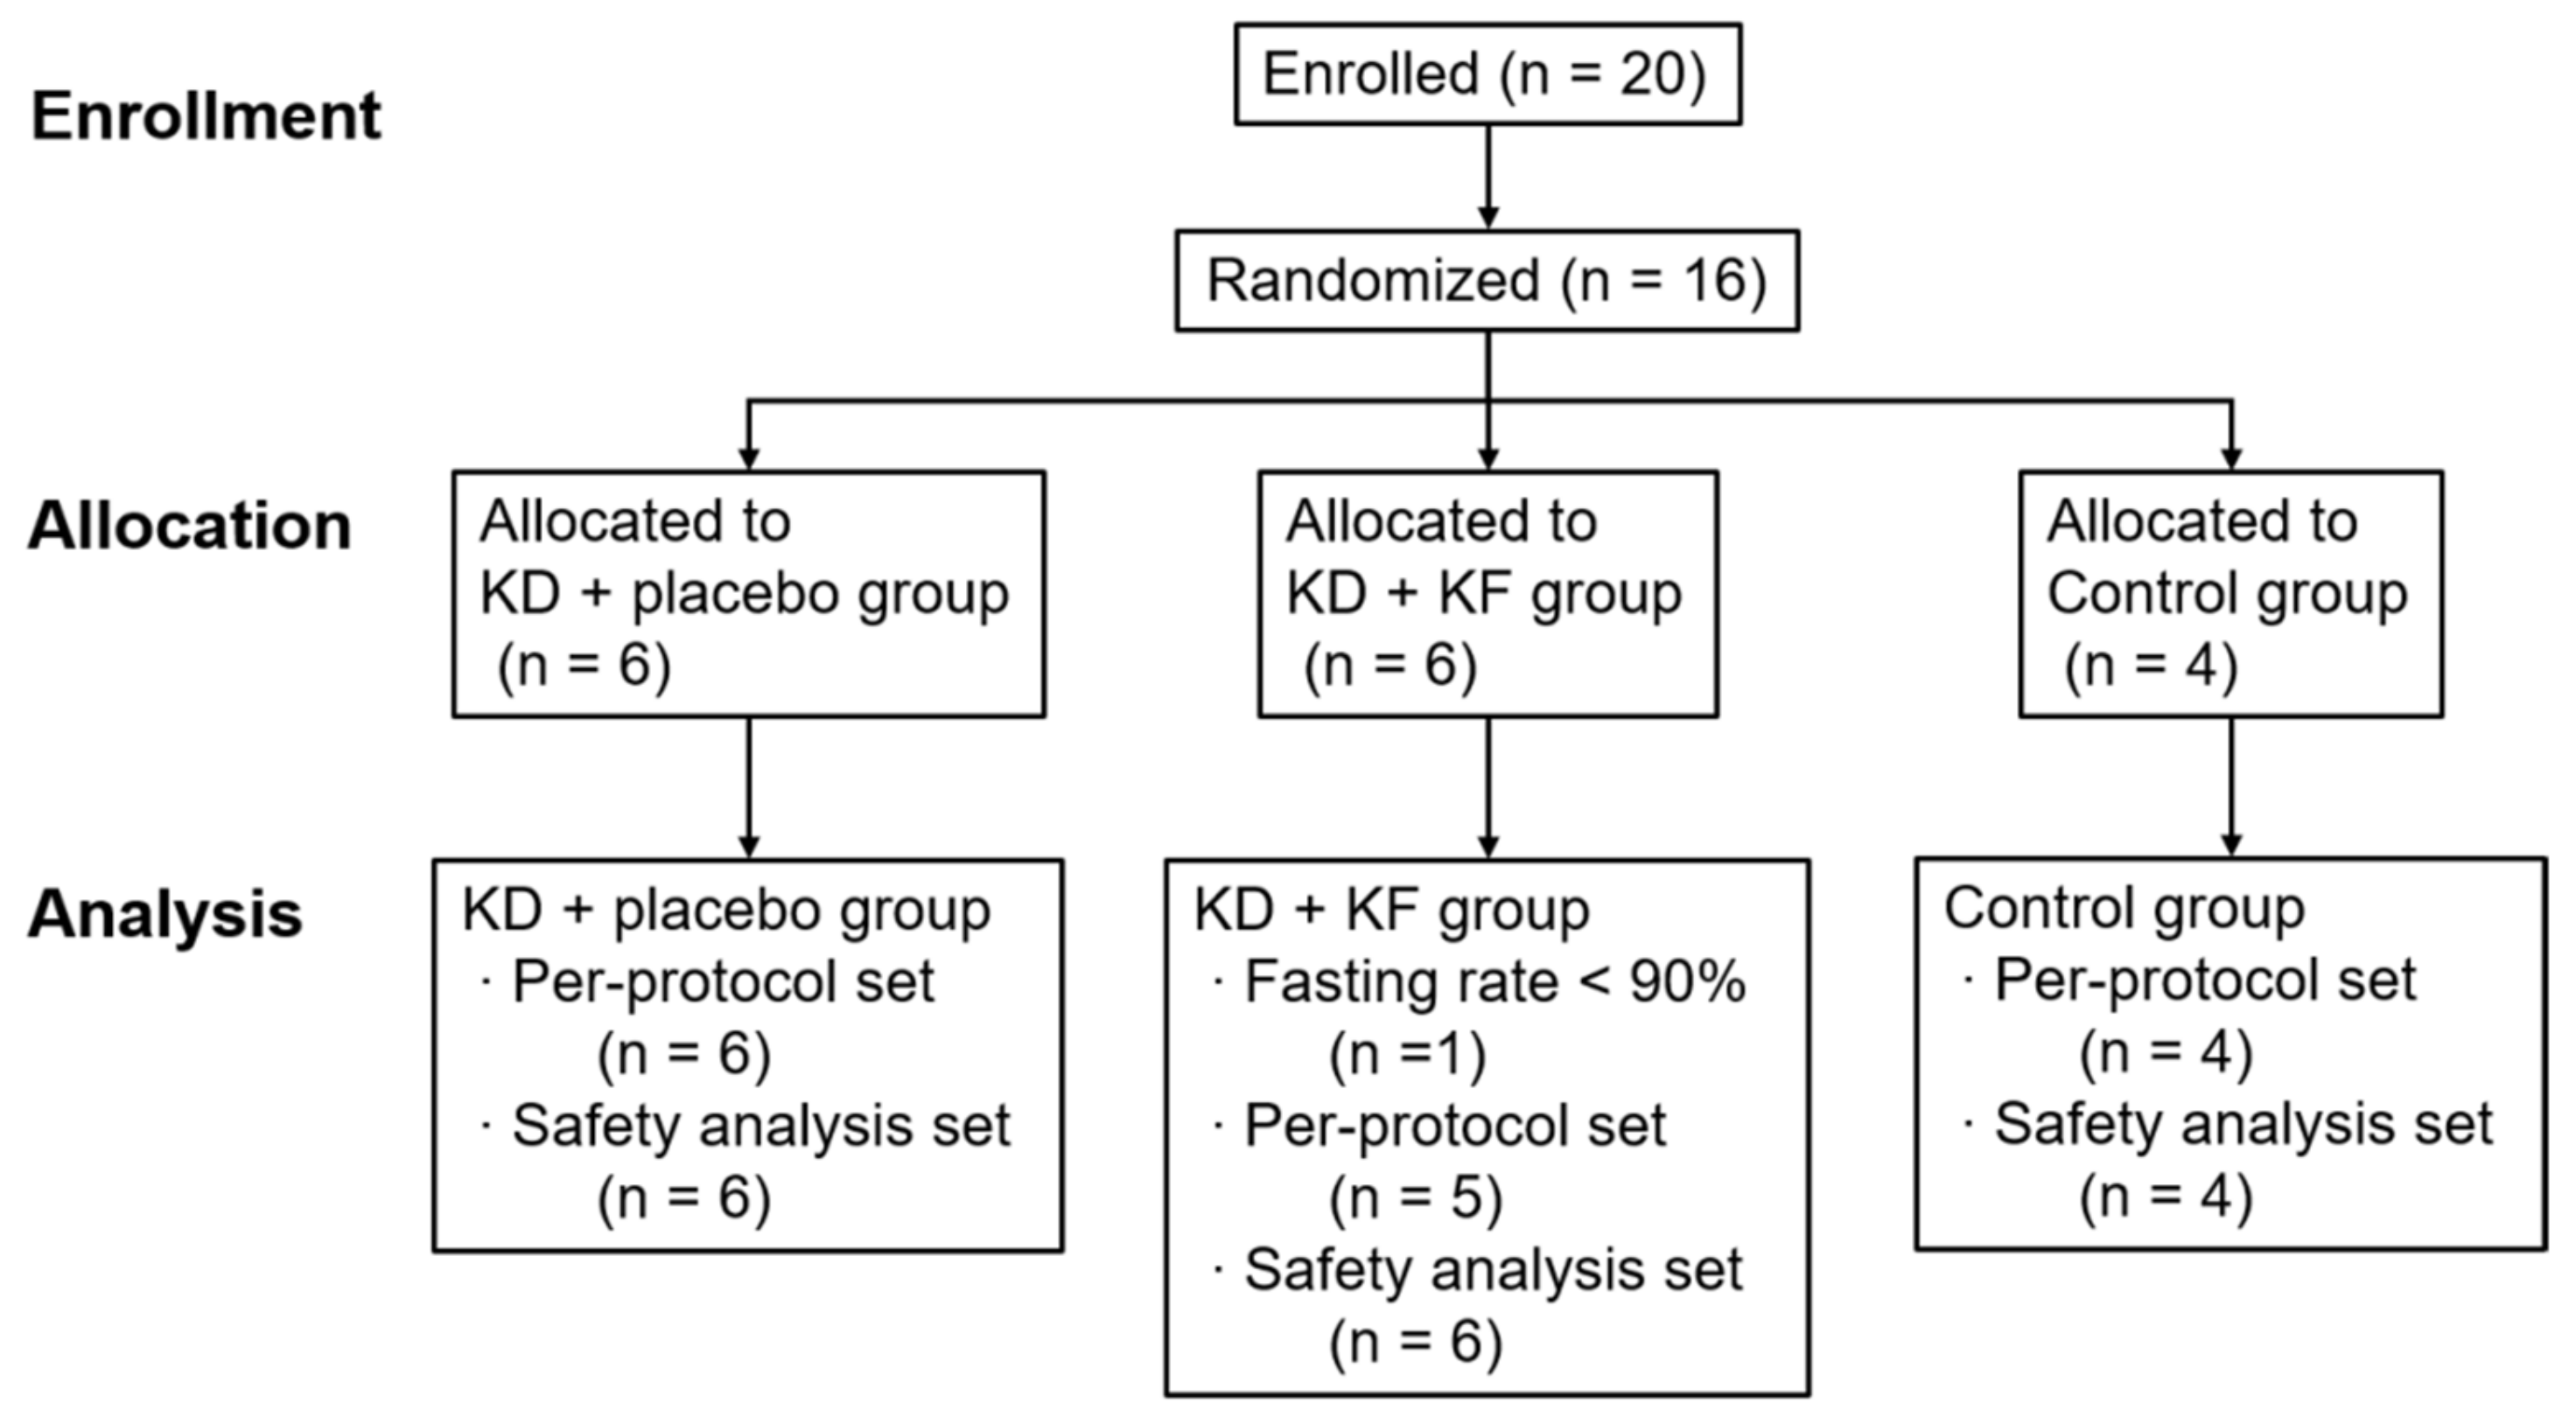
3.1. Participants
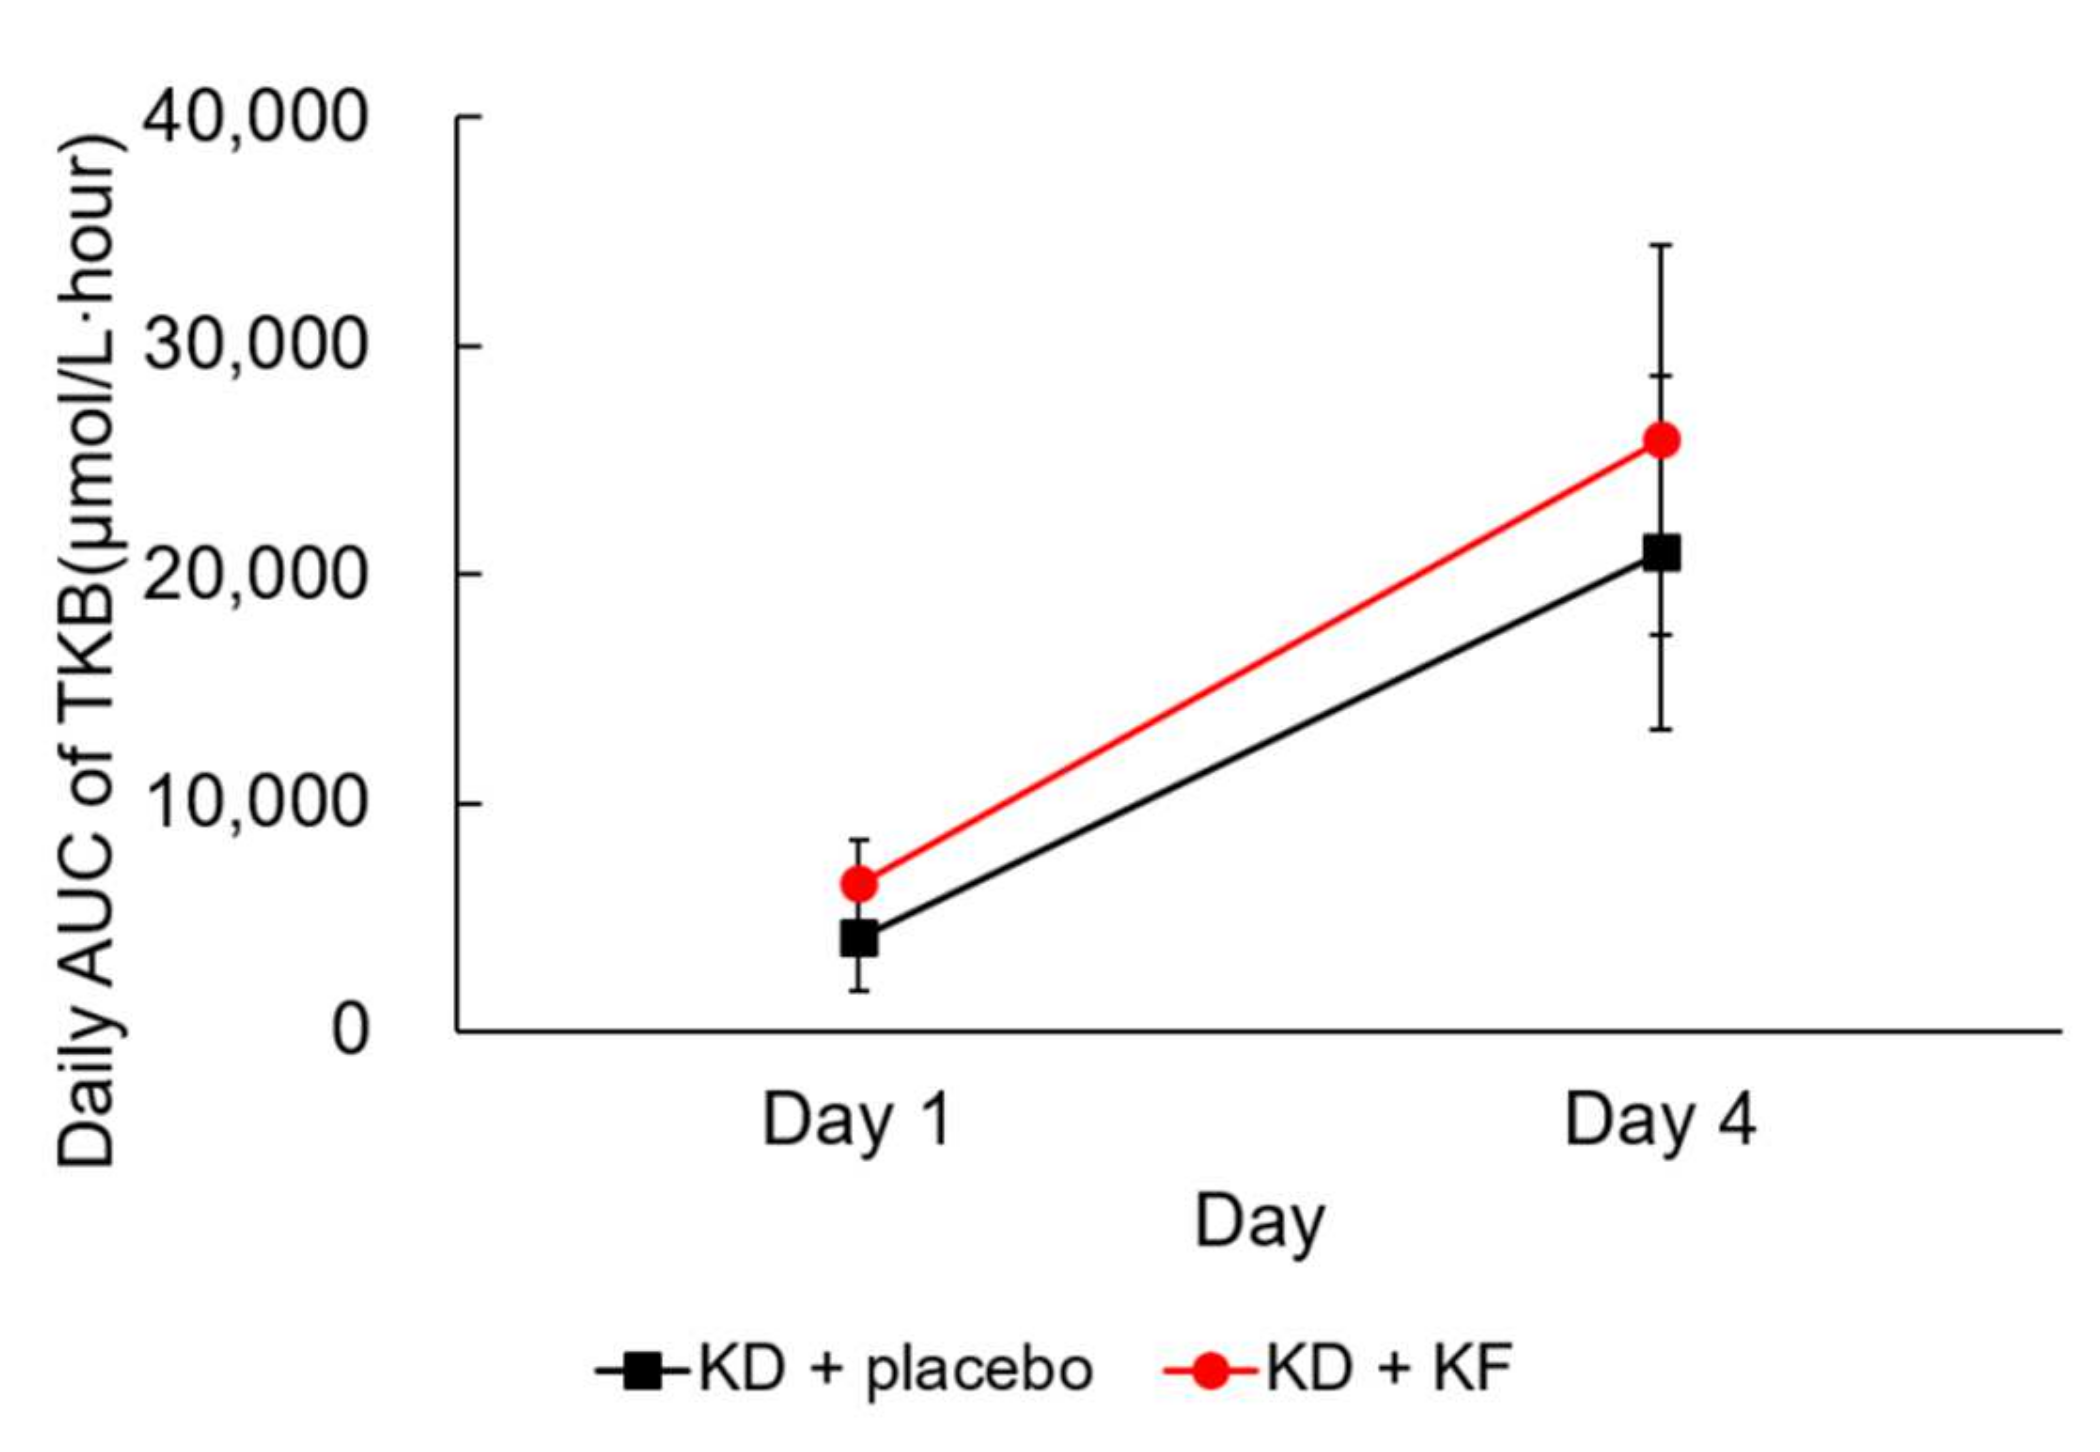
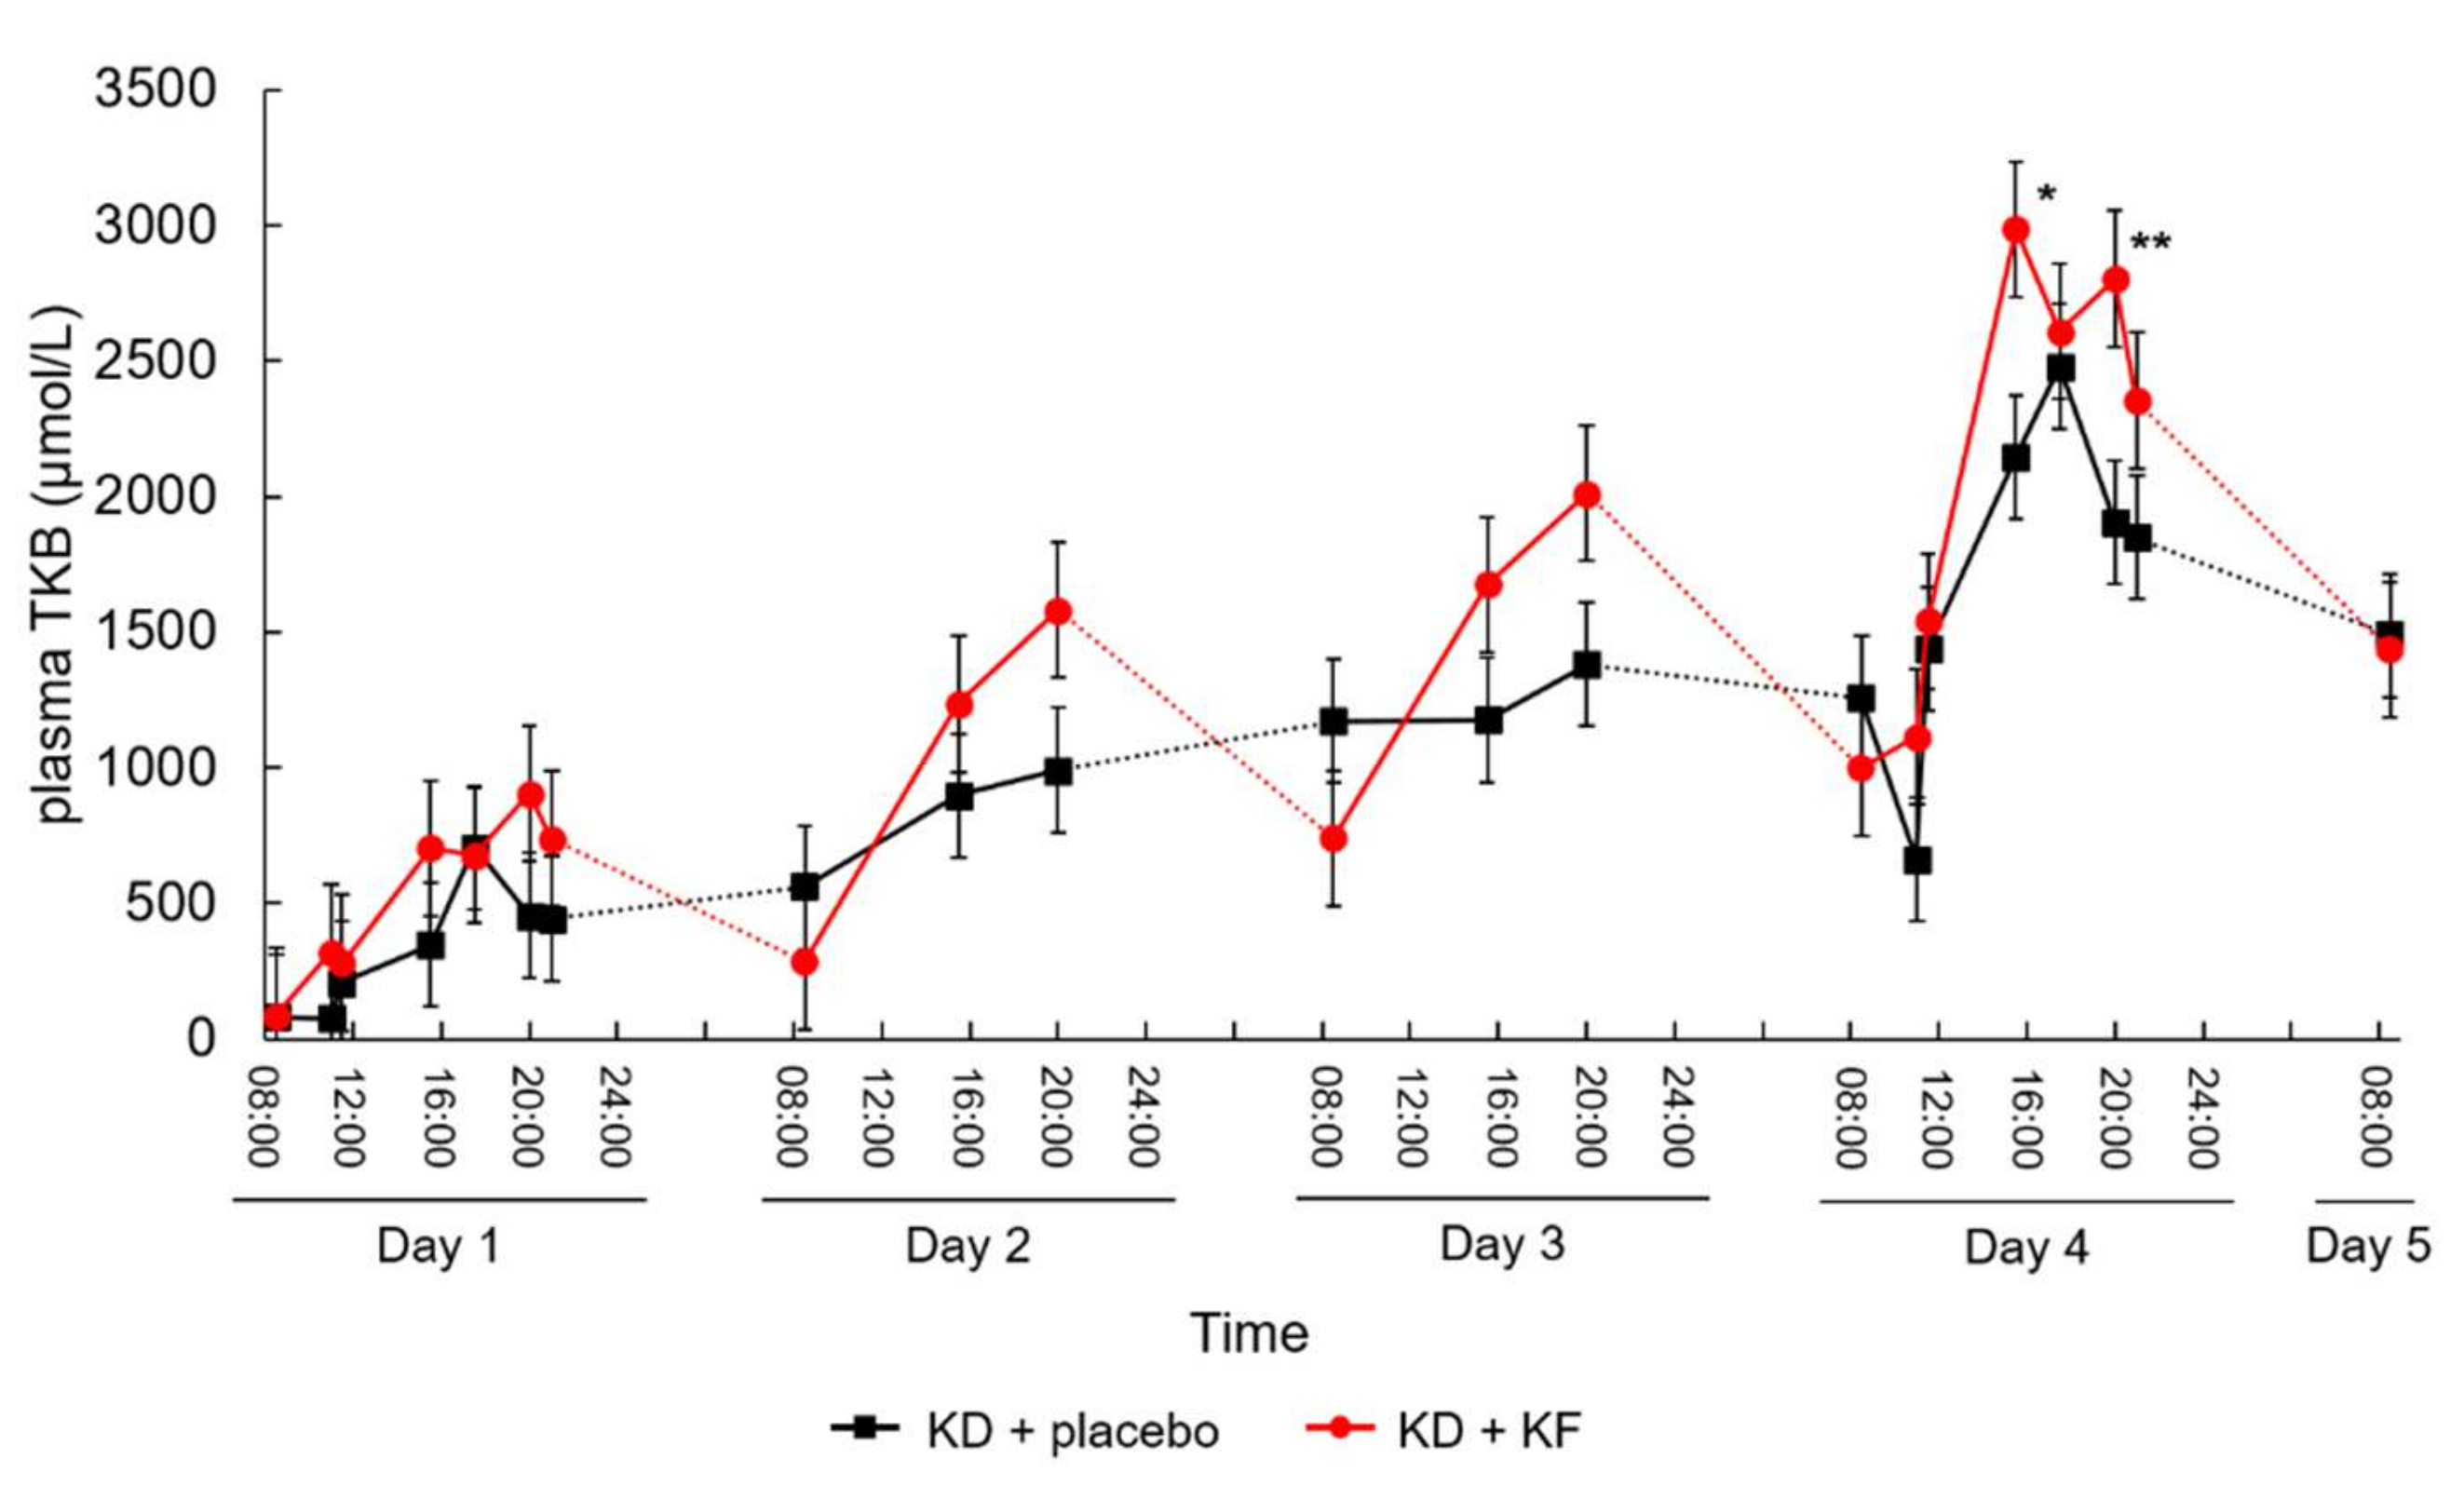
3.2. Primary Outcome
3.3. Secondary Outcome
3.4. Safety Analysis
3.5. Physical Measurement and Vital Signs
3.6. Muscle Strength
3.7. Blood Parameters
3.8. Urinalysis
3.9. Metabolic Parameters
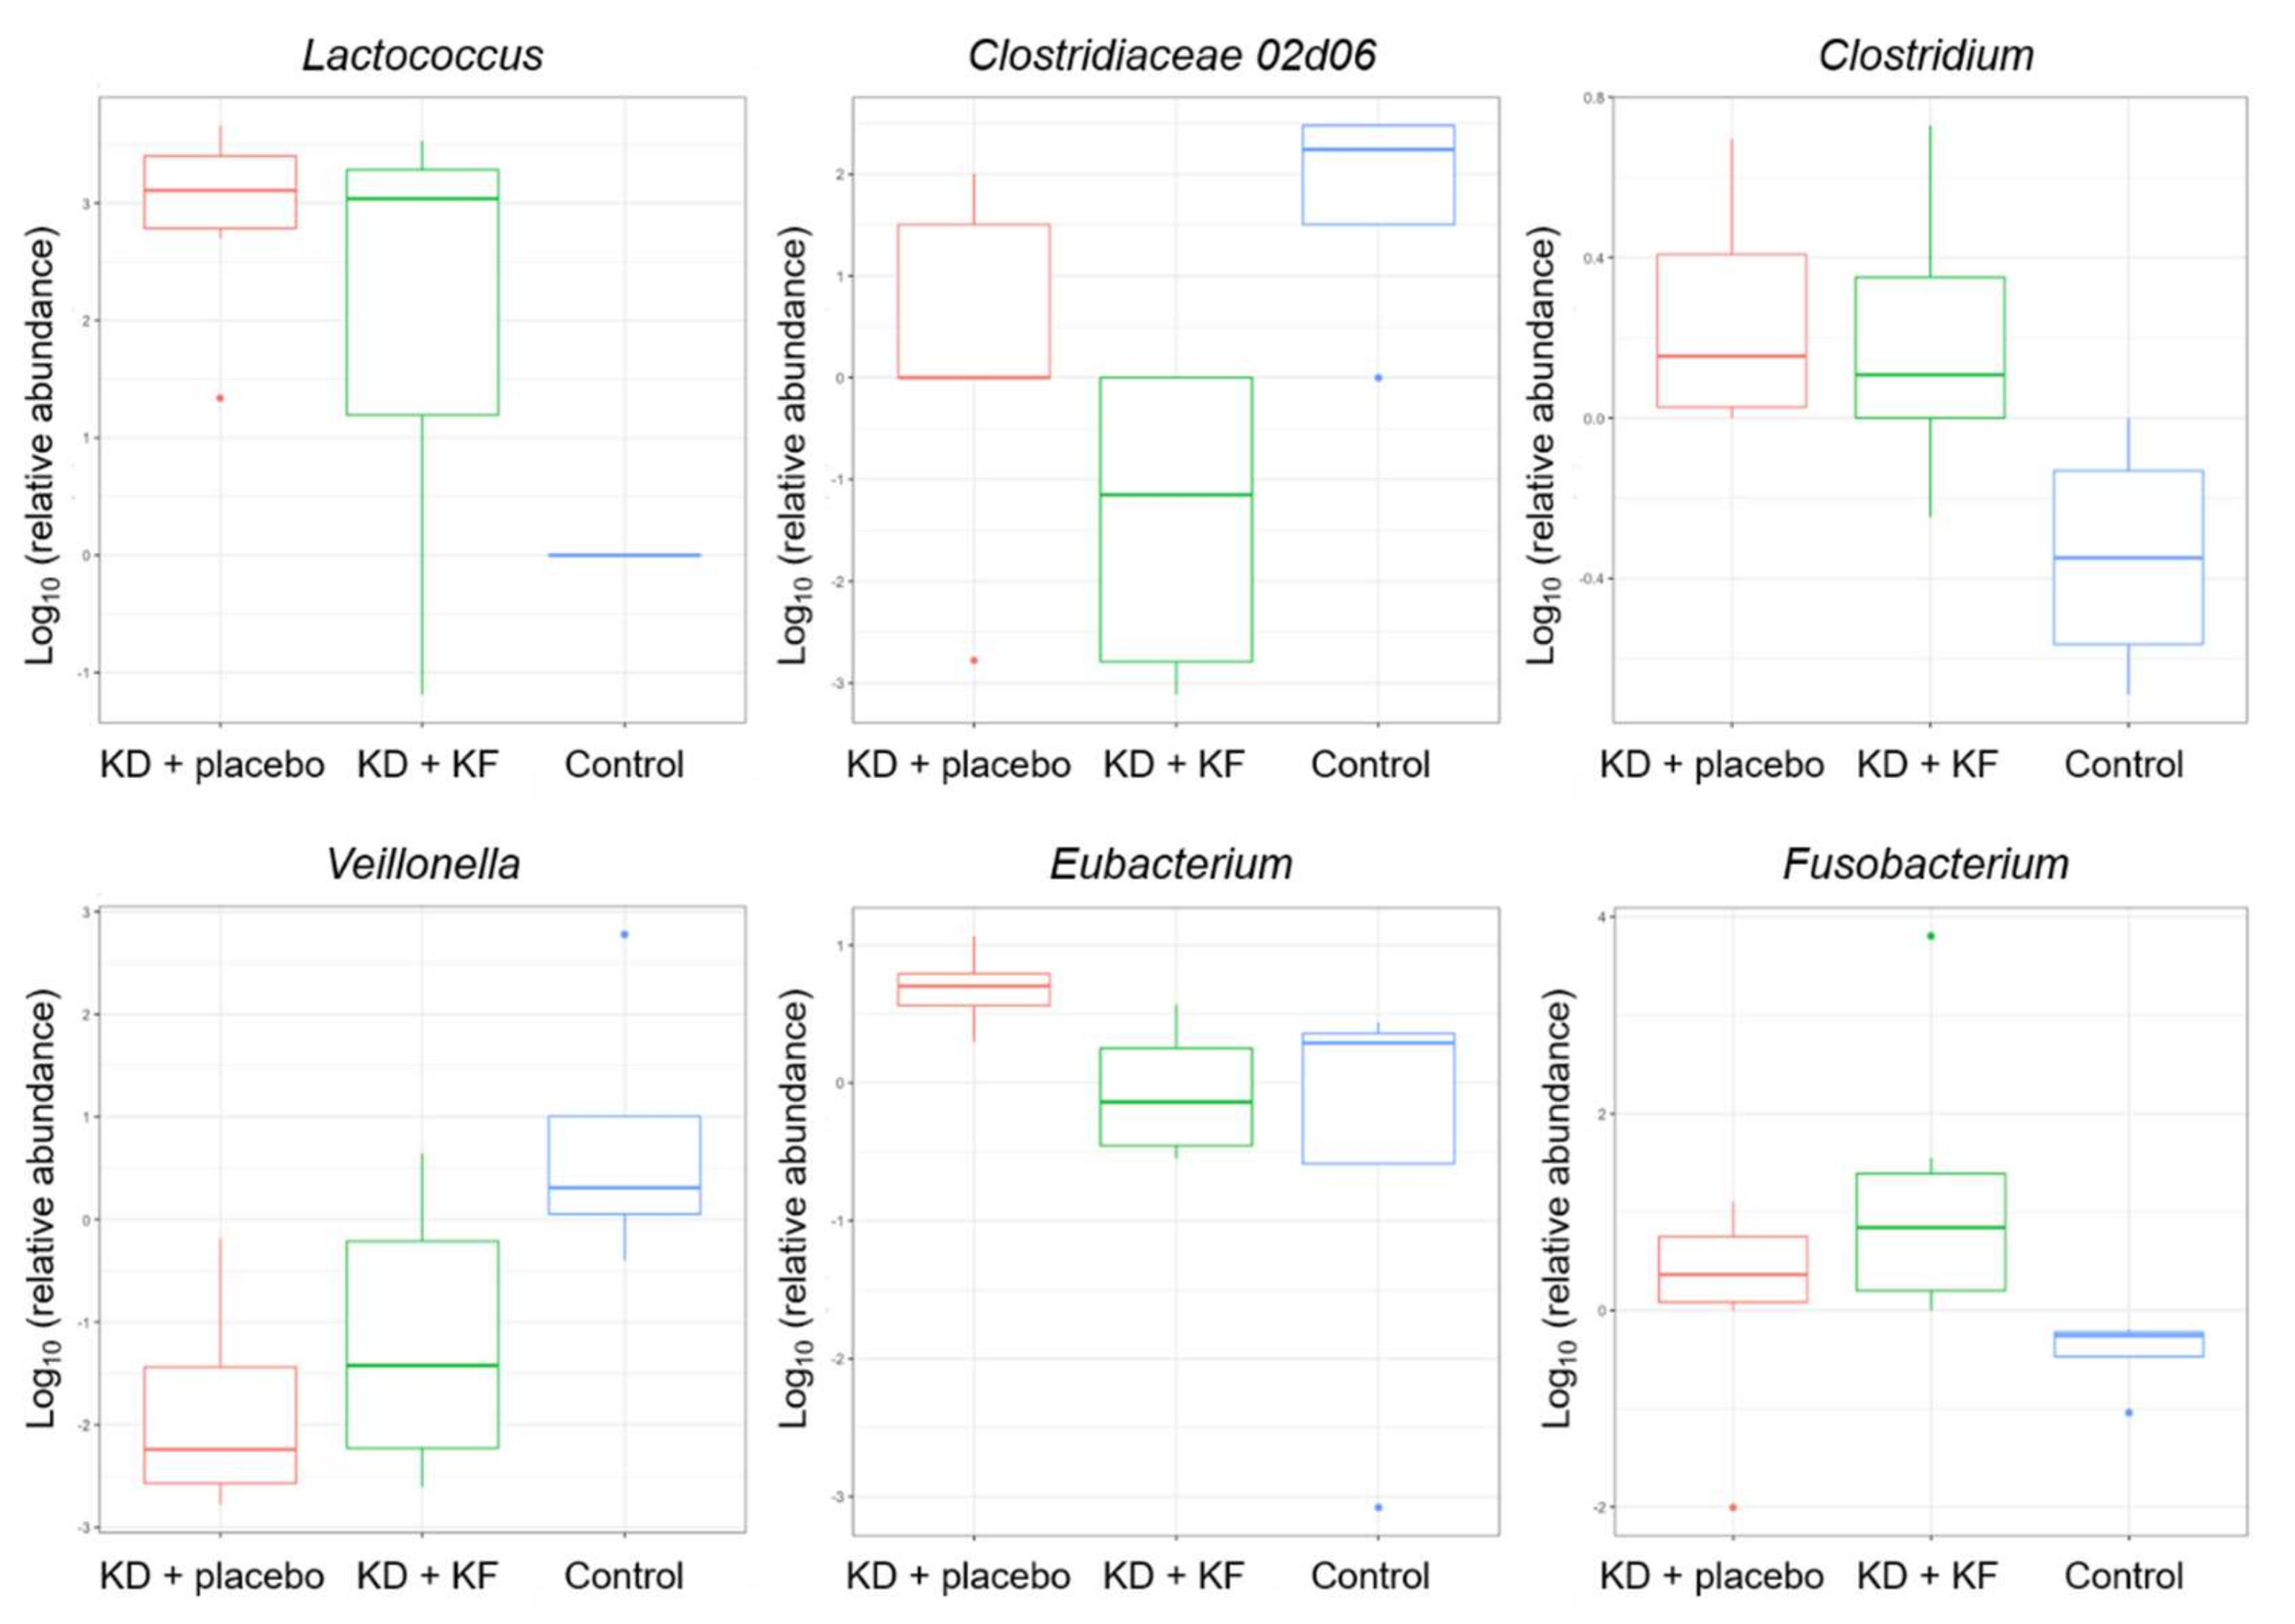
3.10. Gut Microbiota
4. Discussion
Supplementary Materials
Author Contributions
Funding
Institutional Review Board Statement
Informed Consent Statement
Data Availability Statement
Acknowledgments
Conflicts of Interest
References
- Sung, H.; Ferlay, J.; Siegel, R.L.; Laversanne, M.; Soerjomataram, I.; Jemal, A.; Bray, F. Global Cancer Statistics 2020: GLOBOCAN Estimates of Incidence and Mortality Worldwide for 36 Cancers in 185 Countries. CA. Cancer J. Clin. 2021, 71, 209–249. [Google Scholar] [CrossRef] [PubMed]
- Beresford, S.A.; Johnson, K.C.; Ritenbaugh, C.; Lasser, N.L.; Snetselaar, L.G.; Black, H.R.; Anderson, G.L.; Assaf, A.R.; Bassford, T.; Bowen, D.; et al. Low-fat dietary pattern and risk of colorectal cancer: The Women’s Health Initiative Randomized Controlled Dietary Modification Trial. JAMA 2006, 295, 643–654. [Google Scholar] [CrossRef] [PubMed]
- Munch-Andersen, T.; Sorensen, K.; Andersen, L.B.; Aachmann-Andersen, N.J.; Aksglaede, L.; Juul, A.; Helge, J.W. Adverse metabolic risk profiles in Greenlandic Inuit children compared to Danish children. Obesity 2013, 21, 1226–1231. [Google Scholar] [CrossRef] [PubMed] [Green Version]
- Bray, F.; Ferlay, J.; Soerjomataram, I.; Siegel, R.L.; Torre, L.A.; Jemal, A. Global cancer statistics 2018: GLOBOCAN estimates of incidence and mortality worldwide for 36 cancers in 185 countries. CA. Cancer. J. Clin. 2018, 68, 394–424. [Google Scholar] [CrossRef] [Green Version]
- Otani, T.; Iwasaki, M.; Sasazuki, S.; Inoue, M.; Tsugane, S.; Japan Public Health Center-based Prospective Study Group. Plasma C-peptide, insulin-like growth factor-I, insulin-like growth factor binding proteins and risk of colorectal cancer in a nested case-control study: The Japan public health center-based prospective study. Int. J. Cancer 2007, 120, 2007–2012. [Google Scholar] [CrossRef]
- Wheless, J.W. History of the ketogenic diet. Epilepsia 2008, 49, 3–5. [Google Scholar] [CrossRef]
- Kass, H.R.; Winesett, S.P.; Bessone, S.K.; Turner, Z.; Kossoff, E.H. Use of dietary therapies amongst patients with GLUT1 deficiency syndrome. Seizure 2016, 35, 83–87. [Google Scholar] [CrossRef] [Green Version]
- Ho, V.W.; Leung, K.; Hsu, A.; Luk, B.; Lai, J.; Shen, S.Y.; Minchinton, A.I.; Waterhouse, D.; Bally, M.B.; Lin, W.; et al. A low carbohydrate, high protein diet slows tumor growth and prevents cancer initiation. Cancer Res. 2011, 71, 4484–4493. [Google Scholar] [CrossRef] [Green Version]
- Zuccoli, G.; Marcello, N.; Pisanello, A.; Servadei, F.; Vaccaro, S.; Mukherjee, P.; Seyfried, T.N. Metabolic management of glioblastoma multiforme using standard therapy together with a restricted ketogenic diet: Case Report. Nutr. Metab. 2010, 7, 33. [Google Scholar] [CrossRef] [Green Version]
- Schmidt, M.; Pfetzer, N.; Schwab, M.; Strauss, I.; Kammerer, U. Effects of a ketogenic diet on the quality of life in 16 patients with advanced cancer: A pilot trial. Nutr. Metab. 2011, 8, 54. [Google Scholar] [CrossRef] [Green Version]
- Hagihara, K.; Kajimoto, K.; Osaga, S.; Nagai, N.; Shimosegawa, E.; Nakata, H.; Saito, H.; Saito, H.; Nakano, M.; Takeuchi, M.; et al. Promising Effect of a New Ketogenic Diet Regimen in Patients with Advanced Cancer. Nutrients 2020, 12, 1473. [Google Scholar] [CrossRef]
- Watanabe, S.; Kameoka, S.; Shinozaki, N.O.; Kubo, R.; Nishida, A.; Kuriyama, M.; Takeda, A.K. A cross-sectional analysis from the Mykinso Cohort Study: Establishing reference ranges for Japanese gut microbial indices. Biosci. Microbiota Food Health 2021, 40, 123–134. [Google Scholar] [CrossRef]
- Kameoka, S.; Motooka, D.; Watanabe, S.; Kubo, R.; Jung, N.; Midorikawa, Y.; Shinozaki, N.O.; Sawai, Y.; Takeda, A.K.; Nakamura, S. Benchmark of 16S rRNA gene amplicon sequencing using Japanese gut microbiome data from the V1–V2 and V3–V4 primer sets. BMC Genom. 2021, 22, 527. [Google Scholar] [CrossRef]
- Ota, M.; Matsuo, J.; Ishida, I.; Hattori, K.; Teraishi, T.; Tonouchi, H.; Ashida, K.; Takahashi, T.; Kunugi, H. Effect of a ketogenic meal on cognitive function in elderly adults: Potential for cognitive enhancement. Psychopharmacology 2016, 233, 3797–3802. [Google Scholar] [CrossRef]
- Ley, R.E.; Turnbaugh, P.J.; Klein, S.; Gordon, J.I. Microbial ecology: Human gut microbes associated with obesity. Nature 2006, 444, 1022–1023. [Google Scholar] [CrossRef]
- Sweeney, T.E.; Morton, J.M. The human gut microbiome: A review of the effect of obesity and surgically induced weight loss. JAMA Surg. 2013, 148, 563–569. [Google Scholar] [CrossRef] [Green Version]
- McDonald, T.J.W.; Cervenka, M.C. Lessons learned from recent clinical trials of ketogenic diet therapies in adults. Curr. Opin. Clin. Nutr. Metab. Care 2019, 22, 418–424. [Google Scholar] [CrossRef]
- Watanabe, M.; Tuccinardi, D.; Ernesti, I.; Basciani, S.; Mariani, S.; Genco, A.; Manfrini, S.; Lubrano, C.; Gnessi, L. Scientific evidence underlying contraindications to the ketogenic diet: An update. Obes. Rev. 2020, 21, e13053. [Google Scholar] [CrossRef]
- O’Neill, B.; Raggi, P. The ketogenic diet: Pros and cons. Atherosclerosis 2020, 292, 119–126. [Google Scholar] [CrossRef] [Green Version]
- Castellana, M.; Conte, E.; Cignarelli, A.; Perrini, S.; Giustina, A.; Giovanella, L.; Giorgino, F.; Trimboli, P. Efficacy and safety of very low calorie ketogenic diet (VLCKD) in patients with overweight and obesity: A systematic review and meta-analysis. Rev. Endocr. Metab. Disord. 2020, 21, 5–16. [Google Scholar] [CrossRef]
- Kirkpatrick, C.F.; Bolick, J.P.; Kris-Etherton, P.M.; Sikand, G.; Aspry, K.E.; Soffer, D.E.; Willard, K.E.; Maki, K.C. Review of current evidence and clinical recommendations on the effects of low-carbohydrate and very-low-carbohydrate (including ketogenic) diets for the management of body weight and other cardiometabolic risk factors: A scientific statement from the National Lipid Association Nutrition and Lifestyle Task Force. J. Clin. Lipidol. 2019, 13, 689–711. [Google Scholar]
- Weber, D.D.; Aminzadeh-Gohari, S.; Tulipan, J.; Catalano, L.; Feichtinger, R.G.; Kofler, B. Ketogenic diet in the treatment of cancer—Where do we stand? Mol. Metab. 2020, 33, 102–121. [Google Scholar] [CrossRef]
- Yang, Y.F.; Mattamel, P.B.; Joseph, T.; Huang, J.; Chen, Q.; Akinwunmi, B.O.; Zhang, C.J.P.; Ming, W.K. Efficacy of Low-Carbohydrate Ketogenic Diet as an Adjuvant Cancer Therapy: A Systematic Review and Meta-Analysis of Randomized Controlled Trials. Nutrients 2021, 13, 1388. [Google Scholar] [CrossRef]
- Kammerer, U.; Klement, R.J.; Joos, F.T.; Sutterlin, M.; Reuss-Borst, M. Low Carb and Ketogenic Diets Increase Quality of Life, Physical Performance, Body Composition, and Metabolic Health of Women with Breast Cancer. Nutrients 2021, 13, 1029. [Google Scholar] [CrossRef]
- Klein, P.; Tyrlikova, I.; Zuccoli, G.; Tyrlik, A.; Maroon, J.C. Treatment of glioblastoma multiforme with “classic” 4:1 ketogenic diet total meal replacement. Cancer Metab. 2020, 8, 24. [Google Scholar] [CrossRef]
- Cavaleri, F.; Bashar, E. Potential Synergies of beta-Hydroxybutyrate and Butyrate on the Modulation of Metabolism, Inflammation, Cognition, and General Health. J. Nutr. Metab. 2018, 2018, 7195760. [Google Scholar] [CrossRef] [Green Version]
- Urbain, P.; Bertz, H. Monitoring for compliance with a ketogenic diet: What is the best time of day to test for urinary ketosis? Nutr. Metab. 2016, 13, 77. [Google Scholar] [CrossRef] [Green Version]
- Tognini, P.; Murakami, M.; Liu, Y.; Eckel-Mahan, K.L.; Newman, J.C.; Verdin, E.; Baldi, P.; Sassone-Corsi, P. Distinct Circadian Signatures in Liver and Gut Clocks Revealed by Ketogenic Diet. Cell Metab. 2017, 26, 523–538. [Google Scholar] [CrossRef]
- Rubini, A.; Bosco, G.; Lodi, A.; Cenci, L.; Parmagnani, A.; Grimaldi, K.; Zhongjin, Y.; Paoli, A. Effects of Twenty Days of the Ketogenic Diet on Metabolic and Respiratory Parameters in Healthy Subjects. Lung 2015, 193, 939–945. [Google Scholar] [CrossRef] [Green Version]
- Sjodin, A.; Hellstrom, F.; Sehlstedt, E.; Svensson, M.; Buren, J. Effects of a Ketogenic Diet on Muscle Fatigue in Healthy, Young, Normal-Weight Women: A Randomized Controlled Feeding Trial. Nutrients 2020, 12, 955. [Google Scholar] [CrossRef] [Green Version]
- Ang, Q.Y.; Alexander, M.; Newman, J.C.; Tian, Y.; Cai, J.; Upadhyay, V.; Turnbaugh, J.A.; Verdin, E.; Hall, K.D.; Leibel, R.L.; et al. Ketogenic Diets Alter the Gut Microbiome Resulting in Decreased Intestinal Th17 Cells. Cell 2020, 81, 1263–1275. [Google Scholar] [CrossRef] [PubMed]
- Gong, X.; Cai, Q.; Liu, X.; An, D.; Zhou, D.; Luo, R.; Peng, R.; Hong, Z. Gut flora and metabolism are altered in epilepsy and partially restored after ketogenic diets. Microb. Pathog. 2021, 155, 104899. [Google Scholar] [CrossRef] [PubMed]
- Paoli, A.; Mancin, L.; Bianco, A.; Thomas, E.; Mota, J.F.; Piccini, F. Ketogenic Diet and Microbiota: Friends or Enemies? Genes 2019, 10, 534. [Google Scholar] [CrossRef] [PubMed] [Green Version]
- Lee, S.H.; You, H.S.; Kang, H.G.; Kang, S.S.; Hyun, S.H. Association between Altered Blood Parameters and Gut Microbiota after Synbiotic Intake in Healthy, Elderly Korean Women. Nutrients 2020, 12, 3112. [Google Scholar] [CrossRef] [PubMed]

| Group | Test Meal |
|---|---|
| KD + placebo (P group; N = 6) | Ketogenic diet + placebo formula 50 g (200 mL) Taken 3 times a day |
| KD + KF (K group; N = 6) | Ketogenic diet + KF 50 g (200 mL) Taken 3 times a day |
| Control (C group; N = 4) | Normal diet + cow’s milk (200 mL) Taken 3 times a day |
| AUC of Plasma Ketone Body (μmol/L∙h) | Day 1 | Day 4 | Comparison between Day 1 and Day 4 (p Value) |
|---|---|---|---|
| KD + placebo | 4130 ± 2393 | 20,968 ± 7708 | <0.001 |
| KD + KF | 6511 ± 1893 | 25,891 ± 8493 | 0.004 |
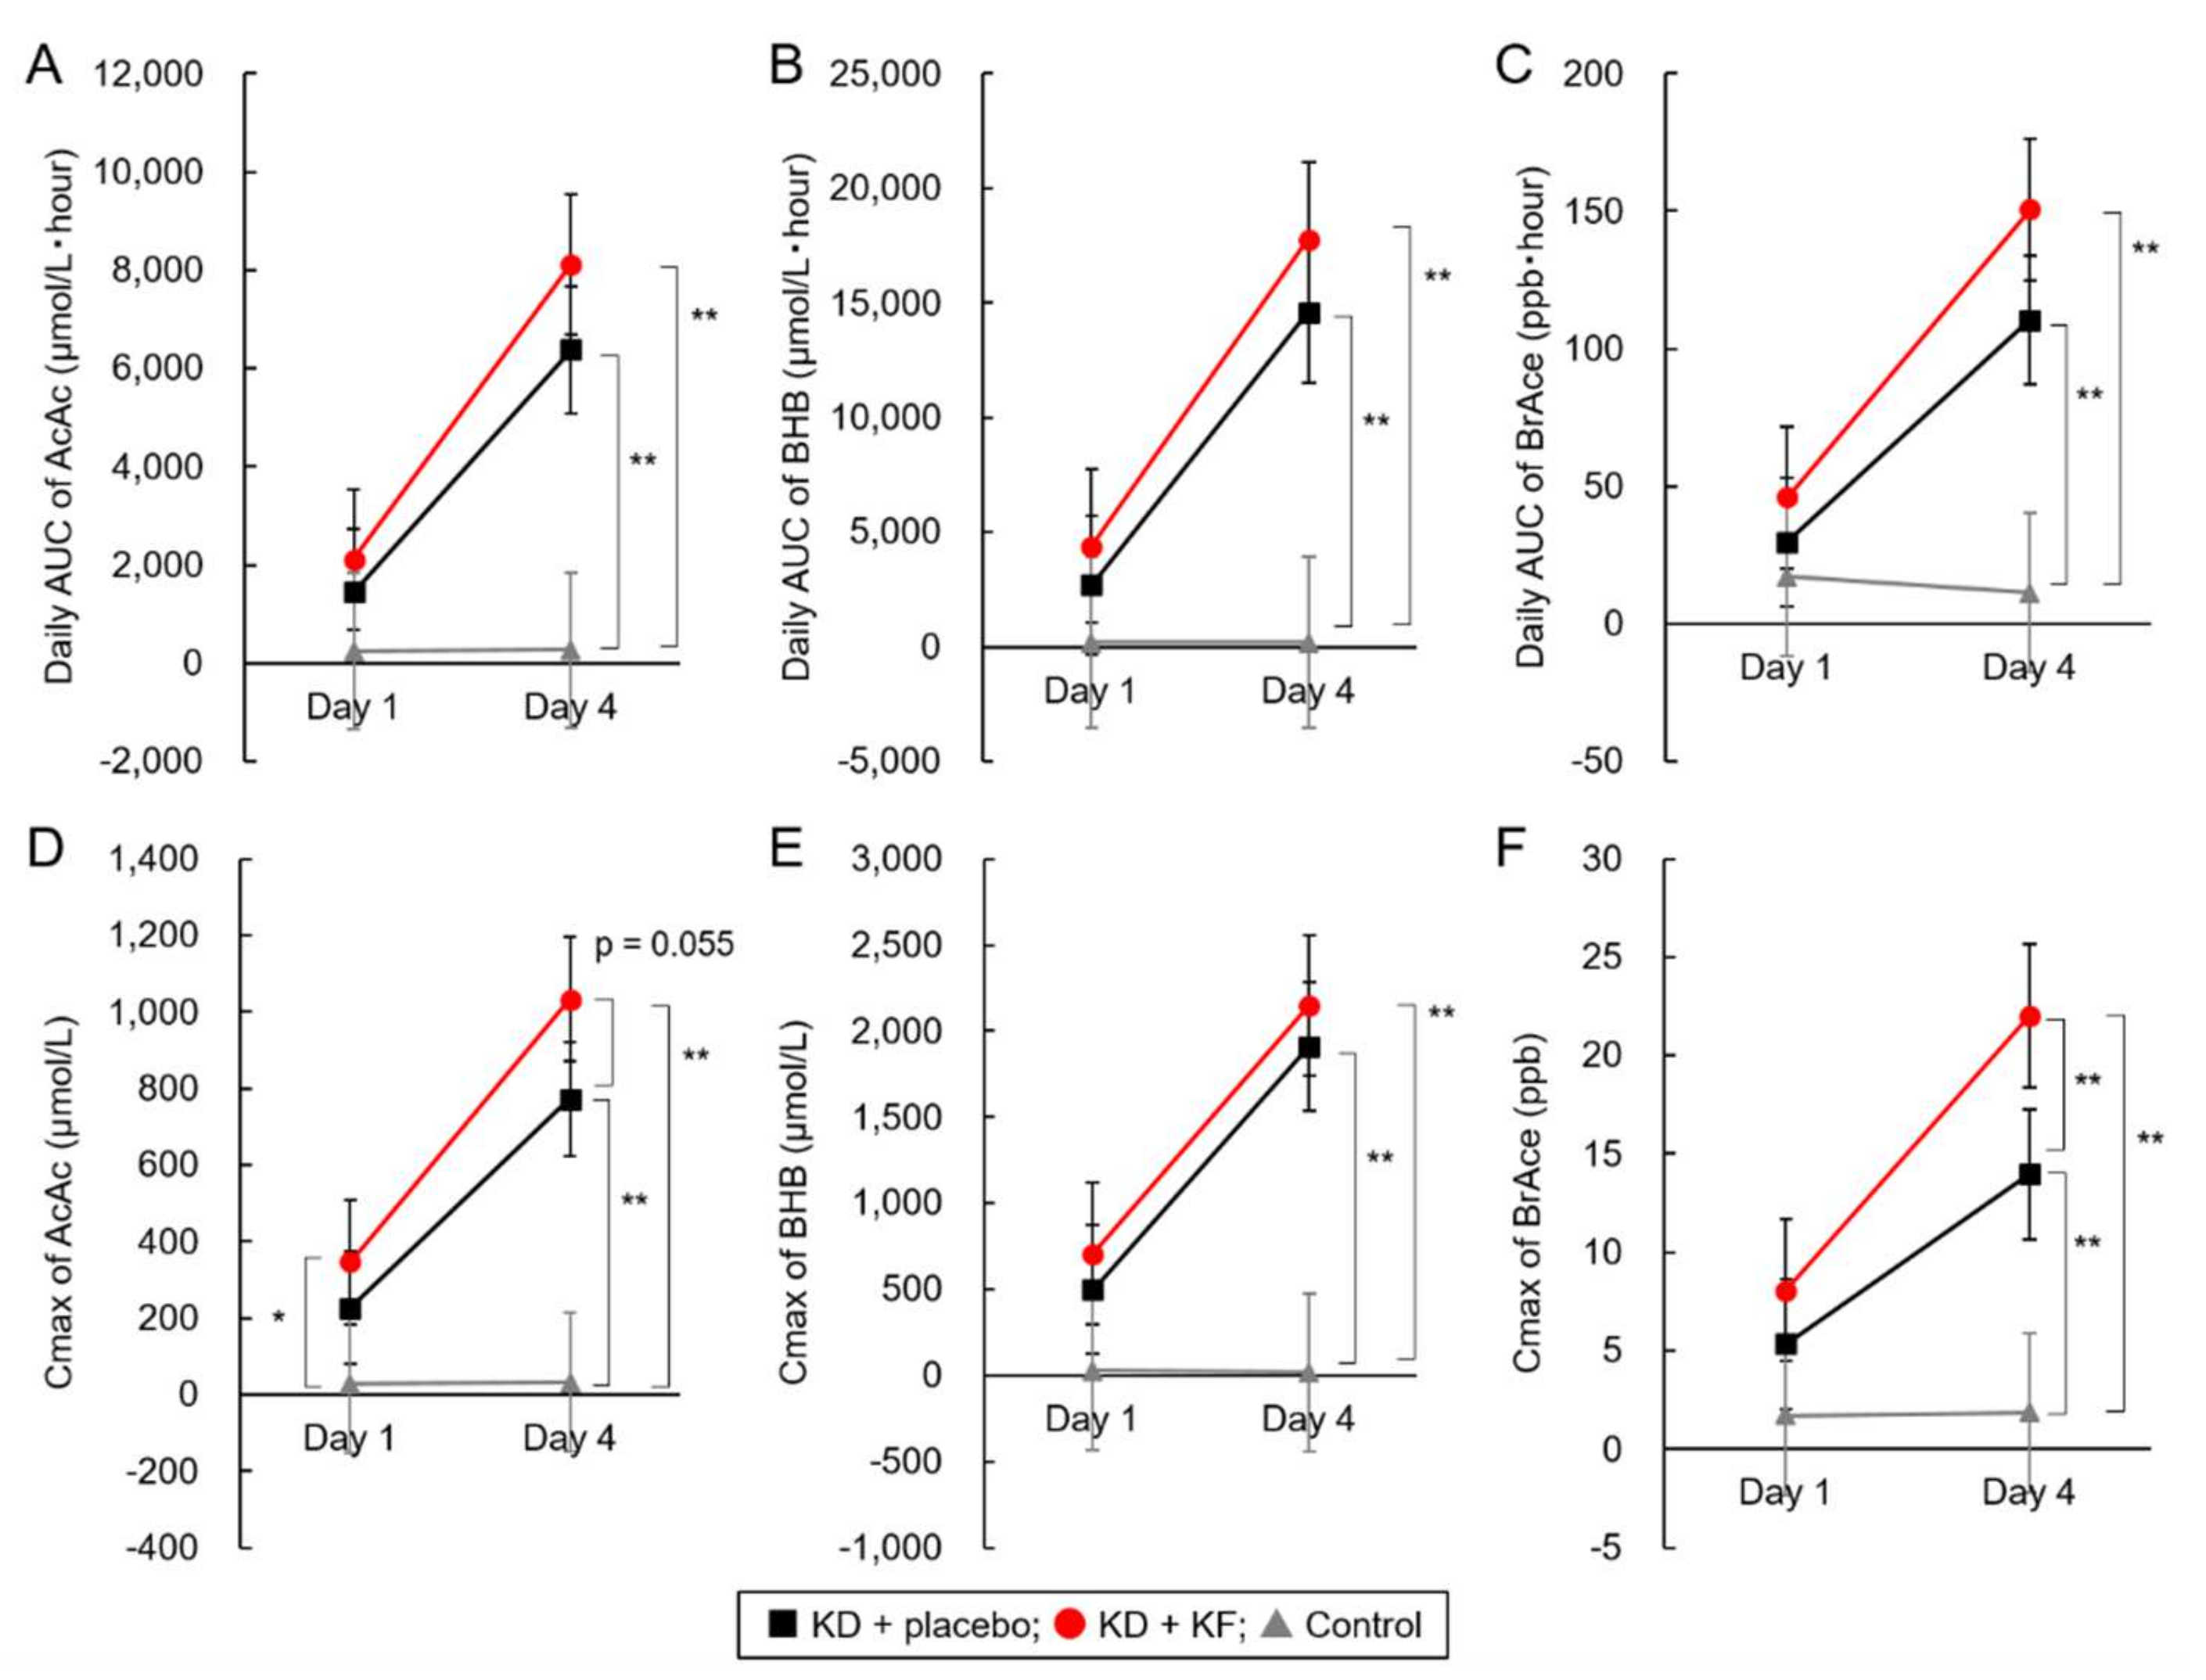
| Metabolites | Group | Day 1 | Day 4 | Comparison between Day 1 and Day 4 (p Value) | |
|---|---|---|---|---|---|
| AUC | AcAc | KD + placebo | 1442 ± 727 | 6381 ± 2100 a | <0001 |
| KD + KF | 2109 ± 546 | 8116 ± 2774 a | 0.005 | ||
| Control | 244 ± 54 | 267 ± 40 b | 0.238 | ||
| BHB | KD + placebo | 2688 ± 1687 | 14,587 ± 5673 a | <0.001 | |
| KD + KF | 4402 ± 1357 | 17,775 ± 5737 a | 0.004 | ||
| Control | 200 ± 49 | 185 ± 31 b | 0.361 | ||
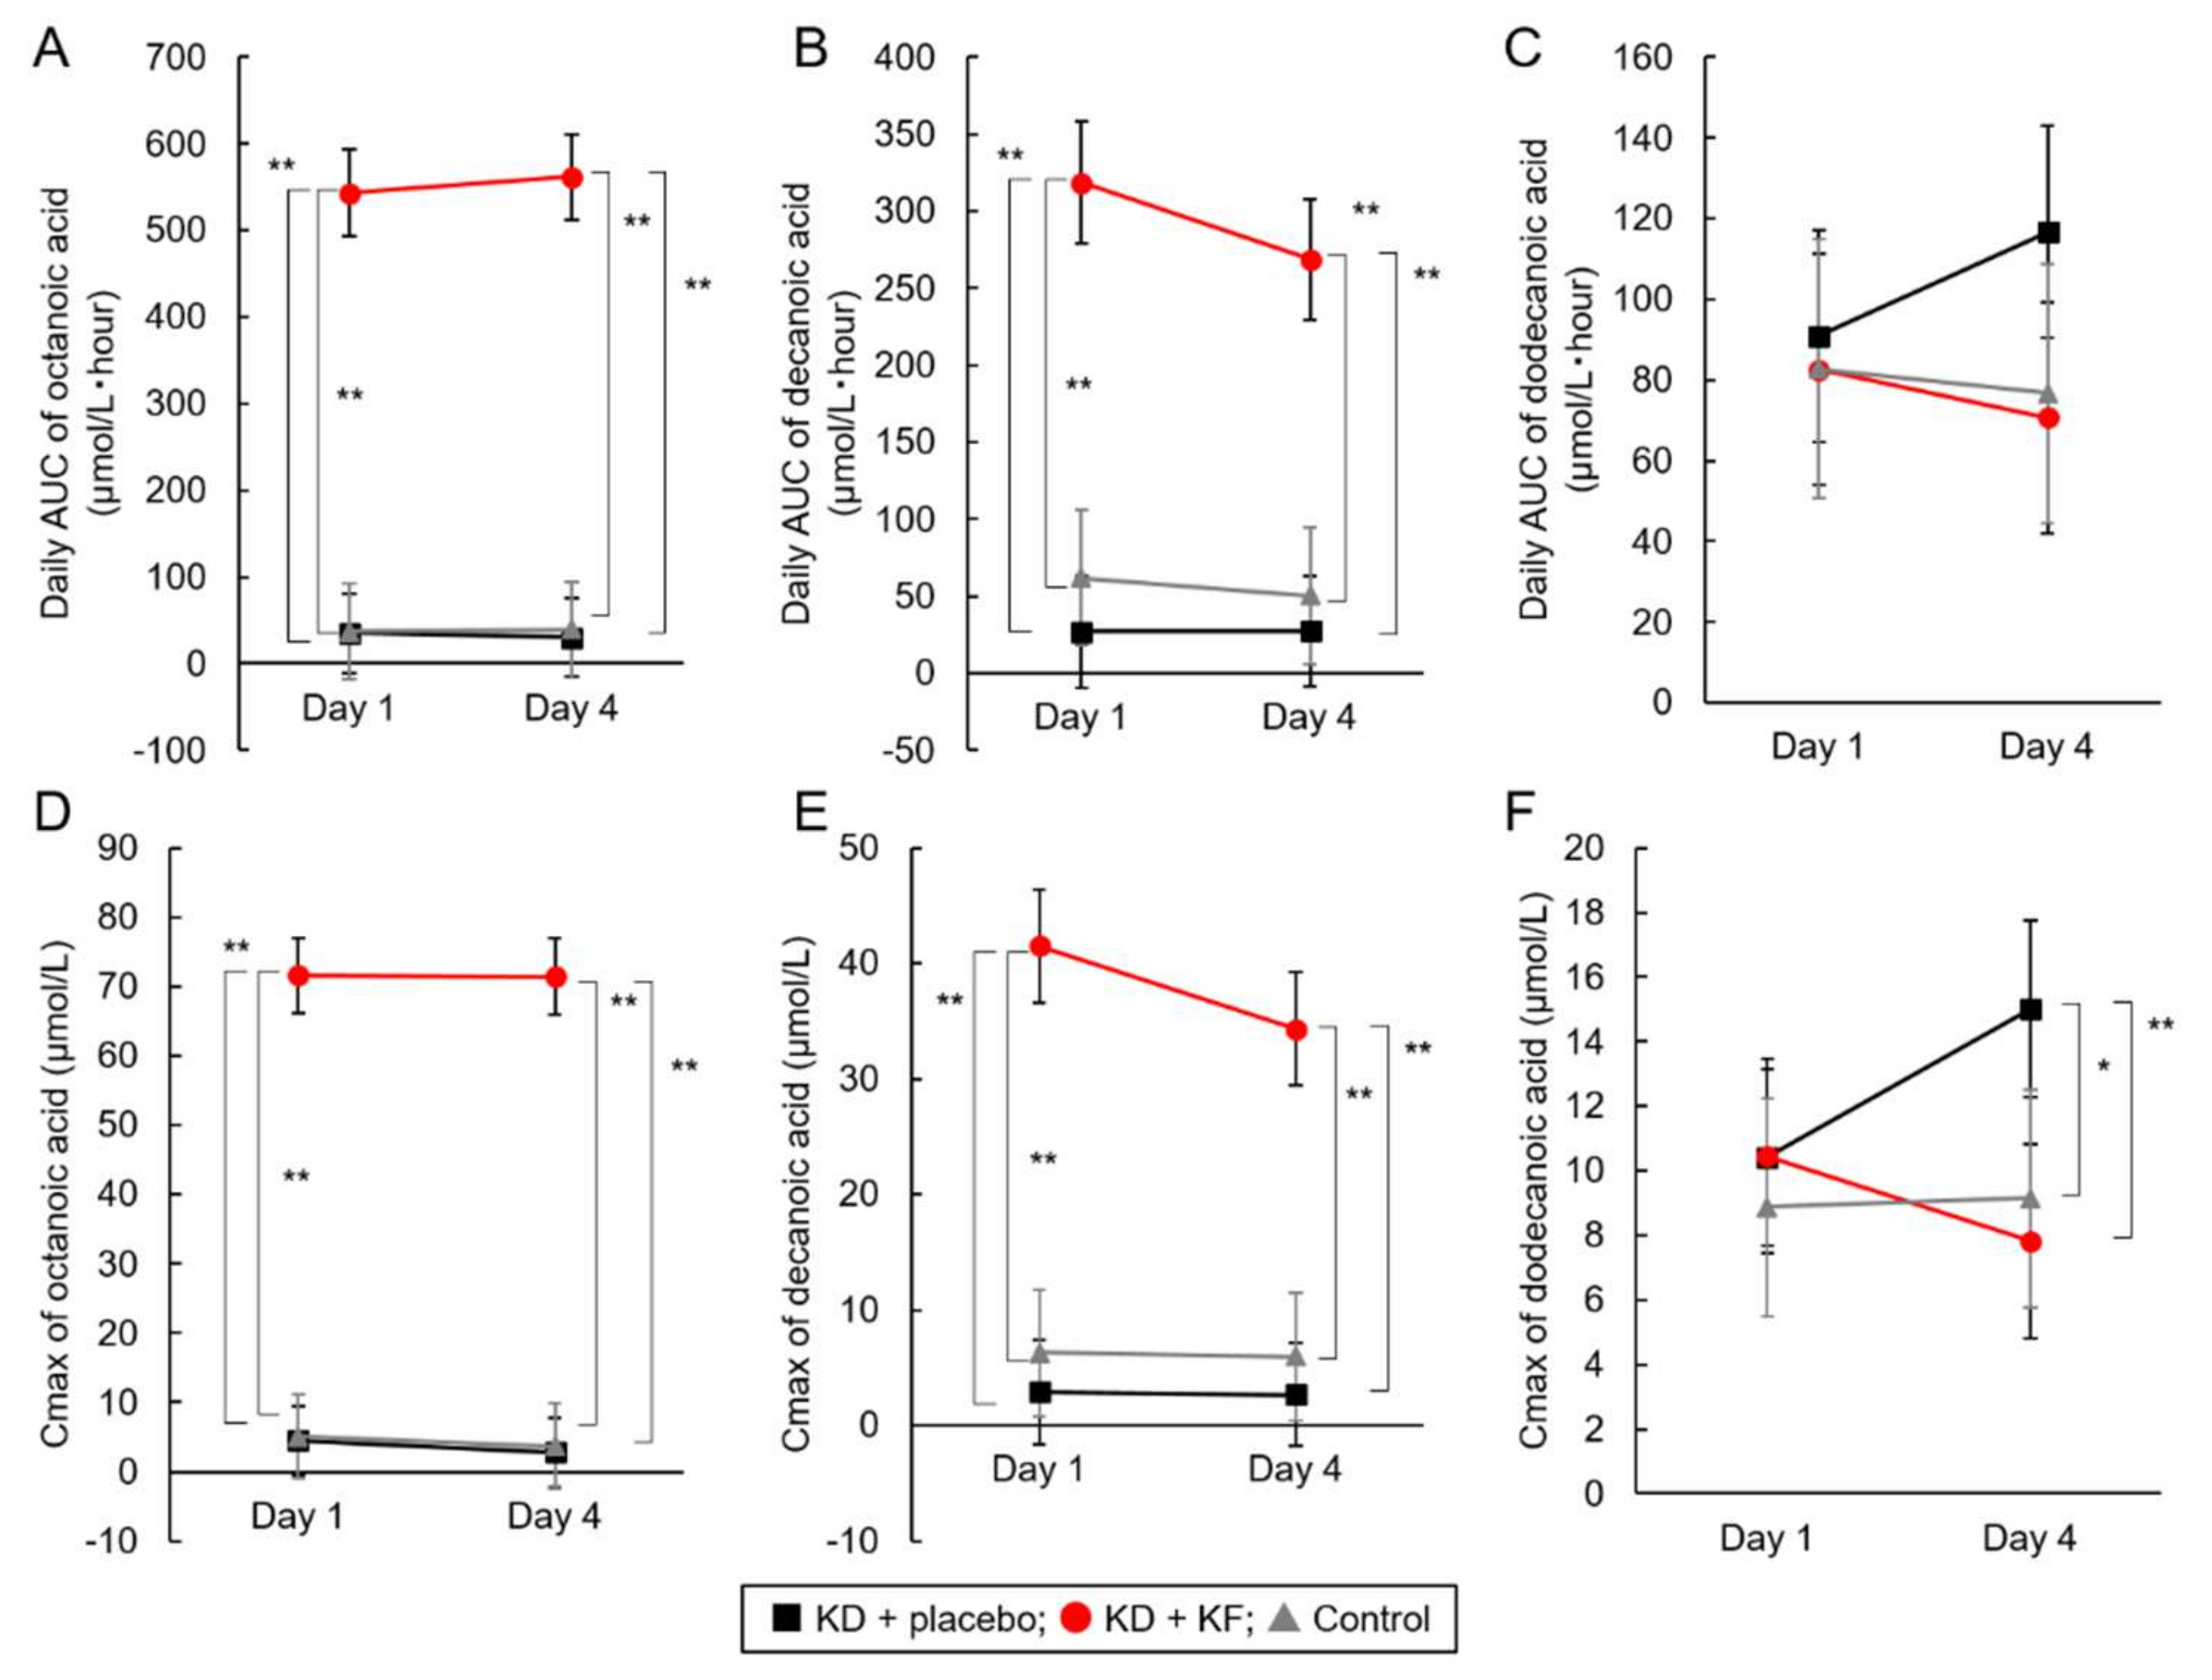
| Octanoic Acid | KD + placebo | 34.8 ± 11.1 a | 30.1 ± 38.7 a | 0.698 | |
| KD + KF | 543.5 ± 104.8 b | 561.9 ± 52.4 b | 0.643 | ||
| Control | 36.9 ± 2.7 a | 39.6 ± 43.4 a | 0.903 | ||
| Decanoic Acid | KD + placebo | 26.9 ± 25.6 a | 27.5 ± 36.1 a | 0.974 | |
| KD + KF | 318.5 ± 37.8 b | 268.6 ± 73.5 b | 0.099 | ||
| Control | 62.0 ± 30.7 a | 50.3 ± 36.4 a | 0.556 | ||
| Dodecanoic Acid | KD + placebo | 90.9 ± 29.5 | 116.7 ± 38.5 | 0.182 | |
| KD + KF | 82.6 ± 21.1 | 70.7 ± 37.3 | 0.449 | ||
| Control | 82.8 ± 27.9 | 76.8 ± 24.4 | 0.707 | ||
| BrAce | KD + placebo | 29.8 ± 17.2 | 110.4 ± 32.0 a | <0.001 | |
| KD + KF | 46.1 ± 6.4 | 150.6 ± 52.0 a | 0.012 | ||
| Control | 17.2 ± 18.7 | 11.3 ± 4.3 b | 0.596 | ||
| Cmax | AcAc | KD + placebo | 226 ± 113 a | 772 ± 213 a | <0.001 |
| KD + KF | 347 ± 116 b | 1032 ± 314 b | 0.002 | ||
| Control | 27 ± 7 a | 31 ± 5 a | 0.231 | ||
| BHB | KD + placebo | 497 ± 335 | 1911 ± 687 a | 0.002 | |
| KD + KF | 707 ± 190 | 2149 ± 648 a | 0.003 | ||
| Control | 28 ± 9 | 20 ± 2 b | 0.103 | ||
| Octanoic Acid | KD + placebo | 4.5 ± 1.9 a | 2.8 ± 3.0 a | 0.309 | |
| KD + KF | 71.6 ± 12.0 b | 71.5 ± 6.2 b | 0.973 | ||
| Control | 5.1 ± 2.5 a | 3.7 ± 3.4 a | 0.529 | ||
| Decanoic Acid | KD + placebo | 2.9 ± 2.6 a | 2.7 ± 2.9 a | 0.880 | |
| KD + KF | 41.5 ± 8.4 b | 34.3 ± 8.3 b | 0.156 | ||
| Control | 6.3 ± 2.6 a | 6.0 ± 3.0 a | 0.845 | ||
| Dodecanoic Acid | KD + placebo | 10.4 ± 3.3 | 15.0 ± 4.8 a | 0.077 | |
| KD + KF | 10.4 ± 2.3 | 7.8 ± 2.9 b | 0.168 | ||
| Control | 8.9 ± 2.6 | 9.2 ± 2.1 b | 0.882 | ||
| BrAce | KD + placebo | 5.4 ± 3.1 | 14.0 ± 4.8 a | 0.002 | |
| KD + KF | 8.1 ± 2.0 | 22.0 ± 6.8 b | 0.011 | ||
| Control | 1.7 ± 1.4 | 1.9 ± 0.8 c | 0.858 | ||
| KD + Placebo (N = 6) | KD + KF (N = 6) | Control (N = 4) | |
|---|---|---|---|
| Metabolic and nutritional disorders | |||
| Hyperuricemia | 3 (50.0%) | 3 (50.0%) | 0 (0.0%) |
| Hyperlipidemia | 0 (0.0%) | 1 (16.7%) | 0 (0.0%) |
| Gastrointestinal disorders | |||
| Upper abdominal pain | 0 (0.0%) | 1 (16.7%) | 0 (0.0%) |
| KD + Placebo (N = 6) | KD + KF (N = 6) | Control (N = 4) | Comparison between Groups (p Value) | |
|---|---|---|---|---|
| White blood cells, ×103/μL | ||||
| Baseline | 6.380 ± 1.942 | 5.953 ± 1.174 | 4.855 ± 0.755 | 0.293 |
| Day 5 | 5.295 ± 1.309 | 5.643 ± 1.024 | 5.212 ± 0.709 | 0.791 |
| Red blood cells, ×106/μL | ||||
| Baseline | 5.293 ± 0.291 | 5.177 ± 0.241 | 5.420 ± 0.415 | 0.489 |
| Day 5 | 5.423 ± 0.091 | 5.260 ± 0.219 | 5.282 ± 0.512 | 0.589 |
| Hemoglobin, g/dL | ||||
| Baseline | 15.63 ± 0.96 | 15.43 ± 0.70 | 15.72 ± 0.75 | 0.844 |
| Day 5 | 16.02 ± 0.45 | 15.80 ± 0.99 | 15.55 ± 0.72 | 0.642 |
| Hematocrit, % | ||||
| Baseline | 47.00 ± 1.87 | 46.58 ± 1.74 | 48.08 ± 2.28 | 0.498 |
| Day 5 | 47.35 ± 1.25 | 46.83 ± 2.59 | 46.48 ± 2.94 | 0.832 |
| Platelet count, ×103/μL | ||||
| Baseline | 278.7 ± 59.1 | 261.8 ± 34.4 | 252.8 ± 40.2 | 0.673 |
| Day 5 | 232.0 ± 56.8 * | 265.2 ± 41.0 | 247.5 ± 48.9 | 0.525 |
| AST, U/L | ||||
| Baseline | 17.7 ± 3.9 | 18.2 ± 1.6 | 20.2 ± 2.6 | 0.394 |
| Day 5 | 18.5 ± 4.0 | 18.2 ± 3.2 | 20.0 ± 3.8 | 0.732 |
| ALT, U/L | ||||
| Baseline | 16.5 ± 6.1 | 22.3 ± 11.9 | 19.8 ± 8.1 | 0.556 |
| Day 5 | 15.7 ± 5.6 | 21.2 ± 13.8 | 21.5 ± 14.6 | 0.651 |
| γGTP, U/L | ||||
| Baseline | 21.3 ± 6.3 | 26.7 ± 16.3 | 19.5 ± 7.2 | 0.582 |
| Day 5 | 18.3 ± 4.0 | 23.2 ± 15.5 | 18.2 ± 8.4 | 0.688 |
| ALP, U/L | ||||
| Baseline | 209.8 ± 37.3 | 241.3 ± 57.0 | 254.0 ± 57.8 | 0.376 |
| Day 5 | 190.8 ± 35.3 * | 236.3 ± 53.2 | 243.0 ± 41.2 | 0.145 |
| BUN, mg/dL | ||||
| Baseline | 12.0 ± 2.5 | 11.7 ± 2.1 | 12.2 ± 3.3 | 0.938 |
| Day 5 | 16.7 ± 2.4 * | 15.2 ± 2.6 ** | 13.2 ± 2.6 | 0.156 |
| Creatinine, mg/dL | ||||
| Baseline | 0.845 ± 0.099 | 0.770 ± 0.053 | 0.838 ± 0.048 | 0.200 |
| Day 5 | 0.883 ± 0.074 | 0.812 ± 0.075 | 0.883 ± 0.075 | 0.220 |
| Uric acid, mg/dL | ||||
| Baseline | 5.57 ± 1.00 | 6.12 ± 0.93 | 5.70 ± 0.70 | 0.571 |
| Day 5 | 8.50 ± 1.14 ** | 9.38 ± 1.30 ** | 5.83 ± 0.39 | < 0.001 |
| Total cholesterol, mg/dL | ||||
| Baseline | 167.5 ± 23.1 | 177.0 ± 20.0 | 183.5 ± 24.0 | 0.533 |
| Day 5 | 180.5 ± 10.3 | 183.0 ± 45.6 | 174.8 ± 26.7 | 0.921 |
| TG, mg/dL | ||||
| Baseline | 66.0 ± 16.9 | 99.3 ± 56.6 | 66.5 ± 15.7 | 0.265 |
| Day 5 | 50.3 ± 10.3 | 55.8 ± 14.0 | 91.2 ± 24.8 | 0.004 |
| HDL cholesterol, mg/dL | ||||
| Baseline | 52.8 ± 8.2 | 52.8 ± 12.4 | 63.5 ± 11.4 | 0.264 |
| Day 5 | 50.8 ± 11.2 | 52.8 ± 10.0 | 59.0 ± 9.4 | 0.482 |
| LDL cholesterol, mg/dL | ||||
| Baseline | 108.8 ± 25.4 | 109.2 ± 13.1 | 110.2 ± 20.5 | 0.994 |
| Day 5 | 121.5 ± 9.9 | 114.7 ± 44.5 | 103.8 ± 18.5 | 0.659 |
| Albumin, g/dL | ||||
| Baseline | 4.75 ± 0.12 | 5.03 ± 0.18 | 4.80 ± 0.08 | 0.009 |
| Day 5 | - | - | - | |
| Transthyretin, mg/dL | ||||
| Baseline | 31.40 ± 4.26 | 34.77 ± 4.65 | 35.02 ± 3.99 | 0.334 |
| Day 5 | 23.95 ± 1.94 ** | 28.17 ± 5.89 ** | 35.80 ± 5.73 | 0.007 |
| Glucose, mg/dL | ||||
| Baseline | 84.7 ± 3.5 | 88.0 ± 4.9 | 87.8 ± 1.3 | 0.287 |
| Day 5 | 74.0 ± 3.4 ** | 77.0 ± 5.0 ** | 89.5 ± 2.4 | <0.001 |
| Glucagon, pg/mL | ||||
| Baseline | 128.5 ± 16.5 | 129.3 ± 24.5 | 142.8 ± 6.1 | 0.454 |
| Day 5 | 167.8 ± 24.8 * | 153.7 ± 41.8 | 138.8 ± 13.7 | 0.369 |
| Insulin, μIU/mL | ||||
| Baseline | 4.95 ± 1.63 | 5.07 ± 2.34 | 4.50 ± 1.05 | 0.887 |
| Day 5 | 2.28 ± 1.05 ** | 2.45 ± 0.79 * | 5.38 ± 0.62 * | < 0.001 |
| CRP, mg/dL | ||||
| Baseline | 0.030 ± 0.017 | 0.023 ± 0.008 | 0.020 ± 0.000 | 0.394 |
| Day 5 | 0.045 ± 0.061 | 0.050 ± 0.060 | 0.020 ± 0.000 | 0.669 |
| Na, mEq/L | ||||
| Baseline | 4.27 ± 0.22 | 4.10 ± 0.14 | 4.25 ± 0.26 | 0.345 |
| Day 5 | 4.37 ± 0.19 | 4.30 ± 0.24 | 4.22 ± 0.35 | 0.694 |
| Cl, mEq/L | ||||
| Baseline | 102.0 ± 1.4 | 102.0 ± 1.7 | 102.5 ± 0.6 | 0.825 |
| Day 5 | 100.2 ± 2.5 | 100.8 ± 1.7 | 102.2 ± 2.2 | 0.352 |
| KD + Placebo (N = 6) | KD + KF (N = 6) | Control (N = 4) | Comparison between Groups (p Value) | |
|---|---|---|---|---|
| Average of blood glucose (mg/dL) | 86.18 ± 2.52 | 85.40 ± 4.12 | 95.55 ± 7.10 | 0.009 |
| Percentage of hour when blood glucose was less than normal range (%) | 2.70 ± 2.20 | 1.74 ± 2.58 | 3.21 ± 5.90 | 0.799 |
Publisher’s Note: MDPI stays neutral with regard to jurisdictional claims in published maps and institutional affiliations. |
© 2022 by the authors. Licensee MDPI, Basel, Switzerland. This article is an open access article distributed under the terms and conditions of the Creative Commons Attribution (CC BY) license (https://creativecommons.org/licenses/by/4.0/).
Share and Cite
Nakamura, K.; Hagihara, K.; Nagai, N.; Egashira, R.; Takeuchi, M.; Nakano, M.; Saito, H.; Moriguchi, M.; Tonari, S.; Watanabe, S.; et al. Ketogenic Effects of Multiple Doses of a Medium Chain Triglycerides Enriched Ketogenic Formula in Healthy Men under the Ketogenic Diet: A Randomized, Double-Blinded, Placebo-Controlled Study. Nutrients 2022, 14, 1199. https://doi.org/10.3390/nu14061199
Nakamura K, Hagihara K, Nagai N, Egashira R, Takeuchi M, Nakano M, Saito H, Moriguchi M, Tonari S, Watanabe S, et al. Ketogenic Effects of Multiple Doses of a Medium Chain Triglycerides Enriched Ketogenic Formula in Healthy Men under the Ketogenic Diet: A Randomized, Double-Blinded, Placebo-Controlled Study. Nutrients. 2022; 14(6):1199. https://doi.org/10.3390/nu14061199
Chicago/Turabian StyleNakamura, Kentaro, Keisuke Hagihara, Naoko Nagai, Ryuichiro Egashira, Mariko Takeuchi, Mai Nakano, Hitomi Saito, Misaki Moriguchi, Satoko Tonari, Satoshi Watanabe, and et al. 2022. "Ketogenic Effects of Multiple Doses of a Medium Chain Triglycerides Enriched Ketogenic Formula in Healthy Men under the Ketogenic Diet: A Randomized, Double-Blinded, Placebo-Controlled Study" Nutrients 14, no. 6: 1199. https://doi.org/10.3390/nu14061199
APA StyleNakamura, K., Hagihara, K., Nagai, N., Egashira, R., Takeuchi, M., Nakano, M., Saito, H., Moriguchi, M., Tonari, S., Watanabe, S., Miyake, A., & Ashida, K. (2022). Ketogenic Effects of Multiple Doses of a Medium Chain Triglycerides Enriched Ketogenic Formula in Healthy Men under the Ketogenic Diet: A Randomized, Double-Blinded, Placebo-Controlled Study. Nutrients, 14(6), 1199. https://doi.org/10.3390/nu14061199