
The Effects of Carbohydrate versus Fat Restriction on Lipid Profiles in Highly Trained, Recreational Distance Runners: A Randomized, Cross-Over Trial

 , , and
Abstract
:
1. Introduction
2. Materials and Methods
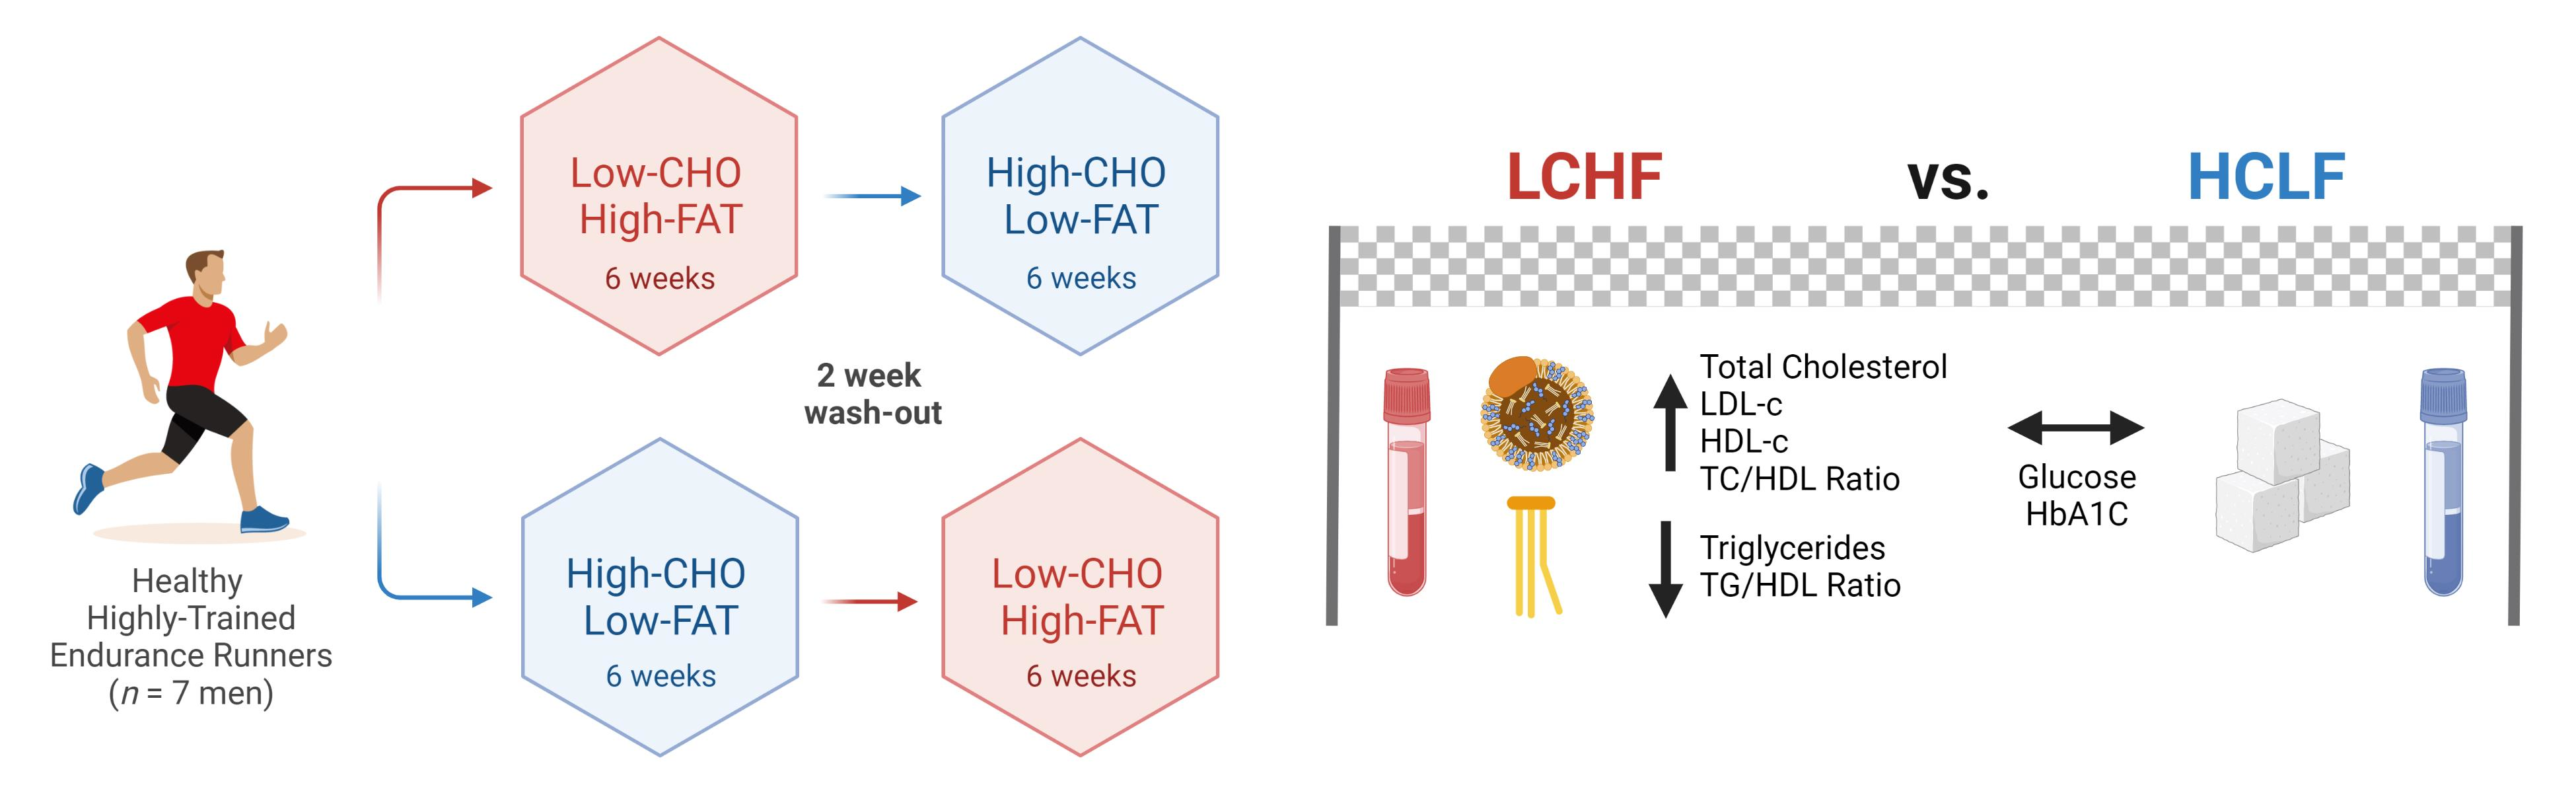
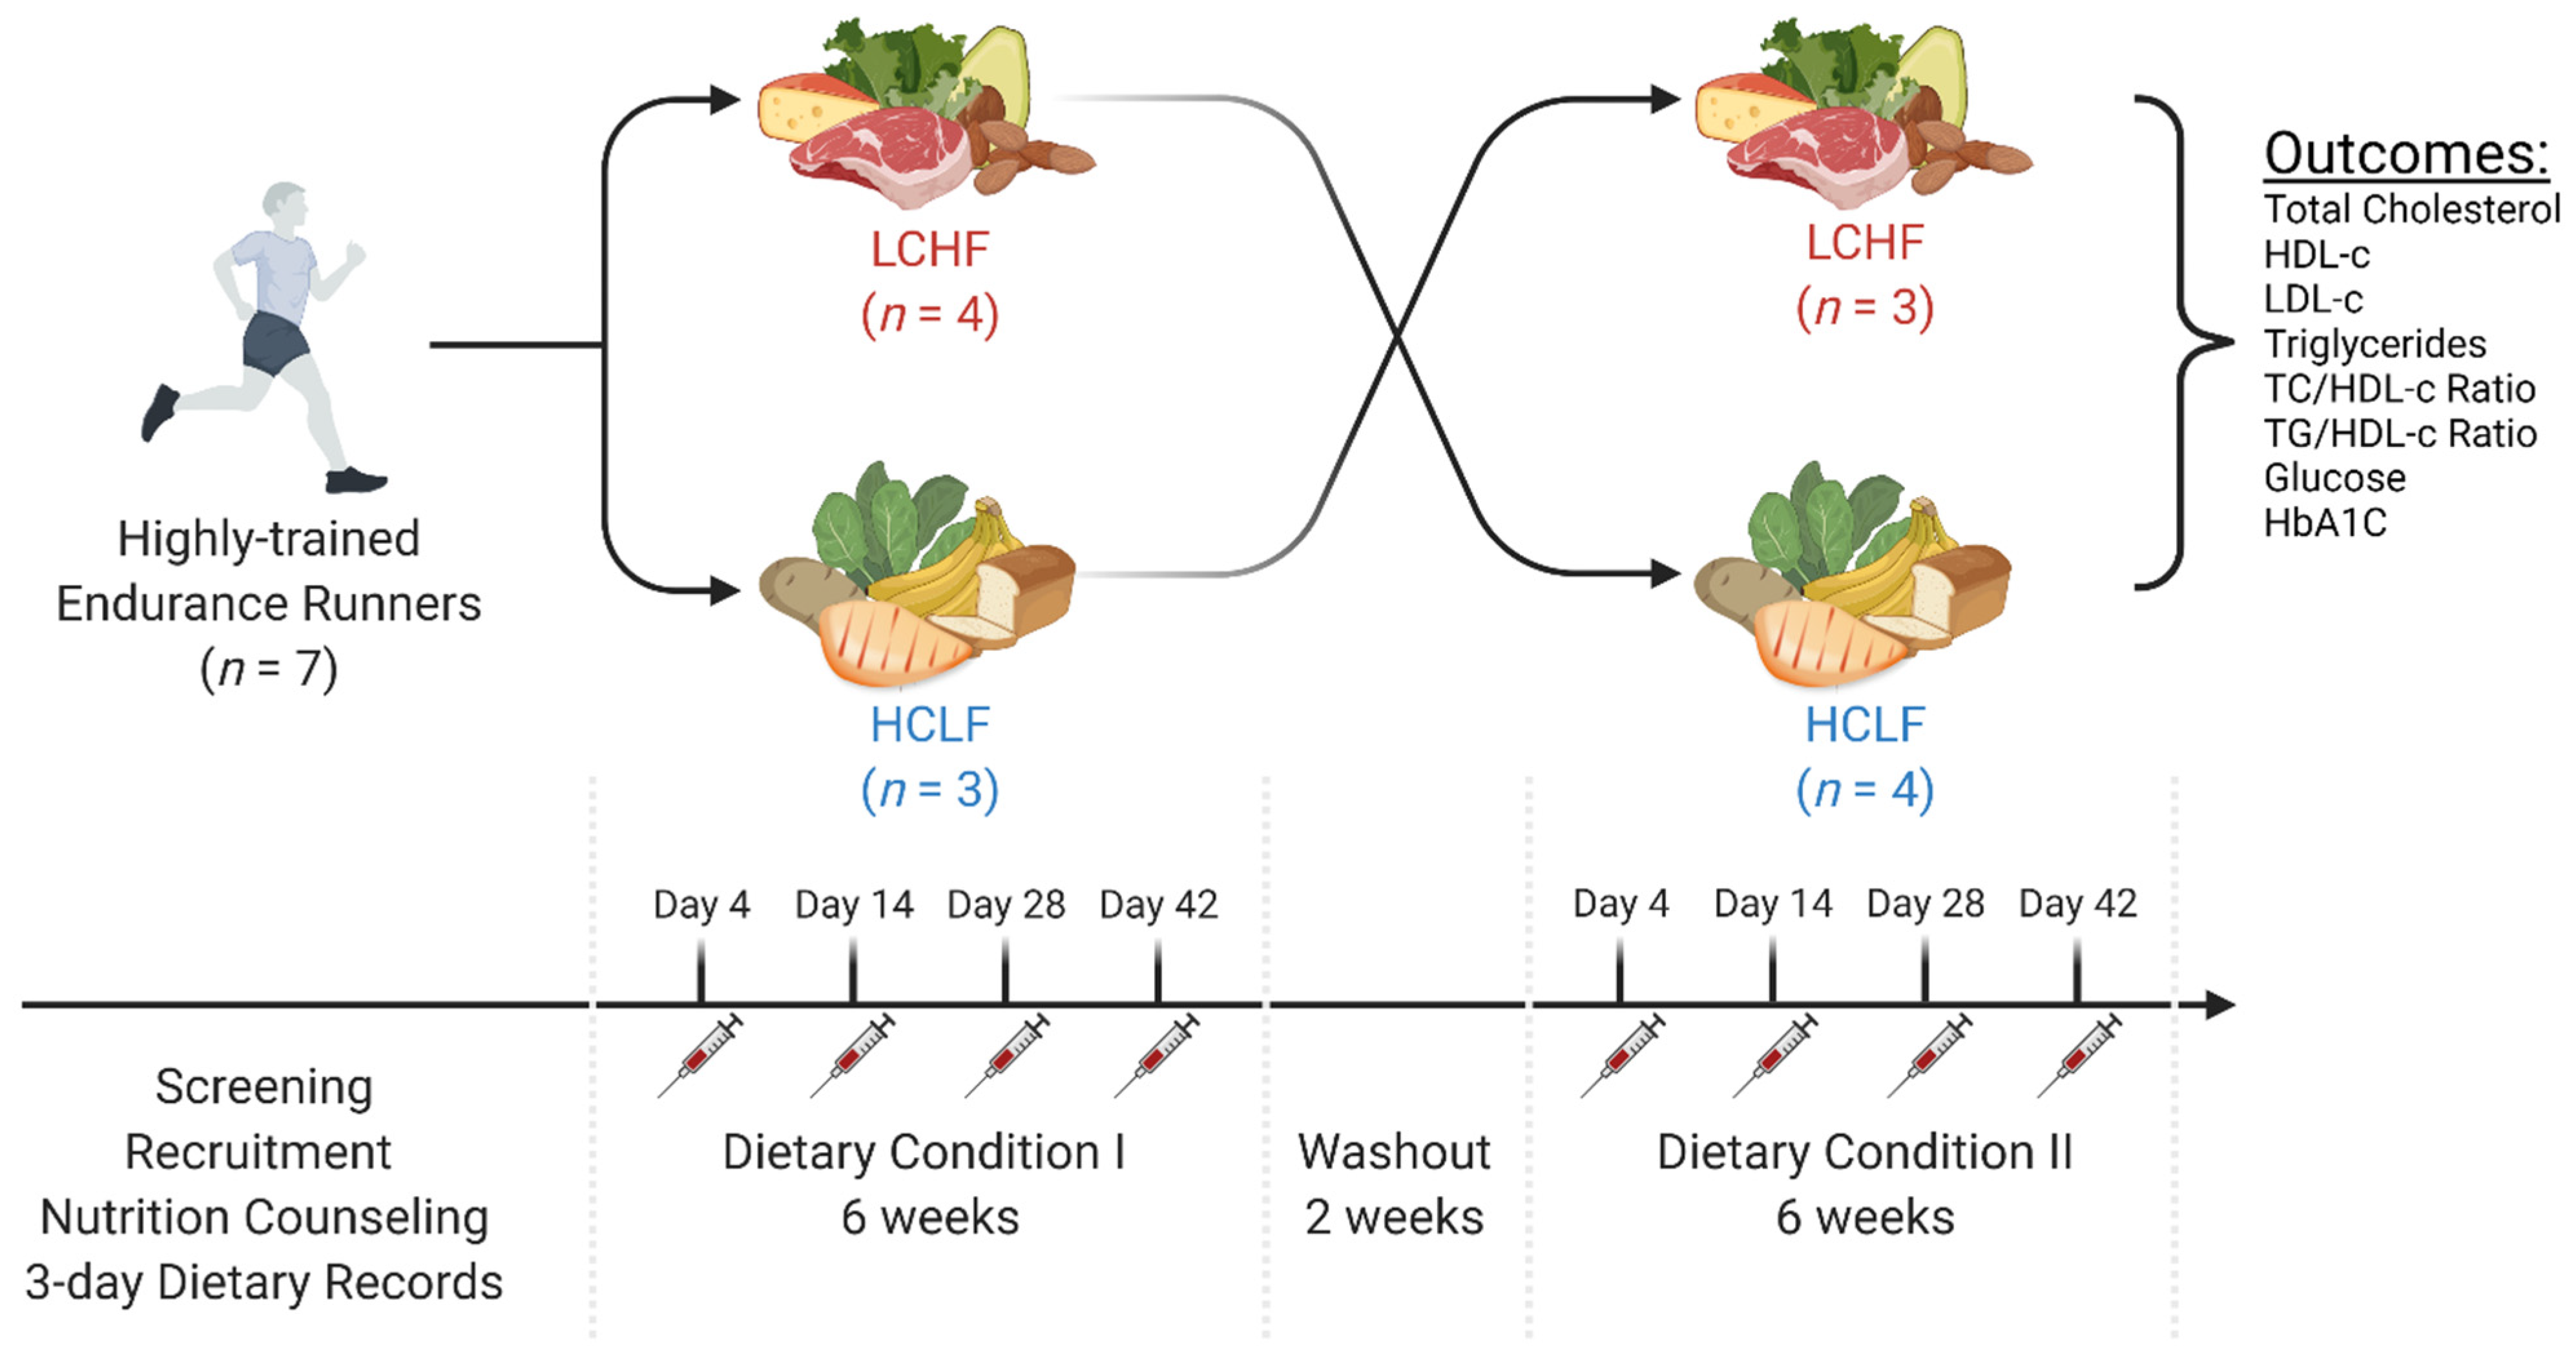
2.1. Experimental Design and Participants
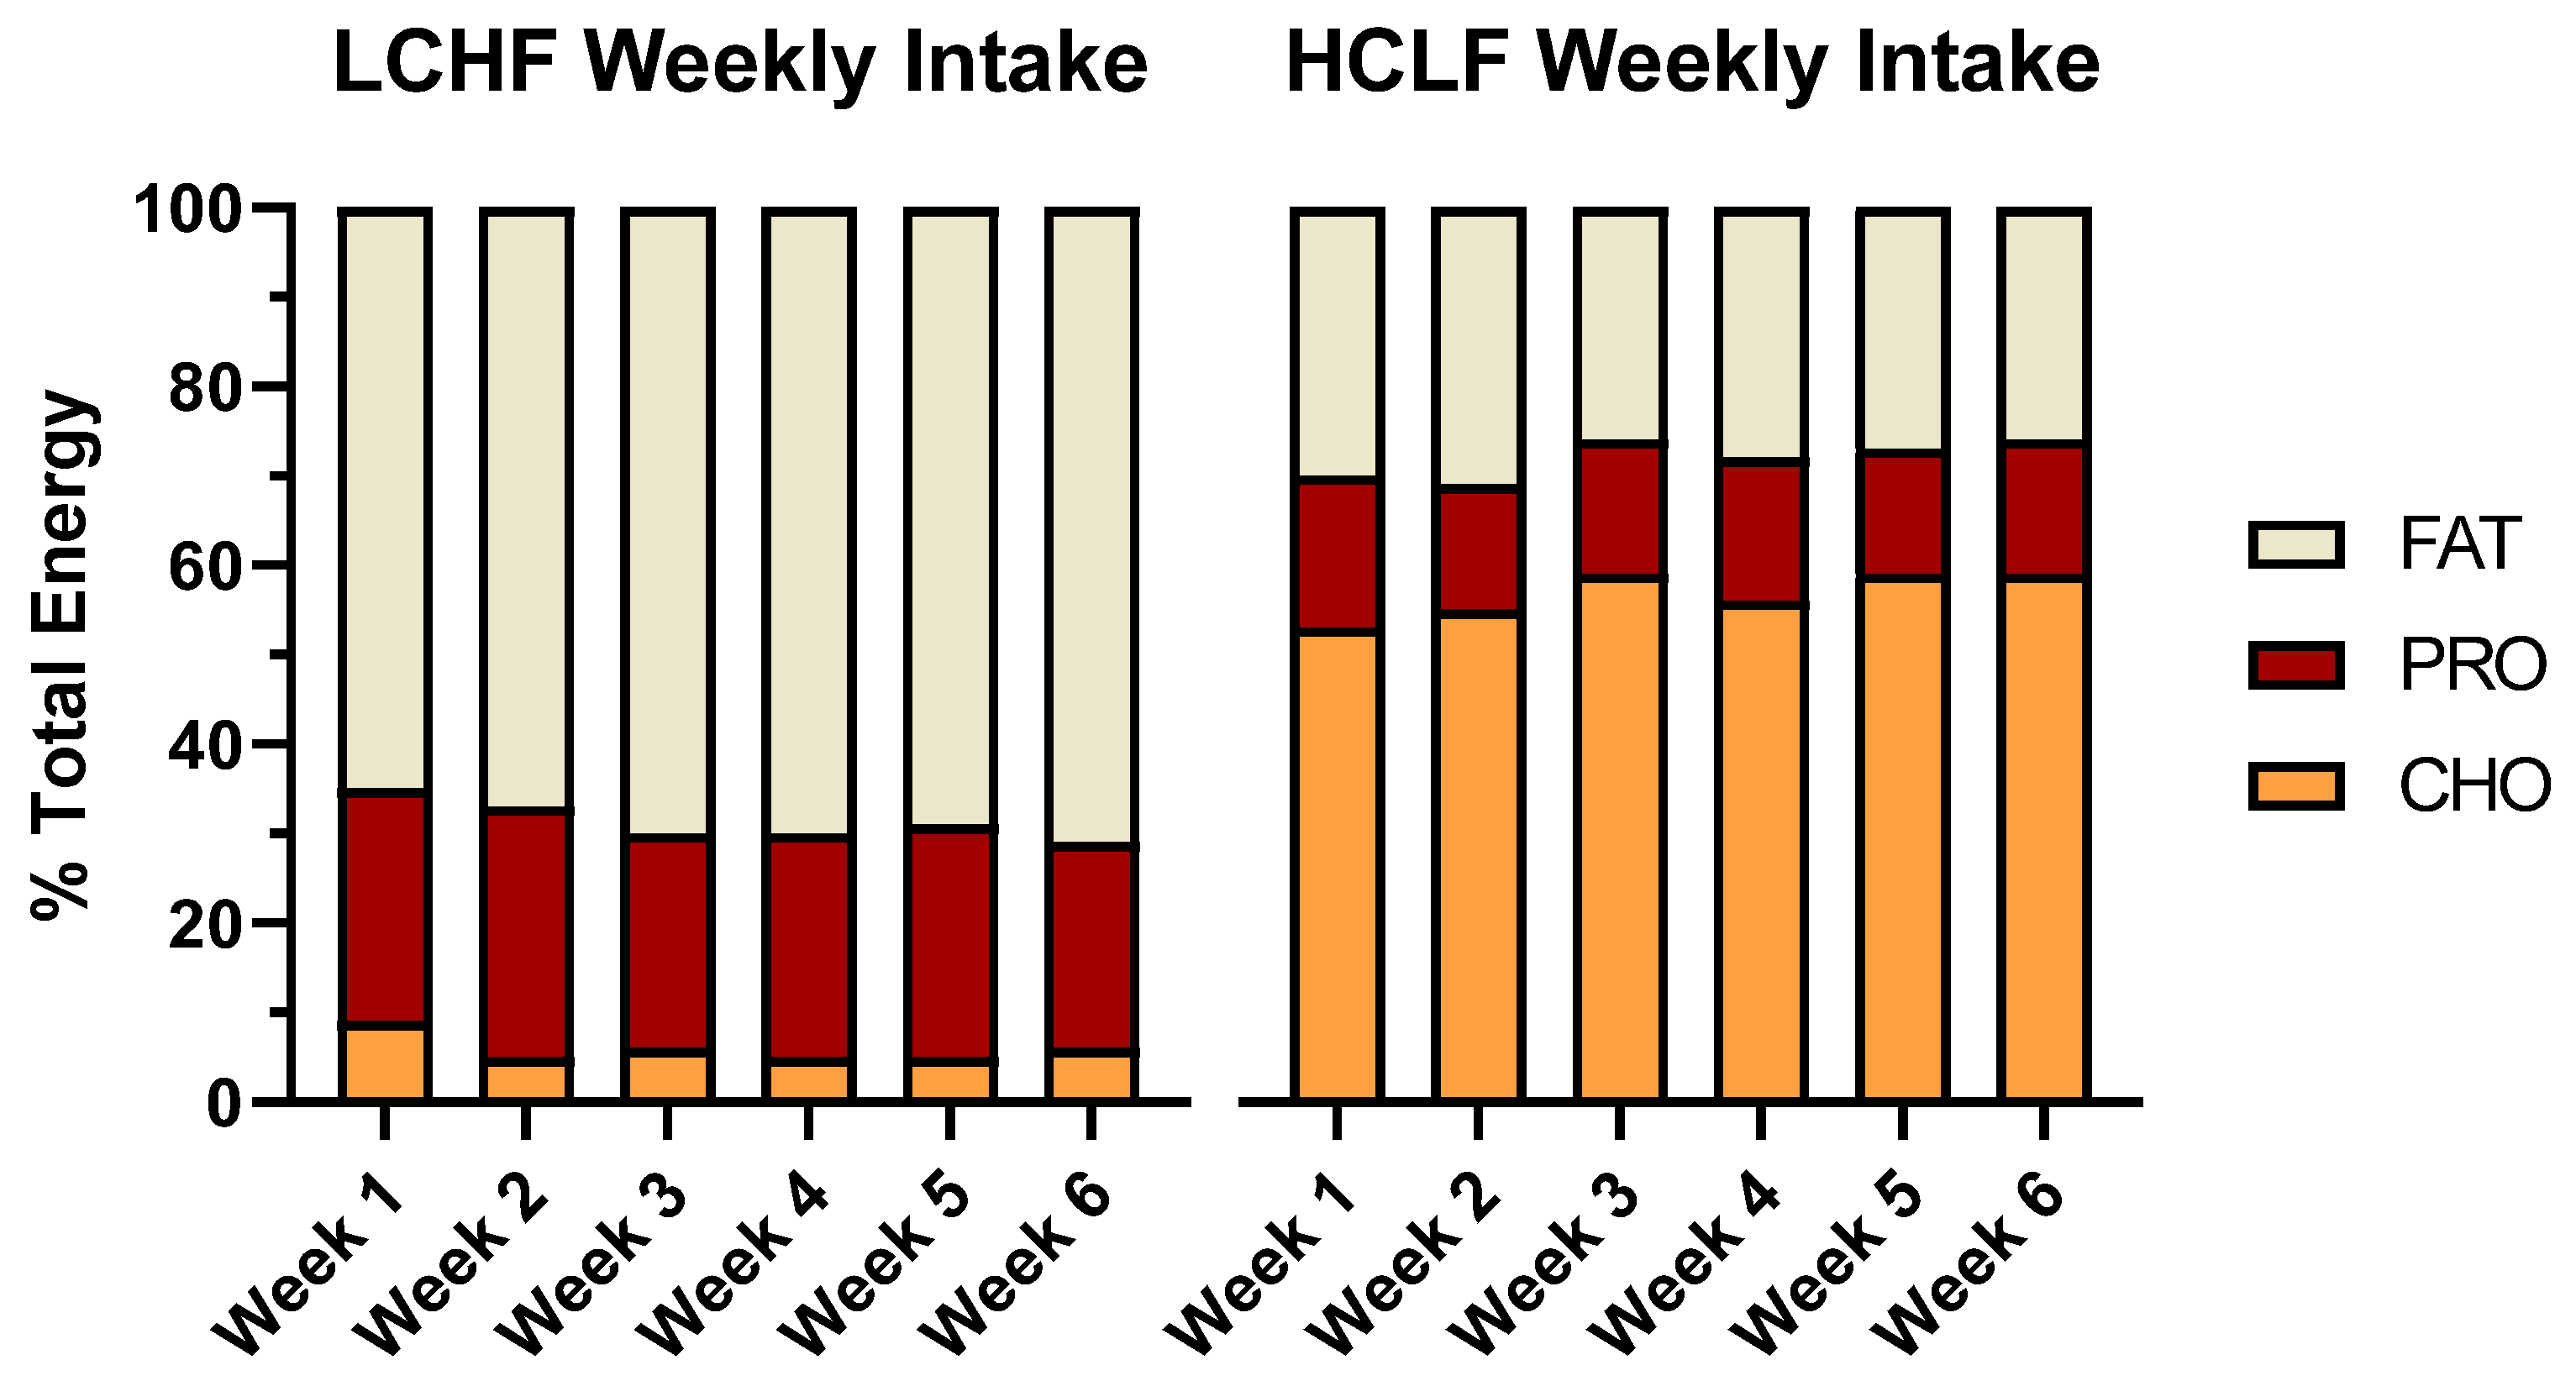
2.2. Nutrition and Exercise Guidelines
- LCHF: <50 g/day carbohydrate, 75–80% en fat, 15–20% en protein.
- HCLF: 60–65% en carbohydrate, 20% en fat, 15–20% en protein.
2.3. Laboratory Protocols
2.4. Statistics
3. Results
4. Discussion
5. Conclusions
Author Contributions
Funding
Institutional Review Board Statement
Informed Consent Statement
Data Availability Statement
Acknowledgments
Conflicts of Interest
References
- Costill, D.L.; Sherman, W.M.; Fink, W.J.; Maresh, C.; Witten, M.; Miller, J.M. The role of dietary carbohydrates in muscle glycogen resynthesis after strenuous running. Am. J. Clin. Nutr. 1981, 34, 1831–1836. [Google Scholar] [CrossRef] [PubMed] [Green Version]
- Burke, L.M.; Castell, L.M.; Casa, D.J.; Close, G.L.; Costa, R.J.S.; Desbrow, B.; Halson, S.L.; Lis, D.M.; Melin, A.K.; Peeling, P.; et al. International Association of Athletics Federations Consensus Statement 2019: Nutrition for Athletics. Int. J. Sport Nutr. Exerc. Metab. 2019, 29, 73–84. [Google Scholar] [CrossRef] [PubMed] [Green Version]
- McSwiney, F.T.; Doyle, L.; Plews, D.J.; Zinn, C. Impact Of Ketogenic Diet On Athletes: Current Insights. J. Sports Med. 2019, 10, 171–183. [Google Scholar] [CrossRef] [PubMed] [Green Version]
- Volek, J.S.; Noakes, T.; Phinney, S. Rethinking fat as a fuel for endurance exercise. Eur. J. Sport Sci. 2015, 15, 13–20. [Google Scholar] [CrossRef]
- Phinney, S.D.; Bistrian, B.R.; Wolfe, R.R.; Blackburn, G.L. The human metabolic response to chronic ketosis without caloric restriction: Physical and biochemical adaptation. Metabolism 1983, 32, 757–768. [Google Scholar] [CrossRef]
- Shaw, D.M.; Merien, F.; Braakhuis, A.; Maunder, E.D.; Dulson, D.K. Effect of a Ketogenic Diet on Submaximal Exercise Capacity and Efficiency in Runners. Med. Sci. Sports Exerc. 2019, 51, 2135–2146. [Google Scholar] [CrossRef]
- Achten, J.; Jeukendrup, A. Relation between plasma lactate concentration and fat oxidation rates over a wide range of exercise intensities. Int. J. Sport Med. 2004, 25, 32–37. [Google Scholar]
- Phinney, S.D.; Horton, E.S.; Sims, E.A.; Hanson, J.S.; Danforth, E., Jr.; LaGrange, B.M. Capacity for moderate exercise in obese subjects after adaptation to a hypocaloric, ketogenic diet. J. Clin. Investig. 1980, 66, 1152–1161. [Google Scholar] [CrossRef]
- Lloyd-Jones, D.M.; Leip, E.P.; Larson, M.G.; D’Agostino, R.B.; Beiser, A.; Wilson, P.W.; Wolf, P.A.; Levy, D. Prediction of lifetime risk for cardiovascular disease by risk factor burden at 50 years of age. Circulation 2006, 113, 791–798. [Google Scholar] [CrossRef]
- Taskinen, M.-R. LDL-Cholesterol, HDL-Cholesterol or triglycerides—which is the culprit? Diabetes Res. Clin. Pract. 2003, 61, S19–S26. [Google Scholar] [CrossRef]
- Volek, J.S.; Phinney, S.D.; Forsythe, C.E.; Quann, E.E.; Wood, R.J.; Puglisi, M.J.; Kraemer, W.J.; Bibus, D.M.; Fernandez, M.L.; Feinman, R.D. Carbohydrate restriction has a more favorable impact on the metabolic syndrome than a low fat diet. Lipids 2009, 44, 297–309. [Google Scholar] [CrossRef] [PubMed]
- Westman, E.C.; Mavropoulos, J.; Yancy, W.S.; Volek, J.S. A review of low-carbohydrate ketogenic diets. Curr. Atheroscler. Rep. 2003, 5, 476–483. [Google Scholar] [CrossRef] [PubMed]
- Zajac, A.; Poprzecki, S.; Maszczyk, A.; Czuba, M.; Michalczyk, M.; Zydek, G. The effects of a ketogenic diet on exercise metabolism and physical performance in off-road cyclists. Nutrients 2014, 6, 2493–2508. [Google Scholar] [CrossRef] [PubMed]
- LaFountain, R.A.; Miller, V.J.; Barnhart, E.C.; Hyde, P.N.; Crabtree, C.D.; McSwiney, F.T.; Beeler, M.K.; Buga, A.; Sapper, T.N.; Short, J.A.; et al. Extended Ketogenic Diet and Physical Training Intervention in Military Personnel. Mil. Med. 2019, 184, e538–e547. [Google Scholar] [CrossRef]
- Prins, P.J.; Noakes, T.D.; Welton, G.L.; Haley, S.J.; Esbenshade, N.J.; Atwell, A.D.; Scott, K.E.; Abraham, J.; Raabe, A.S.; Buxton, J.D. High rates of fat oxidation induced by a low-carbohydrate, high-fat diet, do not impair 5-km running performance in competitive recreational athletes. J. Sports Sci. Med. 2019, 18, 738. [Google Scholar]
- Urbain, P.; Strom, L.; Morawski, L.; Wehrle, A.; Deibert, P.; Bertz, H. Impact of a 6-week non-energy-restricted ketogenic diet on physical fitness, body composition and biochemical parameters in healthy adults. Nutr. Metab. (Lond.) 2017, 14, 17. [Google Scholar] [CrossRef] [Green Version]
- Klement, R.J.; Frobel, T.; Albers, T.; Fikenzer, S.; Prinzhausen, J.; Kämmerer, U. A pilot case study on the impact of a self-prescribed ketogenic diet on biochemical parameters and running performance in healthy and physically active individuals. Nutr. Med. 2013, 1, 10. [Google Scholar]
- Tomaszewski, M.; Charchar, F.J.; Crawford, L.; Zukowska-Sczechowska, E.; Grzeszczak, W.; Sattar, N.; Dominiczak, A.F. Serum C-reactive protein and lipids in ultra-Marathon runners. Am. J. Cardiol. 2004, 94, 125–126. [Google Scholar] [CrossRef]
- Fiuza-Luces, C.; Garatachea, N.; Berger, N.A.; Lucia, A. Exercise is the real polypill. Physiology 2013, 28, 330–358. [Google Scholar] [CrossRef] [Green Version]
- Michalczyk, M.; Zajac, A.; Mikolajec, K.; Zydek, G.; Langfort, J. No modification in blood lipoprotein concentration but changes in body composition after 4 weeks of low carbohydrate diet (LCD) followed by 7 days of carbohydrate loading in basketball players. J. Hum. Kinet. 2018, 65, 125. [Google Scholar] [CrossRef] [Green Version]
- Paoli, A.; Cenci, L.; Pompei, P.; Sahin, N.; Bianco, A.; Neri, M.; Caprio, M.; Moro, T. Effects of two months of very low carbohydrate ketogenic diet on body composition, muscle strength, muscle area, and blood parameters in competitive natural body builders. Nutrients 2021, 13, 374. [Google Scholar] [CrossRef] [PubMed]
- Kephart, W.C.; Pledge, C.D.; Roberson, P.A.; Mumford, P.W.; Romero, M.A.; Mobley, C.B.; Martin, J.S.; Young, K.C.; Lowery, R.P.; Wilson, J.M.; et al. The Three-Month Effects of a Ketogenic Diet on Body Composition, Blood Parameters, and Performance Metrics in CrossFit Trainees: A Pilot Study. Sports (Basel) 2018, 6, 1. [Google Scholar] [CrossRef] [PubMed] [Green Version]
- Murphy, N.E.; Carrigan, C.T.; Margolis, L.M. High-Fat Ketogenic Diets and Physical Performance: A Systematic Review. Adv. Nutr. 2021, 12, 223–233. [Google Scholar] [CrossRef] [PubMed]
- Volek, J.S.; Freidenreich, D.J.; Saenz, C.; Kunces, L.J.; Creighton, B.C.; Bartley, J.M.; Davitt, P.M.; Munoz, C.X.; Anderson, J.M.; Maresh, C.M.; et al. Metabolic characteristics of keto-adapted ultra-endurance runners. Metabolism 2016, 65, 100–110. [Google Scholar] [CrossRef] [Green Version]
- Creighton, B.C.; Hyde, P.N.; Maresh, C.M.; Kraemer, W.J.; Phinney, S.D.; Volek, J.S. Paradox of hypercholesterolaemia in highly trained, keto-adapted athletes. BMJ Open Sport Exerc. Med. 2018, 4, e000429. [Google Scholar] [CrossRef] [Green Version]
- Lambert, E.V.; Goedecke, J.H.; Zyle, C.; Murphy, K.; Hawley, J.A.; Dennis, S.C.; Noakes, T.D. High-fat diet versus habitual diet prior to carbohydrate loading: Effects of exercise metabolism and cycling performance. Int. J. Sport Nutr. Exerc. Metab. 2001, 11, 209–225. [Google Scholar] [CrossRef]
- O’Neal, E.K.; Smith, A.F.; Heatherly, A.J.; Killen, L.G.; Waldman, H.S.; Hollingsworth, A.; Koh, Y. Effects of a 3-week high-fat-low-carbohydrate diet on lipid and glucose profiles in experienced, middle-age male runners. Int. J. Exerc. Sci. 2019, 12, 786. [Google Scholar]
- McSwiney, F.T.; Wardrop, B.; Hyde, P.N.; Lafountain, R.A.; Volek, J.S.; Doyle, L. Keto-adaptation enhances exercise performance and body composition responses to training in endurance athletes. Metabolism 2018, 81, 25–34. [Google Scholar] [CrossRef]
- Friedewald, W.T.; Levy, R.I.; Fredrickson, D.S. Estimation of the concentration of low-density lipoprotein cholesterol in plasma, without use of the preparative ultracentrifuge. Clin. Chem. 1972, 18, 499–502. [Google Scholar] [CrossRef]
- Volek, J.S.; Phinney, S.D.; Krauss, R.M.; Johnson, R.J.; Saslow, L.R.; Gower, B.; Yancy, W.S., Jr.; King, J.C.; Hecht, F.M.; Teicholz, N.; et al. Alternative Dietary Patterns for Americans: Low-Carbohydrate Diets. Nutrients 2021, 13, 3299. [Google Scholar] [CrossRef]
- Holt, S.H.; Miller, J.C.; Petocz, P. An insulin index of foods: The insulin demand generated by 1000-kJ portions of common foods. Am. J. Clin. Nutr. 1997, 66, 1264–1276. [Google Scholar] [CrossRef]
- Expert Panel on Detection, Evaluation, and Treatment of High Blood Cholesterol in Adults. Executive summary of the third report of the National Cholesterol Education Program (NCEP) expert panel on detection, evaluation, and treatment of high blood cholesterol in adults (adult treatment panel III). JAMA 2001, 285, 2486–2497. [Google Scholar]
- Langlois, M.R.; Nordestgaard, B.G.; Langsted, A.; Chapman, M.J.; Aakre, K.M.; Baum, H.; Boren, J.; Bruckert, E.; Catapano, A.; Cobbaert, C.; et al. Quantifying atherogenic lipoproteins for lipid-lowering strategies: Consensus-based recommendations from EAS and EFLM. Clin. Chem. Lab. Med. 2020, 58, 496–517. [Google Scholar] [CrossRef] [PubMed] [Green Version]
- Hyde, P.N.; Sapper, T.N.; LaFountain, R.A.; Kackley, M.L.; Buga, A.; Fell, B.; Crabtree, C.D.; Phinney, S.D.; Miller, V.J.; King, S.M.; et al. Effects of Palm Stearin versus Butter in the Context of Low-Carbohydrate/High-Fat and High-Carbohydrate/Low-Fat Diets on Circulating Lipids in a Controlled Feeding Study in Healthy Humans. Nutrients 2021, 13, 1944. [Google Scholar] [CrossRef] [PubMed]
- Volek, J.S.; Fernandez, M.L.; Feinman, R.D.; Phinney, S.D. Dietary carbohydrate restriction induces a unique metabolic state positively affecting atherogenic dyslipidemia, fatty acid partitioning, and metabolic syndrome. Prog. Lipid Res. 2008, 47, 307–318. [Google Scholar] [CrossRef]
- Buren, J.; Ericsson, M.; Damasceno, N.R.T.; Sjodin, A. A Ketogenic Low-Carbohydrate High-Fat Diet Increases LDL Cholesterol in Healthy, Young, Normal-Weight Women: A Randomized Controlled Feeding Trial. Nutrients 2021, 13, 814. [Google Scholar] [CrossRef]
- Volek, J.S.; Sharman, M.J.; Forsythe, C.E. Modification of lipoproteins by very low-carbohydrate diets. J. Nutr. 2005, 135, 1339–1342. [Google Scholar] [CrossRef]
- Féry, F.; Balasse, E.O. Ketone body production and disposal in diabetic ketosis: A comparison with fasting ketosis. Diabetes 1985, 34, 326–332. [Google Scholar] [CrossRef]
- Kackley, M.L.; Short, J.A.; Hyde, P.N.; LaFountain, R.A.; Buga, A.; Miller, V.J.; Dickerson, R.M.; Sapper, T.N.; Barnhart, E.C.; Krishnan, D. A pre-workout supplement of ketone salts, caffeine, and amino acids improves high-intensity exercise performance in keto-naïve and keto-adapted individuals. J. Am. Coll. Nutr. 2020, 39, 290–300. [Google Scholar] [CrossRef]
- Phinney, S.D.; Bistrian, B.R.; Evans, W.; Gervino, E.; Blackburn, G. The human metabolic response to chronic ketosis without caloric restriction: Preservation of submaximal exercise capability with reduced carbohydrate oxidation. Metabolism 1983, 32, 769–776. [Google Scholar] [CrossRef]
- Jones, P.J.; Pappu, A.S.; Hatcher, L.; Li, Z.C.; Illingworth, D.R.; Connor, W.E. Dietary cholesterol feeding suppresses human cholesterol synthesis measured by deuterium incorporation and urinary mevalonic acid levels. Arterioscler. Thromb. Vasc. Biol. 1996, 16, 1222–1228. [Google Scholar] [CrossRef] [PubMed]
- Hyde, P.N.; Sapper, T.N.; Crabtree, C.D.; LaFountain, R.A.; Bowling, M.L.; Buga, A.; Fell, B.; McSwiney, F.T.; Dickerson, R.M.; Miller, V.J.; et al. Dietary carbohydrate restriction improves metabolic syndrome independent of weight loss. JCI Insight 2019, 4. [Google Scholar] [CrossRef] [PubMed] [Green Version]
- Falkenhain, K.; Roach, L.A.; McCreary, S.; McArthur, E.; Weiss, E.J.; Francois, M.E.; Little, J.P. Effect of carbohydrate-restricted dietary interventions on LDL particle size and number in adults in the context of weight loss or weight maintenance: A systematic review and meta-analysis. Am. J. Clin. Nutr. 2021, 114, 1455–1466. [Google Scholar] [CrossRef]
- Volek, J.S.; Gomez, A.L.; Kraemer, W.J. Fasting lipoprotein and postprandial triacylglycerol responses to a low-carbohydrate diet supplemented with n-3 fatty acids. J. Am. Coll Nutr. 2000, 19, 383–391. [Google Scholar] [CrossRef] [PubMed]
- Volek, J.S.; Sharman, M.J.; Gomez, A.L.; Scheett, T.P.; Kraemer, W.J. An isoenergetic very low carbohydrate diet improves serum HDL cholesterol and triacylglycerol concentrations, the total cholesterol to HDL cholesterol ratio and postprandial lipemic responses compared with a low fat diet in normal weight, normolipidemic women. J. Nutr. 2003, 133, 2756–2761. [Google Scholar]
- Sultani, R.; Tong, D.C.; Peverelle, M.; Lee, Y.S.; Baradi, A.; Wilson, A.M. Elevated Triglycerides to High-Density Lipoprotein Cholesterol (TG/HDL-C) Ratio Predicts Long-Term Mortality in High-Risk Patients. Heart Lung Circ. 2020, 29, 414–421. [Google Scholar] [CrossRef]
- Arsenault, B.J.; Rana, J.S.; Stroes, E.S.G.; Després, J.-P.; Shah, P.K.; Kastelein, J.J.P.; Wareham, N.J.; Boekholdt, S.M.; Khaw, K.-T. Beyond low-density lipoprotein cholesterol: Respective contributions of non–high-density lipoprotein cholesterol levels, triglycerides, and the total cholesterol/high-density lipoprotein cholesterol ratio to coronary heart disease risk in apparently healthy men and women. J. Am. Coll. Cardiol. 2009, 55, 35–41. [Google Scholar]
- Athinarayanan, S.J.; Adams, R.N.; Hallberg, S.J.; McKenzie, A.L.; Bhanpuri, N.H.; Campbell, W.W.; Volek, J.S.; Phinney, S.D.; McCarter, J.P. Long-Term Effects of a Novel Continuous Remote Care Intervention Including Nutritional Ketosis for the Management of Type 2 Diabetes: A 2-Year Non-randomized Clinical Trial. Front. Endocrinol. (Lausanne) 2019, 10, 348. [Google Scholar] [CrossRef] [Green Version]
- Volk, B.M.; Kunces, L.J.; Freidenreich, D.J.; Kupchak, B.R.; Saenz, C.; Artistizabal, J.C.; Fernandez, M.L.; Bruno, R.S.; Maresh, C.M.; Kraemer, W.J.; et al. Effects of Step-Wise Increases in Dietary Carbohydrate on Circulating Saturated Fatty Acids and Palmitoleic Acid in Adults with Metabolic Syndrome. PLoS ONE 2014, 9, e113605. [Google Scholar] [CrossRef] [Green Version]
- Thomas, F.; Pretty, C.G.; Desaive, T.; Chase, J.G. Blood Glucose Levels of Subelite Athletes During 6 Days of Free Living. J. Diabetes Sci. Technol. 2016, 10, 1335–1343. [Google Scholar] [CrossRef] [Green Version]


| Variable | Mean | ± | SD |
|---|---|---|---|
| Age (years) | 35.6 | ± | 8.4 |
| Height (cm) | 178.7 | ± | 4.1 |
| Weight (kg) | 68.6 | ± | 1.6 |
| BMI (kg/m2) | 21.5 | ± | 1.1 |
| Body Fat (%) * | 5.0 | ± | 1.3 |
| Fat Mass (kg) | 3.5 | ± | 1.0 |
| Lean Mass (kg) | 65.1 | ± | 1.5 |
| VO2max (mL/kg/min) | 61.9 | ± | 6.1 |
| Running Distance Per Week (km) | 63.0 | ± | 27.1 |
| Running Experience (years) | 15.1 | ± | 7.1 |
| Variable | Week 1 | Week 2 | Week 3 | Week 4 | Week 5 | Week 6 | Overall Mean | p-Value | |||||||
|---|---|---|---|---|---|---|---|---|---|---|---|---|---|---|---|
| LCHF | HCLF | LCHF | HCLF | LCHF | HCLF | LCHF | HCLF | LCHF | HCLF | LCHF | HCLF | LCHF | HCLF | ||
| Energy (Kcal/day) | 2574 ± 455 | 2944 ± 943 | 3324 ± 543 | 3118 ± 872 | 2905 ± 400 | 2496 ± 661 | 3243 ± 1132 | 2886 ± 1094 | 2828 ± 382 | 3014 ± 1035 | 2808 ± 1011 | 2563 ± 507 | 2947 ± 284 | 2837 ± 251 | 0.686 |
| Carbohydrate (g) | 52 ± 16 | 396 ± 174 | 44 ± 16 | 427 ± 132 | 47 ± 11 | 371 ± 118 | 40 ± 10 | 385 ± 113 | 36 ± 13 | 453 ± 211 | 39 ± 18 | 379 ± 86 | 43 ± 6 | 402 ± 32 | 0.001 |
| Protein (g) | 161 ± 34 | 118 ± 31 | 228 ± 77 | 107 ± 27 | 170 ± 31 | 94 ± 20 | 204 ± 104 | 112 ± 32 | 182 ± 49 | 106 ± 34 | 157 ± 39 | 99 ± 28 | 184 ± 28 | 106 ± 9 | 0.001 |
| Fat (g) | 191 ± 63 | 99 ± 36 | 247 ± 44 | 110 ± 37 | 226 ± 41 | 73 ± 16 | 250 ± 73 | 88 ± 38 | 216 ± 33 | 89 ± 36 | 227 ± 98 | 75 ± 30 | 226 ± 21 | 89 ± 14 | 0.001 |
| Carbohydrate (%) | 9 ± 3 | 53 ± 10 | 5 ± 2 | 55 ± 6 | 7 ± 1 | 58 ± 4 | 5 ± 2 | 56 ± 4 | 5 ± 2 | 59 ± 10 | 5 ± 2 | 59 ± 9 | 6 ± 1 | 56 ± 3 | 0.001 |
| Protein (%) | 26 ± 8 | 17 ± 5 | 27 ± 7 | 14 ± 2 | 24 ± 5 | 15 ± 2 | 25 ± 4 | 16 ± 3 | 26 ± 5 | 14 ± 4 | 23 ± 5 | 15 ± 4 | 25 ± 2 | 15 ± 1 | 0.001 |
| Fat (%) | 65 ± 11 | 30 ± 7 | 67 ± 6 | 31 ± 5 | 70 ± 4 | 26 ± 2 | 70 ± 3 | 28 ± 3 | 68 ± 4 | 27 ± 9 | 71 ± 4 | 26 ± 6 | 69 ± 2 | 28 ± 2 | 0.001 |
| Cholesterol (mg) | 938 ± 234 | 306 ± 173 | 1283 ± 233 | 248 ± 127 | 1033 ± 96 | 229 ± 104 | 1365 ± 410 | 293 ± 227 | 1317 ± 191 | 260 ± 147 | 1261 ± 376 | 249 ± 188 | 1199 ± 127 | 264 ± 30 | 0.001 |
| Saturated fat (g) | 63 ± 21 | 33 ± 13 | 97 ± 28 | 36 ± 16 | 90 ± 32 | 22 ± 4 | 100 ± 28 | 28 ± 13 | 90 ± 12 | 29 ± 17 | 95 ± 42 | 24 ± 12 | 89 ± 13 | 29 ± 5 | 0.001 |
| Monounsaturated fat (g) | 64 ± 28 | 28 ± 12 | 82 ± 18 | 33 ± 12 | 76 ± 14 | 22 ± 6 | 74 ± 20 | 26 ± 15 | 68 ± 19 | 22 ± 13 | 73 ± 31 | 23 ± 12 | 73 ± 6 | 26 ± 5 | 0.001 |
| Polyunsaturated fat (g) | 21 ± 9 | 14 ± 6 | 24 ± 7 | 18 ± 5 | 24 ± 10 | 15 ± 7 | 23 ± 7 | 14 ± 7 | 21 ± 6 | 13 ± 6 | 28 ± 26 | 13 ± 6 | 23 ± 3 | 15 ± 2 | 0.023 |
| EPA (g) | 0.1 ± 0.1 | 0.01 ± 0.01 | 0.2 ± 0.2 | 0.01 ± 0.01 | 0.1 ± 0.1 | 0.06 ± 0.09 | 0.1 ± 0.1 | 0.01 ± 0.01 | 0.1 ± 0.1 | 0.01 ± 0.01 | 0.1 ± 0.1 | 0.02 ± 0.03 | 0.08 ± 0.04 | 0.02 ± 0.02 | 0.019 |
| DHA (g) | 0.2 ± 0.2 | 0.03 ± 0.03 | 0.4 ± 0.4 | 0.02 ± 0.01 | 0.2 ± 0.3 | 0.12 ± 0.2 | 0.1 ± 0.1 | 0.02 ± 0.02 | 0.3 ± 0.3 | 0.02 ± 0.01 | 0.2 ± 0.2 | 0.05 ± 0.08 | 0.22 ± 0.09 | 0.04 ± 0.04 | 0.012 |
| Fiber (g) | 11 ± 6 | 30 ± 14 | 10 ± 5 | 31 ± 8 | 11 ± 6 | 30 ± 10 | 8 ± 3 | 30 ± 10 | 9 ± 6 | 29 ± 12 | 8 ± 6 | 29 ± 7 | 10 ± 2 | 30 ± 1 | 0.001 |
| Sugar (g) | 23 ± 7 | 138 ± 84 | 19 ± 8 | 129 ± 54 | 16 ± 4 | 125 ± 64 | 17 ± 8 | 136 ± 51 | 16 ± 6 | 132 ± 36 | 18 ± 7 | 135 ± 39 | 18 ± 2 | 132 ± 5 | 0.001 |
| Variable | LCHF | HCLF | 2 × 4 RM ANOVA (p-Value) | ||||||||||
|---|---|---|---|---|---|---|---|---|---|---|---|---|---|
| Day 4 | Day 14 | Day 28 | Day 42 | Mean | Day 4 | Day 14 | Day 28 | Day 42 | Mean | Condition | Time | Interaction | |
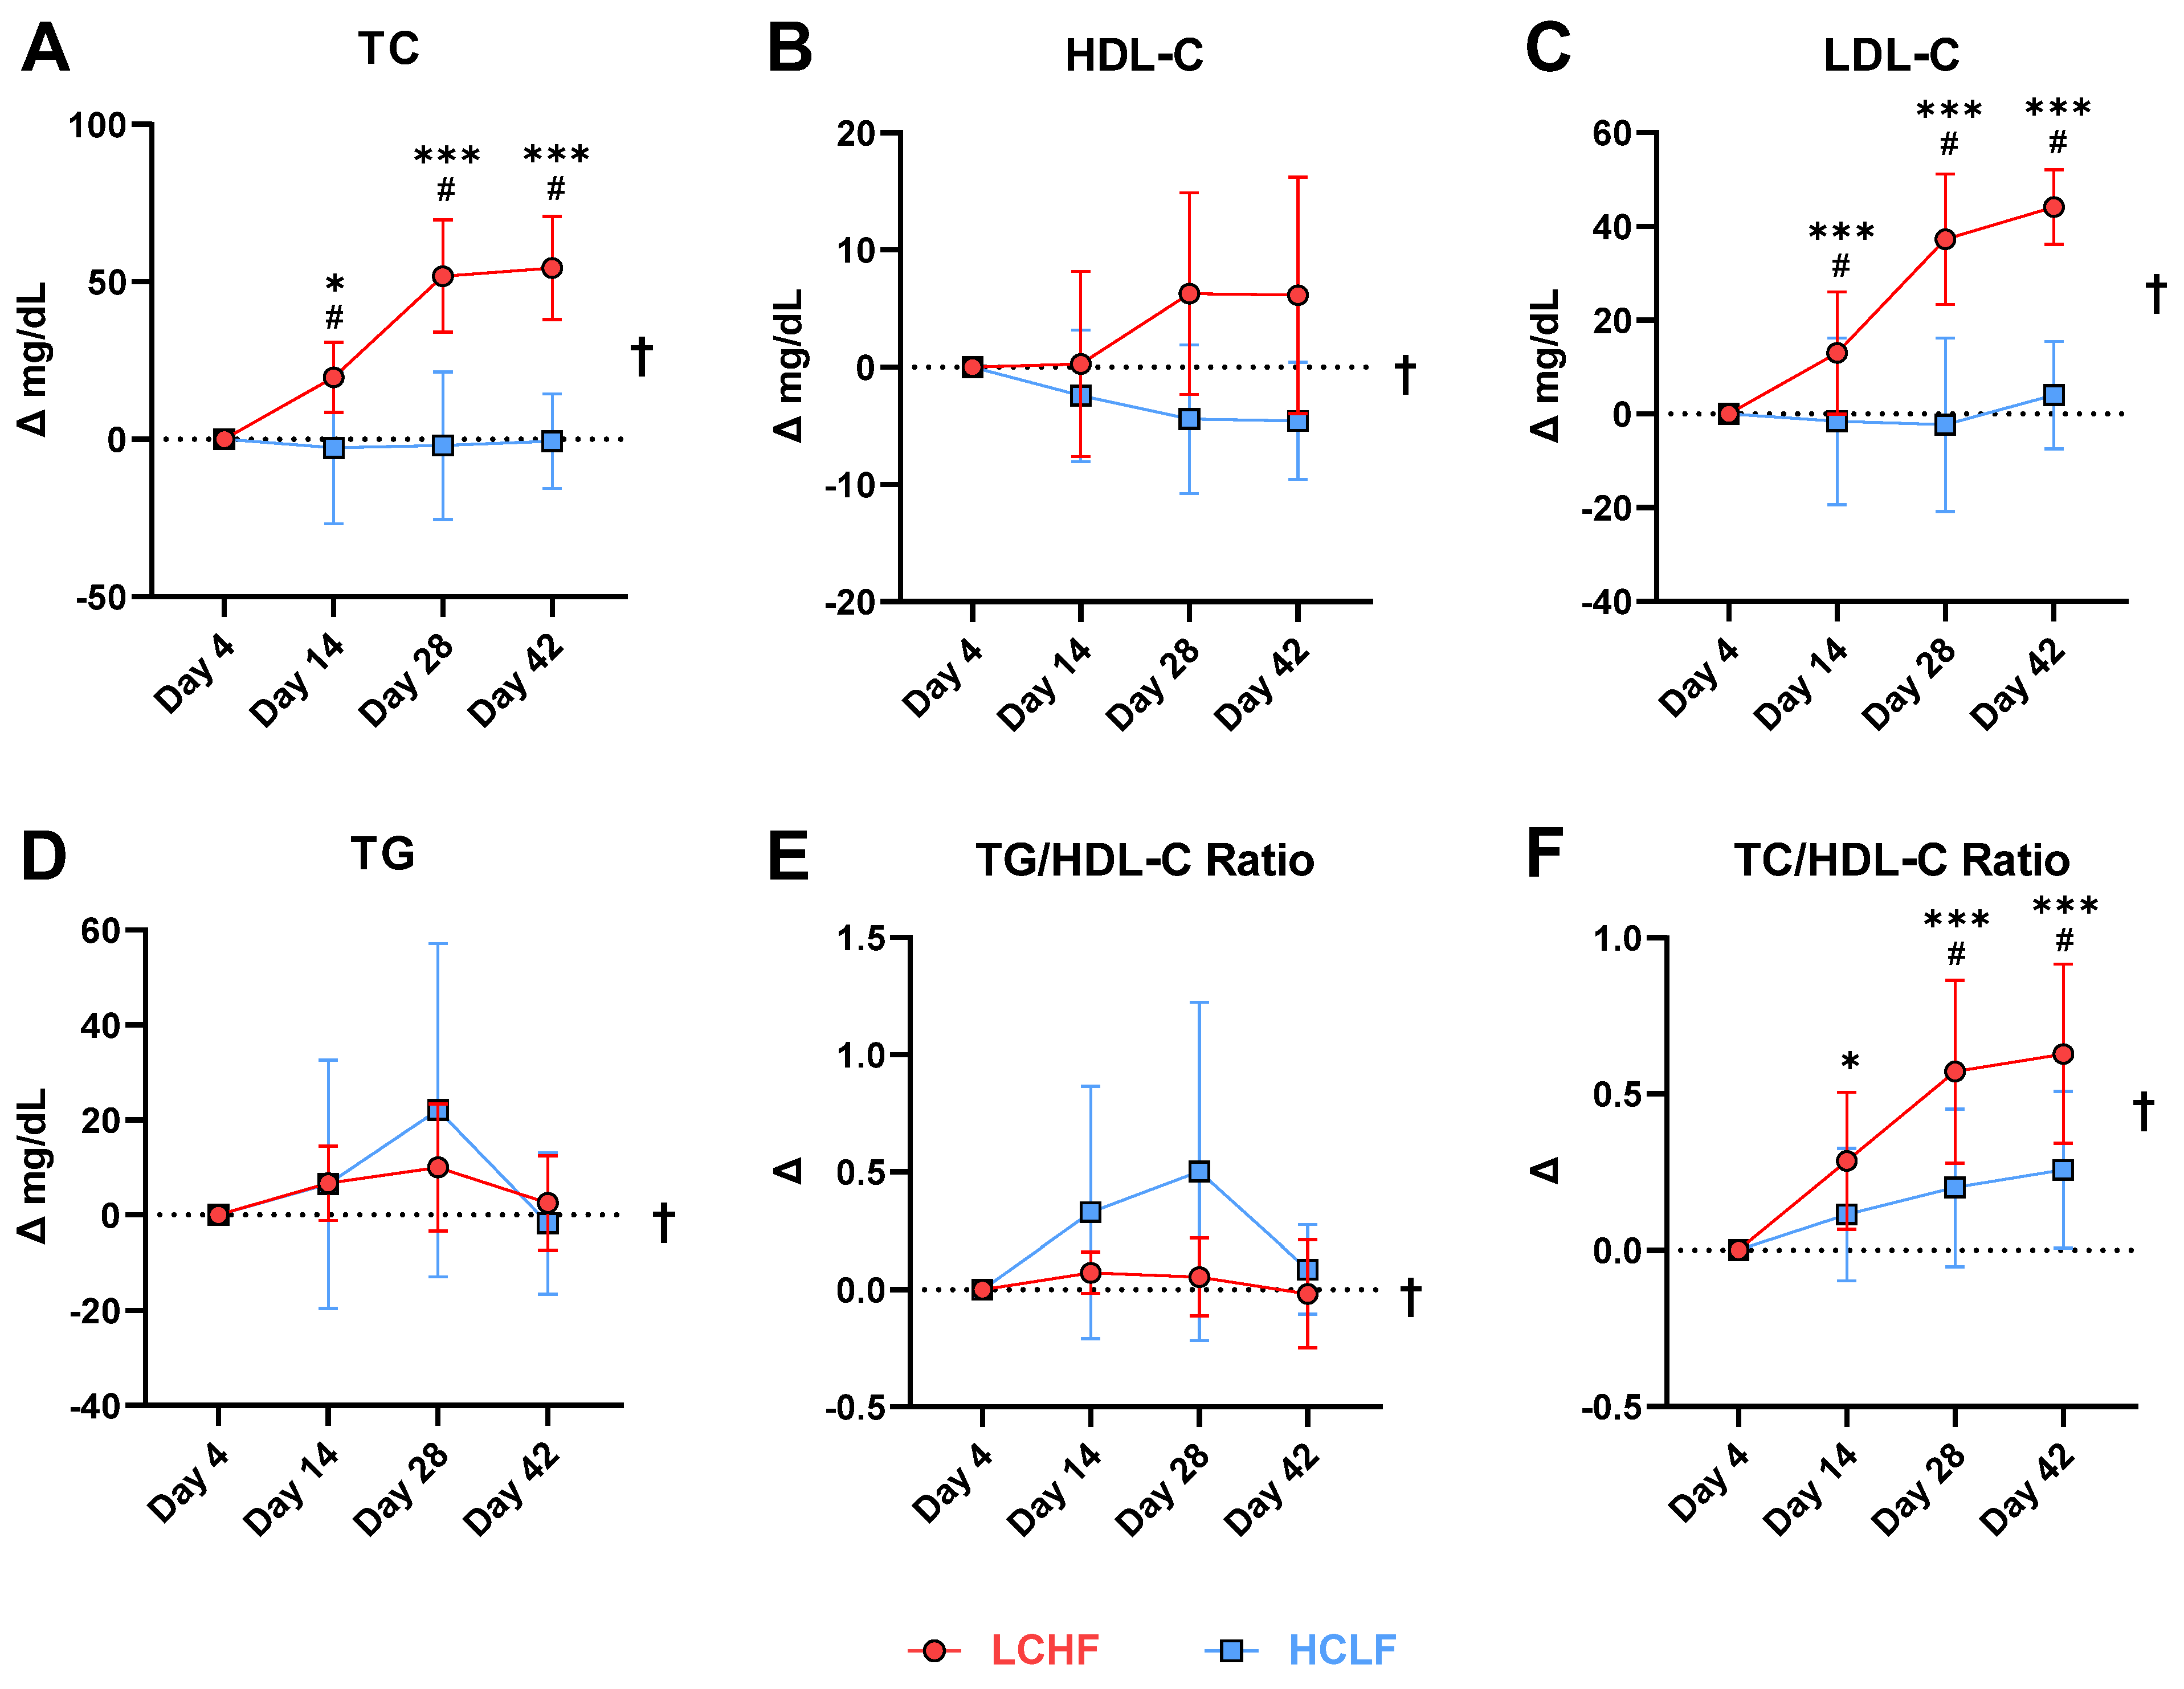
| Total Cholesterol (mg/dL) | 165.9 ± 21.7 | 185.6 ± 17.0 | 217.7 ± 16.6 | 220.3 ± 23.1 | 197.4 ± 26.3 | 154.7 ± 18.8 | 152.0 ± 29.5 | 152.7 ± 22.4 | 154.7 ± 19.4 | 153.4 ± 1.3 | 0.001 | 0.001 | 0.001 |
| TC/HDL-C Ratio | 2.5 ± 0.5 | 2.7 ± 0.6 | 3.0 ± 0.7 | 3.0 ± 0.7 | 2.8 ± 0.6 | 2.5 ± 0.5 | 2.6 ± 0.6 | 2.7 ± 0.6 | 2.8 ± 0.7 | 2.6 ± 0.6 | 0.035 | 0.001 | 0.011 |
| HDL-C (mg/dL) | 67.4 ± 15.5 | 67.7 ± 14.6 | 73.7 ± 18.9 | 73.6 ± 20.9 | 70.6 ± 3.5 | 63.4 ± 16.1 | 61.0 ± 18.5 | 59.0 ± 15.9 | 58.9 ± 16.2 | 60.6 ± 2.1 | 0.035 | 0.57 | 0.015 |
| LDL-C (mg/dL) | 84.7 ± 16.8 | 97.7 ± 20.4 | 122.0 ± 19.9 | 128.9 ± 17.7 | 108.3 ± 17.1 | 73.4 ± 14.2 | 71.9 ± 15.9 | 71.1 ± 17.5 | 77.4 ± 13.6 | 73.5 ± 12.8 | 0.001 | 0.001 | 0.001 |
| Triglycerides (mg/dL) | 69.1 ± 8.5 | 75.9 ± 6.1 | 79.1 ± 13.7 | 71.7 ± 10.4 | 73.9 ± 4.4 | 90.3 ± 22.2 | 96.9 ± 22.1 | 112.4 ± 30.5 | 88.6 ± 17.9 | 97.0 ± 10.9 | 0.005 | 0.13 | 0.44 |
| VLDL (mg/dL) | 13.9 ± 1.7 | 15.0 ± 1.2 | 15.9 ± 2.8 | 15.4 ± 3.3 | 15.0 ± 1.5 | 17.9 ± 4.5 | 19.4 ± 4.3 | 22.4 ± 6.2 | 17.9 ± 3.8 | 19.4 ± 2.8 | 0.004 | 0.23 | 0.28 |
| TG/HDL-C Ratio | 1.0 ± 0.3 | 1.2 ± 0.3 | 1.1 ± 0.4 | 1.0 ± 0.4 | 1.0 ± 0.1 | 1.5 ± 0.7 | 1.9 ± 0.8 | 2.1 ± 0.8 | 1.6 ± 0.6 | 1.8 ± 0.2 | 0.001 | 0.24 | 0.30 |
| Glucose (mg/dL) | 80.6 ± 3.3 | 85.7 ± 4.2 | 84.3 ± 7.1 | 82.6 ± 9.1 | 83.3 ± 4.0 | 89.3 ± 10.4 | 91.3 ± 12.5 | 86.0 ± 9.5 | 88.1 ± 9.4 | 88.7 ± 8.6 | 0.11 | 0.34 | 0.62 |
| HbA1c (%) | 4.9 ± 0.2 | 4.9 ± 0.2 | 4.9 ± 0.1 | 4.9 ± 0.1 | 4.9 ± 0.1 | 4.9 ± 0.2 | 4.9 ± 0.2 | 5.0 ± 0.3 | 5.0 ± 0.3 | 4.9 ± 0.1 | 0.82 | 0.49 | 0.26 |
Publisher’s Note: MDPI stays neutral with regard to jurisdictional claims in published maps and institutional affiliations. |
© 2022 by the authors. Licensee MDPI, Basel, Switzerland. This article is an open access article distributed under the terms and conditions of the Creative Commons Attribution (CC BY) license (https://creativecommons.org/licenses/by/4.0/).
Share and Cite
Buga, A.; Welton, G.L.; Scott, K.E.; Atwell, A.D.; Haley, S.J.; Esbenshade, N.J.; Abraham, J.; Buxton, J.D.; Ault, D.L.; Raabe, A.S.; et al. The Effects of Carbohydrate versus Fat Restriction on Lipid Profiles in Highly Trained, Recreational Distance Runners: A Randomized, Cross-Over Trial. Nutrients 2022, 14, 1135. https://doi.org/10.3390/nu14061135
Buga A, Welton GL, Scott KE, Atwell AD, Haley SJ, Esbenshade NJ, Abraham J, Buxton JD, Ault DL, Raabe AS, et al. The Effects of Carbohydrate versus Fat Restriction on Lipid Profiles in Highly Trained, Recreational Distance Runners: A Randomized, Cross-Over Trial. Nutrients. 2022; 14(6):1135. https://doi.org/10.3390/nu14061135
Chicago/Turabian StyleBuga, Alex, Gary L. Welton, Katie E. Scott, Adam D. Atwell, Sarah J. Haley, Noah J. Esbenshade, Jacqueline Abraham, Jeffrey D. Buxton, Dana L. Ault, Amy S. Raabe, and et al. 2022. "The Effects of Carbohydrate versus Fat Restriction on Lipid Profiles in Highly Trained, Recreational Distance Runners: A Randomized, Cross-Over Trial" Nutrients 14, no. 6: 1135. https://doi.org/10.3390/nu14061135
APA StyleBuga, A., Welton, G. L., Scott, K. E., Atwell, A. D., Haley, S. J., Esbenshade, N. J., Abraham, J., Buxton, J. D., Ault, D. L., Raabe, A. S., Noakes, T. D., Hyde, P. N., Volek, J. S., & Prins, P. J. (2022). The Effects of Carbohydrate versus Fat Restriction on Lipid Profiles in Highly Trained, Recreational Distance Runners: A Randomized, Cross-Over Trial. Nutrients, 14(6), 1135. https://doi.org/10.3390/nu14061135