
Burden of Disease Associated with Dietary Exposure to Aflatoxins in China in 2020


Abstract
:1. Introduction
2. Materials and Methods
2.1. Study Design
2.2. Data Collection
2.3. Consumption Data of Peanut, Peanut Oil, Corn, and Corn Products
2.4. Estimation of Daily Intake of Aflatoxins
2.5. Risk Characterization
2.5.1. Margin of Exposure (MOE)
2.5.2. Risk Assessment of Hepatocellular Carcinoma
2.6. Estimation of Disability-Adjusted Life Years Attributed to Foodborne AFT Intake
2.7. Sensitivity Analysis
2.8. Statistical Analysis
3. Results
3.1. AFT Concentration in Peanuts, Peanut Oil, Corn, and Corn Products in China
3.2. Consumption Data of Peanuts, Peanut Oil, Corn, and Corn Products in China
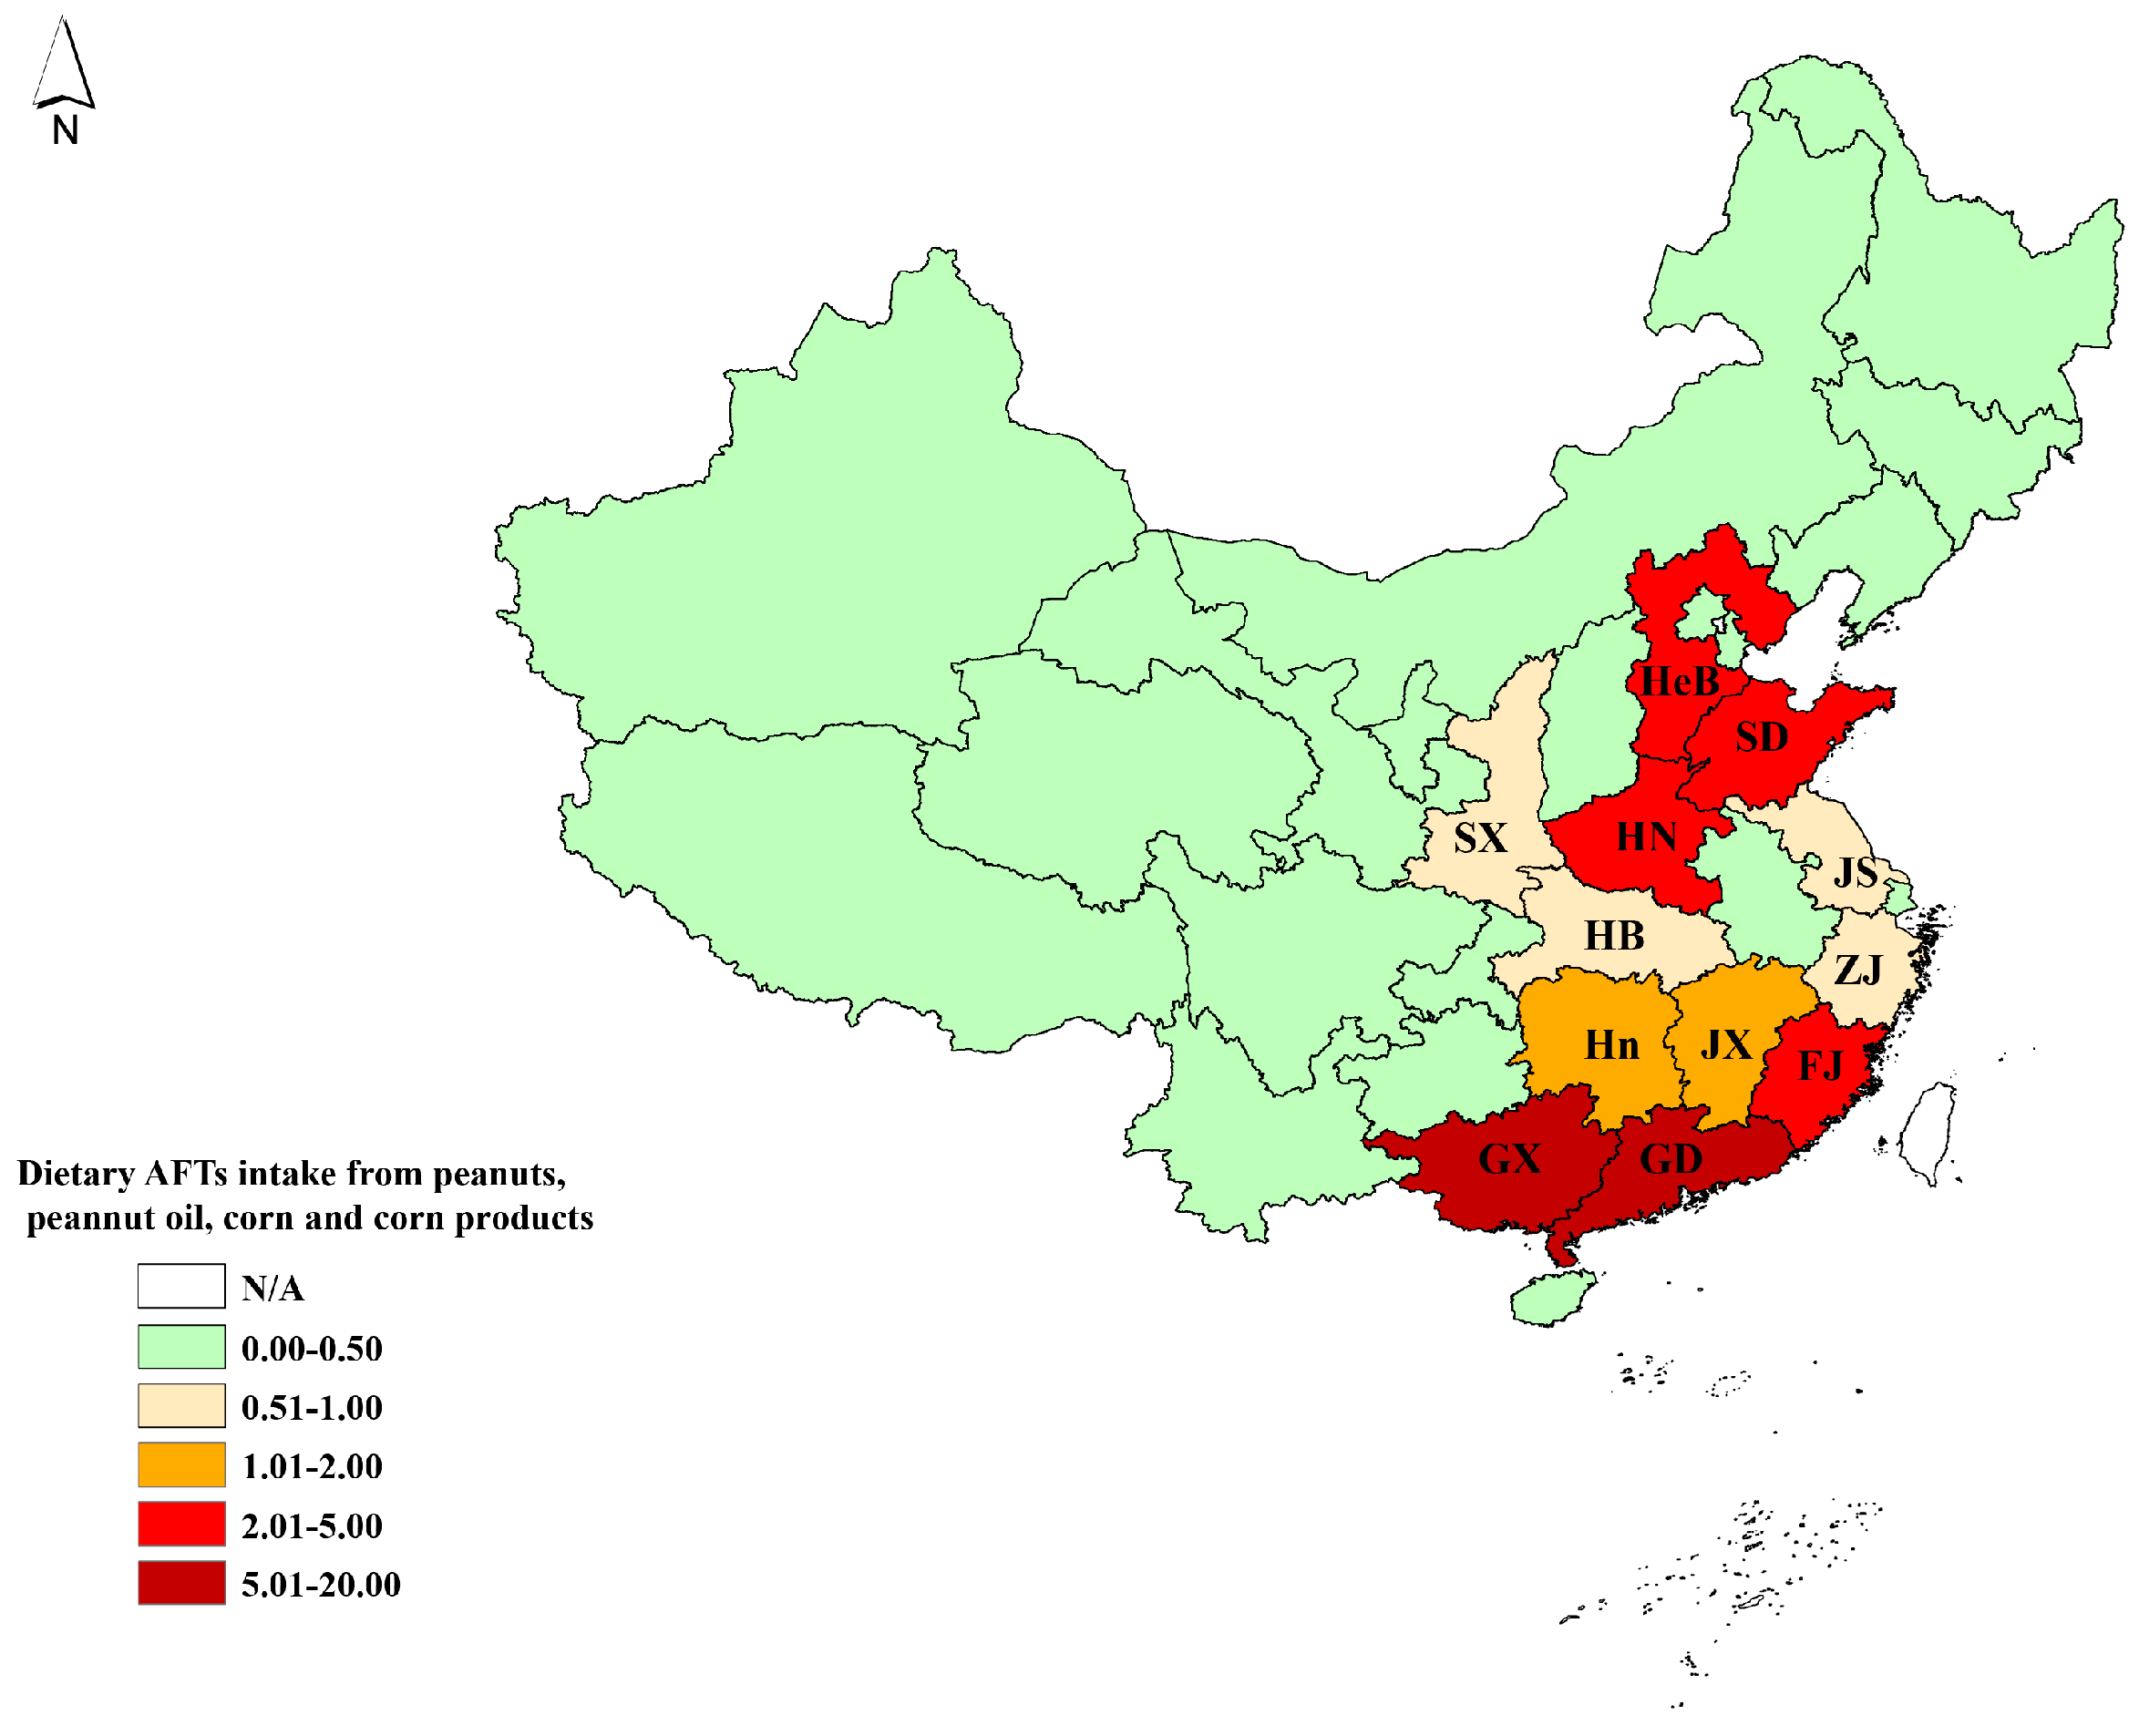
3.3. Estimated Daily Intake of AFTs from Peanuts, Peanut Oil, Corn, and Corn Products in China
3.4. Risk Characterization of Dietary Intake of AFTs
3.5. Estimated Disability-Adjusted Life Years Attributed to Dietary Exposure to AFTs in China
4. Discussion
5. Conclusions
Supplementary Materials
Author Contributions
Funding
Institutional Review Board Statement
Informed Consent Statement
Data Availability Statement
Conflicts of Interest
References
- Woloshuk, C.P.; Shim, W.B. Aflatoxins, fumonisins, and trichothecenes: A convergence of knowledge. FEMS Microbiol. Rev. 2013, 37, 94–109. [Google Scholar] [CrossRef] [PubMed] [Green Version]
- Ding, X.; Wu, L.; Li, P.; Zhang, Z.; Zhou, H.; Bai, Y.; Chen, X.; Jiang, J. Risk Assessment on Dietary Exposure to Aflatoxin B(1) in Post-Harvest Peanuts in the Yangtze River Ecological Region. Toxins 2015, 7, 4157–4174. [Google Scholar] [CrossRef]
- Baan, R.; Grosse, Y.; Straif, K.; Secretan, B.; El Ghissassi, F.; Bouvard, V.; Benbrahim-Tallaa, L.; Guha, N.; Freeman, C.; Galichet, L.; et al. A Review of Human Carcinogens-Part F: Chemical Agents and Related Occupations. Lancet Oncol. 2009, 12, 1143–1144. [Google Scholar] [CrossRef]
- Benkerroum, N. Chronic and Acute Toxicities of Aflatoxins: Mechanisms of Action. Int. J. Environ. Res. Public Health 2020, 17, 423. [Google Scholar] [CrossRef] [Green Version]
- Williams, J.H.; Phillips, T.D.; Jolly, P.E.; Stiles, J.K.; Jolly, C.M.; Aggarwal, D.T. Human aflatoxicosis in developing countries_ a review of toxicology, exposure, potential health consequences, and interventions. Am. J. Clin. Nutr. 2004, 80, 1106–1122. [Google Scholar] [CrossRef] [PubMed]
- Ismail, A.; Goncalves, B.L.; de Neeff, D.V.; Ponzilacqua, B.; Coppa, C.; Hintzsche, H.; Sajid, M.; Cruz, A.G.; Corassin, C.H.; Oliveira, C.A.F. Aflatoxin in foodstuffs: Occurrence and recent advances in decontamination. Food Res. Int. 2018, 113, 74–85. [Google Scholar] [CrossRef]
- Bhatnagar-Mathur, P.; Sunkara, S.; Bhatnagar-Panwar, M.; Waliyar, F.; Sharma, K.K. Biotechnological advances for combating Aspergillus flavus and aflatoxin contamination in crops. Plant Sci. 2015, 234, 119–132. [Google Scholar] [CrossRef] [Green Version]
- Fan, K.; Xu, J.; Jiang, K.; Liu, X.; Meng, J.; Di Mavungu, J.D.; Guo, W.; Zhang, Z.; Jing, J.; Li, H.; et al. Determination of multiple mycotoxins in paired plasma and urine samples to assess human exposure in Nanjing, China. Environ. Pollut. 2019, 248, 865–873. [Google Scholar] [CrossRef]
- European Commission. Commission Regulation: No. 1881/2006 setting maximum levels for certain contaminants in foodstuffs. Off. J. Eur. Union 2006, 364, 5–24. [Google Scholar]
- Determination of Aflatoxins Groups B and G in Foods: GB 5009.22-2016; China Standard Press: Beijing, China, 2016; pp. 17–18.
- Groopman, J.D.; Kensler, T.W.; Wild, C.P. Protective interventions to prevent aflatoxin-induced carcinogenesis in developing countries. Annu. Rev. Public Health 2008, 29, 187–203. [Google Scholar] [CrossRef] [Green Version]
- Caceres, I.; Snini, S.P.; Puel, O.; Mathieu, F. Streptomyces roseolus, A Promising Biocontrol Agent Against Aspergillus flavus, the Main Aflatoxin B(1) Producer. Toxins 2018, 10, 442. [Google Scholar] [CrossRef] [PubMed] [Green Version]
- Villers, P. Aflatoxins and safe storage. Front. Microbiol. 2014, 5, 158. [Google Scholar] [CrossRef] [PubMed] [Green Version]
- Qin, M.; Liang, J.; Yang, D.; Yang, X.; Cao, P.; Wang, X.; Ma, N.; Zhang, L. Spatial analysis of dietary exposure of aflatoxins in peanuts and peanut oil in different areas of China. Food Res. Int. 2021, 140, 109899. [Google Scholar] [CrossRef]
- Liu, Y.; Wu, F. Global burden of aflatoxin-induced hepatocellular carcinoma: A risk assessment. Environ. Health Perspect. 2010, 118, 818–824. [Google Scholar] [CrossRef] [PubMed] [Green Version]
- Shimakawa, Y.; Lemoine, M.; Njai, H.F.; Bottomley, C.; Ndow, G.; Goldin, R.D.; Jatta, A.; Jeng-Barry, A.; Wegmuller, R.; Moore, S.E.; et al. Natural history of chronic HBV infection in West Africa: A longitudinal population-based study from The Gambia. Gut 2016, 65, 2007–2016. [Google Scholar] [CrossRef]
- Liu, Y.; Chang, C.C.; Marsh, G.M.; Wu, F. Population attributable risk of aflatoxin-related liver cancer: Systematic review and meta-analysis. Eur. J. Cancer 2012, 48, 2125–2136. [Google Scholar] [CrossRef] [Green Version]
- KMcGlynn, A.; Petrick, J.L.; El-Serag, H.B. Epidemiology of Hepatocellular Carcinoma. Hepatology 2021, 73 (Suppl. S1), 4–13. [Google Scholar] [CrossRef]
- Ott, J.J.; Horn, J.; Krause, G.; Mikolajczyk, R.T. Time trends of chronic HBV infection over prior decades—A global analysis. J. Hepatol. 2017, 66, 48–54. [Google Scholar] [CrossRef]
- Devleesschauwer, B.; Havelaar, A.H.; de Noordhout, C.M.; Haagsma, J.A.; Praet, N.; Dorny, P.; Duchateau, L.; Torgerson, P.R.; van Oyen, H.; Speybroeck, N. DALY calculation in practice: A stepwise approach. Int. J. Public Health 2014, 59, 571–574. [Google Scholar] [CrossRef]
- Gao, T.; Wang, X.C.; Chen, R.; Ngo, H.H.; Guo, W. Disability adjusted life year (DALY): A useful tool for quantitative assessment of environmental pollution. Sci. Total Environ. 2015, 511, 268–287. [Google Scholar] [CrossRef]
- Gibb, H.; Devleesschauwer, B.; Bolger, P.M.; Wu, F.; Ezendam, J.; Cliff, J.; Zeilmaker, M.; Verger, P.; Pitt, J.; Baines, J.; et al. World Health Organization estimates of the global and regional disease burden of four foodborne chemical toxins, 2010: A data synthesis. F1000Research 2015, 4, 1393. [Google Scholar] [CrossRef]
- Jakobsen, L.S.; Granby, K.; Knudsen, V.K.; Nauta, M.; Pires, S.M.; Poulsen, M. Burden of disease of dietary exposure to acrylamide in Denmark. Food Chem. Toxicol. 2016, 90, 151–159. [Google Scholar] [CrossRef] [PubMed]
- Longde, W. Chinese Resident Nutrition and Health Survey Report; People’s Medical Publishing House: Beijing, China, 2005. [Google Scholar]
- Gong, W.; Liu, A.; Yao, Y.; Ma, Y.; Ding, C.; Song, C.; Yuan, F.; Zhang, Y.; Feng, G.; Chen, Z.; et al. Nutrient Supplement Use among the Chinese Population: A Cross-Sectional Study of the 2010(-)2012 China Nutrition and Health Surveillance. Nutrients 2018, 10, 1733. [Google Scholar] [CrossRef] [PubMed] [Green Version]
- Zhou, Y.J.; Wangyi, B.N.; Song, Y.; Yan, Y.Z.; Huang, J.; Zhang, L.; Wei, S. Study on the disease burden of cancer attributed to the dietary inorganic arsenic exposure in Chinese population in 2013. Zhonghua Yu Fang Yi Xue Za Zhi 2019, 53, 1247–1252. [Google Scholar] [PubMed]
- FAO/WHO. Seventy-First Report of the Joint FAO/WHO Expert Committee on Food Additives; World Health Organization Technical Report Series; WHO: Geneva, Switzerland, 2010. [Google Scholar]
- Alkadri, D.; Rubert, J.; Prodi, A.; Pisi, A.; Mañes, J.; Soler, C. Natural co-occurrence of mycotoxins in wheat grains from Italy and Syria. Food Chem. 2014, 157, 111–118. [Google Scholar] [CrossRef]
- EFSA. Opinion of the Scientific Committee on a request from EFSA related to A Harmonised Approach for Risk Assessment of Substances Which are both Genotoxic and Carcinogenic. EFSA J. 2005, 3, 231–282. [Google Scholar]
- Schrenk, D.; Bignami, M.; Bodin, L.; Chipman, J.K.; del Mazo, J.; Grasl-Kraupp, B.; Hogstrand, C.; Hoogenboom, L.; Leblanc, J.C.; Nebbia, C.S.; et al. Risk assessment of aflatoxins in food. EFSA J. 2020, 18, e06040. [Google Scholar]
- Martins, C.; Vidal, A.; de Boevre, M.; de Saeger, S.; Nunes, C.; Torres, D.; Goios, A.; Lopes, C.; Alvito, P.; Assuncao, R. Burden of disease associated with dietary exposure to carcinogenic aflatoxins in Portugal using human biomonitoring approach. Food Res. Int. 2020, 134, 109210. [Google Scholar] [CrossRef]
- Younossi, Z.M.; Blissett, D.; Blissett, R.; Henry, L.; Stepanova, M.; Younossi, Y.; Racila, A.; Hunt, S.; Beckerman, R. The economic and clinical burden of nonalcoholic fatty liver disease in the United States and Europe. Hepatology 2016, 64, 1577–1586. [Google Scholar] [CrossRef]
- Cui, F.Q.; Gong, X.H.; Chen, Y.; Wang, F.; Zheng, W.; Wu, Z.; Shun, X. Vaccination progress of hepatitis B vaccine and epidemiology changes of carrying rate of hepatitis B surface antigen by province in China, 1992–2006. Chin. J. Vaccines Immun. 2012, 18, 6–13. [Google Scholar]
- Ji, N.; Diao, E.; Li, X.; Zhang, Z.; Dong, H. Detoxification and safety evaluation of aflatoxin B1 in peanut oil using alkali refining. J. Sci. Food Agric. 2016, 96, 4009–4014. [Google Scholar] [CrossRef]
- Gao, X.; Yin, S.; Zhang, H.; Han, C.; Zhao, X.; Ji, R. Aflatoxin contamination of corn samples collected from six regions of China. Wei Sheng Yan Jiu 2011, 40, 46–49. [Google Scholar]
- Nugraha, A.; Khotimah, K.; Rietjens, I. Risk assessment of aflatoxin B1 exposure from maize and peanut consumption in Indonesia using the margin of exposure and liver cancer risk estimation approaches. Food Chem. Toxicol. 2018, 113, 134–144. [Google Scholar] [CrossRef] [PubMed]
- Ding, N.; Xing, F.; Liu, X.; Selvaraj, J.N.; Wang, L.; Zhao, Y.; Wang, Y.; Guo, W.; Dai, X.; Liu, Y. Variation in fungal microbiome (mycobiome) and aflatoxin in stored in-shell peanuts at four different areas of China. Front. Microbiol. 2015, 6, 1055. [Google Scholar] [CrossRef] [PubMed]
- Battilani, P.; Toscano, P.; van der Fels-Klerx, H.J.; Moretti, A.; Leggieri, M.C.; Brera, C.; Rortais, A.; Goumperis, T.; Robinson, T. Aflatoxin B1 contamination in maize in Europe increases due to climate change. Sci. Rep. 2016, 6, 24328. [Google Scholar] [CrossRef] [PubMed] [Green Version]
- Assuncao, R.; Martins, C.; Viegas, S.; Viegas, C.; Jakobsen, L.S.; Pires, S.; Alvito, P. Climate change and the health impact of aflatoxins exposure in Portugal—An overview. Food Addit. Contam. Part A 2018, 35, 1610–1621. [Google Scholar] [CrossRef] [PubMed] [Green Version]
- Qi, N.; Yu, H.; Yang, C.; Gong, X.; Liu, Y.; Zhu, Y. Aflatoxin B1 in peanut oil from Western Guangdong, China, during 2016–2017. Food Addit. Contam. Part B Surveill. 2019, 12, 45–51. [Google Scholar] [CrossRef] [PubMed]
- Yang, B.L.; Zhang, X.J.; Wang, G.; Zhang, C.X.; Gen, H.R.; Li, L.; Yang, L. Investigation of aflatoxin B1 and cyclopiazonic acid in bulk peanut oil in China. China Oils Fats 2010, 45, 34–37. [Google Scholar]
- Zhang, W.; Liu, Y.; Liang, B.; Zhang, Y.; Zhong, X.; Luo, X.; Huang, J.; Wang, Y.; Cheng, W.; Chen, K. Probabilistic risk assessment of dietary exposure to aflatoxin B1 in Guangzhou, China. Sci. Rep. 2020, 10, 7973. [Google Scholar] [CrossRef]
- Masiello, M.; Somma, S.; Haidukowski, M.; Logrieco, A.F.; Moretti, A. Genetic polymorphisms associated to SDHI fungicides resistance in selected Aspergillus flavus strains and relation with aflatoxin production. Int. J. Food Microbiol. 2020, 334, 108799. [Google Scholar] [CrossRef]
- Chen, J.G.; Egner, P.A.; Ng, D.; Jacobson, L.P.; Munoz, A.; Zhu, Y.R.; Qian, G.S.; Wu, F.; Yuan, J.M.; Groopman, J.D.; et al. Reduced aflatoxin exposure presages decline in liver cancer mortality in an endemic region of China. Cancer Prev. Res. 2013, 6, 1038–1045. [Google Scholar] [CrossRef] [PubMed] [Green Version]
- WHO. WHO Estimates of the Global Burden of Foodborne Diseases: Foodborne Disease Burden Epidemiology Reference Group 2007–2015; WHO Library: Geneva, Switzerland, 2015. [Google Scholar]
- Ma, J.; Shao, B.; Lin, X.; Yu, H.; Li, F. Study on the natural occurrence of multi-mycotoxin in cereal and cereal-based product samples collected from parts of China in 2010. Chin. J. Food Hyg. 2011, 23, 481–488. [Google Scholar]
- Zhang, X.; Ding, J.; Li, S.; Cheng, Y. Aflatoxin contamination in the marketed food in Wanzhou District, Chongqing City, 2013–2014. Pract. Prev. Med. 2016, 23, 426–428. [Google Scholar]
- Feng, L.; Yang, D.; Li, H.; Tian, Y.; Zhao, T.; Zhang, R. Survey on pollution of aflatoxin b1 in foodstuffs. Parasitoses Infec. Dis. 2014, 3, 117–119. [Google Scholar]
- Qiu, W.; Fu, W. Contamination of aflatoxins in peanuts and peanut products from Fujian. Chin. J. Health Lab. Technol. 2012, 22, 2446–2448. [Google Scholar]
- Liu, W.; Pan, W. Peanut aflatoxins contamination and evaluation on dietary exposure in Fujian province. Cereal Feed Ind. 2016, 11, 28–32. [Google Scholar]
- Li, K.; Chen, W.; Qiu, F.; Liang, Z.; Yang, M; Wang, Z. Dietary exposure assessment to aflatoxins in nine kinds of foodstuff by Mont Carlo non-parametric probability approach in Shenzhen City. Wei Sheng Yan Jiu = J. Hyg. Res. 2018, 47, 827–832. [Google Scholar]
- Pan, Z. Hazard Analysis and Detection Method Establishment of Aflatoxin B1 in Peanut Oil and Raw Materials. Master’s Thesis, South China Agricultural University, Guangzhou, China, 2016. [Google Scholar]
- Wang, Y.; Liu, Q.; Wu, X.; Huang, X.; Wang, F.; Li, X. Determination of anatoxin B1 in peanut by high performance liquid chromatOgraphy-tandem mass spectrometry. J. Food Saf. Qual. 2019, 10, 2059–2063. [Google Scholar]
- Cheng, G.; Wang, S.; Hu, D.; Pang, G.; Gao, L.; Zhan, Z. Field Investigation on Aflatoxin Contamination of Peanut in Main Peanut Production Districts in 2017. J. Peanut Sci. 2018, 47, 30–33. [Google Scholar]
- Li, S.; Yuan, P.; Fu, P.Y.; Yang, L.; Zhang, R.; Zhang. S. Investigation of Contamination Situation of Fungaltoxin in Some Food in Henan Province from 2014 to 2015. China Health Ind. 2017, 27, 144–147. [Google Scholar]
- Wang, Y.; Wang, J.; Lin, Q.; Li, G.; Guo, C.; Wu, X.; Li, H.; Ren, Z.; Chen, F. Investigation and Analysis of Aflatoxin in Peanut in Liaoning Area. Liaoning Agric. Sci. 2020, 2, 77–79. [Google Scholar]
- Hu, J.; Tian, L.; Wang, C.; Qiao, H.; Wang, M. Analysis on contamination of aflatoxins in food samples in Shaanxi Province from 2012–2015. J. Hyg. Res. 2016, 45, 762–765. [Google Scholar]
- Zhang, X.; Yue, X.; Ding, X.; Li, P.; Yu, Q.; Xie, H.; Zhang, Q.; Zhang, Z.; Zhang, W. Distribution and aflatoxin contamination by Aspergillus flavus in peanut from the southwest China. Chin. J. Oil Crop Sci. 2019, 41, 773–780. [Google Scholar]
- Wu, X.; Zhao, K.; Lin, X. Pollution condition of mycotoxin in grain and oil in Tianjin area. Occup. Health 2019, 35, 2996–2998. [Google Scholar]
- Song, M.; Le, L.; Luo, Y.; Xie, C.; Chen, Z. Dietary exposure and risk assessment of aflatoxin B1 in peanut oil produced by individual workshop in Guangdong. China Oils Fats 2019, 44, 96–101. [Google Scholar]
- Li, K.; Qiu, F.; Jiang, L.; Yang, M. Dietary exposure assessment of aflatoxin of foodstuff and edible oil from Shenzhen residents. J. Hyg. Res. 2014, 43, 630–636. [Google Scholar] [PubMed]
- Yin, G.; Liu, S.; Liao, L. Analysis on Aflatoxin B1 Contamination in Vegetable Oils. J. Prev. Med. Inf. 2017, 33, 593–596. [Google Scholar]
- Chen, X.; Cai, C.; Chen, Y.; He, B.; Guo, Y.; He, L.; Lu, L.; Wen, Y. Dietary exposure risk assessment of aflatoxin B1 in edible vegetable oil of residents based on margin of exposure and digital method. J. Food Saf. Qual. 2017, 33, 593–596. [Google Scholar]
- Huang, S.; Luo, H.; Zeng, X.; Xiang, J.; Zhong, X.; Liu, Q. Risk assessment of aflatoxin B1 exposure in peanut oil from small workshop in Qingyuan city. Anal. Detect. 2019, 21, 66–67. [Google Scholar]
- Cheng, H.; Zhong, X.; Chen, J.; Meng, H.; Liao, Y.; Chen, H.; Jiang, Y.; Xie, Y.; Su, Y.; Liu, Z. Exposure risk assessment of aflatoxin B1 in edible vegetable oil by using the margin of exposure in Guangxi. Chin. J. Food Hyg. 2017, 29, 496–499. [Google Scholar]
- Liang, X.; Chen, F.; Li, Q.; Zhang, X.; Mo, L. Dietary exposure and risk assessment of aflatoxin B1 in the peanut oil of small workshops in Yulin City. China Oils Fats 2022, 47, 131–136. [Google Scholar]
- Wang, C.; Fan, Y.; Long, X.; Zhang, J.; Huang, S.; Lv, Z.; Shi, X.; Wei, Y. Exposure risk assessment of aflatoxin B1 in some foods in Nanning. Mod. Prev. Med. 2020, 47, 252–255. [Google Scholar]
- Liu, Z.; Tang, Z.; Zhong, Y.; Cheng, H.; Meng, H.; Jiang, Y.; Chen, H.; Xie, Y.; Su, Y.; Yao, X. Investigation of aflatoxin B1 level in edible vegetable oil in the urban and rural areas of Guangxi in 2014. J. Appl. Prev. Med. 2015, 21, 377–380. [Google Scholar]
- Li, S.; Yang, L.; Yuan, P.; Fu, P.; Zhou, S.; Chao, F.; Zhang, S.; Zhang, D. Assessment of aflatoxin B1 dietary exposure among Henan residents. Mod. Prev. Med. 2016, 43, 1008–1010. [Google Scholar]
- Li, Y.; Ma, Y. Analysis of mycotoxin pollution in some foods in Xianyang city in 2014. Chin. J. Health. Lab. Technol. 2016, 26, 570–572. [Google Scholar]
- Lan, S.; Liu, H.; Mei, W.; Yang, F. Determination of aflatoxin B1 in edible vegetable oil by enzymelinked immunosorbent assay. J. Cereals Oils 2010, 4, 39–41. [Google Scholar]
- Zhou, Z.; Xing, J.; Ying, L.; Zhou, X.; Zhang, S.; Li, X.; Shen, J. Investigation and analysis of aflatoxin B1 in edible vegetable oil. China Oils Fats 2017, 42, 66–69. [Google Scholar]
- Chen, J. Investigation and analysis on mycotoxin pollution of maize in Baise city from 2017 to 2019. J. Food Saf. Qual. 2020, 11, 4029–4033. [Google Scholar]
- Ji, H.; Li, Y.; Wen, Z.; Liu, Y.; Li, X.; Li, H. Aflatoxin B1 contamination detection and safety evaluation for corn at storage in Hubei procince. Cereal Feed Ind. 2017, 3, 19–21. [Google Scholar]
- Wu, R.; Li, F.; Zhang, K. Aflatoxin B1 Contamination Detection and Safety Evaluation for Corn in Nanyang. J. Anhui Agric. Sci. 2014, 42, 10306–10336. [Google Scholar]
- Yang, X.; Liu, S.; Cao, X.; Liu, Z.; Jiao, H. Monitoring results of mycotoxin in 90 fresh corns in Shandong in 2016. Occup. Health 2018, 34, 188–191. [Google Scholar]
- Wang, Y.; Dong, Y.; Yue, H.; Li, Z.; Chen, Y.; Wang, Y.; Deng, L.; Zhao, S. Investigatin and analysis on mycotoxins contamination of maize in Shandong province. Oils Foods 2016, 24, 69–73. [Google Scholar]
- Zhang, H.; Li, F.; Lv, S.; Tang, S.; Yu, J. Investigation report on mycotoxin contamination of 2016 autumn harvest corn in Zouping County. Anim. Health China 2017, 19, 1–3. [Google Scholar]
- Li, J.; Wang, S.; Wu, J.; Shen, L.; Yao, X. Investigation of mycotoxins in grain and its products in Henan Province. Chin. J. Food Hyg. 2020, 32, 418–421. [Google Scholar]
- Cai, M.; Ji, W.; Liu, L.; Ma, Y. Monitoring on total aflatoxins in commercial peanuts and corn in Jiangsu area. Chin. J. Health Lab. Technol. 2013, 23, 2504–2505. [Google Scholar]
- Zhao, J.; Huang, J.; Huang, W. Analysis on the chemical pollutants and harmful factors in Taizhou in 2013. Chin. J. Health Lab. Technol. 2015, 25, 1262–1265. [Google Scholar]
- Hu, J.; Qiao, H.; Tian, L.; Wang, M.; Wang, C.; Guo, R. Mycotoxin contamination of cereals and their products in Shaanxi Province from 2013 to 2016. J. Hyg. Res. 2017, 46, 1013–1015. [Google Scholar]
- Hu, J.; Tian, L.; Wang, M.; Wang, C.; Guo, R.; Qiao, H. Mycotoxins contamination in 120 corn products on sale, Shaanxi. Mod. Prev. Med. 2017, 44, 1593–1596. [Google Scholar]
- Jiang, D.; Li, F.; Zheng, F.; Zhou, J.; Li, L.; Shen, F.; Chen, J.; Li, W. Occurrence and dietary exposure assessment of multiple mycotoxins in corn-based food products from Shandong, China. Food Addit. Contam. Part B Surveill. 2019, 12, 10–17. [Google Scholar] [CrossRef]
- Wang, D.; Ma, S. Analysis of Aflatoxin contamination in some food in Weifang. Urban Rural Enterp. Health China 2015, 30, 71–73. [Google Scholar]
- Gong, C.; Dong, F.; Wang, C. Investigation and Analysis of Mycotoxins Contamination in Cereal and Its Products Sold in Yantai Market. Food Res. Dev. 2018, 39, 189–194. [Google Scholar]
- Yang, X.; Jiao, H.; Liu, S.; Cao, X. Aflatoxin contamination investigation of vegetable oil and corn flour samples in Jinan 2011–2013. Chin. J. PHM 2016, 32, 681–683. [Google Scholar]
- Hu, W.; Dong, H.; Ning, X.; Lin, J.; Liu, Z. Risk assessment of dietary exposure to aflatoxin B1 in parts foods in Yunnan province. J. Food Saf. Qual. 2020, 11, 5215–5219. [Google Scholar]

| Province | Peanut | Peanut Oil | Corn | Corn Products | ||||||||
|---|---|---|---|---|---|---|---|---|---|---|---|---|
| N | Positive N (%) | Means * (μg/kg) | N | Positive N (%) | Means * (μg/kg) | N | Positive N (%) | Means * (μg/kg) | N | Positive N (%) | Means * (μg/kg) | |
| Total | 5092 | 1353 (26.57) | 8.07 | 7290 | 3583 (49.15) | 14.47 | 1746 | 508 (29.10) | 25.76 | 2476 | 356 (14.38) | 1.19 |
| North | ||||||||||||
| Beijing | 15 | 3 (20.00) | 0.71 | |||||||||
| Hebei | 40 | 18 (45.00) | 21.42 | 82 | 35 (42.68) | 7.08 | 92 | 78 (84.78) | 8.96 | |||
| Neimongol | 15 | 0 (0.00) | 0.34 | |||||||||
| Shanxi | 16 | 0 (0.00) | 4.00 | 13 | 8 (61.54) | 1.83 | ||||||
| Tianjin | 219 | 46 (21.00) | 7.47 | 200 | 67 (33.50) | 8.98 | ||||||
| Northeast | ||||||||||||
| Heilongjiang | 10 | 2 (20.00) | 0.41 | 18 | 10 (55.56) | 0.57 | ||||||
| Jilin | 25 | 3 (12.00) | 1.28 | 13 | 0 (0.00) | 0.5 | ||||||
| Liaoning | 130 | 13 (10.00) | 0.34 | 50 | 2 (4.00) | 1.68 | ||||||
| East | ||||||||||||
| Anhui | 706 | 232 (32.86) | 9.25 | 30 | 15 (50.00) | 1.06 | ||||||
| Fujian | 284 | 31 (10.92) | 14.02 | 166 | 105 (63.25) | 27.42 | 16 | 6 (37.50) | 0.57 | |||
| Jiangsu | 421 | 124 (29.45) | 3.33 | 33 | 8 (24.24) | 1.31 | 106 | 49 (46.23) | 8.06 | |||
| Jiangxi | 482 | 168 (34.85) | 10.81 | 38 | 12 (31.58) | 10.29 | 11 | 5 (45.45) | 0.43 | |||
| Shandong | 201 | 18 (8.96) | 1.95 | 326 | 103 (31.60) | 6.78 | 689 | 159 (23.08) | 6.17 | 371 | 125 (33.69) | 1.44 |
| Shanghai | 97 | 23 (23.71) | 12.09 | 19 | 7 (36.84) | 1.26 | ||||||
| Zhejiang | 50 | 9 (18.00) | 9.90 | 363 | 31 (8.54) | 0.26 | 125 | 1 (0.80) | 0.07 | |||
| Central | ||||||||||||
| Henan | 107 | 44 (41.12) | 5.89 | 270 | 43 (15.93) | 1.99 | 40 | 32 (80.00) | 50.32 | 659 | 61 (9.26) | 0.81 |
| Hubei | 424 | 171 (40.33) | 6.55 | 67 | 2 (2.99) | 1.60 | 20 | 12 (60.00) | 3.4 | |||
| Hunan | 468 | 160 (34.19) | 13.49 | 10 | 7 (70.00) | 22.1 | ||||||
| South | ||||||||||||
| Guangdong | 302 | 85 (28.15) | 11.73 | 4797 | 2623 (54.68) | 14.42 | 548 | 48 (8.76) | 0.26 | |||
| Guangxi | 56 | 26 (46.43) | 7.78 | 844 | 492 (58.29) | 31.92 | 230 | 39 (16.96) | 148.57 | 58 | 30 (51.72) | 3.03 |
| Hainan | 46 | 5 (10.87) | 0.47 | 3 | 2 (66.67) | 6.15 | ||||||
| Southwest | ||||||||||||
| Chongqing | 136 | 55 (40.44) | 0.97 | 73 | 28 (38.36) | 0.63 | 16 | 16 (100.00) | 6.44 | 63 | 24 (38.10) | 0.95 |
| Guizhou | 23 | 1 (4.35) | 0.21 | 17 | 11 (64.71) | 1.02 | ||||||
| Sichuan | 535 | 77 (14.39) | 5.75 | |||||||||
| Xizang | 23 | 0 (0.00) | 0.05 | |||||||||
| Yunnan | 70 | 11 (15.71) | 0.56 | 28 | 6 (21.43) | 3.44 | 14 | 11 (78.57) | 65.74 | 292 | >6 (>2.05) | 1.83 |
| Northwest | ||||||||||||
| Gansu | 63 | 6 (9.52) | 0.59 | 17 | 3 (17.65) | 0.58 | ||||||
| Ningxia | 10 | 5 (50.00) | 0.89 | |||||||||
| Qinghai | 14 | 0 (0.00) | 1.20 | |||||||||
| Shaanxi | 64 | 17 (26.56) | 34.5 | 123 | 82 (66.67) | 1.14 | 308 | 31 (10.06) | 1.54 | 254 | 18 (7.09) | 0.37 |
| Xinjiang | 40 | 0 (0.00) | 0.11 | |||||||||
| Province | Consumption Levels of Peanuts (g/Day) | Consumption Levels of Peanut Oil (g/Day) | Consumption Levels of Corn (g/Day) | Consumption Levels of Corn Products (g/Day) |
|---|---|---|---|---|
| Total | 2.19 | 5.49 | 4.98 | 4.17 |
| North | ||||
| Beijing | 3.00 | 26.10 | 9.56 | 10.17 |
| Hebei | 3.24 | 15.05 | 2.41 | 14.36 |
| Neimongol | 0.88 | 0.70 | 9.25 | 1.42 |
| Shanxi | 1.00 | 0.81 | ||
| Tianjin | 4.24 | 7.34 | ||
| Northeast | ||||
| Heilongjiang | 1.47 | 7.11 | 2.45 | |
| Jilin | 1.73 | 20.96 | 1.53 | |
| Liaoning | 5.34 | 0.26 | 5.95 | 6.06 |
| East | ||||
| Anhui | 1.56 | 0.02 | ||
| Fujian | 3.43 | 7.25 | ||
| Jiangsu | 4.27 | 0.02 | 1.69 | 4.80 |
| Jiangxi | 1.90 | 4.35 | 1.35 | 0.01 |
| Shandong | 4.67 | 37.81 | ||
| Shanghai | 2.51 | 0.46 | ||
| Zhejiang | 3.78 | 0.18 | 6.19 | 0.17 |
| Central | ||||
| Henan | 2.22 | 7.04 | 2.93 | 7.51 |
| Hubei | 3.02 | 5.28 | 1.82 | 2.25 |
| Hunan | 1.99 | 0.39 | 2.71 | 0.10 |
| South | ||||
| Guangdong | 2.55 | 19.43 | ||
| Guangxi | 3.00 | 0.69 | 6.62 | 1.23 |
| Hainan | 1.83 | 10.24 | ||
| Southwest | ||||
| Chongqing | 1.25 | 0.05 | ||
| Guizhou | 0.68 | 0.63 | 0.42 | 0.39 |
| Sichuan | 1.38 | 0.22 | 1.35 | 0.52 |
| Xizang | 0.23 | 0.59 | ||
| Yunnan | 3.50 | 0.50 | ||
| Northwest | ||||
| Gansu | 0.42 | 5.43 | 3.14 | |
| Ningxia | 0.49 | 2.43 | 3.40 | 0.02 |
| Qinghai | 0.36 | |||
| Shaanxi | 1.00 | 0.30 | 0.42 | 18.87 |
| Xinjiang | 0.94 | 0.09 |
| Province | AFT Exposure from Peanuts (95% UI) | AFT Exposure from Peanut Oil (95% UI) | AFT Exposure from Corn (95% UI) | AFT Exposure from Corn Products (95% UI) | AFT Exposure from Peanut, Peanut Oil, Corn, and Corn Products (95% UI) |
|---|---|---|---|---|---|
| Total | 0.308 (0.008, 1.138) | 1.385 (0.035, 5.113) | 2.238 (0.057, 8.333) | 0.086 (0.002, 0.322) | 4.018 (0.721, 10.955) |
| North | |||||
| Beijing | 0.033 (0.001, 0.032) | 0.033 (0.001, 0.032) | |||
| Hebei | 1.102 (0.027, 2.993) | 1.691 (0.043, 6.239) | 0.343 (0.009, 1.251) | 3.136 (0.548, 7.861) | |
| Neimongol | 0.005 (0.000, 0.012) | 0.005 (0.000, 0.012) | |||
| Shanxi | 0.076 (0.001, 0.073) | 0.076 (0.001, 0.073) | |||
| Tianjin | 0.499 (0.013, 1.842) | 0.499 (0.013, 1.842) | |||
| Northeast | |||||
| Heilongjiang | 0.010 (0.000, 0.035) | 0.065 (0.001, 0.111) | 0.075 (0.006, 0.123) | ||
| Jilin | 0.035 (0.001, 0.050) | 0.000 (0.000, 0.000) | 0.035 (0.001, 0.050) | ||
| Liaoning | 0.029 (0.001, 0.106) | 0.007 (0.000, 0.016) | 0.036 (0.003, 0.113) | ||
| East | |||||
| Anhui | 0.27 (0.005, 0.399) | 0.270 (0.005, 0.399) | |||
| Fujian | 0.951 (0.024, 3.51) | 3.932 (0.100, 14.502) | 4.883 (0.496, 15.664) | ||
| Jiangsu | 0.230 (0.006, 0.847) | 0.000 (0.000, 0.001) | 0.625 (0.016, 2.305) | 0.855 (0.094, 2.606) | |
| Jiangxi | 0.367 (0.009, 1.355) | 0.801 (0.019, 2.195) | 0.010 (0.000, 0.019) | 1.178 (0.135, 2.688) | |
| Shandong | 0.166 (0.004, 0.595) | 4.673 (0.119, 17.239) | 4.839 (0.250, 17.307) | ||
| Shanghai | 0.477 (0.012, 1.761) | 0.477 (0.012, 1.761) | |||
| Zhejiang | 0.633 (0.016, 2.336) | 0.001 (0.000, 0.003) | 0.634 (0.017, 2.337) | ||
| Central | |||||
| Henan | 0.211 (0.005, 0.515) | 0.227 (0.006, 0.835) | 2.383 (0.060, 8.486) | 0.098 (0.002, 0.363) | 2.919 (0.394, 8.968) |
| Hubei | 0.337 (0.0085, 1.243) | 0.144 (0.003, 0.171) | 0.105 (0.003, 0.260) | 0.586 (0.094, 1.399) | |
| Hunan | 0.487 (0.012, 1.796) | 1.086 (0.026, 2.875) | 1.572 (0.179, 3.543) | ||
| South | |||||
| Guangdong | 0.561 (0.014, 2.068) | 5.251 (0.133, 19.371) | 5.812 (0.450, 19.904) | ||
| Guangxi | 0.438 (0.011, 1.615) | 0.413 (0.010, 1.524) | 18.447 (0.468, 68.055) | 0.070 (0.002, 0.258) | 19.368 (1.275, 69.105) |
| Hainan | 0.016 (0.000, 0.058) | 0.016 (0.000, 0.058) | |||
| Southwest | |||||
| Chongqing | 0.024 (0.001, 0.089) | 0.001 (0.000, 0.001) | 0.025 (0.001, 0.089) | ||
| Guizhou | 0.003 (0.000, 0.007) | 0.012 (0.000, 0.034) | 0.015 (0.001, 0.036) | ||
| Sichuan | 0.138 (0.003, 0.431) | 0.138 (0.003, 0.431) | |||
| Xizang | 0.000 (0.000, 0.000) | 0.000 (0.000, 0.000) 0.000 (0.000, 0.000) | |||
| Yunnan | 0.038 (0.001, 0.111) | 0.033 (0.001, 0.084) | 0.071 (0.008, 0.148) | ||
| Northwest | |||||
| Gansu | 0.004 (0.000, 0.015) | 0.055 (0.001, 0.094) | 0.06 (0.003, 0.099) | ||
| Ningxia | 0.008 (0.000, 0.026) | 0.008 (0.000, 0.026) | |||
| Qinghai | 0.008 (0.000, 0.023) | 0.008 (0.000, 0.023) | |||
| Shaanxi | 0.579 (0.015, 2.133) | 0.006 (0.000, 0.017) | 0.011 (0.000, 0.04) | 0.117 (0.003, 0.432) | 0.713 (0.082, 2.304) |
| Xinjiang | 0.002 (0.000, 0.002) | 0.002 (0.000, 0.002) |
| Province | Estimated Annual HCC/100,000 (HBV+) | Estimated Annual HCC/100,000 (HBV−) | HCC Risk of AFT Exposure *, 95% UI | HCC Incidence # | PAF% ^, 95% UI | MOE |
|---|---|---|---|---|---|---|
| Total | 0.022 | 0.009 | 0.125 (0.022, 0.338) | 18.07 | 0.69 (0.12, 1.87) | 99.6 |
| North | ||||||
| Beijing | 0.014 | 0.010 | 0.001 (0.000, 0.001) | 15.98 | 0.00 (0.00, 0.00) | 12,121.2 |
| Hebei | 0.013 | 0.010 | 0.072 (0.013, 0.181) | 15.98 | 0.45 (0.08, 1.13) | 127.6 |
| Neimongol | 0.019 | 0.009 | 0.000 (0.000, 0.000) | 21.41 | 0.00 (0.00, 0.00) | 80,000.0 |
| Shanxi | 0.019 | 0.009 | 0.002 (0.000, 0.002) | 19.12 | 0.01 (0.00, 0.01) | 5263.2 |
| Tianjin | 0.017 | 0.009 | 0.013 (0.000, 0.049) | 15.98 | 0.08 (0.00, 0.31) | 801.6 |
| Northeast | ||||||
| Heilongjiang | 0.032 | 0.009 | 0.003 (0.000, 0.005) | 19.12 | 0.02 (0.00, 0.03) | 5333.3 |
| Jilin | 0.026 | 0.009 | 0.001 (0.000, 0.002) | 19.12 | 0.01 (0.00, 0.01) | 11,428.6 |
| Liaoning | 0.039 | 0.009 | 0.002 (0.000, 0.005) | 15.98 | 0.01 (0.00, 0.03) | 11,111.1 |
| East | ||||||
| Anhui | 0.023 | 0.009 | 0.009 (0.000, 0.013) | 19.12 | 0.05 (0.00, 0.07) | 1481.5 |
| Fujian | 0.051 | 0.008 | 0.291 (0.030, 0.933) | 15.98 | 1.82 (0.18, 5.84) | 81.9 |
| Jiangsu | 0.020 | 0.009 | 0.025 (0.003, 0.076) | 15.98 | 0.16 (0.02, 0.47) | 467.8 |
| Jiangxi | 0.046 | 0.008 | 0.065 (0.007, 0.148) | 19.12 | 0.34 (0.04, 0.77) | 339.6 |
| Shandong | 0.022 | 0.009 | 0.154 (0.008, 0.549) | 15.98 | 0.96 (0.05, 3.44) | 82.7 |
| Shanghai | 0.022 | 0.009 | 0.015 (0.000, 0.055) | 15.98 | 0.09 (0.00, 0.35) | 838.6 |
| Zhejiang | 0.033 | 0.009 | 0.026 (0.001, 0.097) | 15.98 | 0.16 (0.00, 0.61) | 630.9 |
| Central | ||||||
| Henan | 0.036 | 0.009 | 0.130 (0.018, 0.399) | 19.12 | 0.68 (0.09, 2.09) | 137.0 |
| Hubei | 0.033 | 0.009 | 0.025 (0.004, 0.059) | 19.12 | 0.13 (0.02, 0.31) | 682.6 |
| Hunan | 0.023 | 0.009 | 0.051 (0.006, 0.114) | 19.12 | 0.27 (0.03, 0.60) | 254.5 |
| South | ||||||
| Guangdong | 0.054 | 0.008 | 0.359 (0.028, 1.230) | 15.98 | 2.25 (0.17, 7.69) | 68.8 |
| Guangxi | 0.041 | 0.009 | 0.959 (0.063, 3.423) | 21.41 | 4.48 (0.30, 15.99) | 20.7 |
| Hainan | 0.053 | 0.008 | 0.001 (0.000, 0.004) | 15.98 | 0.01 (0.00, 0.02) | 25,000.0 |
| Southwest | ||||||
| Chongqing | 0.034 | 0.009 | 0.001 (0.000, 0.004) | 21.41 | 0.00 (0.00, 0.02) | 16,000.0 |
| Guizhou | 0.017 | 0.009 | 0.000 (0.000, 0.001) | 21.41 | 0.00 (0.00, 0.00) | 26,666.7 |
| Sichuan | 0.031 | 0.009 | 0.006 (0.000, 0.017) | 21.41 | 0.03 (0.00, 0.08) | 2898.6 |
| Xizang | 0.052 | 0.008 | 0.000 (0.000, 0.000) | 21.41 | 0.00 (0.00, 0.00) | N/A |
| Yunnan | 0.020 | 0.009 | 0.002 (0.000, 0.004) | 21.41 | 0.01 (0.00, 0.02) | 5633.8 |
| Northwest | ||||||
| Gansu | 0.024 | 0.009 | 0.002 (0.000, 0.003) | 21.41 | 0.01 (0.00, 0.02) | 6666.7 |
| Ningxia | 0.037 | 0.009 | 0.000 (0.000, 0.001) | 21.41 | 0.00 (0.00, 0.01) | 50,000.0 |
| Qinghai | 0.025 | 0.009 | 0.000 (0.000, 0.001) | 21.41 | 0.00 (0.00, 0.00) | 50,000.0 |
| Shaanxi | 0.027 | 0.009 | 0.026 (0.003, 0.084) | 21.41 | 0.12 (0.01, 0.39) | 561.0 |
| Xinjiang | 0.021 | 0.009 | 0.000 (0.000, 0.000) | 21.41 | 0.00 (0.00, 0.00) | 200,000.0 |
| Province | Population (Million) | Annual HCC Cases (HBV+), 95% UI | Annual HCC Cases (HBV−), 95% UI | DALY Number, 95% UI | DALY Rate (per 100,000), 95% UI |
|---|---|---|---|---|---|
| Total | 1,411,778,724 | 1221.72 (219.11, 3331.44) | 526.46 (94.42, 1435.58) | 21,625.08 (3878.31, 58,968.04) | 1.53 (0.27, 4.18) |
| North | |||||
| Beijing | 21,893,095 | 0.10 (0.00, 0.10) | 0.07 (0.00, 0.07) | 2.10 (0.03, 2.06) | 0.01 (0.00, 0.01) |
| Hebei | 74,610,235 | 31.52 (5.50, 79.01) | 22.35 (3.90, 56.02) | 666.27 (116.29, 1670.19) | 0.89 (0.16, 2.24) |
| Neimongol | 24,049,155 | 0.02 (0.00, 0.06) | 0.01 (0.00, 0.03) | 0.41 (0.01, 1.06) | 0.00 (0.00, 0.00) |
| Shanxi | 34,915,616 | 0.51 (0.01, 0.49) | 0.25 (0.00, 0.24) | 9.41 (0.15, 9.02) | 0.03 (0.00, 0.03) |
| Tianjin | 13,866,009 | 1.18 (0.03, 4.35) | 0.65 (0.02, 2.41) | 22.66 (0.58, 83.62) | 0.16 (0.00, 0.60) |
| Northeast | |||||
| Heilongjiang | 31,850,088 | 0.76 (0.06, 1.25) | 0.21 (0.02, 0.35) | 12.01 (0.94, 19.75) | 0.04 (0.00, 0.06) |
| Jilin | 24,073,453 | 0.22 (0.00, 0.31) | 0.08 (0.00, 0.11) | 3.64 (0.07, 5.19) | 0.02 (0.00, 0.02) |
| Liaoning | 42,591,407 | 0.59 (0.06, 1.87) | 0.13 (0.01, 0.42) | 9.00 (0.83, 28.34) | 0.02 (0.00, 0.07) |
| East | |||||
| Anhui | 61,027,171 | 3.83 (0.08, 5.66) | 1.52 (0.03, 2.25) | 66.24 (1.32, 97.78) | 0.11 (0.00, 0.16) |
| Fujian | 41,540,086 | 103.99 (10.56, 333.59) | 16.82 (1.71, 53.95) | 1494.44 (151.8, 4793.78) | 3.60 (0.37, 11.54) |
| Jiangsu | 84,748,016 | 14.32 (1.58, 43.66) | 6.76 (0.75, 20.63) | 260.78 (28.79, 795.19) | 0.31 (0.03, 0.94) |
| Jiangxi | 45,188,635 | 24.73 (2.81, 56.41) | 4.50 (0.51, 10.27) | 361.54 (41.15, 824.73) | 0.80 (0.09, 1.83) |
| Shandong | 101,527,453 | 110.40 (5.705, 394.83) | 45.45 (2.35, 162.56) | 1927.92 (99.61, 6894.8) | 1.90 (0.10, 6.79) |
| Shanghai | 24,870,895 | 2.63 (0.07, 9.72) | 1.10 (0.03, 4.06) | 46.15 (1.17, 170.31) | 0.19 (0.00, 0.69) |
| Zhejiang | 64,567,588 | 13.37 (0.355, 49.25) | 3.65 (0.10, 13.45) | 210.48 (5.61, 775.52) | 0.33 (0.01, 1.20) |
| Central | |||||
| Henan | 99,365,519 | 103.56 (13.97, 318.1) | 25.56 (3.45, 78.5) | 1597.17 (215.46, 4905.94) | 1.61 (0.22, 4.94) |
| Hubei | 57,752,557 | 11.25 (1.81, 26.82) | 3.01 (0.48, 7.19) | 176.4 (28.31, 420.64) | 0.31 (0.05, 0.73) |
| Hunan | 66,444,864 | 24.04 (2.74, 54.17) | 9.65 (1.10, 21.74) | 416.67 (47.48, 938.8) | 0.63 (0.07, 1.41) |
| South | |||||
| Guangdong | 126,012,510 | 392.17 (30.34, 1343.11) | 60.16 (4.66, 206.05) | 5595.31 (432.94, 19,162.95) | 4.44 (0.34, 15.21) |
| Guangxi | 50,126,804 | 396.99 (26.15, 1416.44) | 83.85 (5.52, 299.19) | 5948.01 (391.73, 21,222.35) | 11.87 (0.78, 42.34) |
| Hainan | 10,081,232 | 0.08 (0.00, 0.31) | 0.01 (0.00, 0.05) | 1.21 (0.03, 4.45) | 0.01 (0.00, 0.04) |
| Southwest | |||||
| Chongqing | 32,054,159 | 0.27 (0.01, 0.96) | 0.07 (0.00, 0.25) | 4.15 (0.17, 15.01) | 0.01 (0.00, 0.05) |
| Guizhou | 38,562,148 | 0.10 (0.01, 0.24) | 0.05 (0.00, 0.13) | 1.86 (0.16, 4.54) | 0.00 (0.00, 0.01) |
| Sichuan | 83,674,866 | 3.63 (0.09, 11.34) | 1.03 (0.03, 3.23) | 57.67 (1.44, 180.11) | 0.07 (0.00, 0.22) |
| Xizang | 3,648,100 | 0.00 (0.00, 0.00) | 0.00 (0.00, 0.00) | 0.00 (0.00, 0.00) | |
| Yunnan | 47,209,277 | 0.68 (0.07, 1.42) | 0.31 (0.03, 0.65) | 12.24 (1.32, 25.59) | 0.03 (0.00, 0.05) |
| Northwest | |||||
| Gansu | 25,019,831 | 0.35 (0.02, 0.59) | 0.14 (0.01, 0.23) | 6.08 (0.35, 10.07) | 0.02 (0.00, 0.04) |
| Ningxia | 7,202,654 | 0.02 (0.00, 0.07) | 0.00 (0.00, 0.02) | 0.31 (0.01, 1.07) | 0.00 (0.00, 0.01) |
| Qinghai | 5,923,957 | 0.01 (0.00, 0.03) | 0.00 (0.00, 0.01) | 0.20 (0.00, 0.56) | 0.00 (0.00, 0.01) |
| Shaanxi | 39,528,999 | 7.67 (0.88, 24.81) | 2.56 (0.29, 8.28) | 126.58 (14.52, 409.32) | 0.32 (0.04, 1.04) |
| Xinjiang | 25,852,345 | 0.01 (0.00, 0.01) | 0.00 (0.00, 0.01) | 0.19 (0.00, 0.22) | 0.00 (0.00, 0.00) |
Publisher’s Note: MDPI stays neutral with regard to jurisdictional claims in published maps and institutional affiliations. |
© 2022 by the authors. Licensee MDPI, Basel, Switzerland. This article is an open access article distributed under the terms and conditions of the Creative Commons Attribution (CC BY) license (https://creativecommons.org/licenses/by/4.0/).
Share and Cite
Chen, T.; Liu, J.; Li, Y.; Wei, S. Burden of Disease Associated with Dietary Exposure to Aflatoxins in China in 2020. Nutrients 2022, 14, 1027. https://doi.org/10.3390/nu14051027
Chen T, Liu J, Li Y, Wei S. Burden of Disease Associated with Dietary Exposure to Aflatoxins in China in 2020. Nutrients. 2022; 14(5):1027. https://doi.org/10.3390/nu14051027
Chicago/Turabian StyleChen, Tingting, Jialin Liu, Yiling Li, and Sheng Wei. 2022. "Burden of Disease Associated with Dietary Exposure to Aflatoxins in China in 2020" Nutrients 14, no. 5: 1027. https://doi.org/10.3390/nu14051027
APA StyleChen, T., Liu, J., Li, Y., & Wei, S. (2022). Burden of Disease Associated with Dietary Exposure to Aflatoxins in China in 2020. Nutrients, 14(5), 1027. https://doi.org/10.3390/nu14051027