
A Review of the Relationship between Lentil Serving and Acute Postprandial Blood Glucose Response: Effects of Dietary Fibre, Protein and Carbohydrates

 ,
, 
Abstract
:1. Introduction
2. Materials and Methods
2.1. Study Selection
2.2. Data Extraction
2.3. Data Analysis
3. Results
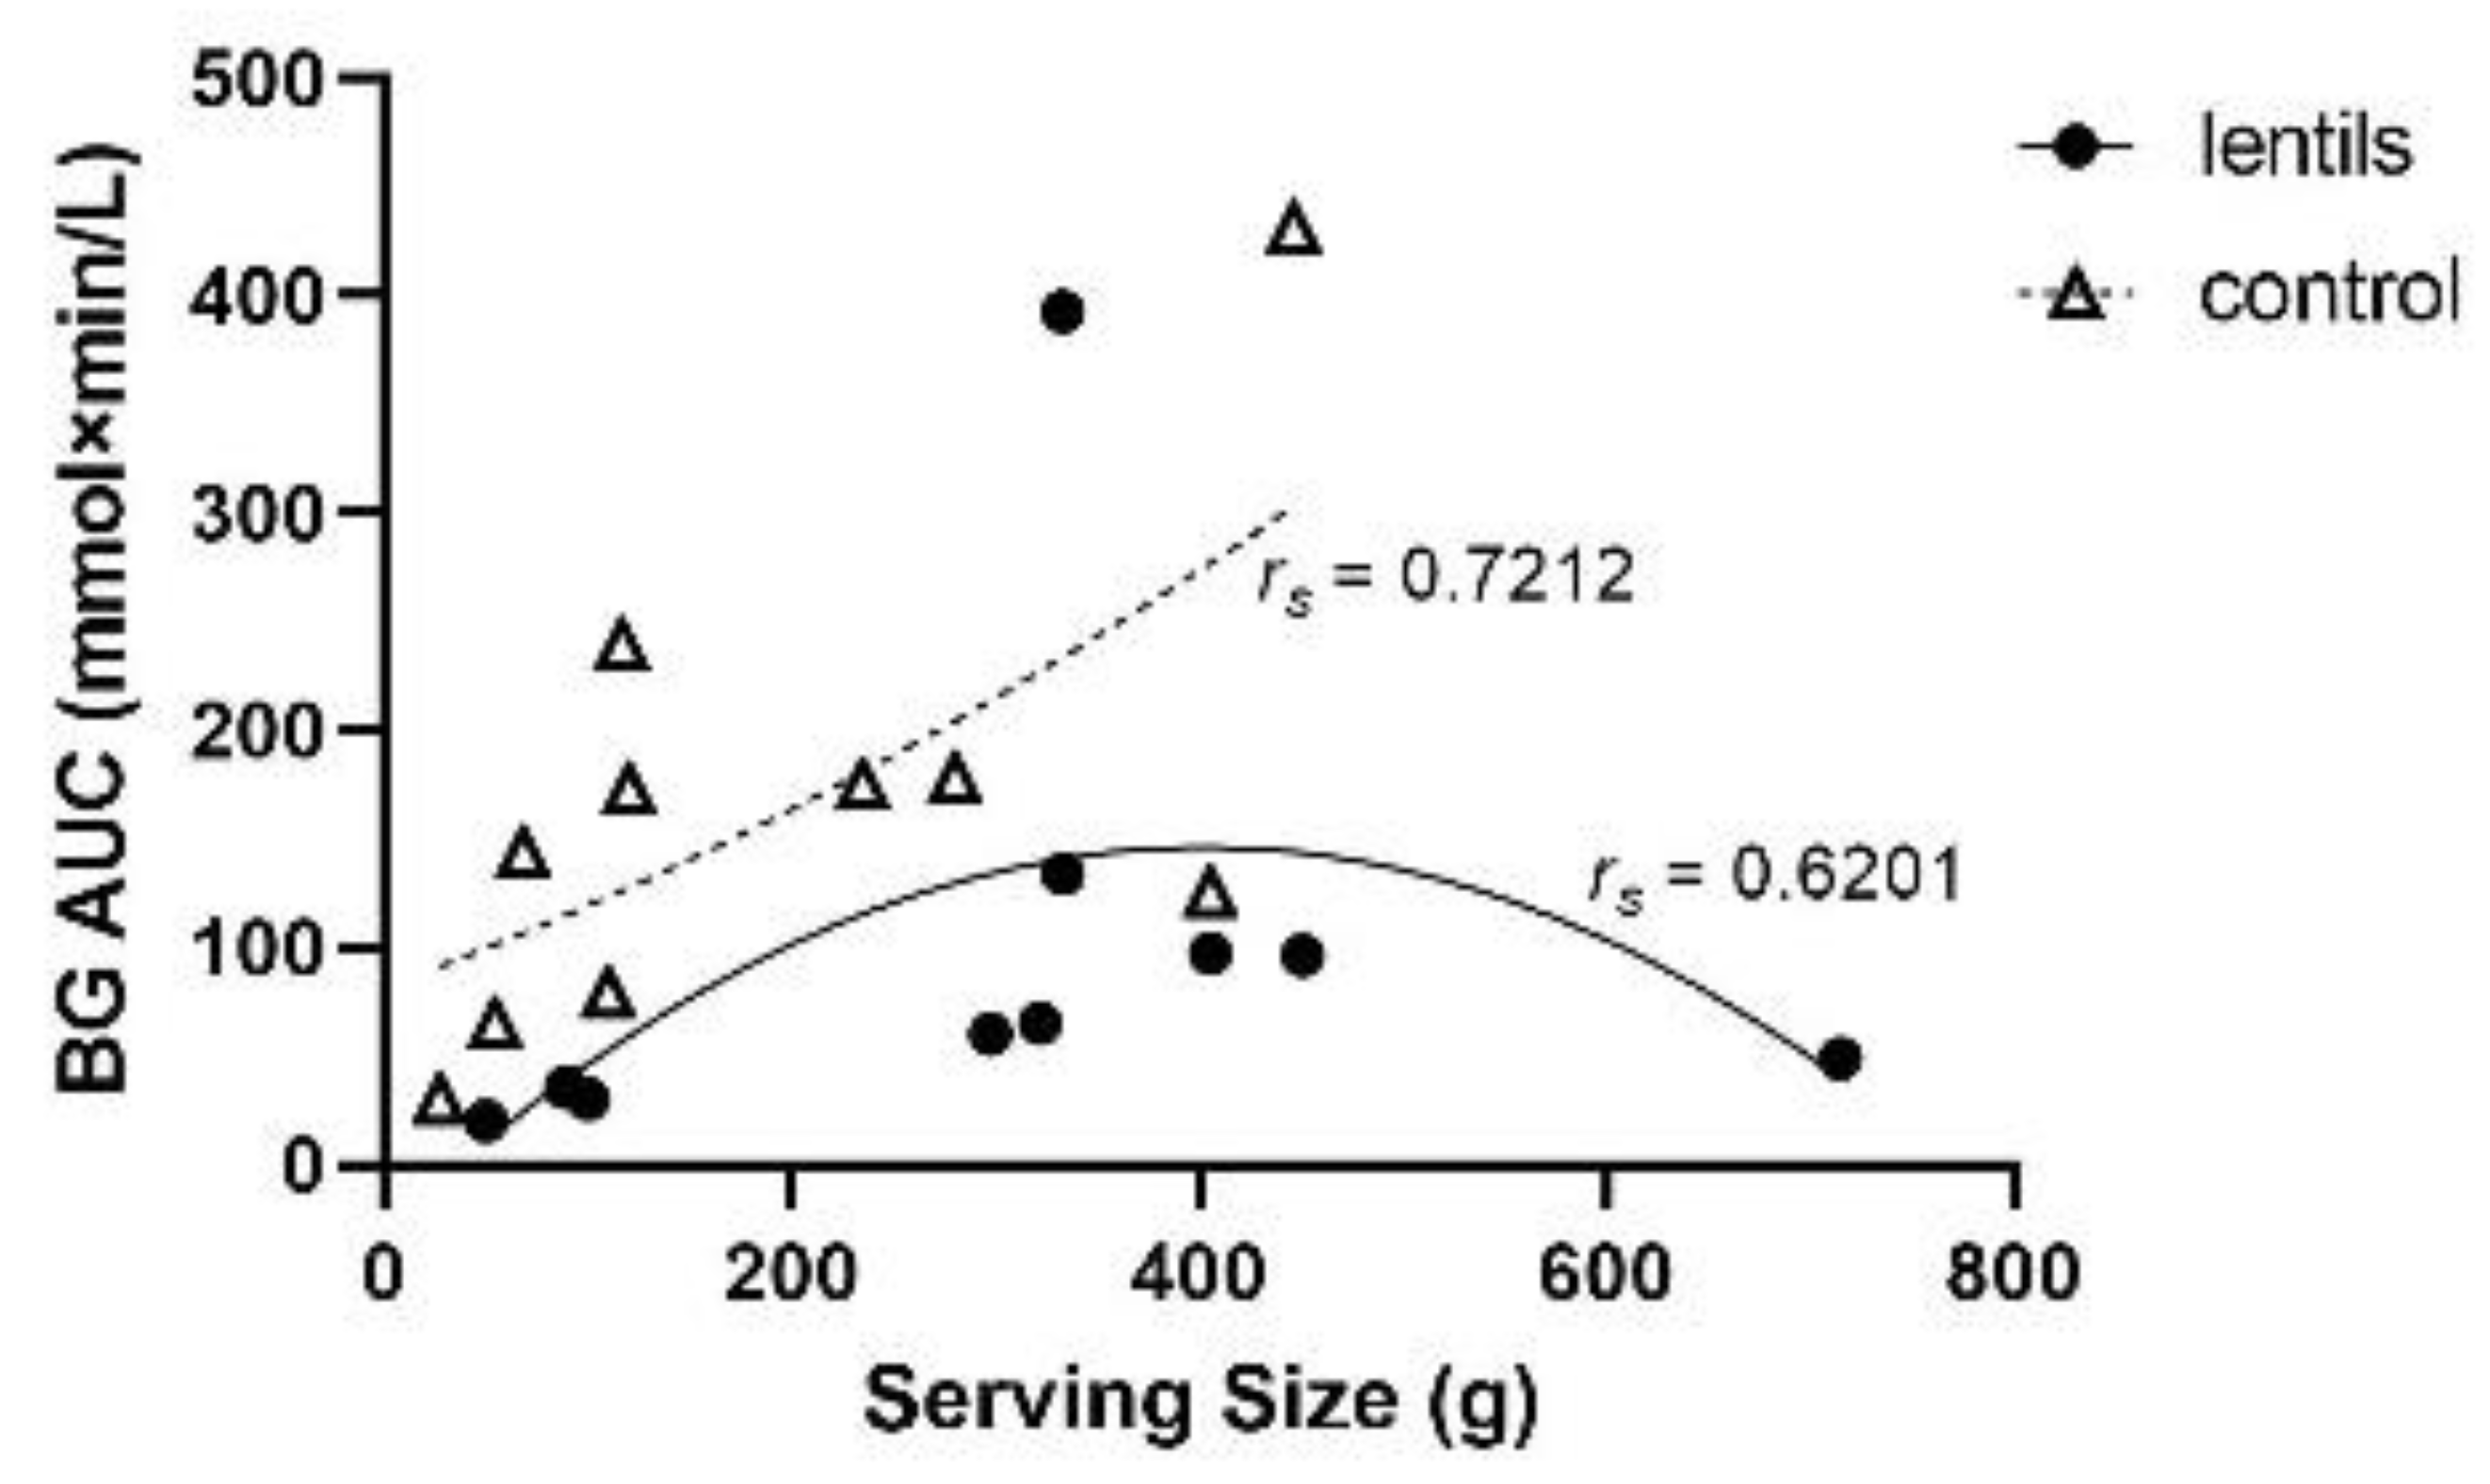
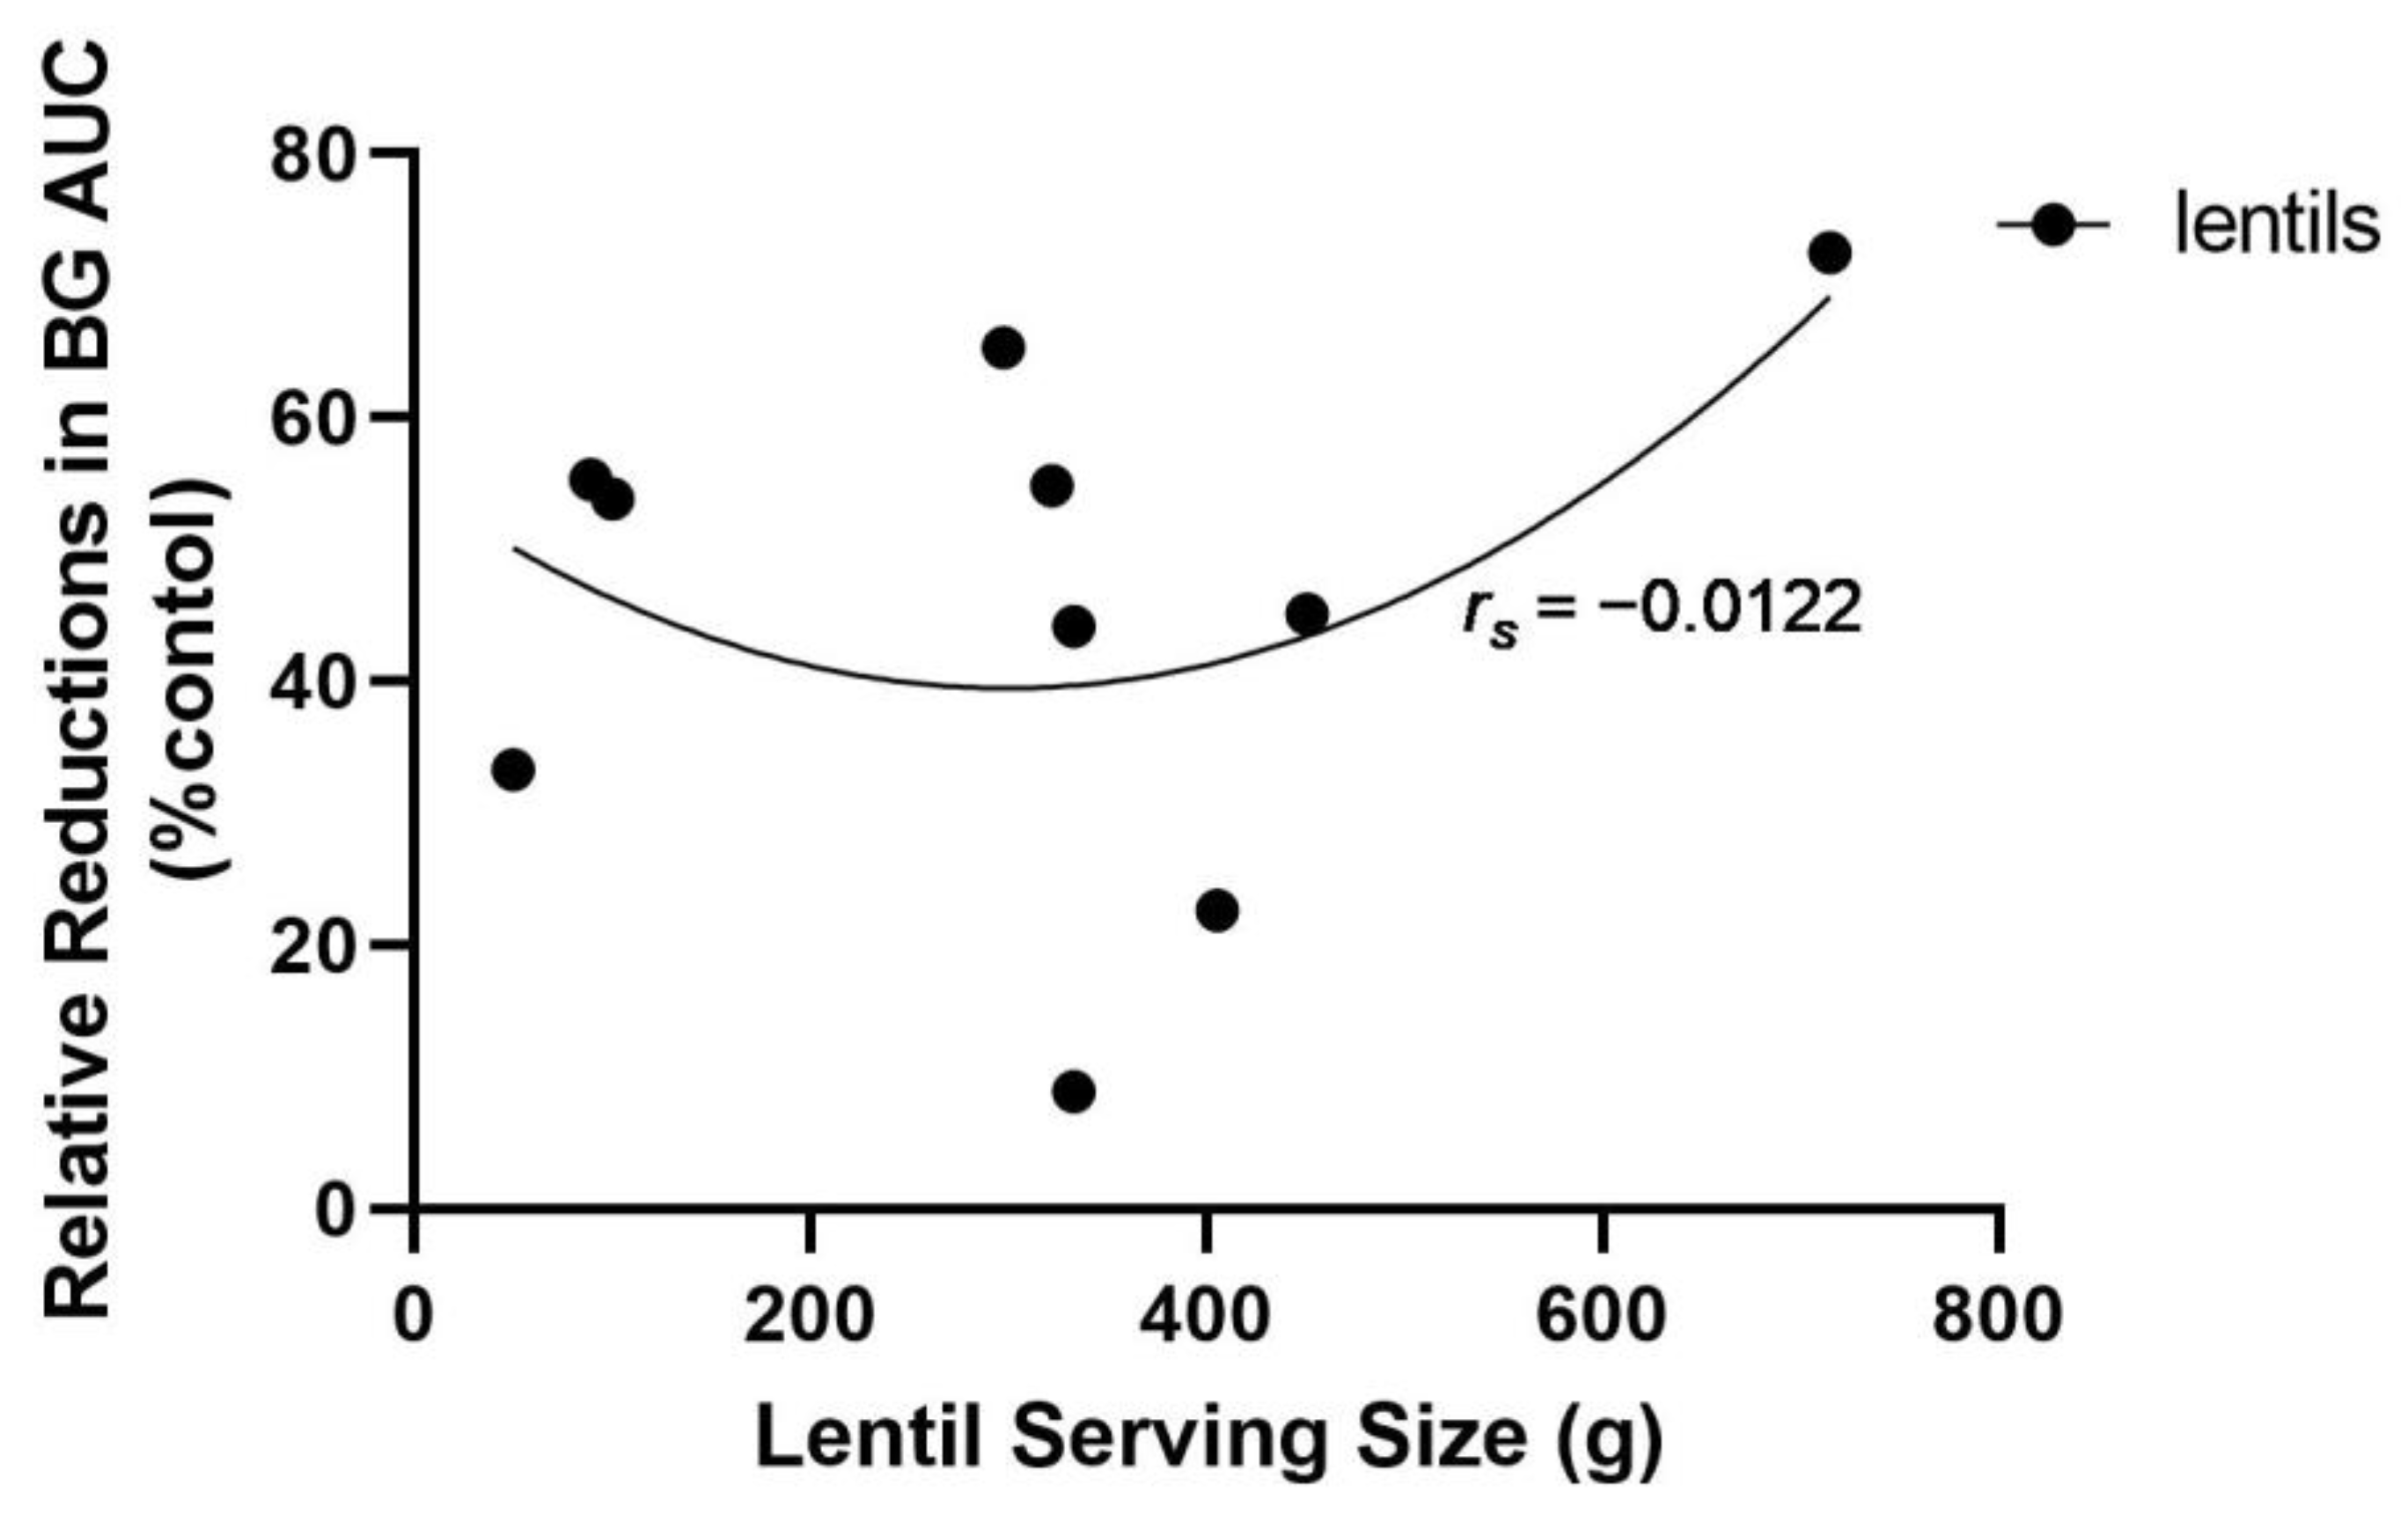
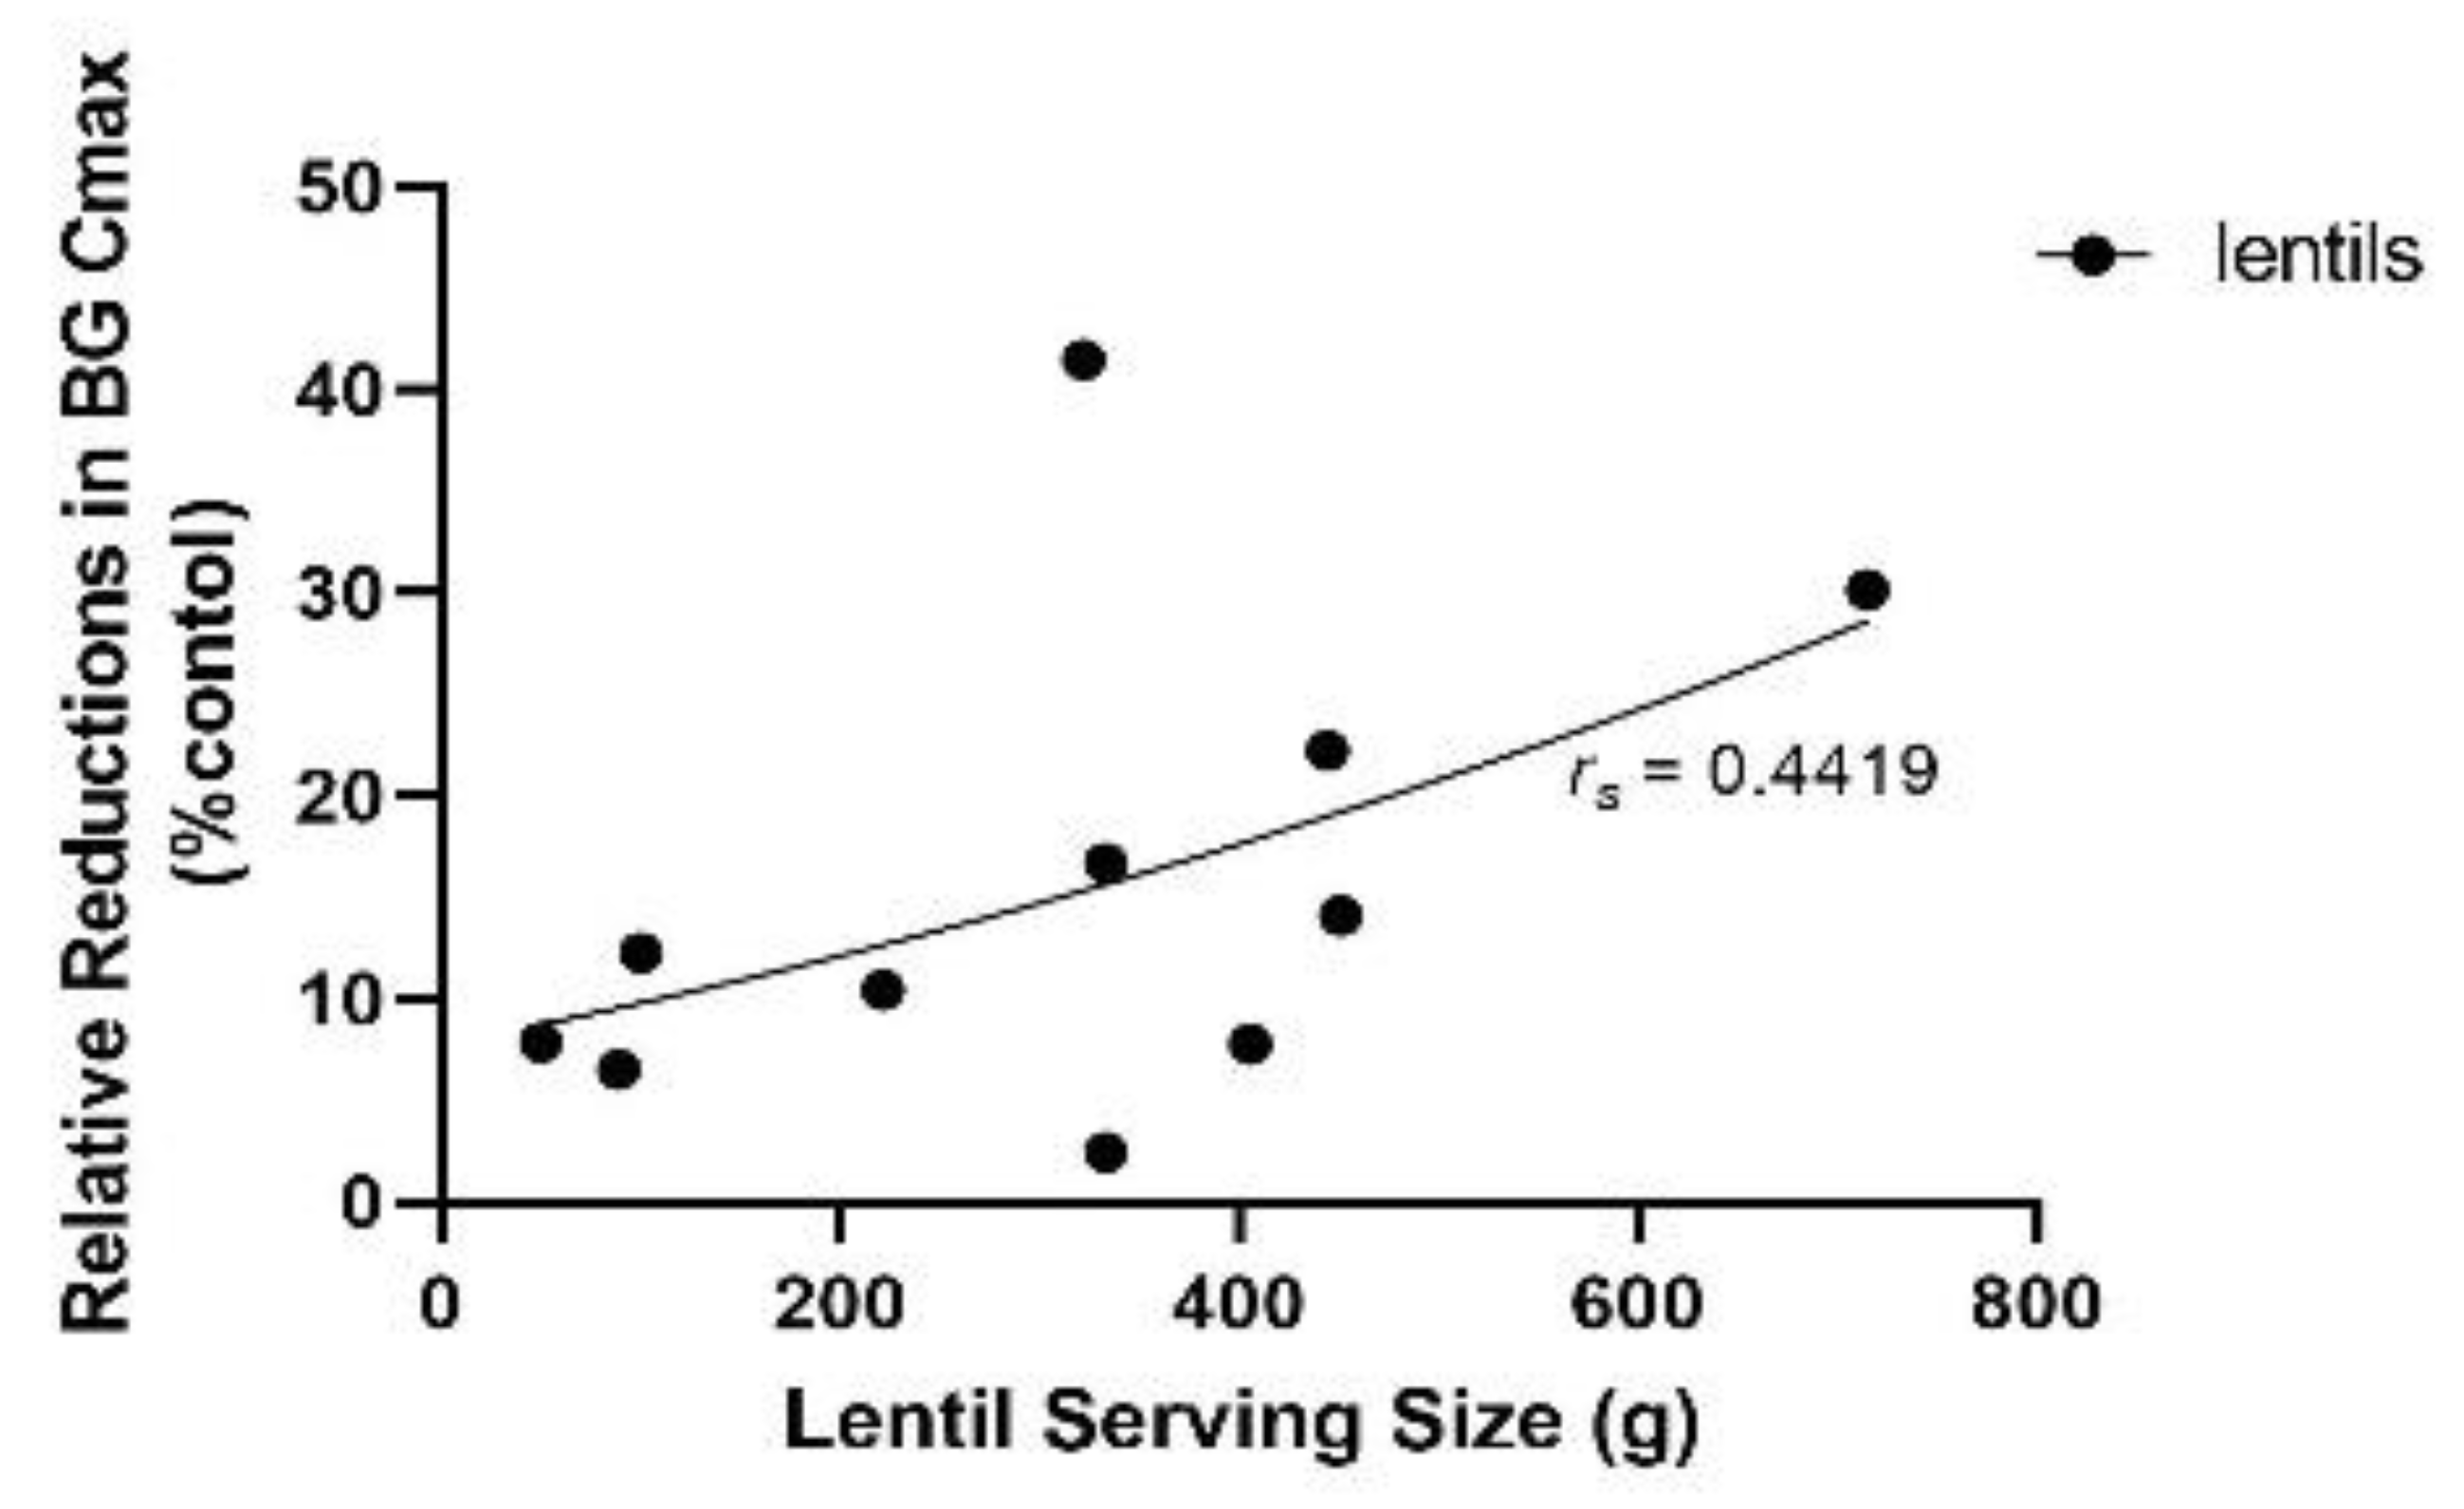
3.1. Lentil Serving Size
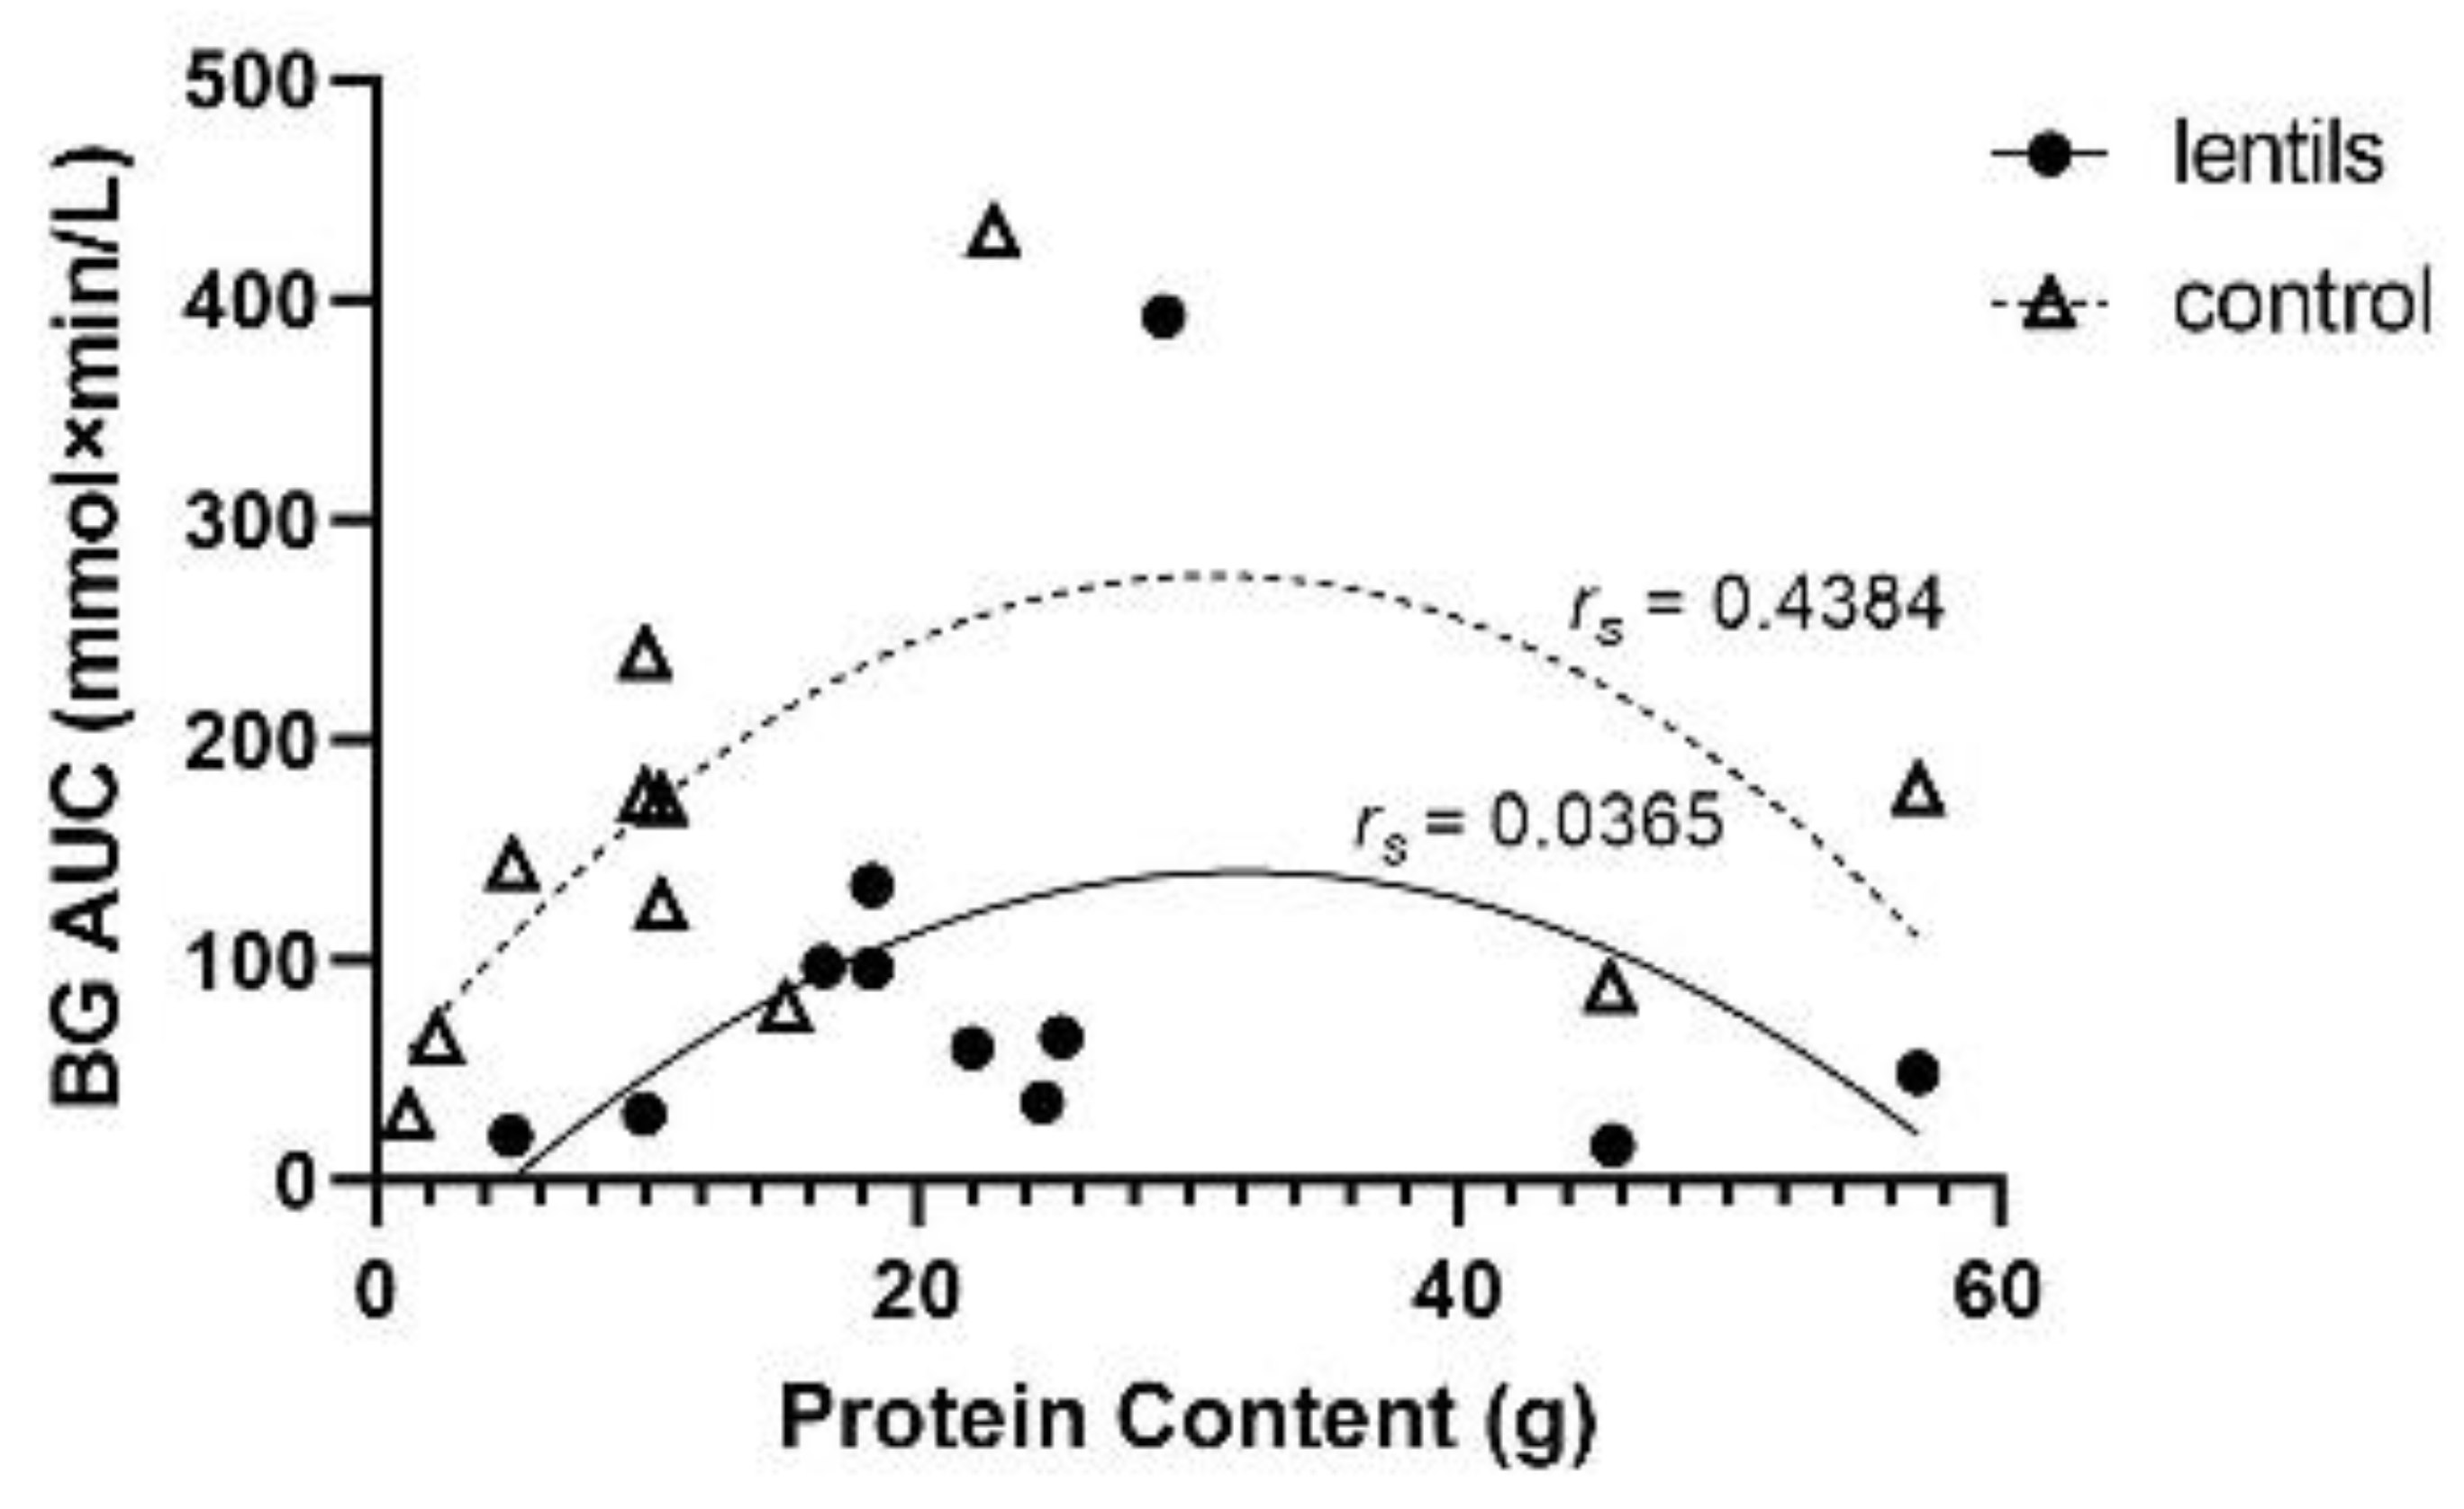
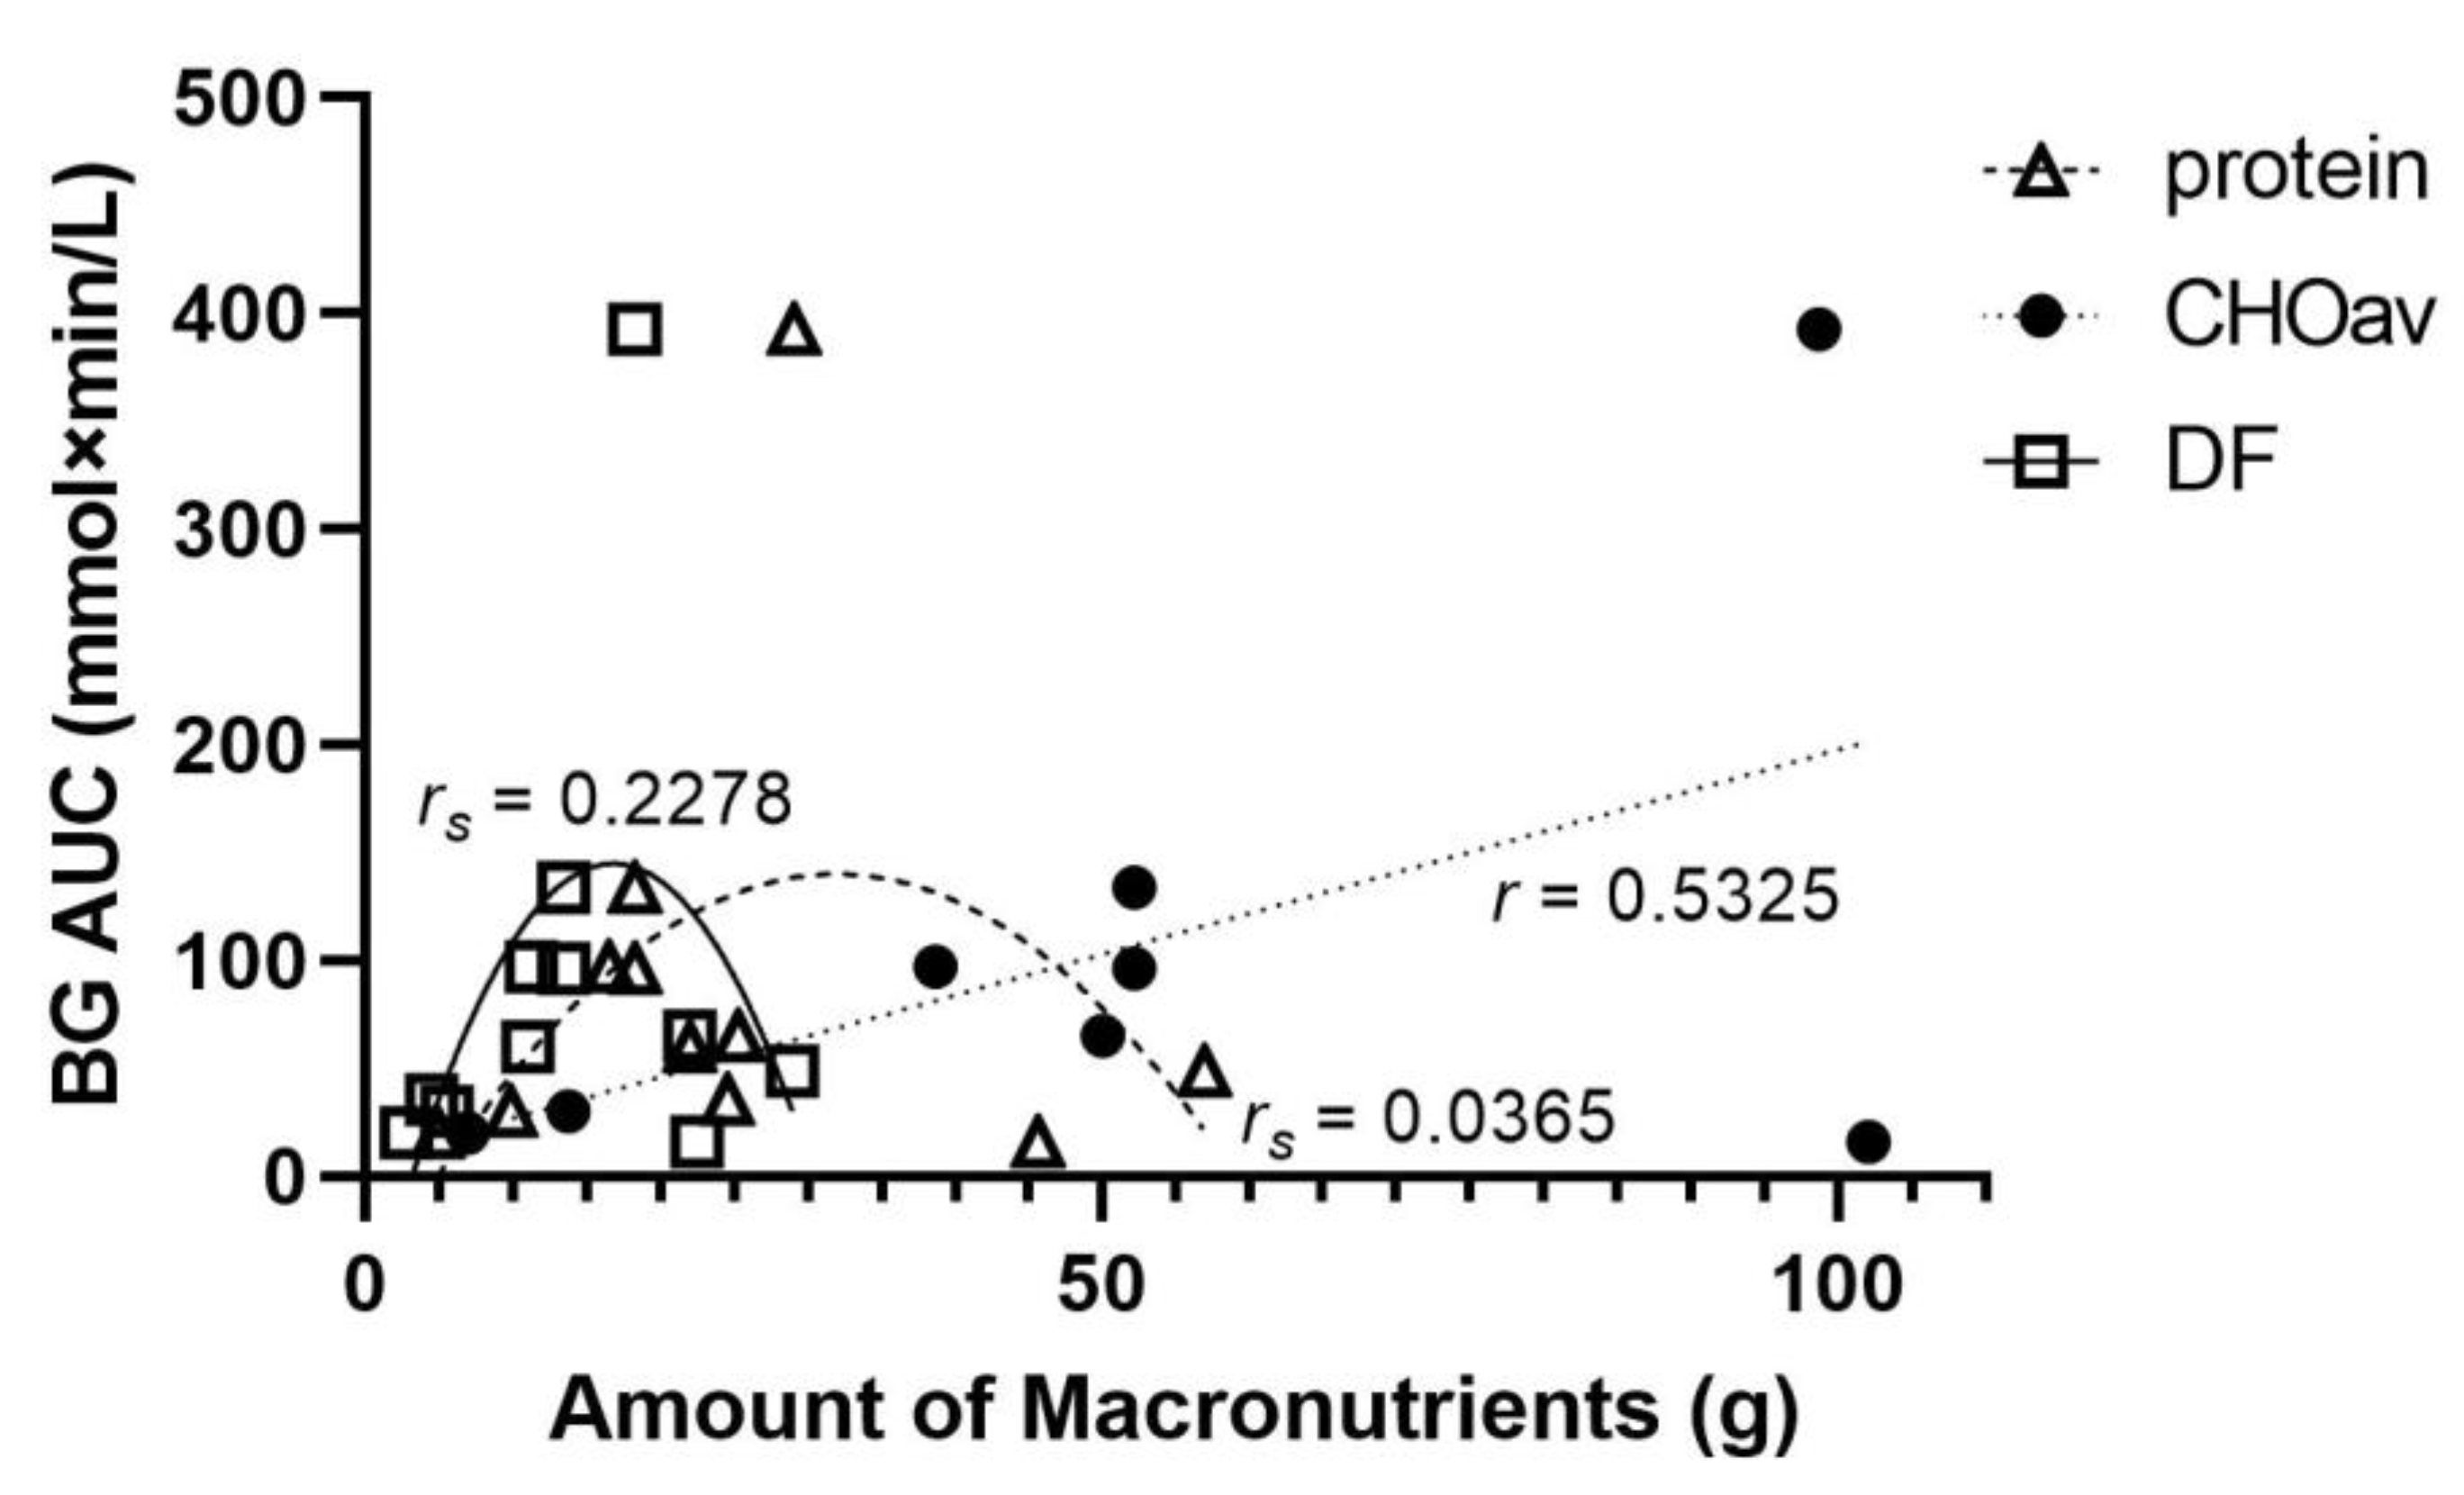
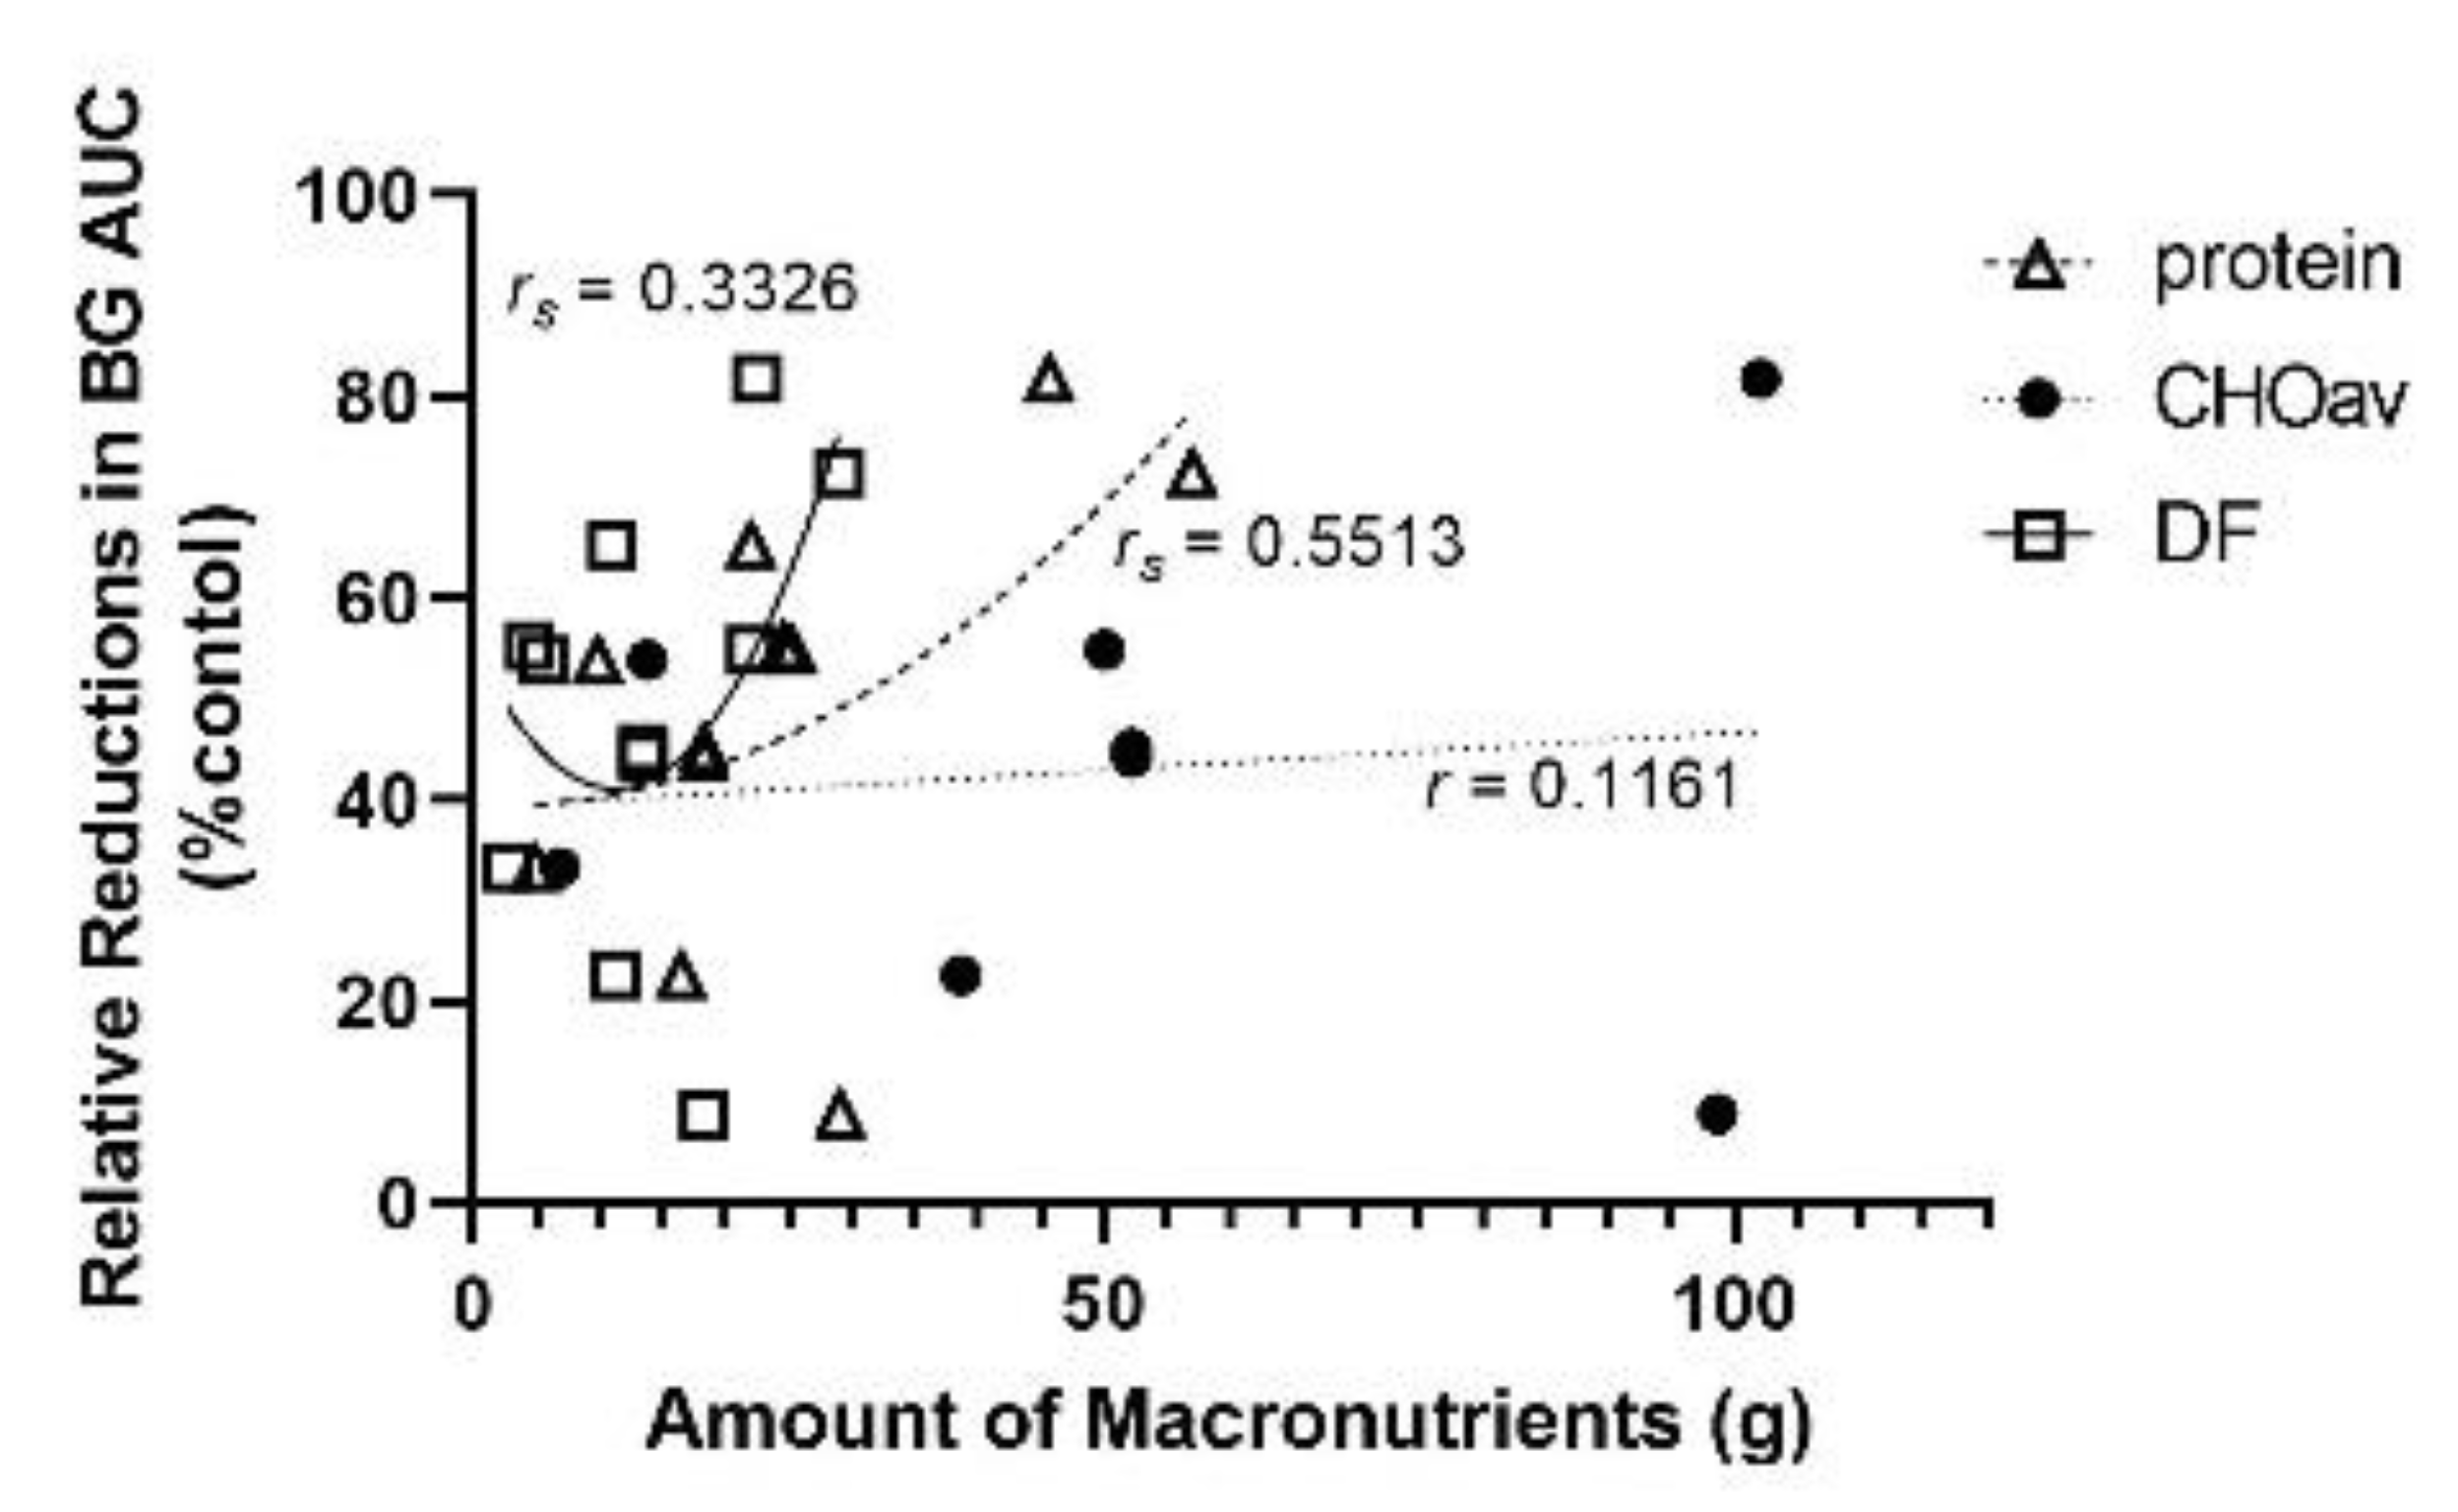
3.2. Protein
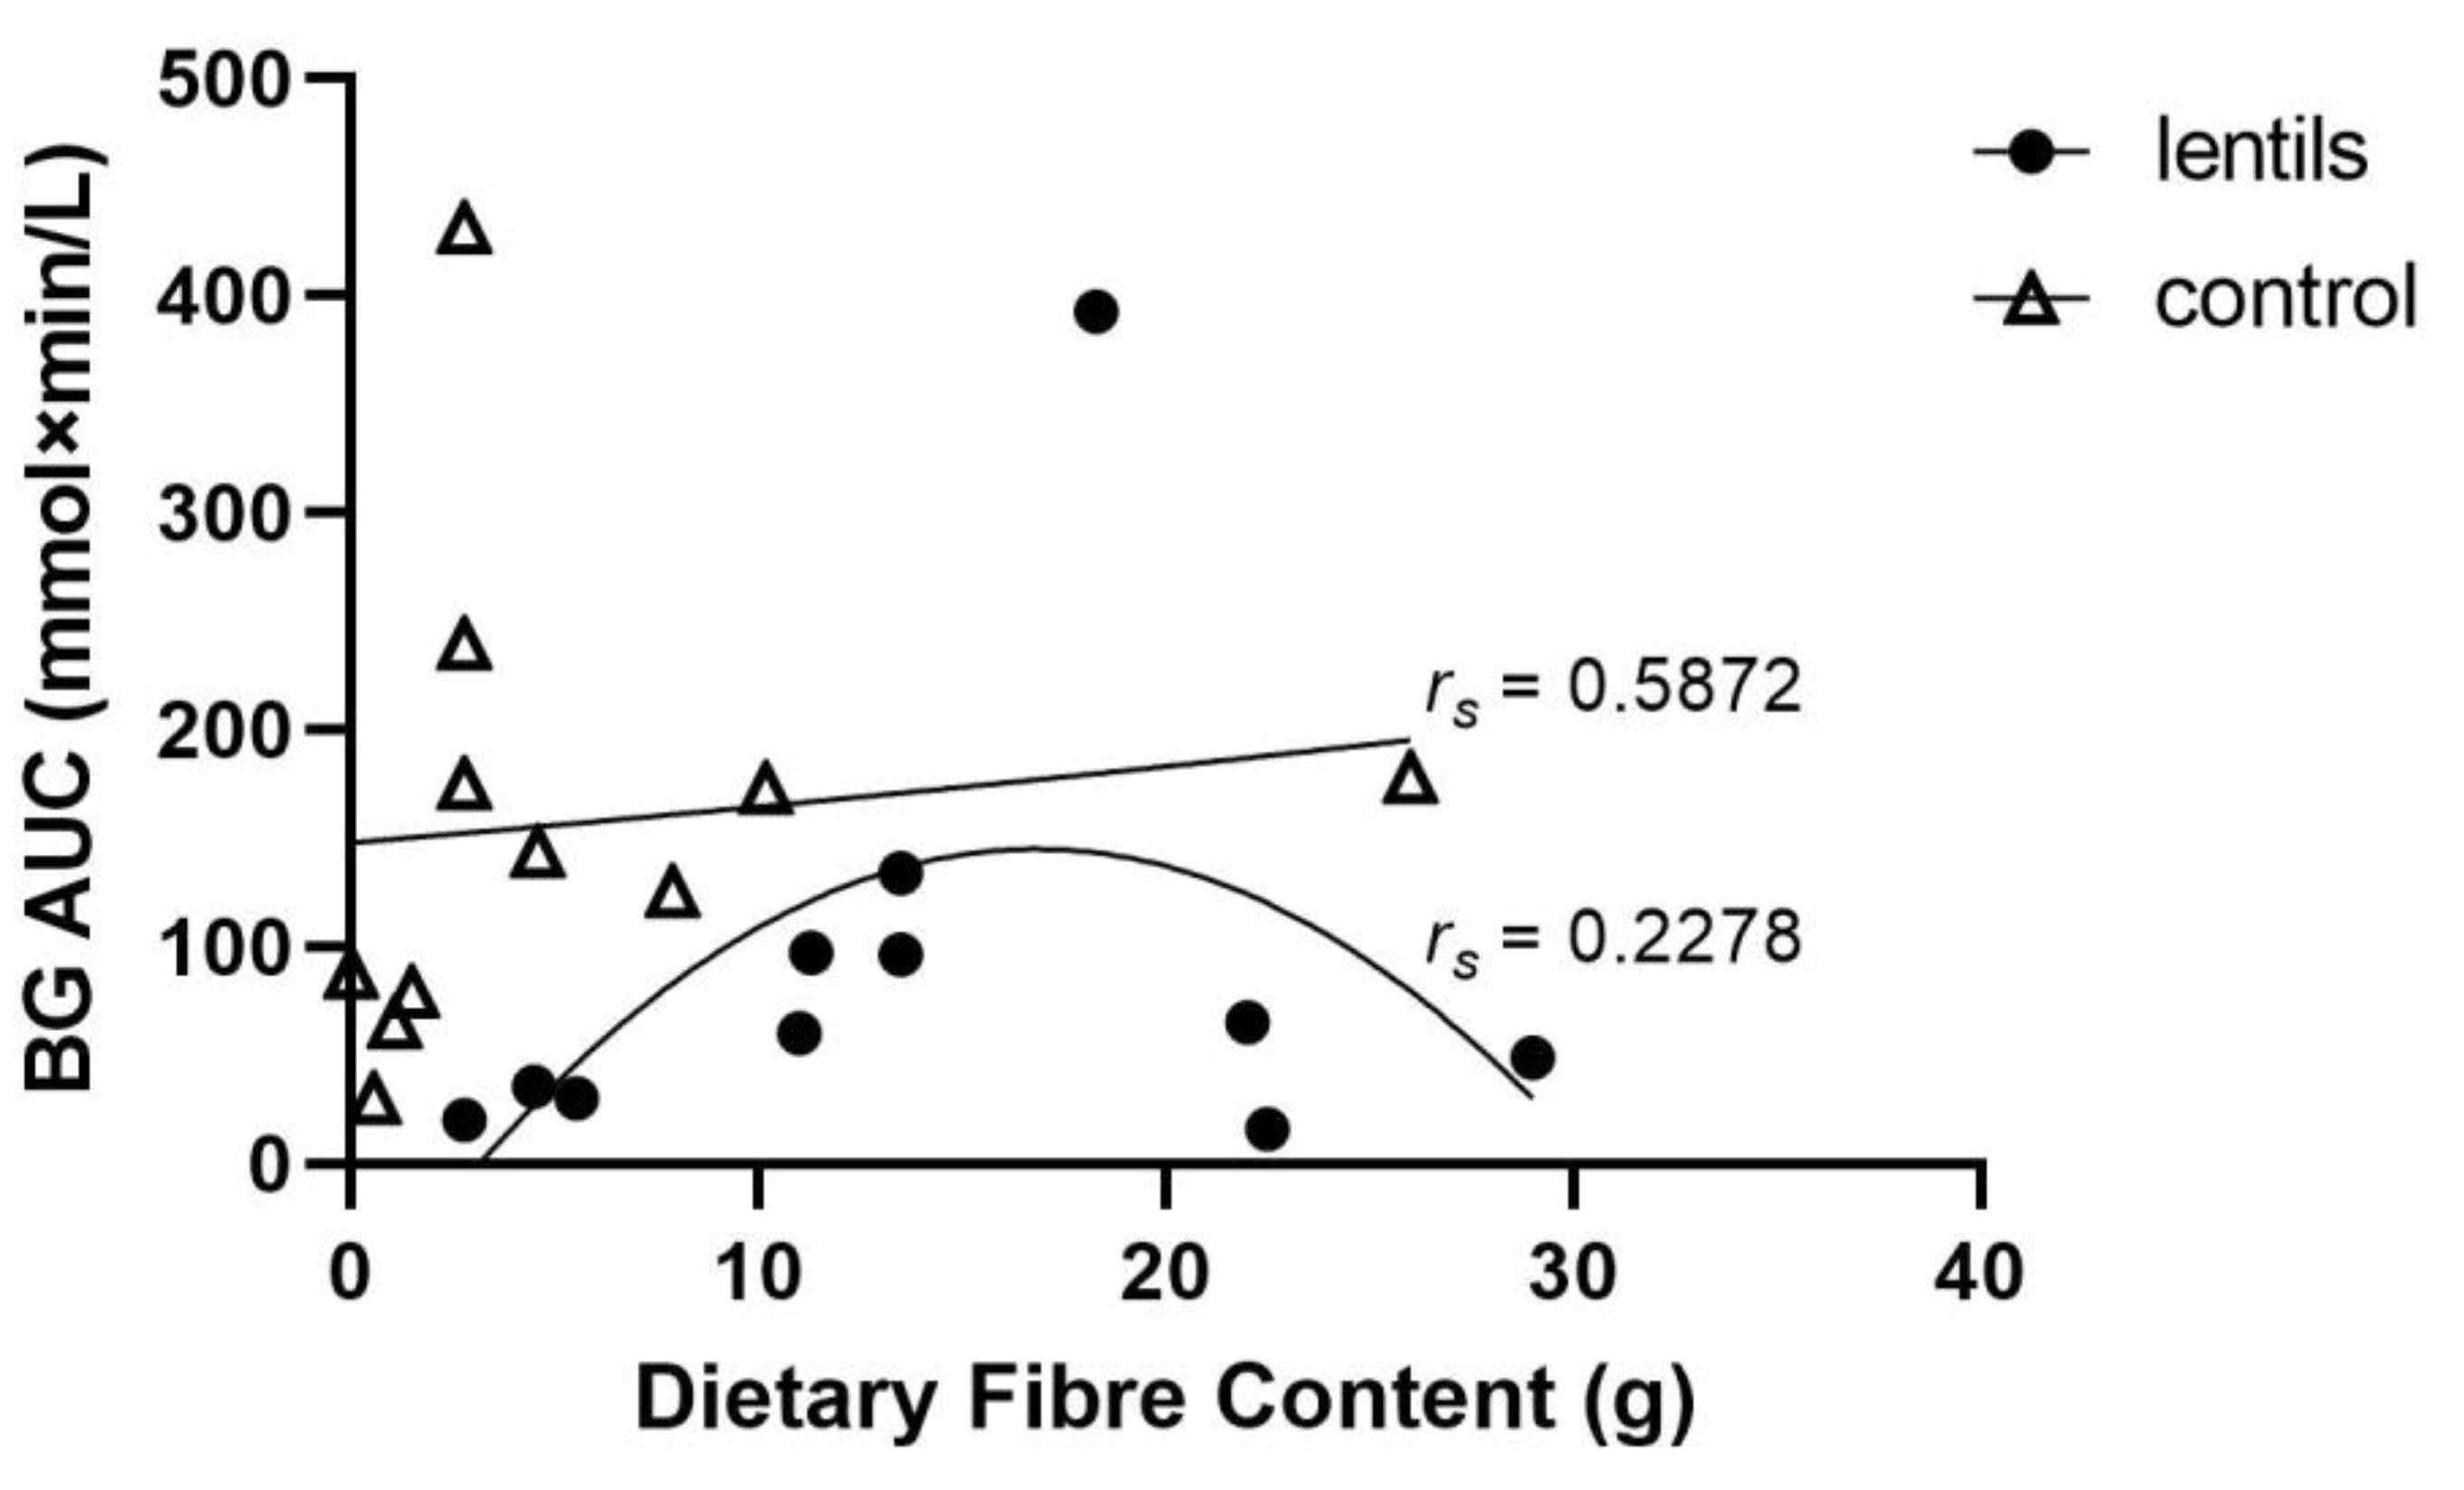
3.3. Dietary Fibre
3.4. Available Carbohydrates (CHOav)
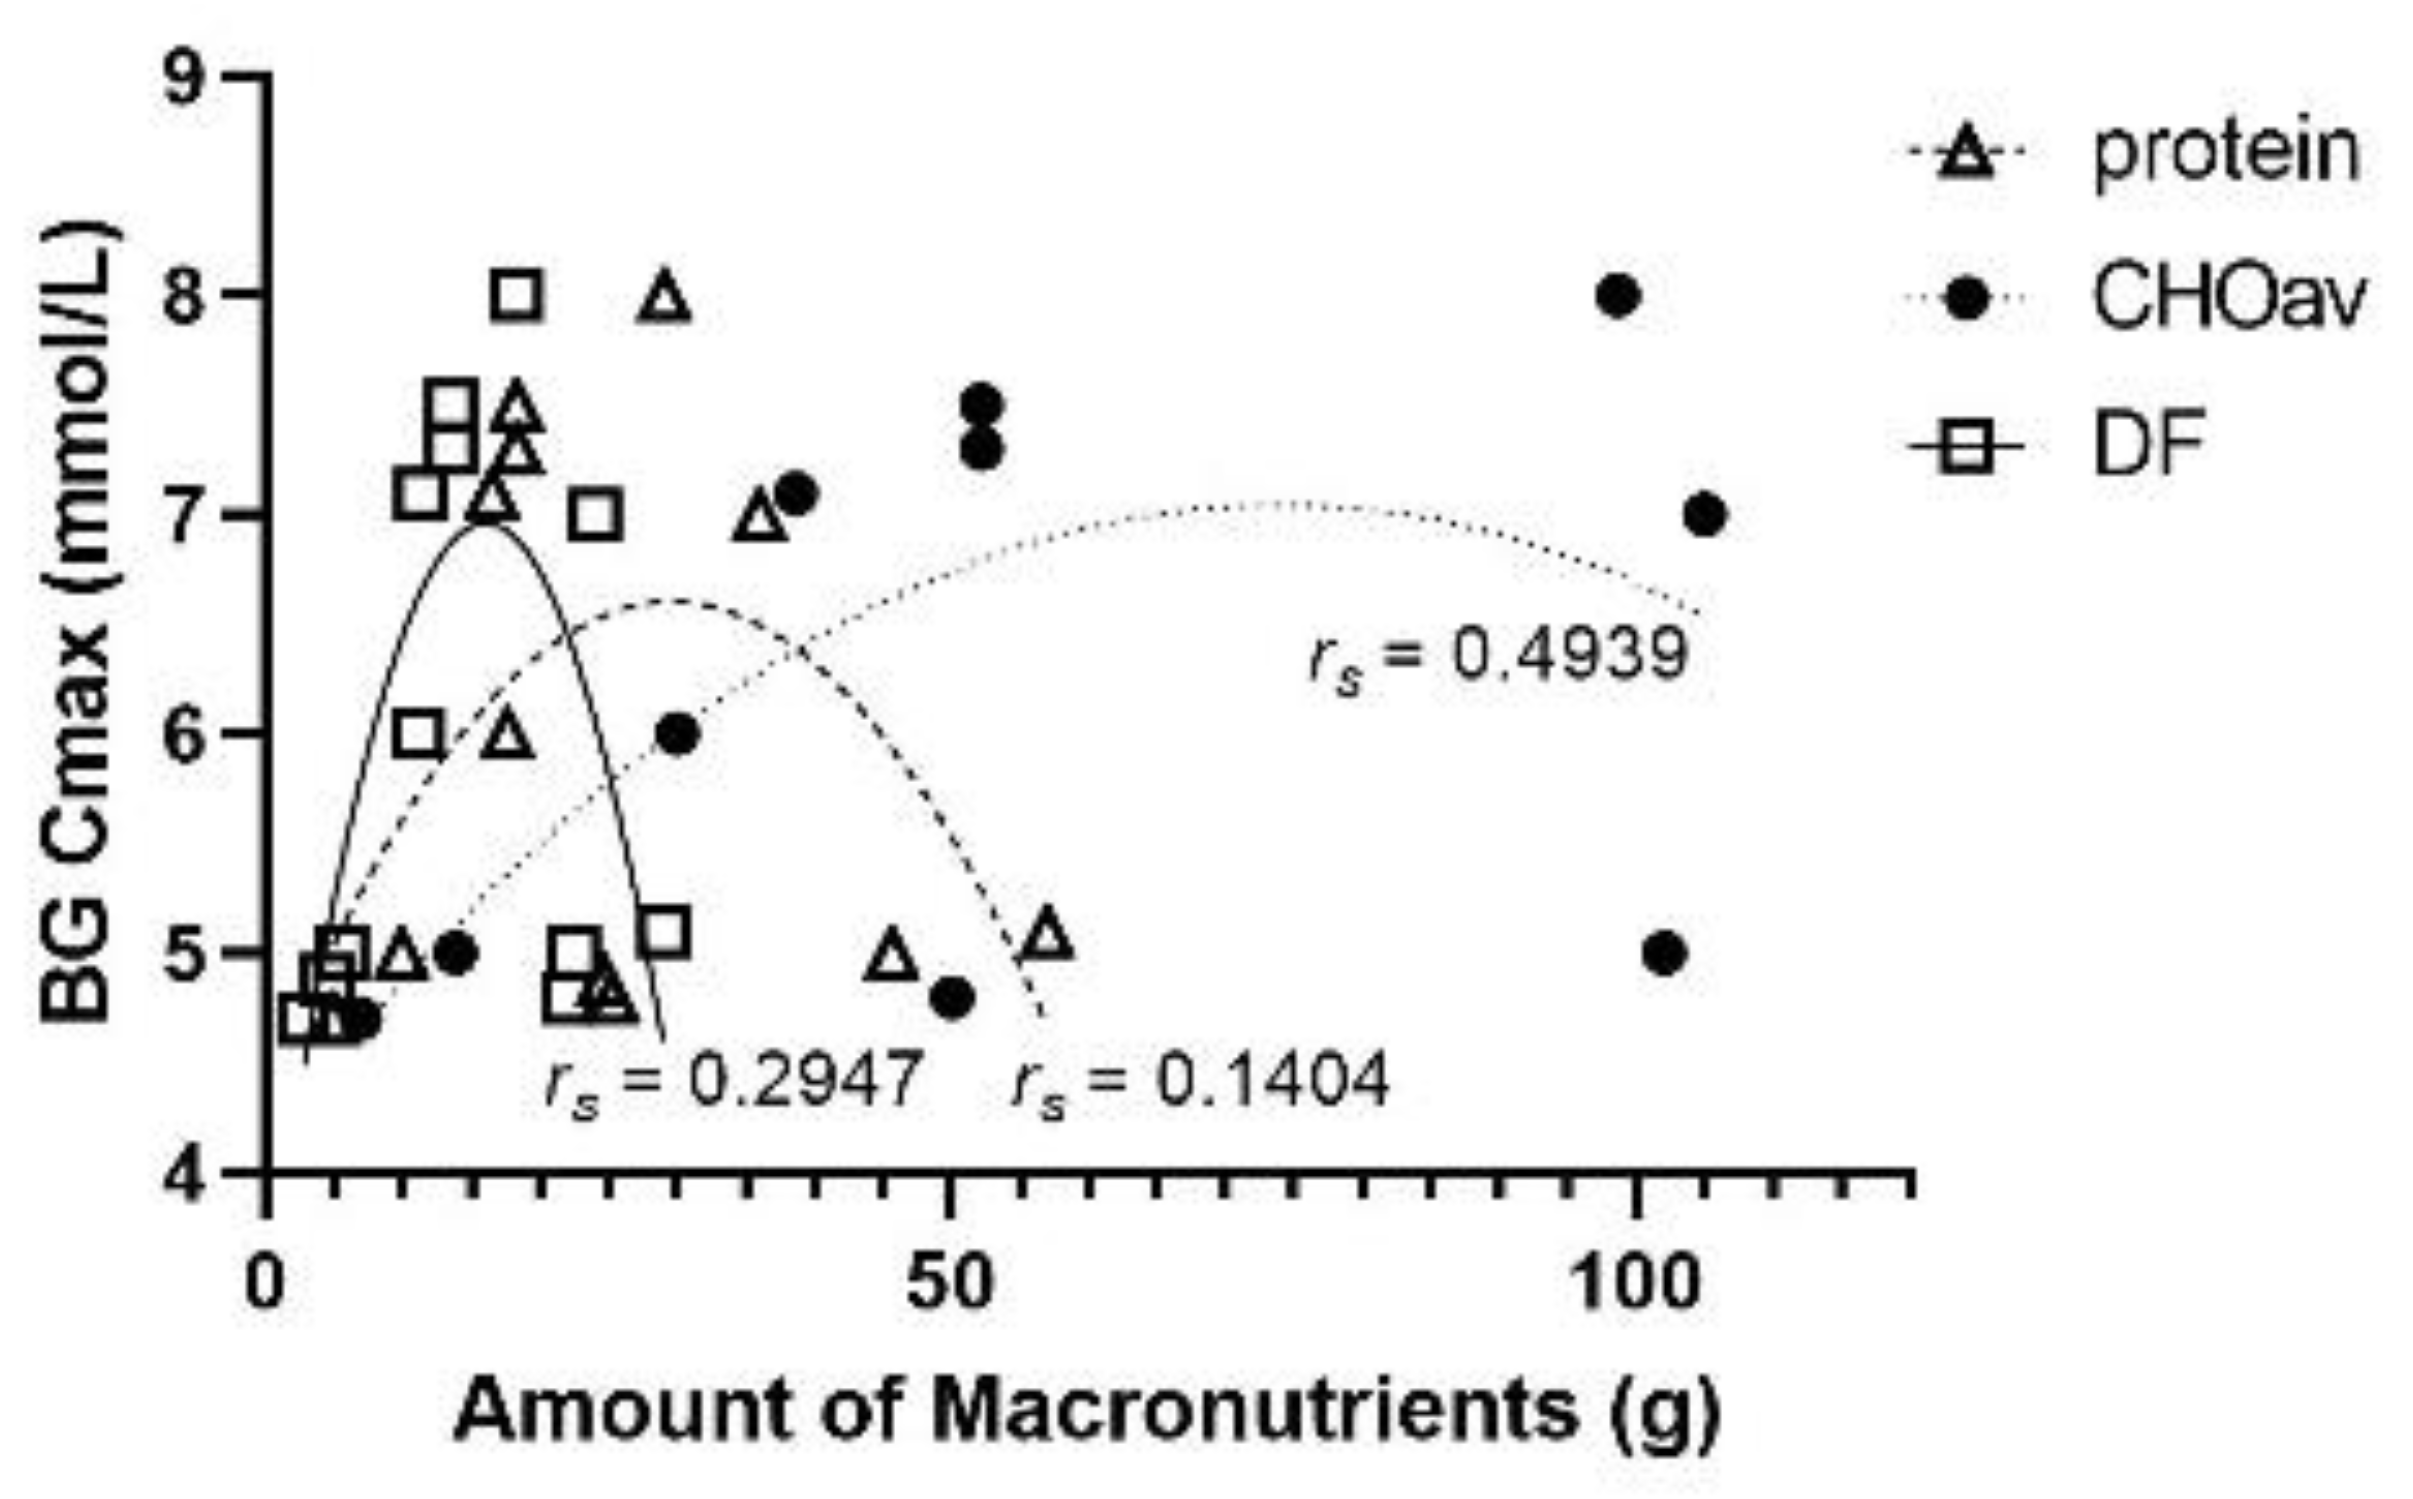
3.5. Maximum Blood Glucose Concentrations
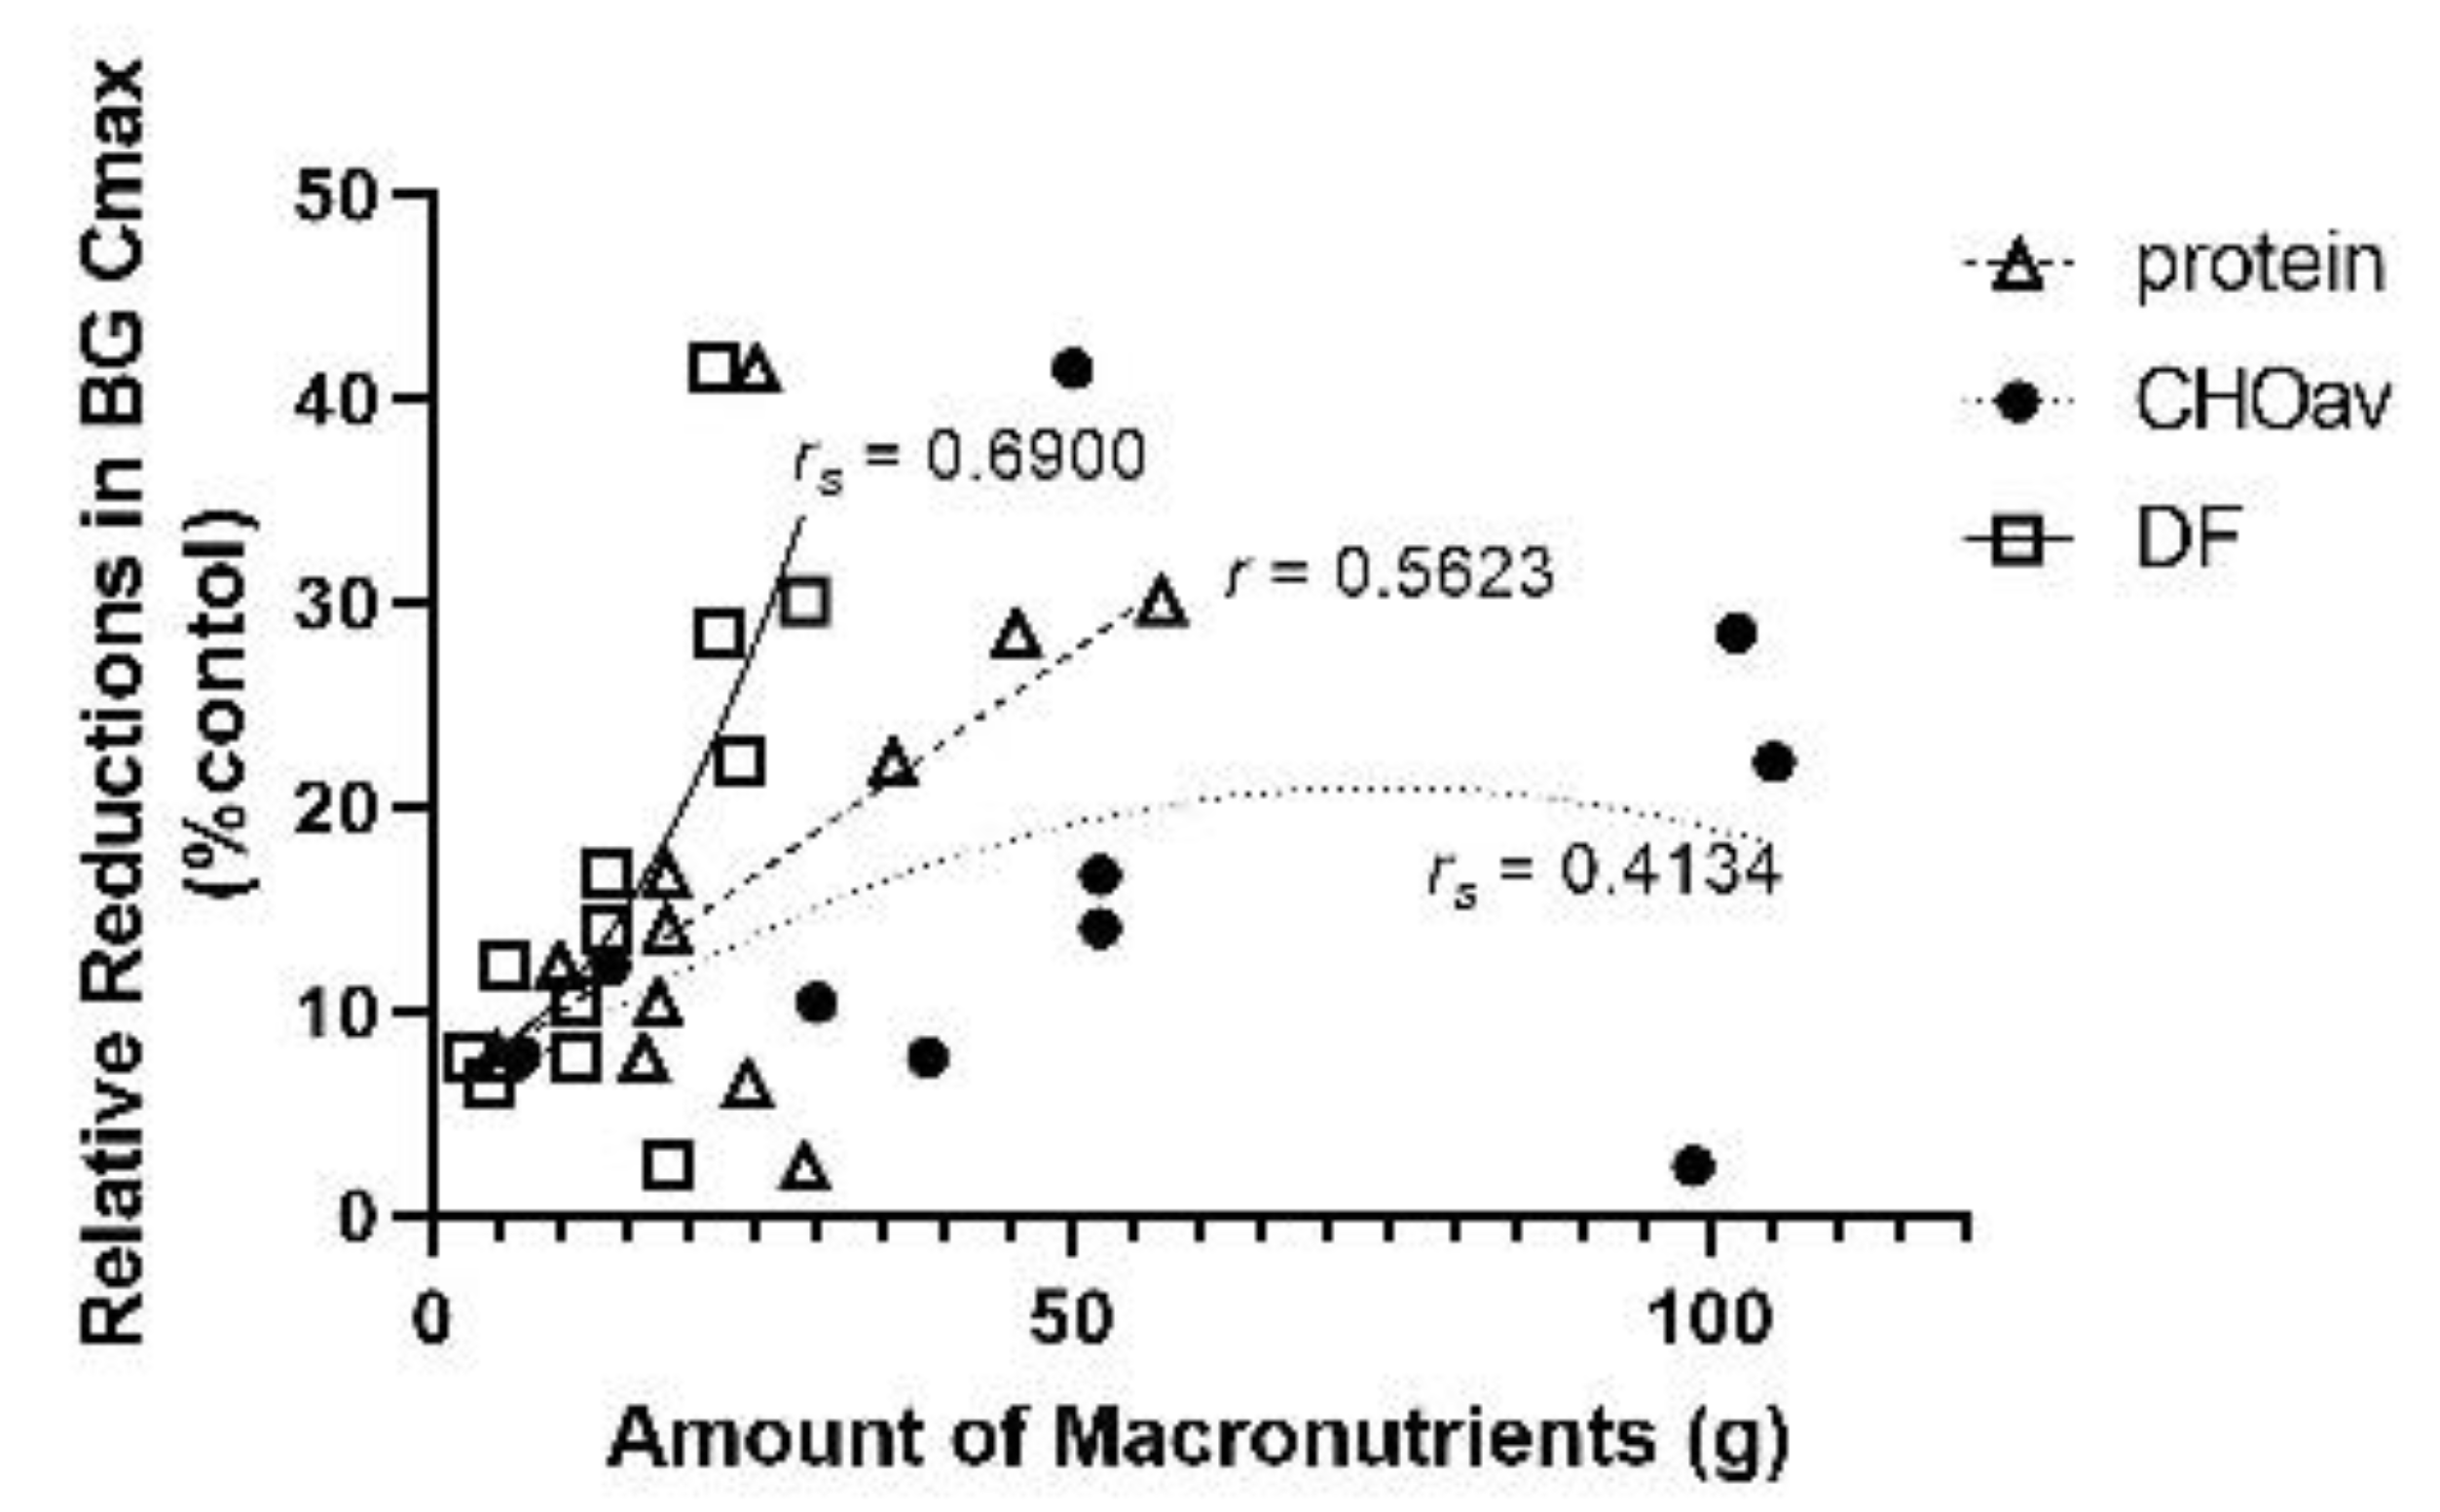
3.6. Macronutrients, Dietary Fibre and BG Cmax
3.7. Studies Involving Diabetic Participants
3.8. Insulin

| Lentil Treatment | Control Treatment | Outcomes | |||||||||||||||||
|---|---|---|---|---|---|---|---|---|---|---|---|---|---|---|---|---|---|---|---|
| Study | Participants | Lentil Serving Size (g) | Protein (g) | DF (g) | CHOav (g) | TC (g) † | Control Serving (g) | Protein (g) | DF (g) | AC (g) | TC (g) † | BG Cmax Lentil Group | BG Cmax Control Group | Relative Difference in BG Cmax (%) | BG AUC Lentil Group (mmol × min/L) | BG AUC Control Group (mmol × min/L) | Relative Difference in BG AUC (%) | BG AUC Time Period | |
| Akhtar, Asim, and Wolever 1987 [16] | 14 males aged 35.2 ± 1.54 years, BMI 23.6 ± 0.55 kg/m2 | 89.3 | 24.6 | 4.5 | - | 25 | 110 | 15.1 | 1.5 | - | 50 | 4.88 @ 60 min | 5.22 @ 120 min | 6.51 | 35.5 | 79.4 | 55.3 | 3 h | |
| Anderson, Liu, Smith, Liu, Nunez, Mollard and Luhovyy, 2014 [20] | males aged 18–30 years, normal BMI | 405.5 | 16.5 | 11.3 | 38.7 | 50 | 405.5 | 10.5 | 7.9 | 38.7 | 46.6 | 7.1 @ 30 min | 7.7 @ 30 min | 7.79 | 97.1 | 125.5 | 22.6 | 2 h | |
| Bennett, Chilibeck, Barss, Vatanparast, Vandenberg and Zello 2012 [21] | 14 recreational soccer players, aged 22–27 years, BMI 22 kg/m2 | 444 | 36 | 24 | 105 | 129 | 436 | 16 | 7 | 92 | 99 | 7.0 @ 15 min | 9.0 @ 15 min | 22.22 | - | - | - | - | |
| Jenkins, Ghafari, Wolever, Taylor, Jenkins, Barker, Fielden and Bowling, 1982 [22] | 17 adults aged 28 ± 2 years | 297.5 * | 22 | 11 | - | 50 | 120 | 10.5 | 10.2 | - | 50 | - | - | - | 60 | 173 | 65.3 | 2 h | |
| Jenkins, Wolever, Taylor, Griffiths, Krzeminska, Lawrie, Bennett, Goff, Sarson and Bloom, 1982 [10] | 7 adults aged 26 ± 3 years | 715 * | 57 | 29 | - | 127 | 280 | 57 | 26 | - | 128 | 5.1 @ 30 min | 7.3 @ 30 min | 30.14 | 49 | 178 | 72.5 | 2 h | |
| MacPherson 2018 [11] | adults aged 18–40 years, BMI 20–30 kg/m2 | male | 100 | 9.88 | 5.55 | 13.8 | 26.3 | 54.6 | 2.23 | 1.07 | 15.5 | 13.6 | 5.0 @ 30 min | 5.7 @ 30 min | 12.28 | 30 | 65 | 53.9 | 2 h |
| female | 50 | 4.94 | 2.78 | 6.91 | 13.2 | 27.3 | 1.16 | 0.56 | 8.08 | 7.1 | 4.7 @ 15 min | 5.1 @ 15 min | 7.84 | 20 | 30 | 33.3 | 2 h | ||
| Lentil Treatment Comparison | Control Treatment Comparison | Outcomes | |||||||||||||||||
| Study | Participants | Lentil Serving Size (g) | Protein (g) | DF (g) | CHOav (g) | TC (g) † | Control Serving (g) | Protein (g) | DF (g) | AC (g) | TC (g) † | BG Cmax Lentil Group | BG Cmax Control Group | Relative Difference in BG Cmax (%) | BG AUC Lentil Group (mmol × min/L) | BG AUC Control Group (mmol × min/L) | Relative Difference in BG AUC (%) | BG AUC Time Period | |
| Mollard, Wong, Luhovyy and Anderson, 2011 [23] | 25 males aged 20–30 years, BMI 20.0–24.9 kg/m2 | 332.9 | 29.1 | 18.3 | 98.7 | 117 | 446.5 | 22.8 | 2.8 | 100.4 | 103.2 | 8.0 @ 40 min | 8.2 @ 40 min | 2.44 | 392.9 | 431.3 | 8.9 | 260 min | |
| Mollard, Wong, Luhovyy, Cho and Anderson, 2014 [24] | 15 males aged 18–35 years | 332.9 | 18.3 | 13.5 | 52.2 | 65.7 | 116.6 | 9.9 | 2.8 | 64 | 66.8 | 7.5 @ 30 min | 9.0 @ 30 min | 16.67 | 133.8 | 239.7 | 44.2 | 135 min | |
| Ramdath, Wolever, Siow, Ryland, Hawke, Taylor, Zahradka and Aliani, 2018 [15] | 20 males and females, 18–75 years, BMI < 30 kg/m2 | 321.8 | 25.3 | 22 | 50.1 | 72.1 | 68.1 | 5 | 4.6 | 50 | 54.6 | 4.8 @ 30 min | 8.2 @ 30 min | 41.46 | 65 | 144 | 54.9 | 2 h | |
| Tovar, Granfeldt and Bjorck, 1992 [25] | 10 adults aged 36 ± 2.5 years, BMI 22.4 ± 0.9 kg/m2 | 221.52 * | 17.6 | 11.1 | 30 | 41.1 | 70 | 19 | 1.4 | 30 | 31.4 | 6.0 @ 30 min | 6.7 @ 30 min | 10.45 | - | - | - | 2 h | |
| Wolever, Jenkins, Ocana, Rao and Collier, 1988 [17] | 5 adults aged 24 ± 0.3 years | 3.2 g/kg, raw weight | 45.7 | 22.5 | 102.1 | 124.6 | 1.7 g/kg | 45.6 | 0 | 102 | 102 | 5.0 @ 45 min | 7.0 @ 60 min | 28.57 | 16 | 88 | 81.8 | 2 h | |
| Wong, Mollard, Zafar, Luhovyy and Anderson, 2009 [26] | 14 men aged 18–35 years, BMI 20–25 kg/m2 | 451 | 18.3 | 13.5 | 52.2 | 65.7 | 235 | 9.9 | 2.8 | 64 | 66.8 | 7.3 @ 15 min | 8.5 @ 15 min | 14.14 | 96.3 | 175.4 | 45.1 | 2 h | |
| Lentil Treatment | Control Treatment | Outcomes | |||||||||||||||
|---|---|---|---|---|---|---|---|---|---|---|---|---|---|---|---|---|---|
| Study | Participants | Lentil Serving Size (g) | Protein (g) | DF (g) | CHOav (g) | TC (g) † | Control Serving (g) | Protein (g) | DF (g) | AC (g) | TC (g) † | BG Cmax Lentil Group | BG Cmax Control Group | BG AUC Lentil Group (mmol× min/L) | BG AUC Control group (mmol× min/L) | Relative Difference in BG AUC (%) | BG AUC Time Period |
| Akhtar 1987 [16] | 14 adults aged 52.5 ± 2.46 years, BMI 24.3 ± 1.13 kg/m2 | 89.3 | 24.6 | 4.5 | - | 25 | 110 | 15.1 | 1.5 | - | 50 | 11.2 @ 30 min | 14.0 @ 30 min | 95.5 | 215.5 | 55.7 | 3 h |
| Bornet, Costagliola, Rizkalla, Blayo, Fontvieille, Haardt, Letanoux, Tchobroutsky and Slama, 1987 [19] | 18 adults aged 57 ± 2 years, BMI 27.9 ± 1.1 kg/m2 | 225 | 20.5 | 3.25 | 50 | 53.25 | - | - | - | 50 | 50 | 2.1 @ 120 min † | 6.1 @ 60 min † | - | - | - | - |
| Coulston, Hollenbeck, Liu, Williams, Starich, Mazzaferri and Reaven, 1984 [27] | 8 adults aged 59 ± 2 years, BMI 27.3 ± 0.6 kg/m2 | 49.9 ** | 12.3 | 5.8 | 30 | 35.8 | - | 3.7 | 4.1 | 38.2 | 34.1 | 13.7 @ 120 min † | 17.5 @ 120 min † | 2065 ‡ | 2731 ‡ | 24.4 | 3 h |
| Jenkins, Wolever, Jenkins, Thorne, Lee, Kalmusky, Reichert and Wong, 1983 [28] | 12 adults aged 67 ± 2 years, 77.1 ± 4.4 kg | 297.5 * | 22.4 | 11 | - | 50 | - | 22.1 | 7.3 | - | 51.2 | 3.0 @ 120 min | 6.2 @ 90 min | 359 | 806 | 55.5 | 3 h |
| Jenkins, Wolever, Taylor, Ghafari, Jenkins, Barker and Jenkins, 1980 [29] | 6 adults aged 43 ± 5 years | 129.8 * | 38.8 | 10 | - | 42.5 | - | 35.5 | 9.3 | - | 43.9 | 1.1 @ 30 min | 4.7 @ 60 min | - | - | - | - |
| Krezowski, Nuttall, Gannon, Billington and Parker, 1987 [18] | 8 male untreated diabetics aged 65 ± 2 years | 297.5 * | 22.4 | 11 | - | 50 | - | - | - | - | 50 | 1.9 @ 120 min † | 7.4 @ 60 min † | 380 ‡ | 1176 ‡ | 67.7 | 5 h |
| Lentil Treatment | Control Treatment | Outcomes | ||||||||||||||
|---|---|---|---|---|---|---|---|---|---|---|---|---|---|---|---|---|
| Study | Participants | Lentil Serving Size (g) | Protein (g) | DF (g) | TC (g) | Control Serving (g) | Protein (g) | DF (g) | TC (g) | Insulin Cmax Lentil Group | Insulin Cmax Control Group | Relative Difference Insulin Cmax (%) | Insulin AUC Lentil Group | Insulin AUC Control Group | Relative Reduction Insulin AUC (%) | Insulin AUC Time Period |
| Bennett, Chilibeck, Barss, Vatanparast, Vandenberg and Zello 2012 [21] | 14 recreational soccer players aged 22–27 years, BMI 22 kg/m2 | 444 | 36 | 24 | 129 | 436 | 16 | 7 | 99 | 135 pmol/L | 125 pmol/L | 8.0 | - | - | - | - |
| Bornet, Costagliola, Rizkalla, Blayo, Fontvieille, Haardt, Letanoux, Tchobroutsky and Slama, 1987 [19] | 18 type 2 diabetics | 225 | 20.5 | 3.25 | 50 | - | - | 50 | 216 pmol/L † | 283 pmol/L † | 23.7 | - | - | - | - | |
| Jenkins, Wolever, Taylor, Griffiths, Krzeminska, Lawrie, Bennett, Goff, Sarson and Bloom, 1982 [10] | Healthy adults (5 men, 2 women) | 715 * | 57 | 29 | 156 | 280 | 57 | 26 | 154 | 100 pmol/L | 230 pmol/L | 56.5 | - | - | - | - |
| Krezowski, Nuttall, Gannon, Billington and Parker, 1987 [18] | 8 male untreated diabetics | 297 * | 22.4 | 11 | 50 | 120 | 10.6 | 10.2 | 50 | 174 pmol/L † | 251 pmol/L † | 29.7 | 44 µU×h/mL | 91 µU × h/mL | 51.7 | 5 h |
| MacPherson 2018 [11] | Healthy adult males and females aged 18–40 years, BMI 20–30 kg/m2 | 100 | 9.88 | 5.55 | 26.3 | 54.6 | 2.23 | 1.07 | 13.6 | 50 pmol/L | 80 pmol/L | 37.5 | 1100 nmol × min/L | 2000 nmol × min/L | 45 | 2 h |
| Tovar, Granfeldt and Bjorck, 1992 [25] | 10 healthy adults aged 36 ± 2.5 years, BMI 22.4 ± 0.9 kg/m2 | 70 | 17.6 | 11.1 | 41.1 | 70 | 19 | 1.4 | 31.4 | 240 pmol/L | 270 pmol/L | 11.11 | - | - | - | - |
4. Discussion
5. Summary
Author Contributions
Funding
Acknowledgments
Conflicts of Interest
References
- The Emerging Risk Factors Collaboration. Diabetes mellitus, fasting blood glucose concentration, and risk of vascular disease: A collaborative meta-analysis of 102 prospective studies. Lancet 2010, 375, 2215–2222. [Google Scholar] [CrossRef] [Green Version]
- Diabetes Canada Clinical Practice Guidelines Expert Commitee. 2018 Clinical Practice Guidelines. Can. J. Diabetes 2018, 42, S1–S325. [Google Scholar] [CrossRef] [Green Version]
- Imran, S.A.; Agarwal, G.; Bajaj, H.S.; Ross, S. Targets for Glycemic Control. Can. J. Diabetes 2018, 42, S42–S46. [Google Scholar] [CrossRef] [PubMed] [Green Version]
- Ramdath, D.D.; Liu, Q.; Donner, E.; Hawke, A.; Kalinga, D.; Winberg, J.; Wolever, T.M.S. Investigating the relationship between lentil carbohydrate fractions and in vivo postprandial blood glucose response by use of the natural variation in starch fractions among 20 lentil varieties. Food Funct. 2017, 8, 3783–3791. [Google Scholar] [CrossRef]
- Zhang, B.; Deng, Z.; Ramdath, D.D.; Tang, Y.; Chen, P.X.; Liu, R.; Liu, Q.; Tsao, R. Phenolic profiles of 20 Canadian lentil cultivars and their contribution to antioxidant activity and inhibitory effects on alpha-glucosidase and pancreatic lipase. Food Chem. 2015, 172, 862–872. [Google Scholar] [CrossRef] [PubMed]
- Russell, W.R.; Baka, A.; Bjrck, I.; Delzenne, N.; Gao, D.; Griffiths, H.R.; Hadjilucas, E.; Juvonen, K.; Lahtinen, S.; Lansink, M.; et al. Impact of diet composition on blood glucose regulation. Crit. Rev. Food Sci. Nutr. 2016, 56, 541–590. [Google Scholar] [CrossRef]
- Jenkins, D.J.A.; Kendall, C.W.C.; Augustin, L.S.A.; Mitchell, S.; Sahye-Pudaruth, S.A. Effect of legumes as part of a low glycemic indediet on glycemic control and cardiovascular risk factors in Type 2 Diabetes mellitus. Arch. Intern. Med. 2012, 172, 1653. [Google Scholar] [CrossRef] [Green Version]
- Sievenpiper, J.L.; Chan, C.B.; Dworatzek, P.D.; Freeze, C.; Williams, S.L. Nutrition Therapy. Can. J. Diabetes 2018, 42, S64–S79. [Google Scholar] [CrossRef]
- Sievenpiper, J.L.; Kendall, C.W.C.; Esfahani, A.; Wong, J.M.W.; Carleton, A.J.; Jiang, H.Y.; Bazinet, R.P.; Vidgen, E.; Jenkins, D.J.A. Effect of non-oil-seed pulses on glycaemic control: A systematic review and meta-analysis of randomised controlled experimental trials in people with and without diabetes. Diabetologia 2009, 52, 1479–1495. [Google Scholar] [CrossRef] [Green Version]
- Jenkins, D.J.; Wolever, T.M.; Taylor, R.H.; Griffiths, C.; Krzeminska, K.; Lawrie, J.A.; Bennett, C.M.; Goff, D.V.; Sarson, D.L.; Bloom, S.R. Slow release dietary carbohydrate improves second meal tolerance. Am. J. Clin. Nutr. 1982, 35, 1339–1346. [Google Scholar] [CrossRef] [Green Version]
- MacPherson, B.A. The Effect of Green and Red Lentils in Half and Quarter-Cup Serving Sizes on Acute Postprandial Blood Glucose and Plasma Insulin Response Compared to Multiple Starchy Controls in Healthy Adults. Master’ Thesis, University of Guelph, Guelph, ON, Canada, 2018. [Google Scholar]
- Wolever, T.M.S.; Bolognesi, C. Prediction of glucose and insulin responses of normal subjects after consuming mixed meals varying in energy, protein, fat, carbohydrate and glycemic index. J. Nutr. 1996, 126, 2807–2812. [Google Scholar]
- Hanefeld, M.; Cagatay, M.; Petrowitsch, T.; Neuser, D.; Petzinna, D.; Rupp, M. Acarbose reduces the risk for myocardial infarction in type 2 diabetic patients: Meta-analysis of seven long-term studies. Eur. Heart J. 2004, 25, 10–16. [Google Scholar] [CrossRef] [Green Version]
- Moher, D.; Liberati, A.; Tetzlaff, J.; Altman, D.G.; The PRISMA Group. Preferred Reporting Items for Systematic Reviews and Meta-Analyses: The PRISMA Statement. PLOS Med. 2009, 6, e1000097. [Google Scholar] [CrossRef] [PubMed] [Green Version]
- Ramdath, D.D.; Wolever, T.M.S.; Siow, Y.C.; Ryland, D.; Hawke, A.; Taylor, C.; Zahradka, P.; Aliani, M. Effect of processing on postprandial glycemic response and consumer acceptability of lentil-containing food items. Foods 2018, 7, 76. [Google Scholar] [CrossRef] [Green Version]
- Akhtar, M.S.; Asim, A.H.; Wolever, T.M.S. Blood glucose responses to traditional pakistani dishes taken by normal and diabetic subjects. Nutr. Res. 1987, 7, 696–706. [Google Scholar] [CrossRef]
- Wolever, T.M.S.; Jenkins, D.J.A.; Ocana, A.M.; Rao, V.A.; Collier, G.R. Second-meal effect: Low-glycemic-index foods eaten at dinner improve subsequent breakfast glycemic response. Am. J. Clin. Nutr. 1988, 48, 1041–1047. [Google Scholar] [CrossRef]
- Krezowski, P.A.; Nuttall, F.Q.; Gannon, M.C.; Billington, C.J.; Parker, S. Insulin and glucose responses to various starch-containing foods in Type II diabetic subjects. Diabetes Care 1987, 10, 205–212. [Google Scholar] [CrossRef]
- Bornet, F.R.J.; Costagliola, D.; Rizkalla, S.W.; Blayo, A.; Fontvieille, A.M.; Haardt, M.J.; Letanoux, M.; Tchobroutsky, G.; Slama, G. Insulinemic and glycemic indexes of six starch-rich foods taken alone and in a mixed meal by type 2 diabetics. Am. J. Clin. Nutr. 1987, 45, 588–595. [Google Scholar] [CrossRef] [PubMed]
- Anderson, G.H.; Liu, Y.; Smith, C.E.; Liu, T.T.; Nunez, M.F.; Mollard, R.C.; Luhovyy, B.L. The acute effect of commercially available pulse powders on postprandial glycaemic response in healthy young men. Br. J. Nutr. 2014, 112, 1966–1973. [Google Scholar] [CrossRef] [Green Version]
- Bennett, C.B.; Chilibeck, P.D.; Barss, T.; Vatanparast, H.; Vandenberg, A.; Zello, G.A. Metabolism and performance during extended high-intensity intermittent exercise after consumption of low-and high-glycaemic index pre-exercise meals. Br. J. Nutr. 2012, 108, S81–S90. [Google Scholar] [CrossRef]
- Jenkins, D.J.; Ghafari, H.; Wolever, T.M.; Taylor, R.H.; Jenkins, A.L.; Barker, H.M.; Fielden, H.; Bowling, A.C. Relationship between rate of digestion of foods and post-prandial glycaemia. Diabetologia 1982, 22, 450–455. [Google Scholar] [CrossRef] [PubMed] [Green Version]
- Mollard, R.C.; Wong, C.L.; Luhovyy, B.L.; Anderson, G.H. First and second meal effects of pulses on blood glucose, appetite, and food intake at a later meal. Appl. Physiol. Nutr. Metab. 2011, 36, 634–642. [Google Scholar] [CrossRef] [PubMed]
- Mollard, R.C.; Wong, C.L.; Luhovyy, B.L.; Cho, F.; Anderson, G.H. Second-meal effects of pulses on blood glucose and subjective appetite following a standardized meal 2 h later. Appl. Physiol. Nutr. Metab. 2014, 39, 849–851. [Google Scholar] [CrossRef] [PubMed]
- Tovar, J.; Granfeldt, Y.; Bjrck, I.M. Effect of processing on blood glucose and insulin responses to starch in legumes. J. Agric. Food Chem. 1992, 40, 1846–1851. [Google Scholar] [CrossRef]
- Wong, C.L.; Mollard, R.C.; Zafar, T.A.; Luhovyy, B.L.; Anderson, G.H. Food intake and satiety following a serving of pulses in young men: Effect of processing, recipe, and pulse variety. J. Am. Coll. Nutr. 2009, 28, 543–552. [Google Scholar] [CrossRef]
- Coulston, A.M.; Hollenbeck, C.B.; Liu, G.C.; Williams, R.A.; Starich, G.H.; Mazzaferri, E.L.; Reaven, G.M. Effect of source of dietary carbohydrate on plasma glucose, insulin, and gastric inhibitory polypeptide responses to test meals in subjects with noninsulin-dependent diabetes mellitus. Am. J. Clin. Nutr. 1984, 40, 965–970. [Google Scholar] [CrossRef]
- Jenkins, D.J.; Wolever, T.M.; Jenkins, A.L.; Thorne, M.J.; Lee, R.; Kalmusky, J.; Reichert, R.; Wong, G.S. The glycaemic index of foods tested in diabetic patients: A new basis for carbohydrate exchange favouring the use of legumes. Diabetologia 1983, 24, 257–264. [Google Scholar] [CrossRef] [Green Version]
- Jenkins, D.J.; Wolever, T.M.; Taylor, R.H.; Ghafari, H.; Jenkins, A.L.; Barker, H.; Jenkins, M.J. Rate of digestion of foods and postprandial glycaemia in normal and diabetic subjects. Br. Med. J. 1980, 281, 14. [Google Scholar] [CrossRef] [Green Version]
- Brand-Miller, J.; Hayne, S.; Petocz, P.; Colagiuri, S. Low-glycemic index diets in the management of diabetes: A meta-analysis of randomized controlled trials. Diabetes Care 2003, 26, 2261–2267. [Google Scholar] [CrossRef] [Green Version]
- Wolever, T.M.S.; Gibbs, A.L.; Mehling, C.; Chiasson, J.-L.; Connelly, P.W.; Josse, R.G.; Leiter, L.A.; Maheux, P.; Rabasa-Lhoret, R.; Rodger, N.W.; et al. The Canadian Trial of Carbohydrates in Diabetes (CCD), a 1-y controlled trial of low-glycemic-index dietary carbohydrate in type 2 diabetes: No effect on glycated hemoglobin but reduction in C-reactive protein. Am. J. Clin. Nutr. 2008, 87, 114–125. [Google Scholar] [CrossRef] [Green Version]
- Draft Guidance Document on Food Health Claims Related to the Reduction in Post-Prandial Glycaemic Response; Bureau of Nutritional Sciences, Food Directorate, Health Products and Food Branch, Health Canada: Ottawa, ON, Canada, 2013.
- Moravek, D.; Duncan, A.M.; VanderSluis, L.B.; Turkstra, S.J.; Rogers, E.J.; Wilson, J.M.; Hawke, A.; Ramdath, D.D. Carbohydrate replacement of rice or potato with lentils reduces the postprandial glycemic response in healthy adults in an acute, randomized, crossover trial. J. Nutr. 2018, 148, 535–541. [Google Scholar] [CrossRef] [PubMed] [Green Version]
- Shanik, M.H.; Xu, Y.; Skrha, J.; Dankner, R.; Zick, Y.; Roth, J. Insulin resistance and hyperinsulinemia: Is hyperinsulinemia the cart or the horse? Diabetes Care 2008, 31, S262–S268. [Google Scholar] [CrossRef] [PubMed] [Green Version]
- Naseer, S.; Arshad, M.; Imran, A.; Arshad, M.S.; Saeed, F.; Ahmad, A.; Imran, M.; Naeem, U. Acute effect of pulses based functional muffins on food intake, Postprandial glucose and appetite regulation in healthy females. Prog. Nutr. 2018, 21, 378–387. [Google Scholar] [CrossRef]
- Nuttall, F.Q.; Mooradian, A.D.; Gannon, M.C.; Billington, C.; Krezowski, P. Effect of protein ingestion on the glucose and insulin response to a standardized oral glucose load. Diabetes Care 1984, 7, 465–470. [Google Scholar] [CrossRef]
- Gannon, M.C.; Nuttall, F.Q. Control of blood glucose in type 2 diabetes without weight loss by modification of diet composition. Nutr. Metab. 2006, 3, 16. [Google Scholar] [CrossRef] [Green Version]
- Chung, H.J.; Liu, Q.; Hoover, R.; Warkentin, T.D.; Vandenberg, B. In vitro starch digestibility, expected glycemic index, and thermal and pasting properties of flours from pea, lentil and chickpea cultivars. Food Chem. 2008, 111, 316–321. [Google Scholar] [CrossRef]
- Moreno-Valdespino, C.A.; Luna-Vital, D.; Camacho-Ruiz, R.M.; Mojica, L. Bioactive proteins and phytochemicals from legumes: Mechanisms of action preventing obesity and type-2 diabetes. Food Res. Int. 2020, 130, 108905. [Google Scholar] [CrossRef]
- Post, R.E.; Mainous, A.G.; King, D.E.; Simpson, K.N. Dietary fiber for the treatment of type 2 diabetes mellitus: A meta-analysis. J. Am. Board Fam. Med. 2012, 25, 16–23. [Google Scholar] [CrossRef] [Green Version]
- Wood, P.J.; Braaten, J.T.; Scott, F.W.; Riedel, K.D.; Wolynetz, M.S.; Collins, M.W. Effect of dose and modification of viscous properties of oat gum on plasma glucose and insulin following an oral glucose load. Br. J. Nutr. 1994, 72, 731–743. [Google Scholar] [CrossRef]
- Nuttall, F.Q. Dietary fiber in the management of diabetes. Diabetes 1993, 42, 503–509. [Google Scholar] [CrossRef]
- Gannon, M.C.; Nuttall, F.Q.; Westphal, S.A.; Neil, B.J.; Seaquist, E.R. Effects of dose of ingested glucose on plasma metabolite and hormone responses in type II diabetic subjects. Diabetes Care 1989, 12, 544–552. [Google Scholar] [CrossRef] [PubMed]
- Wolever, T.M.; Katzman-Relle, L.; Jenkins, A.L.; Vuksan, V.; Josse, R.G.; Jenkins, D.J. Glycaemic index of 102 complex carbohydrate foods in patients with diabetes. Nutr. Res. 1994, 14, 651–669. [Google Scholar] [CrossRef]
- Trout, D.L.; Behall, K.M.; Osilesi, O. Prediction of glycemic index for starchy foods. Am. J. Clin. Nutr. 1993, 58, 873–878. [Google Scholar] [CrossRef] [PubMed]


Publisher’s Note: MDPI stays neutral with regard to jurisdictional claims in published maps and institutional affiliations. |
© 2022 by the Her Majesty the Queen in Right of Canada as represented by the Agriculture and Agri-Food Canada. Licensee MDPI, Basel, Switzerland. This article is an open access article distributed under the terms and conditions of the Creative Commons Attribution (CC BY) license (https://creativecommons.org/licenses/by/4.0/).
Share and Cite
Clarke, S.T.; Sarfaraz, S.; Qi, X.; Ramdath, D.G.; Fougere, G.C.; Ramdath, D.D. A Review of the Relationship between Lentil Serving and Acute Postprandial Blood Glucose Response: Effects of Dietary Fibre, Protein and Carbohydrates. Nutrients 2022, 14, 849. https://doi.org/10.3390/nu14040849
Clarke ST, Sarfaraz S, Qi X, Ramdath DG, Fougere GC, Ramdath DD. A Review of the Relationship between Lentil Serving and Acute Postprandial Blood Glucose Response: Effects of Dietary Fibre, Protein and Carbohydrates. Nutrients. 2022; 14(4):849. https://doi.org/10.3390/nu14040849
Chicago/Turabian StyleClarke, Sandra T., Sidra Sarfaraz, Xinye Qi, Davin G. Ramdath, Gregory C. Fougere, and D. Dan Ramdath. 2022. "A Review of the Relationship between Lentil Serving and Acute Postprandial Blood Glucose Response: Effects of Dietary Fibre, Protein and Carbohydrates" Nutrients 14, no. 4: 849. https://doi.org/10.3390/nu14040849
APA StyleClarke, S. T., Sarfaraz, S., Qi, X., Ramdath, D. G., Fougere, G. C., & Ramdath, D. D. (2022). A Review of the Relationship between Lentil Serving and Acute Postprandial Blood Glucose Response: Effects of Dietary Fibre, Protein and Carbohydrates. Nutrients, 14(4), 849. https://doi.org/10.3390/nu14040849