
The Associations of Erythrocyte Fatty Acids with Whole Blood Mineral Elements in Children

 , and
, and
Abstract
:1. Introduction
2. Materials and Methods
2.1. Study Population
2.2. Anthropometric Measurements
2.3. Blood Sample Collection and Analysis
2.4. Minerals Analysis
2.5. Fatty Acids Determination
2.6. Ethics Approval and Consent to Participate
2.7. Statistical Analysis
3. Results
3.1. Baseline Characteristics of the Children
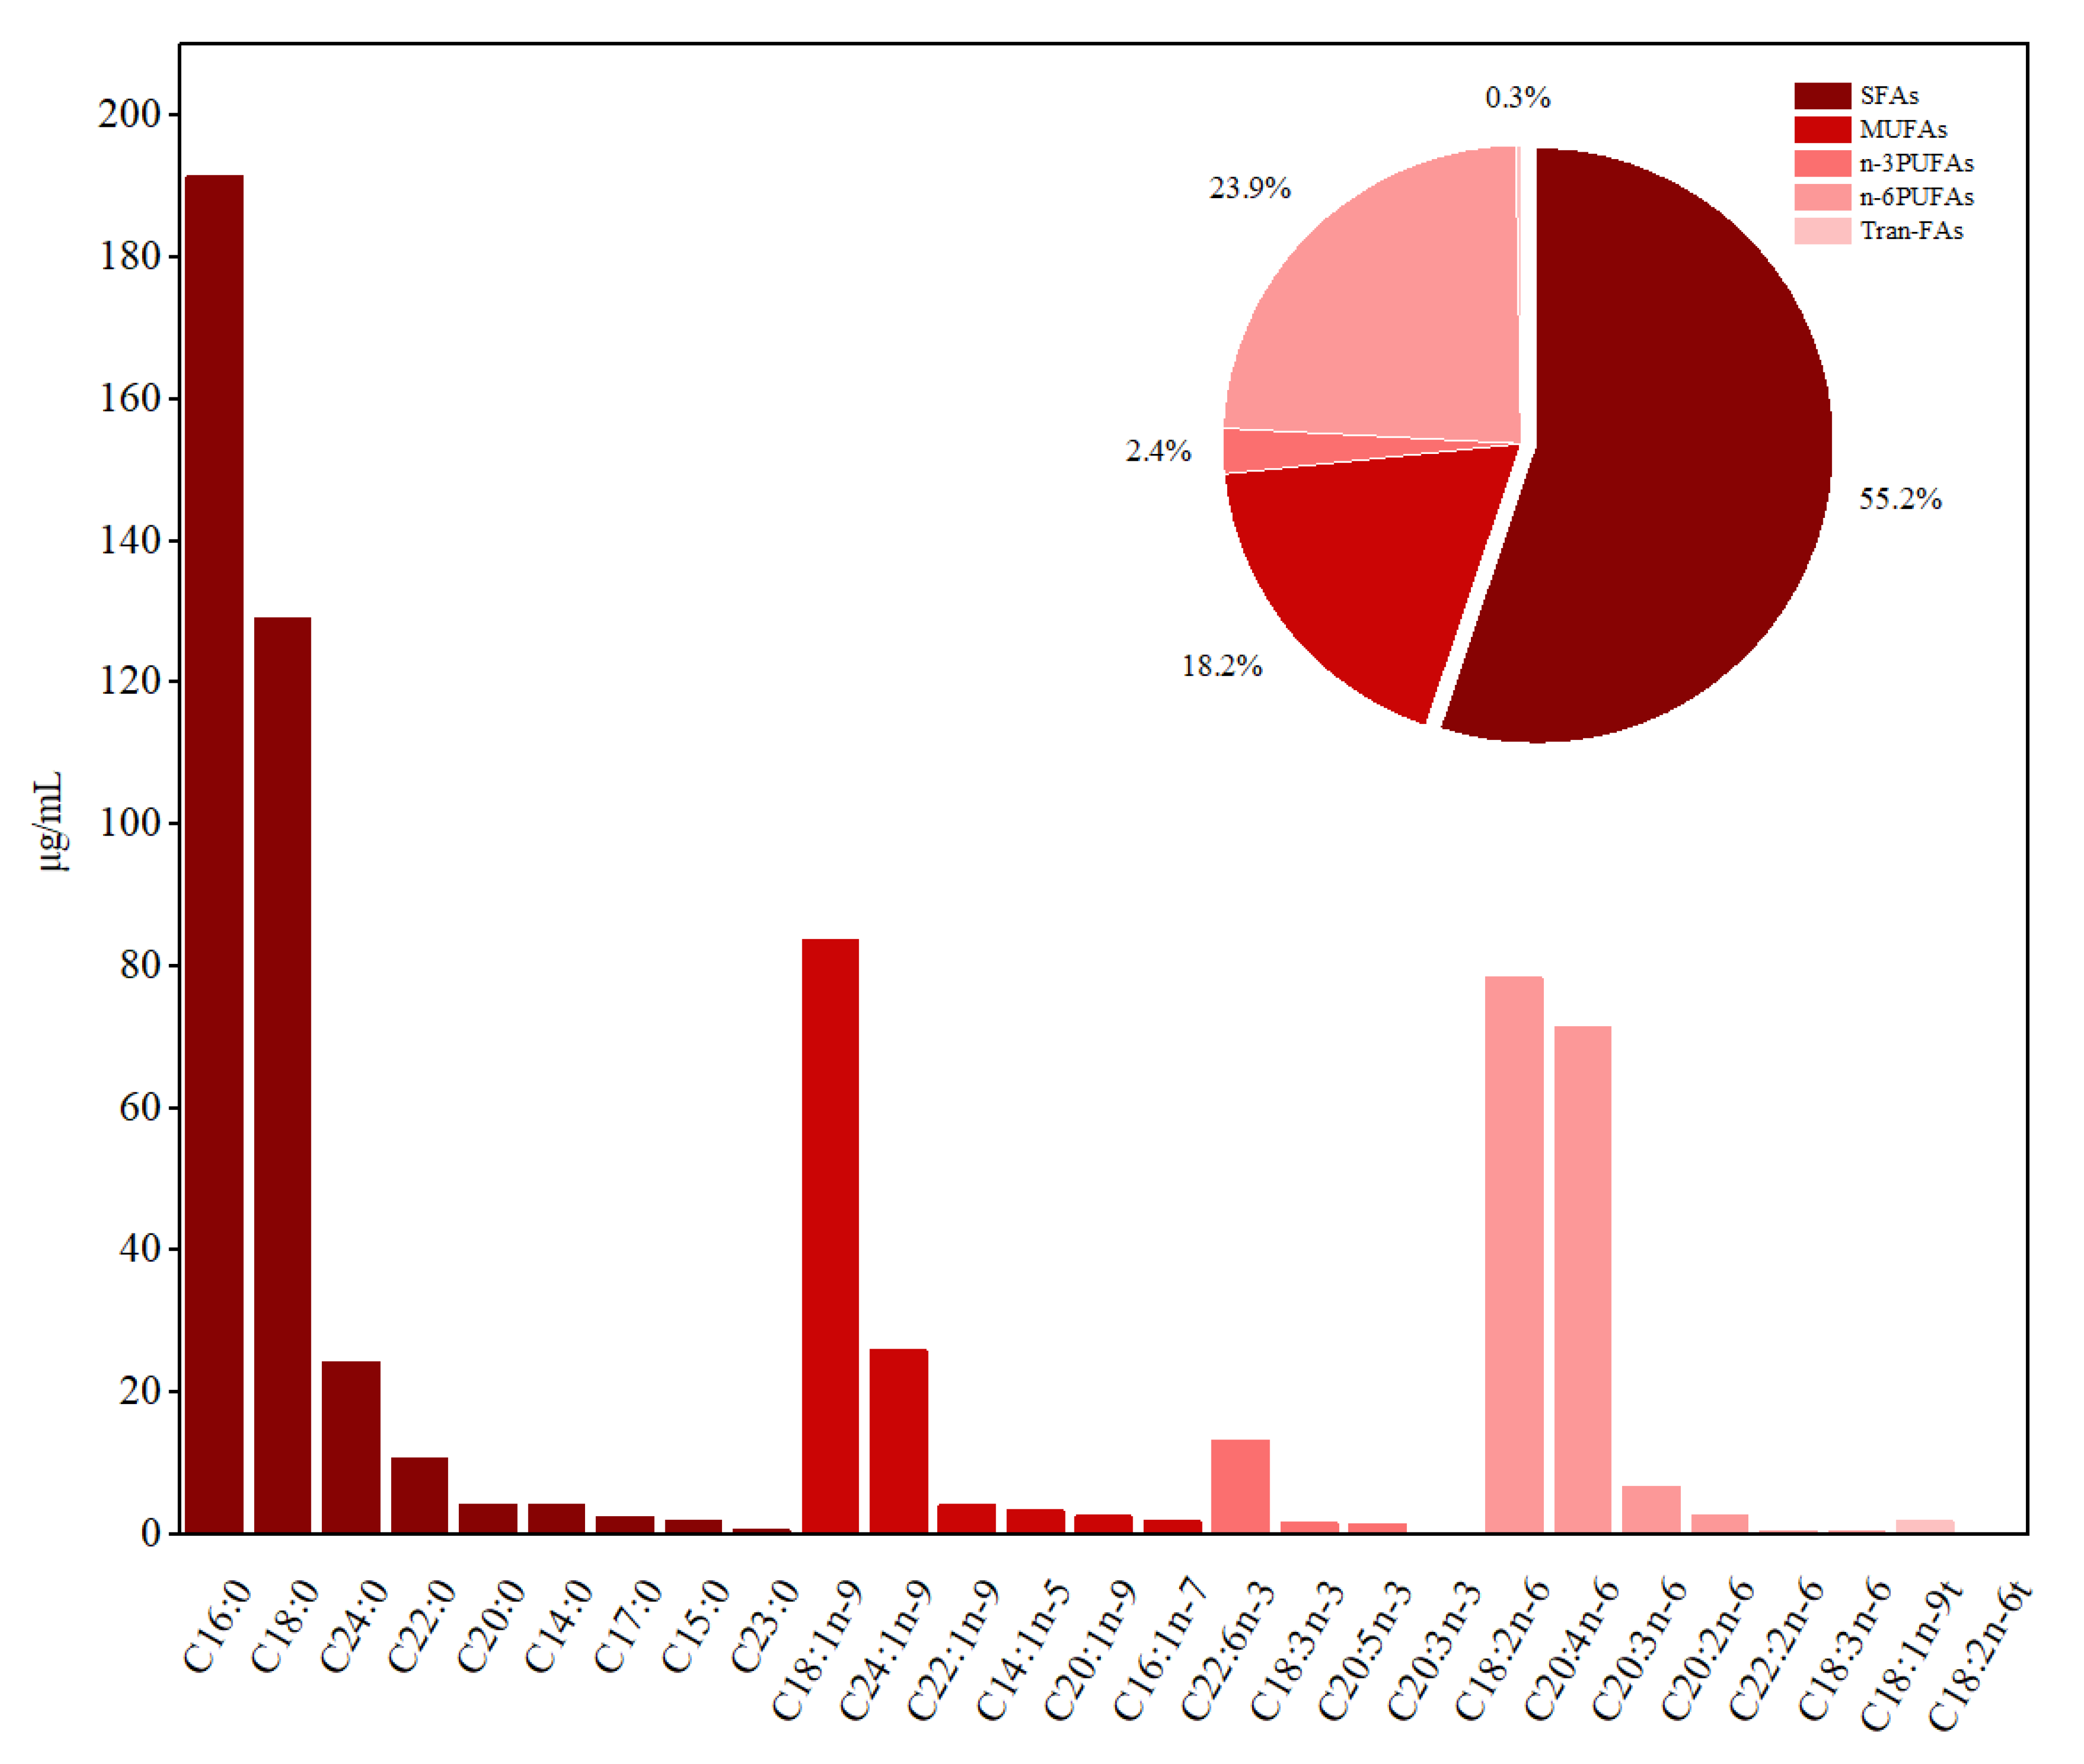
3.2. FAs Composition
3.3. Correlations of Mineral Element and FA Concentrations with Age, BMI, and Plasma Lipid Parameters
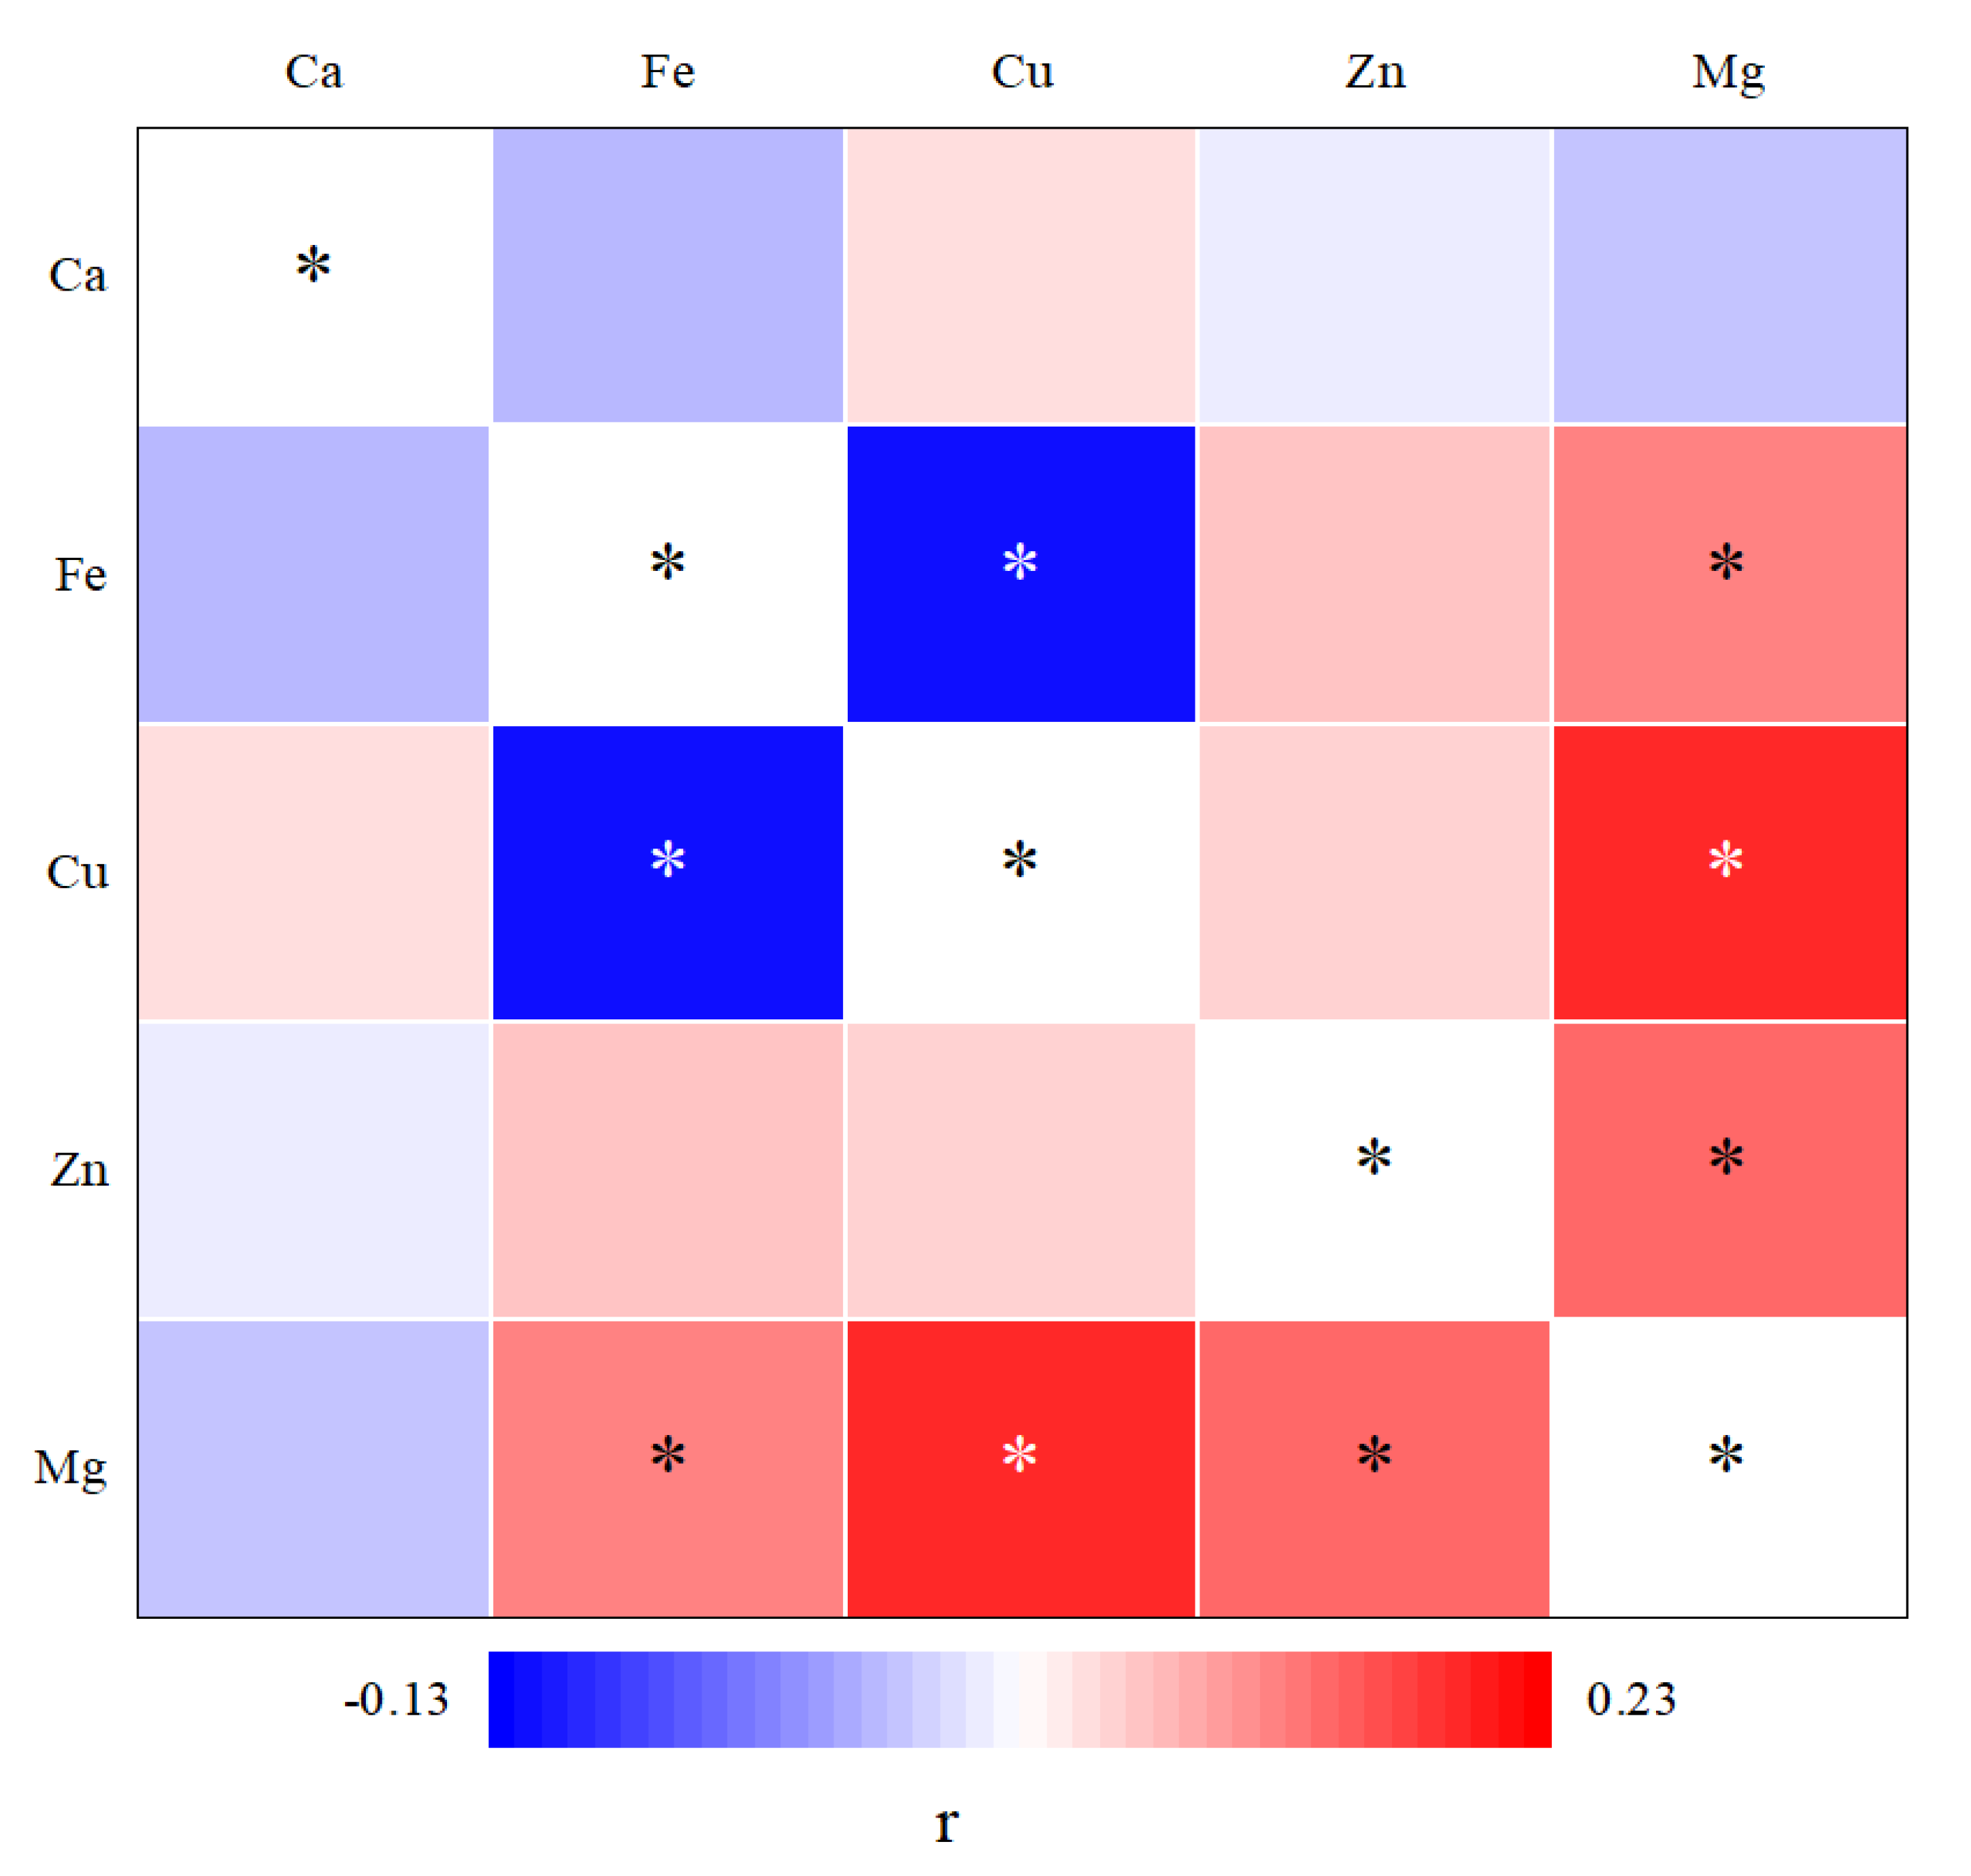
3.4. Correlation of Mineral Element with FA
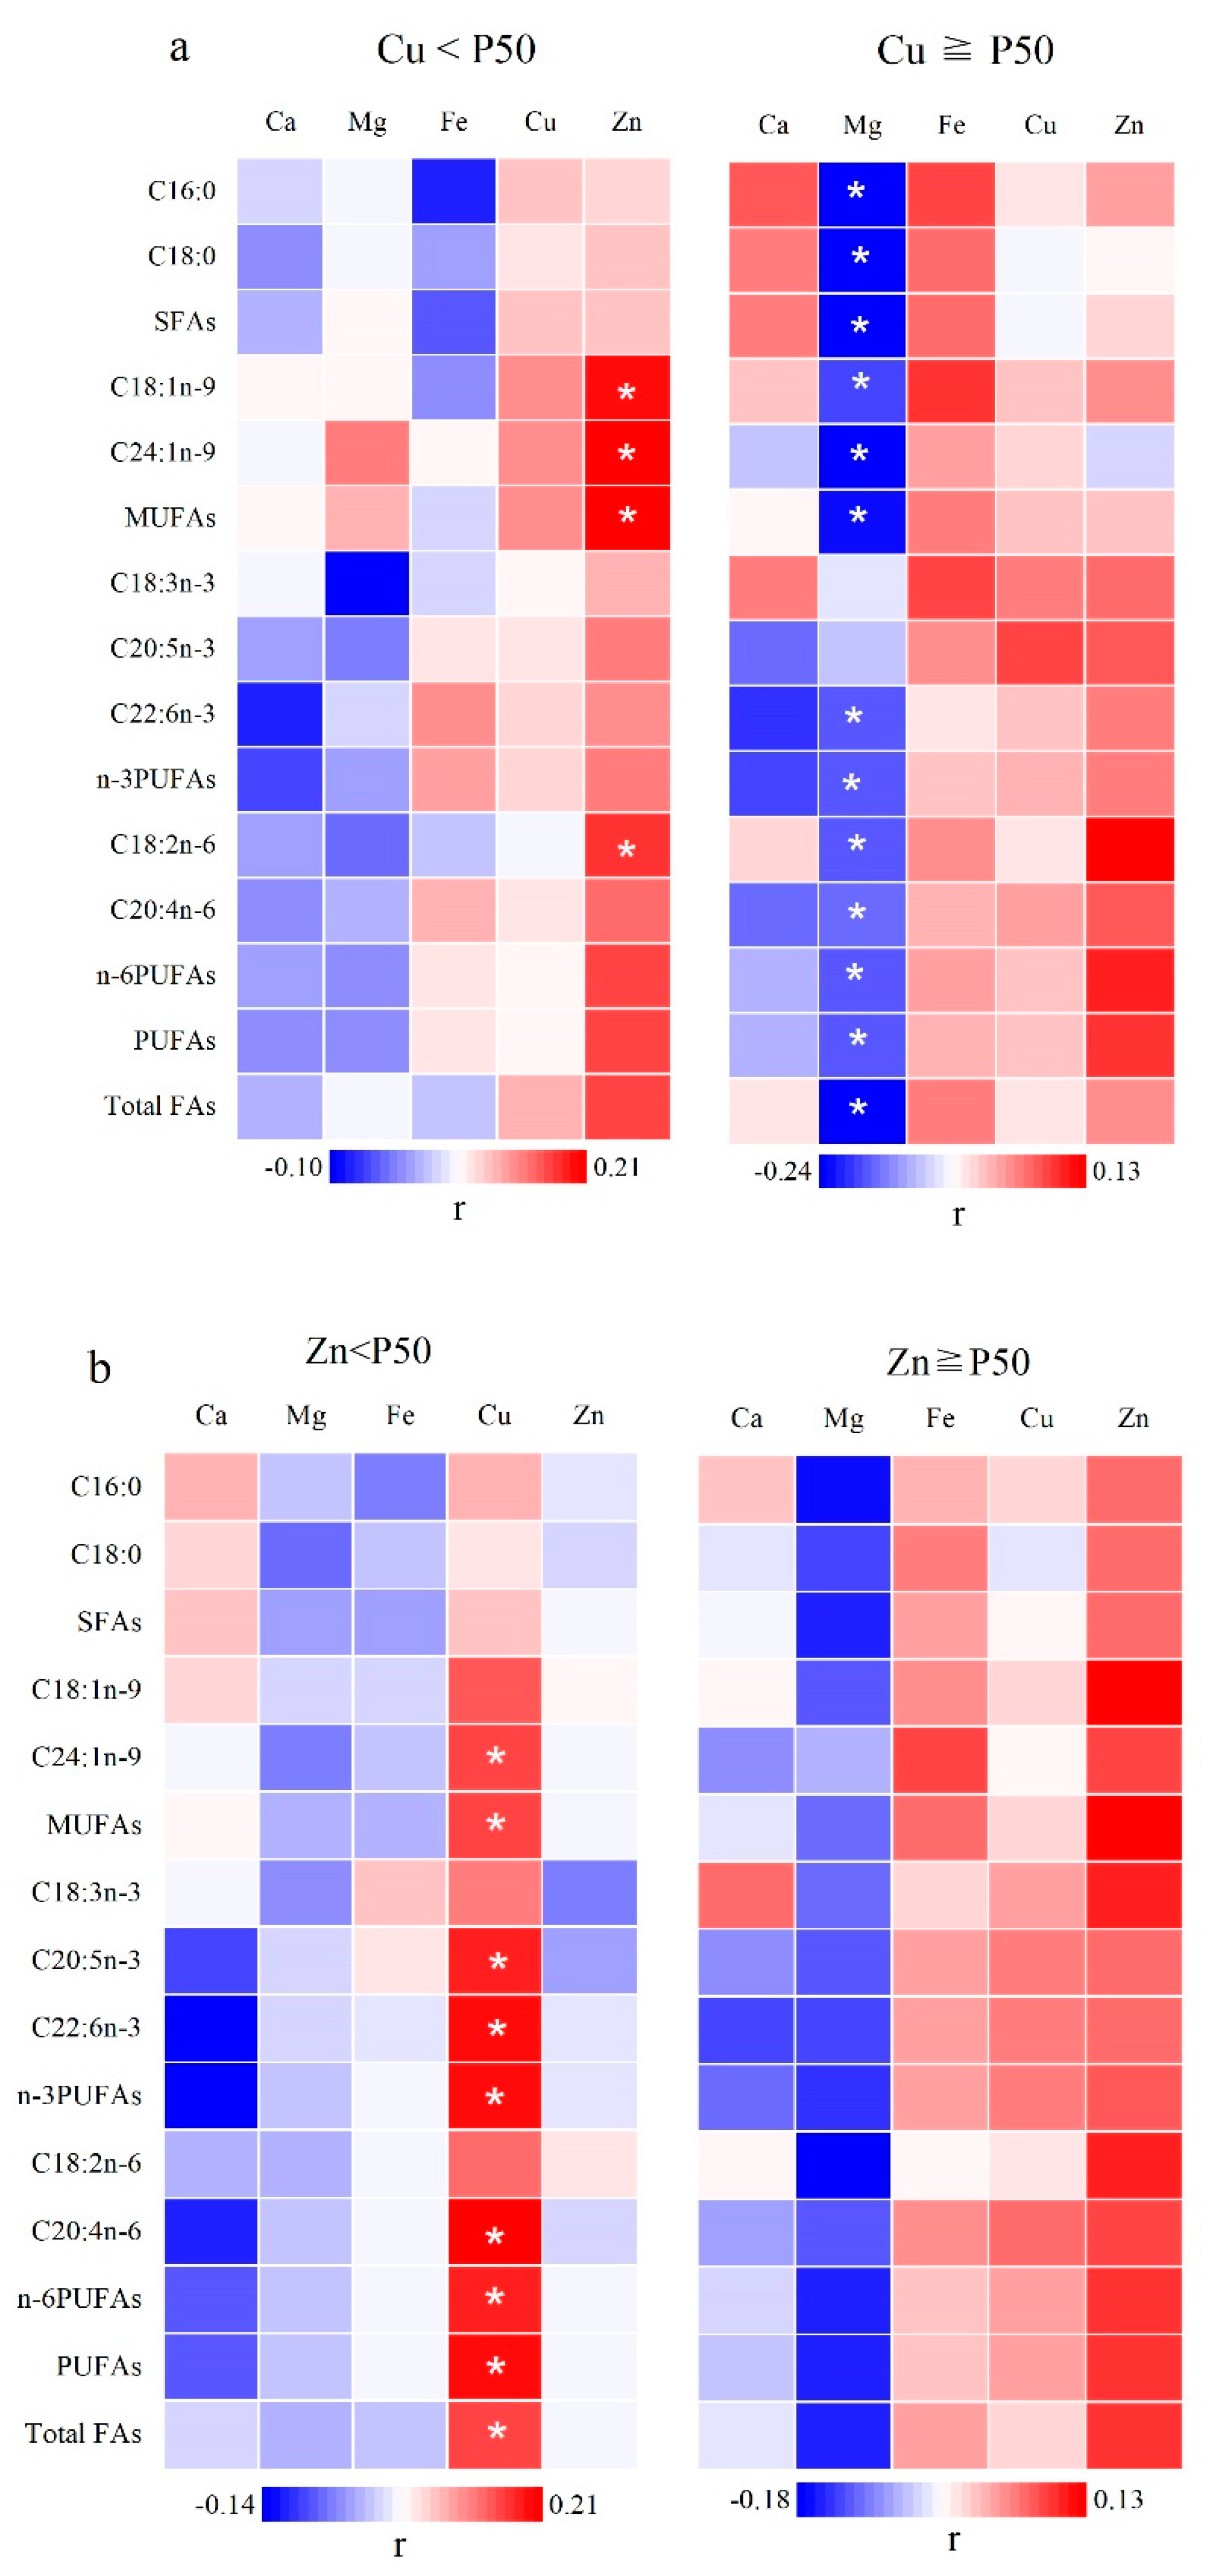
3.5. The Role of the Potential Interactions of Mineral Elements in FA Metabolism
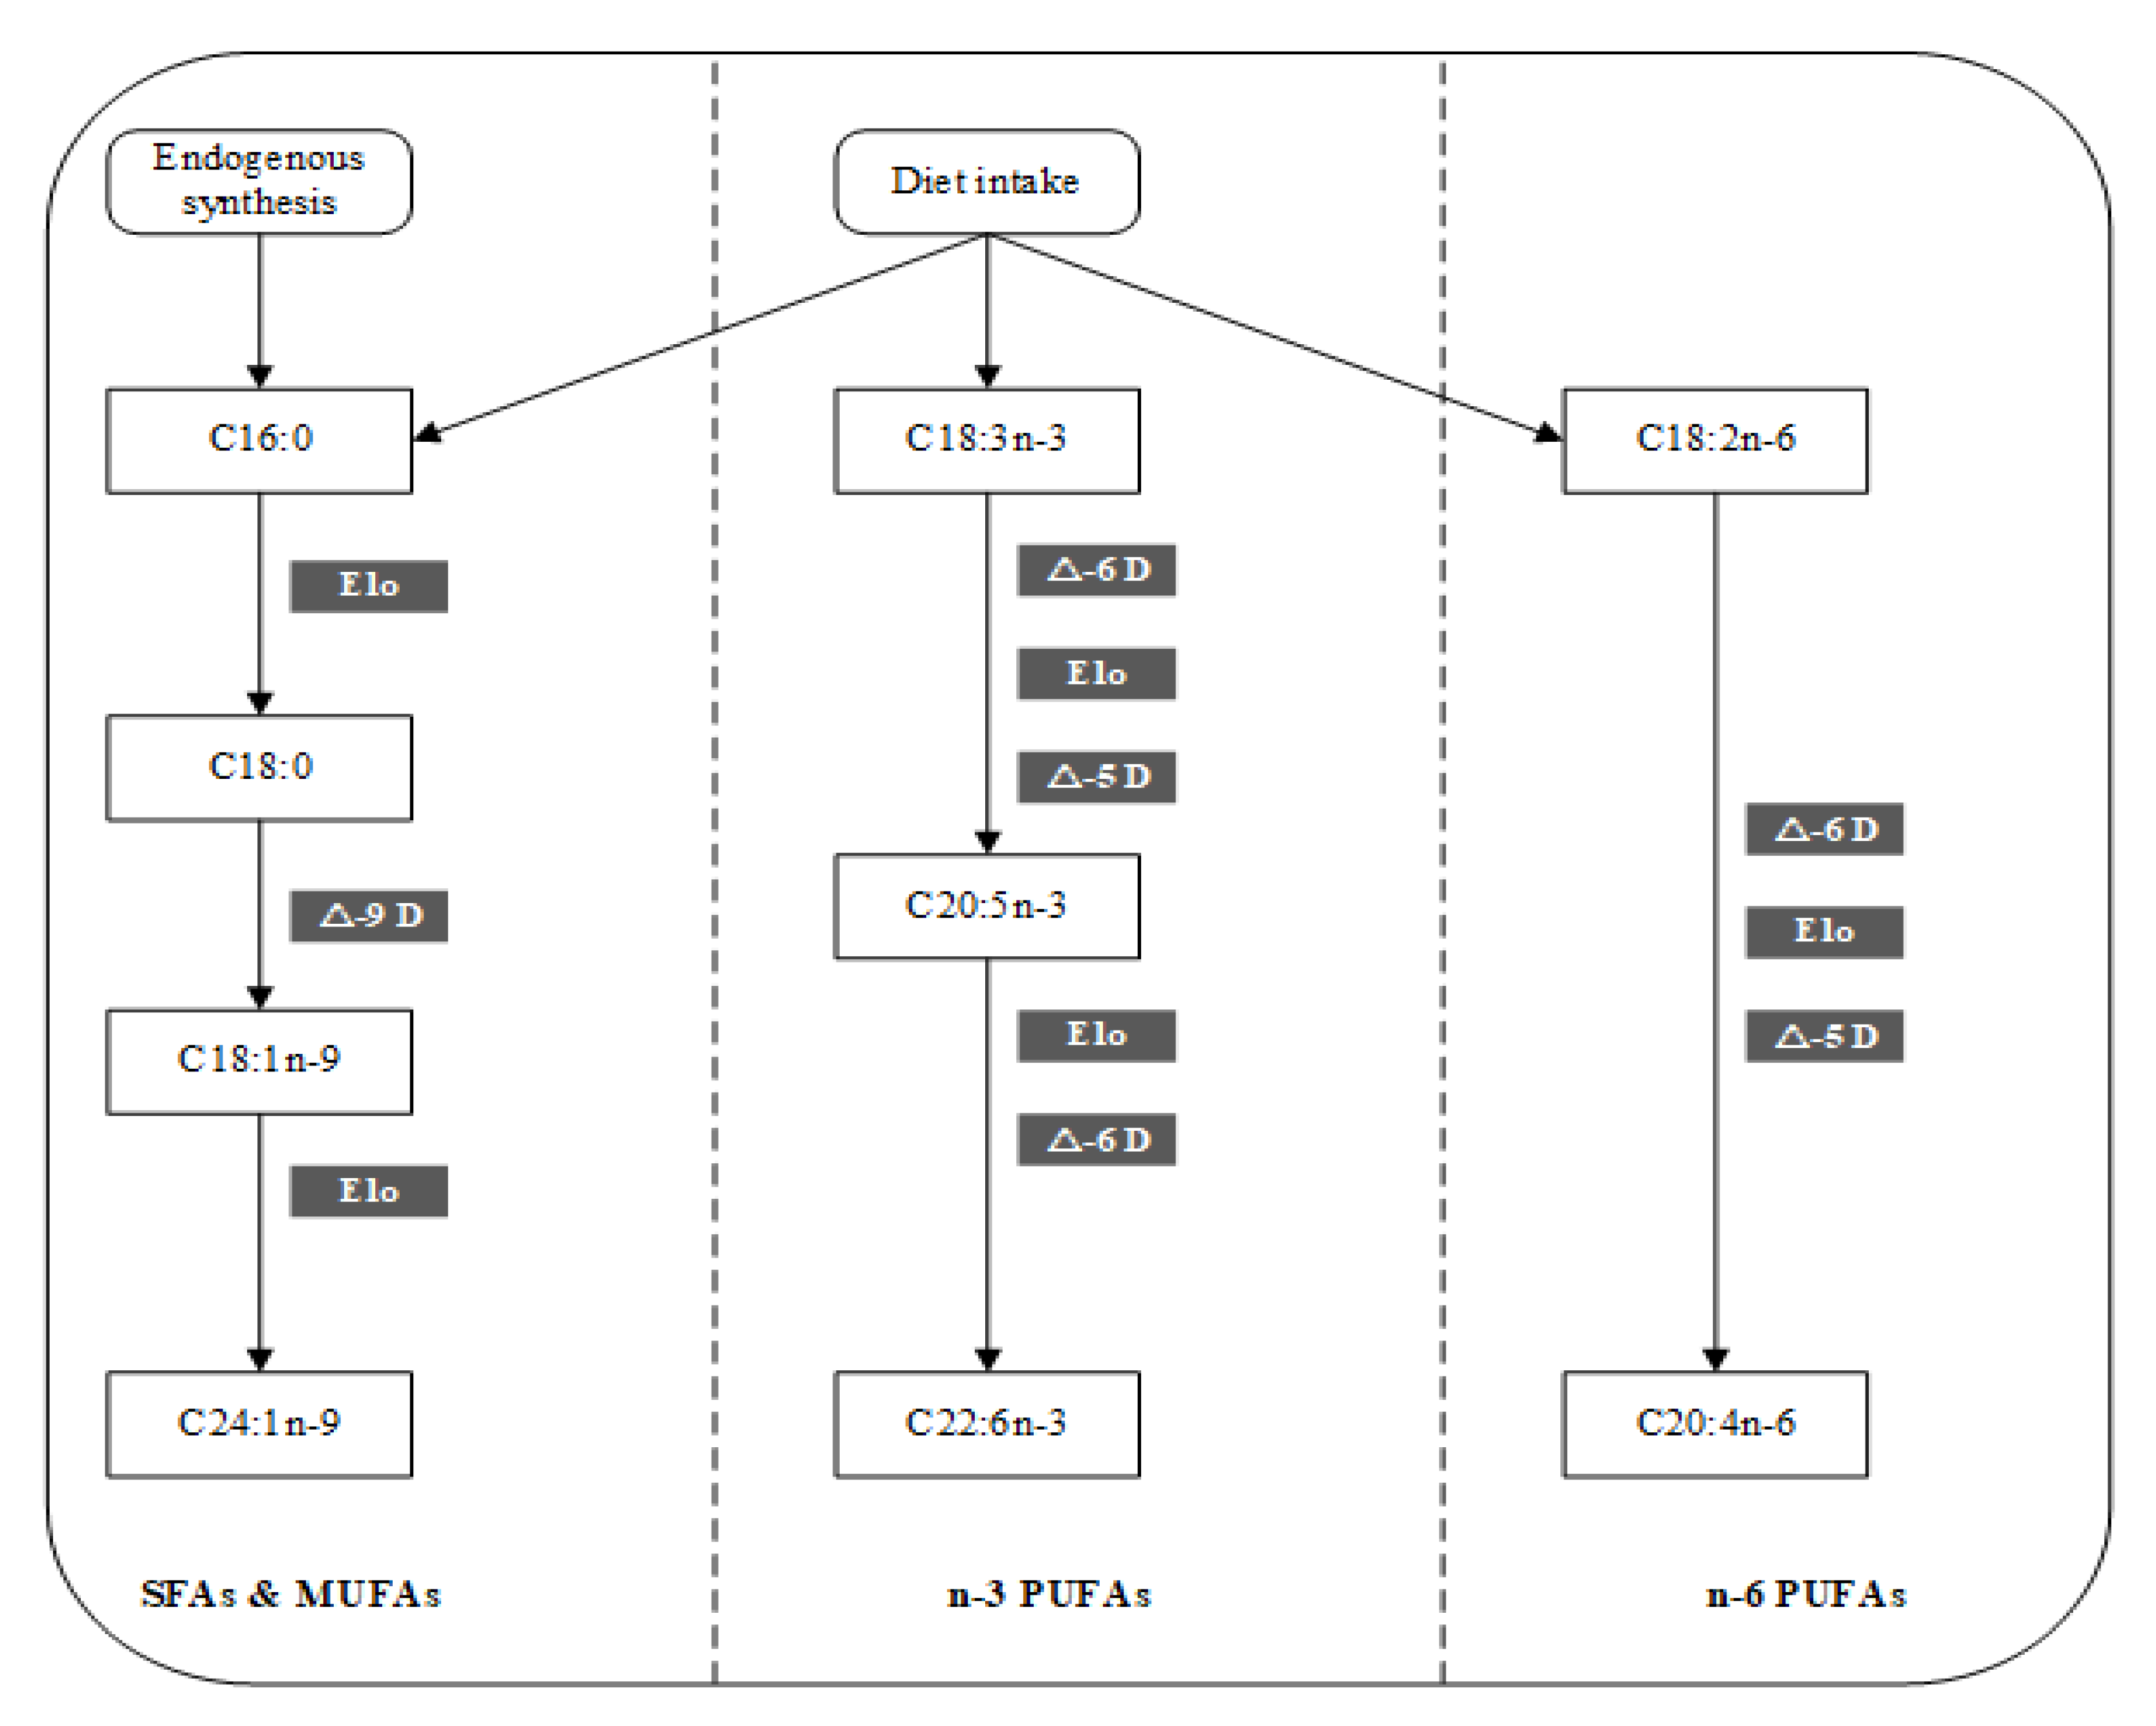
3.6. Potential Mechanisms of the Mineral Elements on FA Metabolism
4. Discussion
5. Conclusions
Supplementary Materials
Author Contributions
Funding
Institutional Review Board Statement
Informed Consent Statement
Data Availability Statement
Conflicts of Interest
References
- Mouillot, T.; Rizk, M.; Pais de Barros, J.P.; Gilloteau, A.; Busson, A.; Bernard-Chabert, B.; Thiefin, G.; Barraud, H.; Bronowicki, J.P.; Richou, C.; et al. Fatty acid composition of the erythrocyte membrane and risk of hepatocellular carcinoma in cirrhotic patients. Aliment Pharmacol. Ther. 2020, 52, 1503–1515. [Google Scholar] [CrossRef] [PubMed]
- Jauregibeitia, I.; Portune, K.; Gaztambide, S.; Rica, I.; Tueros, I.; Velasco, O.; Grau, G.; Martin, A.; Castano, L.; Larocca, A.V.; et al. Molecular differences based on erythrocyte fatty acid profile to personalize dietary strategies between adults and children with obesity. Metabolites 2021, 11, 43. [Google Scholar] [CrossRef] [PubMed]
- Jacek, M.; Hrncirova, D.; Rambouskova, J.; Dlouhy, P.; Tuma, P. Effect of food with low enrichment of N-3 fatty acids in a two-month diet on the fatty acid content in the plasma and erythrocytes and on cardiovascular risk markers in healthy young men. Nutrients 2020, 12, 2207. [Google Scholar] [CrossRef] [PubMed]
- Yary, T.; Voutilainen, S.; Tuomainen, T.P.; Ruusunen, A.; Nurmi, T.; Virtanen, J.K. Omega-6 polyunsaturated fatty acids, serum zinc, delta-5- and delta-6-desaturase activities and incident metabolic syndrome. J. Hum. Nutr. Diet 2017, 30, 506–514. [Google Scholar] [CrossRef] [PubMed]
- Castillo-Durän, C.; Cassorla, F. Trace minerals in human growth and development. J. Pediatr. Endocrinol. Metab. 1999, 12, 589–601. [Google Scholar] [CrossRef] [PubMed]
- Chitturi, R.; Baddam, V.R.; Prasad, L.; Prashanth, L.; Kattapagari, K. A review on role of essential trace elements in health and disease. J. Dr. NTR Univ. Health Sci. 2015, 4, 75–85. [Google Scholar] [CrossRef]
- Khan, F.A.; Al Jameil, N.; Arjumand, S.; Khan, M.F.; Tabassum, H.; Alenzi, N.; Hijazy, S.; Alenzi, S.; Subaie, S.; Fatima, S. Comparative study of serum copper, iron, magnesium, and zinc in type 2 diabetes-associated proteinuria. Biol. Trace Elem. Res. 2015, 168, 321–329. [Google Scholar] [CrossRef]
- Lieu, P.; Heiskala, M.; Peterson, P.; Yang, Y. The roles of iron in health and disease. Molec. Aspects Med. 2001, 22, 1–87. [Google Scholar] [CrossRef]
- Prasad, A.S. Clinical, immunological, anti-inflammatory and antioxidant roles of zinc. Exp. Gerontol. 2008, 43, 370–377. [Google Scholar] [CrossRef]
- Clejan, S.; Castro-Magana, M.; Collipp, P.; Jonas, E.; Maddaiah, V. Effects of zinc deficiency and castration on fatty acid composition and desaturation in rats. Lipids 1982, 17, 129–135. [Google Scholar] [CrossRef]
- Mahfouz, M.; Kummerow, F. Effect of magnesium deficiency on △6 desaturase activity and fatty acid composition of rat liver microsomes. Lipids 1989, 24, 727–732. [Google Scholar] [CrossRef] [PubMed]
- Yu, Y.; Cai, Z.; Zheng, J.; Chen, J.; Zhang, X.; Huang, X.F.; Li, D. Serum levels of polyunsaturated fatty acids are low in Chinese men with metabolic syndrome, whereas serum levels of saturated fatty acids, zinc, and magnesium are high. Nutr. Res. 2012, 32, 71–77. [Google Scholar] [CrossRef] [PubMed]
- Knez, M.; Pantovic, A.; Zekovic, M.; Pavlovic, Z.; Glibetic, M.; Zec, M. Is there a link between zinc intake and status with plasma fatty acid profile and desaturase activities in dyslipidemic subjects? Nutrients 2019, 12, 93. [Google Scholar] [CrossRef] [PubMed] [Green Version]
- Gunes, O.; Tascilar, E.; Sertoglu, E.; Tas, A.; Serdar, M.A.; Kaya, G.; Kayadibi, H.; Ozcan, O. Associations between erythrocyte membrane fatty acid compositions and insulin resistance in obese adolescents. Chem. Phys. Lipids 2014, 184, 69–75. [Google Scholar] [CrossRef] [PubMed]
- Jauregibeitia, I.; Portune, K.; Rica, I.; Tueros, I.; Velasco, O.; Grau, G.; Trebolazabala, N.; Castano, L.; Larocca, A.V.; Ferreri, C.; et al. Fatty acid profile of mature red blood cell membranes and dietary intake as a new approach to characterize children with overweight and obesity. Nutrients 2020, 12, 3446. [Google Scholar] [CrossRef] [PubMed]
- Guo, J.; Xu, Y. Determination of blood calcium, magnesium, iron and zinc in children by flame atomic absorption spectrometry. Chin. J. Health Lab. Technol. 2002, 12, 675. [Google Scholar]
- Sertoglu, E.; Kurt, I.; Tapan, S.; Uyanik, M.; Serdar, M.A.; Kayadibi, H.; El-Fawaeir, S. Comparison of plasma and erythrocyte membrane fatty acid compositions in patients with end-stage renal disease and type 2 diabetes mellitus. Chem. Phys. Lipids 2014, 178, 11–17. [Google Scholar] [CrossRef]
- Pereira, R.B.; Almeida, A.A.; Pereira, D.M.; Silva, O.; Andrade, P.B.; Pinto, E.; Valentao, P. Trace elements in wild edible Aplysia species: Relationship with the desaturation-elongation indexes of fatty acids. Chemosphere 2018, 208, 682–690. [Google Scholar] [CrossRef] [PubMed]
- Assies, J.; Pouwer, F.; Lok, A.; Mocking, R.J.; Bockting, C.L.; Visser, I.; Abeling, N.G.; Duran, M.; Schene, A.H. Plasma and erythrocyte fatty acid patterns in patients with recurrent depression: A matched case-control study. PLoS ONE 2010, 5, e10635. [Google Scholar] [CrossRef]
- Yu, X.; Xia, L.; Zhang, S.; Zhou, G.; Li, Y.; Liu, H.; Hou, C.; Zhao, Q.; Dong, L.; Cui, Y.; et al. Fluoride exposure and children’s intelligence: Gene-environment interaction based on SNP-set, gene and pathway analysis, using a case-control design based on a cross-sectional study. Environ. Int. 2021, 155, 106681. [Google Scholar] [CrossRef]
- Araujo, P.; Kjellevold, M.; Nerhus, I.; Dahl, L.; Aakre, I.; Moe, V.; Smith, L.; Markhus, M.W. Fatty acid reference intervals in red blood cells among pregnant women in Norway-cross sectional data from the ‘Little in Norway’ cohort. Nutrients 2020, 12, 2950. [Google Scholar] [CrossRef] [PubMed]
- Yuan, L.; Zhen, J.; Ma, W.; Cai, C.; Huang, X.; Xiao, R. The erythrocyte fatty acid profile and cognitive function in Old Chinese adults. Nutrients 2016, 8, 385. [Google Scholar] [CrossRef] [PubMed] [Green Version]
- Reed, S.; Qin, X.; Ran-Ressler, R.; Brenna, J.T.; Glahn, R.P.; Tako, E. Dietary zinc deficiency affects blood linoleic acid: Dihomo-gamma-linolenic acid (LA:DGLA) ratio; a sensitive physiological marker of zinc status in vivo (Gallus gallus). Nutrients 2014, 6, 1164–1180. [Google Scholar] [CrossRef] [PubMed]
- Knez, M.; Stangoulis, J.C.R.; Zec, M.; Debeljak-Martacic, J.; Pavlovic, Z.; Gurinovic, M.; Glibetic, M. An initial evaluation of newly proposed biomarker of zinc status in humans - linoleic acid: Dihomo-gamma-linolenic acid (LA:DGLA) ratio. Clin. Nutr. ESPEN 2016, 15, 85–92. [Google Scholar] [CrossRef] [PubMed] [Green Version]
- Yary, T.; Voutilainen, S.; Tuomainen, T.-P.; Ruusunen, A.; Nurmi, T.; Virtanen, J.K. Serum n–6 polyunsaturated fatty acids,Δ5-and Δ 6-desaturase activities, and risk of incident type 2 diabetes in men: The Kuopio Ischaemic Heart Disease Risk Factor Study. Am. J. Clin. Nutr. 2016, 103, 1337–1343. [Google Scholar] [CrossRef] [PubMed] [Green Version]
- Fan, Y.; Zhang, C.; Bu, J. Relationship between selected serum metallic elements and obesity in children and adolescent in the U.S. Nutrients 2017, 9, 104. [Google Scholar] [CrossRef] [PubMed]
- Lima, S.; Arrais, R.; Sales, C.; Almeida, M.; Sena, K.; Oliveira, V.; Andrade, A.; Pedrosa, L. Assessment of copper and lipid profile in obese children and adolescents. Biol. Trace Elem. Res. 2006, 114, 19–29. [Google Scholar] [CrossRef]
- Arab, L. Biomarkers of fat and fatty acid intake. J. Nutr. 2003, 133, 925S–932S. [Google Scholar] [CrossRef] [Green Version]
- Wahle, E.W.; Davies, N.T. Effect of dietary copper deficiency in the rat on fatty acid composition of adipose tissue and desaturase activity of liver microsomes. Br. J. Nutr. 1975, 34, 105–112. [Google Scholar] [CrossRef] [Green Version]
- Shi, H.; Chen, H.; Gu, Z.; Zhang, H.; Chen, W.; Chen, Y.Q. Application of a delta-6 desaturase with alpha-linolenic acid preference on eicosapentaenoic acid production in Mortierella alpina. Microb. Cell Fact. 2016, 15, 117. [Google Scholar] [CrossRef] [Green Version]
- Knez, M.; Stangoulis, J.C.R.; Glibetic, M.; Tako, E. The Linoleic Acid: Dihomo-gamma-Linolenic Acid Ratio (LA:DGLA)-An Emerging Biomarker of Zn Status. Nutrients 2017, 9, 825. [Google Scholar] [CrossRef] [PubMed]
- Suburu, J.; Gu, Z.; Chen, H.; Chen, W.; Zhang, H.; Chen, Y.Q. Fatty acid metabolism: Implications for diet, genetic variation, and disease. Food Biosci. 2013, 4, 1–12. [Google Scholar] [CrossRef] [PubMed] [Green Version]

| Characteristics | Mean (SD) or N (%) |
|---|---|
| Sex, N (%) | |
| Boy | 218 (52.53) |
| Girl | 197 (47.47) |
| Age, years | 6.02 (0.64) |
| BMI | 15.06 (1.78) |
| Plasma lipid parameters, mmol/L | |
| TG | 1.13 (0.73) |
| CHOL | 4.18 (0.73) |
| HDL-C | 1.55 (0.28) |
| LDL-C | 2.18 (0.57) |
| Mineral elements, mg/L | |
| Ca | 70.37 (8.44) |
| Mg | 41.89 (5.50) |
| Fe | 448.43 (85.29) |
| Cu | 0.90 (0.13) |
| Zn | 4.64 (0.85) |
| Age | BMI | TG | CHOL | HDL-C | LDL-C | |||||||||||||
|---|---|---|---|---|---|---|---|---|---|---|---|---|---|---|---|---|---|---|
| r | p | pFDRa | r | p | pFDRa | r | p | pFDRa | r | p | pFDRa | r | p | pFDRa | r | p | pFDRa | |
| Mineral elements | ||||||||||||||||||
| Ca | −0.270 | <0.001 | <0.001 | 0.059 | 0.233 | 0.388 | 0.016 | 0.742 | 0.927 | −0.034 | 0.484 | 0.547 | −0.036 | 0.470 | 0.470 | −0.018 | 0.709 | 0.709 |
| Mg | −0.049 | 0.317 | 0.573 | 0.074 | 0.133 | 0.333 | −0.054 | 0.277 | 0.691 | 0.073 | 0.140 | 0.350 | −0.091 | 0.065 | 0.163 | 0.096 | 0.050 | 0.125 |
| Fe | 0.047 | 0.344 | 0.573 | 0.080 | 0.105 | 0.333 | 0.092 | 0.061 | 0.305 | −0.030 | 0.547 | 0.547 | −0.055 | 0.261 | 0.327 | 0.055 | 0.266 | 0.333 |
| Cu | −0.004 | 0.933 | 0.933 | 0.020 | 0.686 | 0.686 | −0.034 | 0.484 | 0.807 | 0.056 | 0.258 | 0.430 | −0.149 | 0.002 | 0.011 | 0.069 | 0.163 | 0.272 |
| Zn | −0.013 | 0.790 | 0.933 | 0.026 | 0.600 | 0.686 | −0.003 | 0.955 | 0.955 | 0.129 | 0.009 | 0.044 | 0.070 | 0.154 | 0.257 | 0.096 | 0.050 | 0.125 |
| FAs | ||||||||||||||||||
| C16:0 | −0.159 | 0.001 | 0.017 | −0.044 | 0.376 | 0.497 | −0.002 | 0.968 | 0.968 | 0.049 | 0.320 | 0.534 | 0.011 | 0.826 | 0.826 | 0.051 | 0.304 | 0.627 |
| C18:0 | −0.101 | 0.040 | 0.054 | −0.022 | 0.652 | 0.652 | −0.014 | 0.775 | 0.830 | 0.028 | 0.565 | 0.771 | 0.045 | 0.361 | 0.493 | 0.025 | 0.618 | 0.772 |
| SFAs | −0.132 | 0.007 | 0.030 | −0.039 | 0.431 | 0.497 | −0.020 | 0.690 | 0.796 | 0.044 | 0.376 | 0.564 | 0.032 | 0.516 | 0.608 | 0.044 | 0.374 | 0.627 |
| C18:1n-9 | −0.131 | 0.007 | 0.030 | −0.041 | 0.402 | 0.497 | 0.101 | 0.039 | 0.195 | 0.015 | 0.764 | 0.854 | −0.016 | 0.746 | 0.799 | −0.002 | 0.965 | 0.965 |
| C24:1n-9 | −0.007 | 0.886 | 0.886 | −0.042 | 0.391 | 0.497 | −0.053 | 0.282 | 0.490 | −0.011 | 0.819 | 0.854 | 0.100 | 0.043 | 0.232 | −0.040 | 0.418 | 0.627 |
| MUFAs | −0.084 | 0.088 | 0.102 | −0.035 | 0.483 | 0.517 | 0.061 | 0.215 | 0.490 | 0.009 | 0.854 | 0.854 | 0.031 | 0.527 | 0.608 | −0.018 | 0.707 | 0.816 |
| C18:3n-3 | −0.097 | 0.049 | 0.061 | 0.061 | 0.217 | 0.443 | 0.236 | 0.000 | 0.195 | −0.009 | 0.852 | 0.854 | −0.059 | 0.231 | 0.366 | −0.054 | 0.276 | 0.627 |
| C20:5n-3 | −0.079 | 0.106 | 0.114 | 0.068 | 0.167 | 0.443 | 0.106 | 0.031 | 0.195 | 0.087 | 0.075 | 0.188 | 0.103 | 0.036 | 0.232 | 0.013 | 0.799 | 0.856 |
| C22:6n-3 | −0.105 | 0.032 | 0.048 | −0.083 | 0.091 | 0.443 | 0.032 | 0.513 | 0.700 | 0.160 | 0.001 | 0.016 | 0.091 | 0.064 | 0.232 | 0.113 | 0.021 | 0.316 |
| n-3PUFAs | −0.115 | 0.019 | 0.042 | −0.057 | 0.243 | 0.443 | 0.062 | 0.207 | 0.490 | 0.140 | 0.004 | 0.032 | 0.082 | 0.097 | 0.232 | 0.087 | 0.076 | 0.570 |
| C18:2n-6 | −0.107 | 0.030 | 0.048 | −0.062 | 0.210 | 0.443 | 0.066 | 0.181 | 0.490 | 0.078 | 0.114 | 0.244 | 0.070 | 0.156 | 0.292 | 0.035 | 0.471 | 0.643 |
| C20:4n-6 | −0.112 | 0.022 | 0.042 | −0.070 | 0.152 | 0.443 | 0.034 | 0.486 | 0.700 | 0.111 | 0.024 | 0.120 | 0.085 | 0.082 | 0.232 | 0.063 | 0.201 | 0.627 |
| n-6PUFAs | −0.112 | 0.022 | 0.042 | −0.065 | 0.184 | 0.443 | 0.052 | 0.294 | 0.490 | 0.096 | 0.052 | 0.155 | 0.079 | 0.108 | 0.232 | 0.049 | 0.323 | 0.627 |
| PUFAs | −0.114 | 0.021 | 0.042 | −0.065 | 0.186 | 0.443 | 0.053 | 0.278 | 0.490 | 0.102 | 0.038 | 0.144 | 0.080 | 0.104 | 0.232 | 0.054 | 0.275 | 0.627 |
| Total FAs | −0.130 | 0.008 | 0.030 | −0.055 | 0.266 | 0.443 | 0.024 | 0.619 | 0.774 | 0.067 | 0.176 | 0.330 | 0.057 | 0.244 | 0.366 | 0.040 | 0.415 | 0.627 |
| FAs | Ca | Mg | Fe | Cu | Zn | ||||||||||
|---|---|---|---|---|---|---|---|---|---|---|---|---|---|---|---|
| r | pa | pFDRb | r | pa | pFDRb | r | pa | pFDRb | r | pa | pFDRb | r | pa | pFDRb | |
| C16:0 | 0.057 | 0.252 | 0.596 | −0.094 | 0.057 | 0.171 | −0.008 | 0.879 | 0.896 | 0.042 | 0.393 | 0.454 | 0.054 | 0.276 | 0.318 |
| C18:0 | 0.020 | 0.679 | 0.858 | −0.105 | 0.032 | 0.171 | 0.025 | 0.607 | 0.771 | 0.001 | 0.981 | 0.981 | 0.017 | 0.732 | 0.732 |
| SFAs | 0.030 | 0.542 | 0.825 | −0.099 | 0.044 | 0.171 | 0.006 | 0.896 | 0.896 | 0.025 | 0.614 | 0.658 | 0.037 | 0.448 | 0.480 |
| C18:1n-9 | 0.029 | 0.550 | 0.825 | −0.066 | 0.184 | 0.246 | 0.033 | 0.509 | 0.763 | 0.067 | 0.172 | 0.258 | 0.110 | 0.026 | 0.077 |
| C24:1n-9 | −0.020 | 0.686 | 0.858 | −0.059 | 0.229 | 0.246 | 0.038 | 0.447 | 0.763 | 0.062 | 0.209 | 0.285 | 0.060 | 0.224 | 0.280 |
| MUFAs | 0.011 | 0.819 | 0.869 | −0.068 | 0.169 | 0.246 | 0.033 | 0.506 | 0.763 | 0.068 | 0.170 | 0.258 | 0.096 | 0.050 | 0.091 |
| C18:3n-3 | 0.046 | 0.352 | 0.661 | −0.068 | 0.169 | 0.246 | 0.044 | 0.369 | 0.763 | 0.073 | 0.137 | 0.258 | 0.081 | 0.101 | 0.138 |
| C20:5n-3 | −0.083 | 0.093 | 0.348 | −0.049 | 0.324 | 0.324 | 0.045 | 0.363 | 0.763 | 0.108 | 0.028 | 0.103 | 0.103 | 0.036 | 0.091 |
| C22:6n-3 | −0.128 | 0.009 | 0.137 | −0.062 | 0.211 | 0.246 | 0.036 | 0.466 | 0.763 | 0.118 | 0.017 | 0.083 | 0.089 | 0.072 | 0.108 |
| n-3PUFAs | −0.115 | 0.019 | 0.144 | −0.071 | 0.152 | 0.246 | 0.039 | 0.428 | 0.763 | 0.120 | 0.015 | 0.083 | 0.095 | 0.054 | 0.091 |
| C18:2n-6 | −0.008 | 0.869 | 0.869 | −0.097 | 0.048 | 0.171 | 0.020 | 0.692 | 0.799 | 0.051 | 0.301 | 0.376 | 0.158 | 0.001 | 0.019 |
| C20:4n-6 | −0.085 | 0.085 | 0.348 | −0.060 | 0.224 | 0.246 | 0.044 | 0.370 | 0.763 | 0.128 | 0.009 | 0.083 | 0.114 | 0.020 | 0.075 |
| n-6PUFAs | −0.054 | 0.278 | 0.596 | −0.078 | 0.111 | 0.241 | 0.034 | 0.494 | 0.763 | 0.097 | 0.048 | 0.120 | 0.137 | 0.005 | 0.034 |
| PUFAs | −0.061 | 0.213 | 0.596 | −0.078 | 0.112 | 0.241 | 0.035 | 0.482 | 0.763 | 0.101 | 0.040 | 0.120 | 0.133 | 0.007 | 0.034 |
| Total FAs | −0.010 | 0.834 | 0.869 | −0.095 | 0.053 | 0.171 | 0.025 | 0.617 | 0.771 | 0.070 | 0.156 | 0.258 | 0.096 | 0.052 | 0.091 |
| FAs | Zn a | Cu b | Interaction c | |||
|---|---|---|---|---|---|---|
| p | pFDRd | p | pFDRd | p | pFDRd | |
| C16:0 | 0.417 | 0.521 | 0.473 | 0.546 | 0.634 | 0.634 |
| C18:0 | 0.888 | 0.888 | 0.863 | 0.863 | 0.349 | 0.476 |
| SFAs | 0.728 | 0.780 | 0.575 | 0.616 | 0.493 | 0.569 |
| C18:1n-9 | 0.148 | 0.222 | 0.313 | 0.391 | 0.428 | 0.535 |
| C24:1n-9 | 0.584 | 0.674 | 0.249 | 0.373 | 0.047 | 0.454 |
| MUFAs | 0.223 | 0.304 | 0.276 | 0.377 | 0.192 | 0.454 |
| C18:3n-3 | 0.127 | 0.219 | 0.230 | 0.373 | 0.294 | 0.454 |
| C20:5n-3 | 0.014 | 0.053 | 0.078 | 0.195 | 0.627 | 0.634 |
| C22:6n-3 | 0.088 | 0.189 | 0.010 | 0.052 | 0.262 | 0.454 |
| n-3PUFAs | 0.060 | 0.150 | 0.010 | 0.052 | 0.264 | 0.454 |
| C18:2n-6 | 0.004 | 0.053 | 0.187 | 0.351 | 0.267 | 0.454 |
| C20:4n-6 | 0.023 | 0.070 | 0.006 | 0.052 | 0.303 | 0.454 |
| n-6PUFAs | 0.009 | 0.053 | 0.028 | 0.084 | 0.275 | 0.454 |
| PUFAs | 0.011 | 0.053 | 0.024 | 0.089 | 0.269 | 0.454 |
| Total FAs | 0.131 | 0.219 | 0.143 | 0.306 | 0.274 | 0.454 |
| Indices | Ca | Mg | Fe | Cu | Zn | ||||||||||
|---|---|---|---|---|---|---|---|---|---|---|---|---|---|---|---|
| r | pa | pFDRb | r | pa | pFDRb | r | pa | pFDRb | r | pa | pFDRb | r | pa | pFDRb | |
| C18:0/C16:0 | −0.088 | 0.075 | 0.120 | −0.064 | 0.192 | 0.684 | 0.104 | 0.035 | 0.207 | −0.111 | 0.024 | 0.049 | −0.072 | 0.143 | 0.429 |
| C24:1n-9/C18:1n-9 | −0.086 | 0.080 | 0.120 | −0.030 | 0.545 | 0.845 | 0.041 | 0.405 | 0.810 | −0.014 | 0.782 | 0.782 | −0.004 | 0.931 | 0.931 |
| C18:1n-9/C18:0 | 0.026 | 0.599 | 0.599 | 0.059 | 0.228 | 0.684 | −0.007 | 0.884 | 0.884 | 0.122 | 0.013 | 0.038 | 0.162 | 0.001 | 0.006 |
| C20:5n-3/18:3n-3 | −0.115 | 0.031 | 0.120 | −0.011 | 0.845 | 0.845 | 0.016 | 0.768 | 0.884 | 0.069 | 0.200 | 0.300 | 0.057 | 0.284 | 0.569 |
| C22:6n-3/C20:5n-3 | −0.114 | 0.059 | 0.120 | −0.018 | 0.765 | 0.845 | −0.036 | 0.550 | 0.826 | −0.021 | 0.729 | 0.782 | 0.005 | 0.929 | 0.931 |
| C20:4n-6/C18:2n-6 | −0.071 | 0.150 | 0.180 | 0.021 | 0.665 | 0.845 | 0.079 | 0.106 | 0.318 | 0.177 | <0.001 | 0.002 | 0.031 | 0.535 | 0.802 |
Publisher’s Note: MDPI stays neutral with regard to jurisdictional claims in published maps and institutional affiliations. |
© 2022 by the authors. Licensee MDPI, Basel, Switzerland. This article is an open access article distributed under the terms and conditions of the Creative Commons Attribution (CC BY) license (https://creativecommons.org/licenses/by/4.0/).
Share and Cite
Huang, Z.; Liu, X.; Li, Z.; Cui, L.; Liu, C.; Wang, W.; Hu, Y.; Chen, B. The Associations of Erythrocyte Fatty Acids with Whole Blood Mineral Elements in Children. Nutrients 2022, 14, 618. https://doi.org/10.3390/nu14030618
Huang Z, Liu X, Li Z, Cui L, Liu C, Wang W, Hu Y, Chen B. The Associations of Erythrocyte Fatty Acids with Whole Blood Mineral Elements in Children. Nutrients. 2022; 14(3):618. https://doi.org/10.3390/nu14030618
Chicago/Turabian StyleHuang, Zhi, Xing Liu, Ziming Li, Luwei Cui, Candi Liu, Weifeng Wang, Yuming Hu, and Bo Chen. 2022. "The Associations of Erythrocyte Fatty Acids with Whole Blood Mineral Elements in Children" Nutrients 14, no. 3: 618. https://doi.org/10.3390/nu14030618
APA StyleHuang, Z., Liu, X., Li, Z., Cui, L., Liu, C., Wang, W., Hu, Y., & Chen, B. (2022). The Associations of Erythrocyte Fatty Acids with Whole Blood Mineral Elements in Children. Nutrients, 14(3), 618. https://doi.org/10.3390/nu14030618