
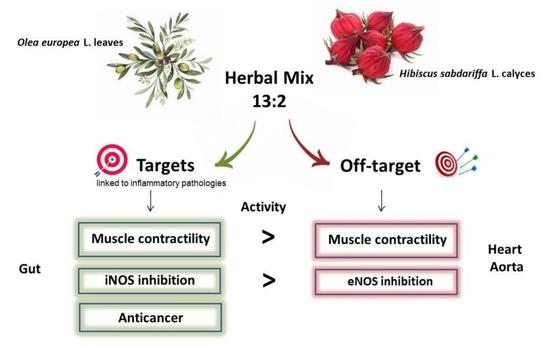
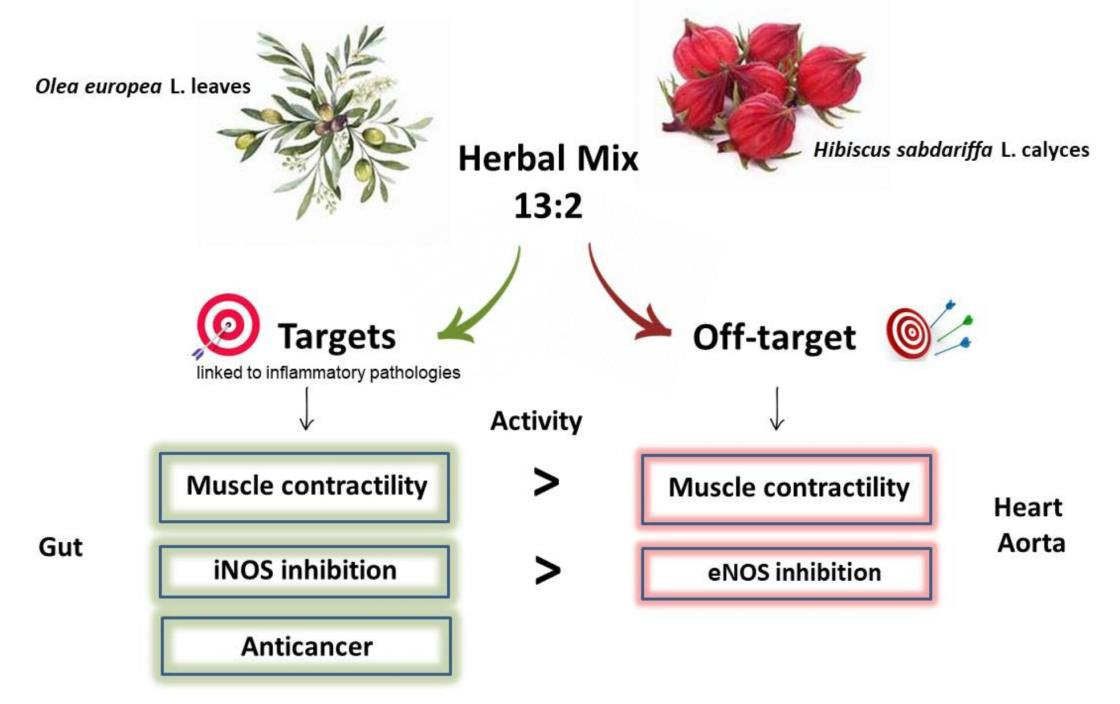
Olea europea L. Leaves and Hibiscus sabdariffa L. Petals Extracts: Herbal Mix from Cardiovascular Network Target to Gut Motility Dysfunction Application

 ,
,  ,
,  ,
,  ,
,  and
and
Abstract
:
1. Introduction
2. Materials and Methods
2.1. Plant Materials
2.2. “Ex Vitro” Studies
2.2.1. Ileum and Colon Contractility
2.2.2. Atria
2.2.3. Aorta
2.3. NOS Assay
2.3.1. General
2.3.2. Procedure
2.4. Human Colorectal Adenocarcinoma Caco-2 Cells Assays
2.4.1. Apoptosis and Mitochondria Integrity Assays
2.4.2. Ileum or Colon Rings
2.5. Data Analysis
3. Results
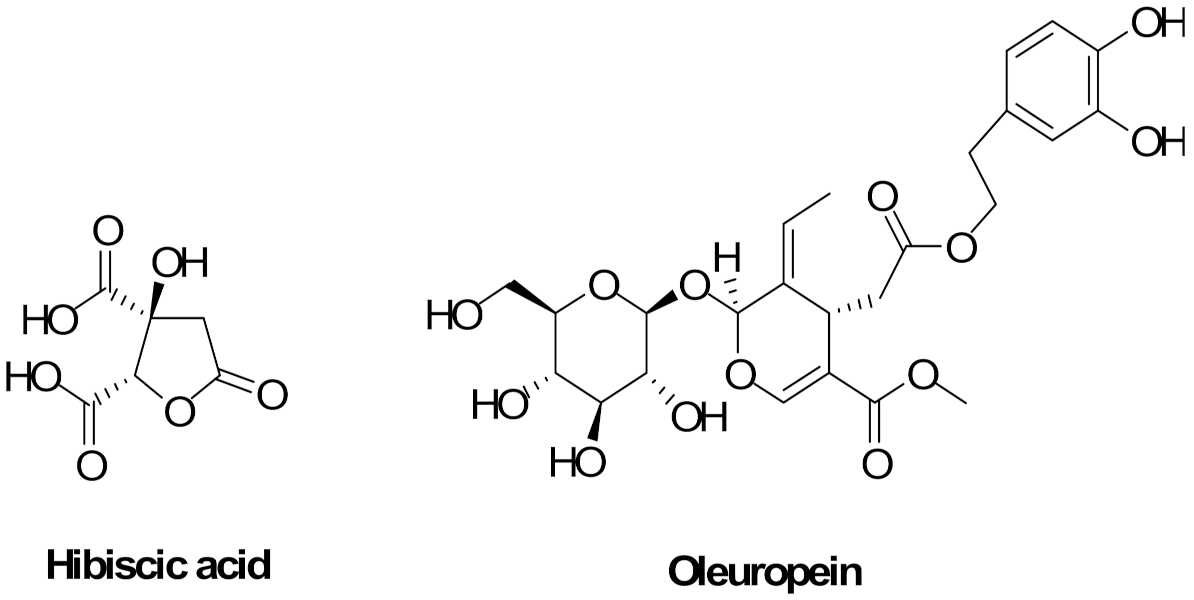
3.1. Chemistry
3.2. Target: In Vitro Ileum and Colon Contractility
3.2.1. Induced Contractility on K+ (80 mM)-Depolarized Tissues
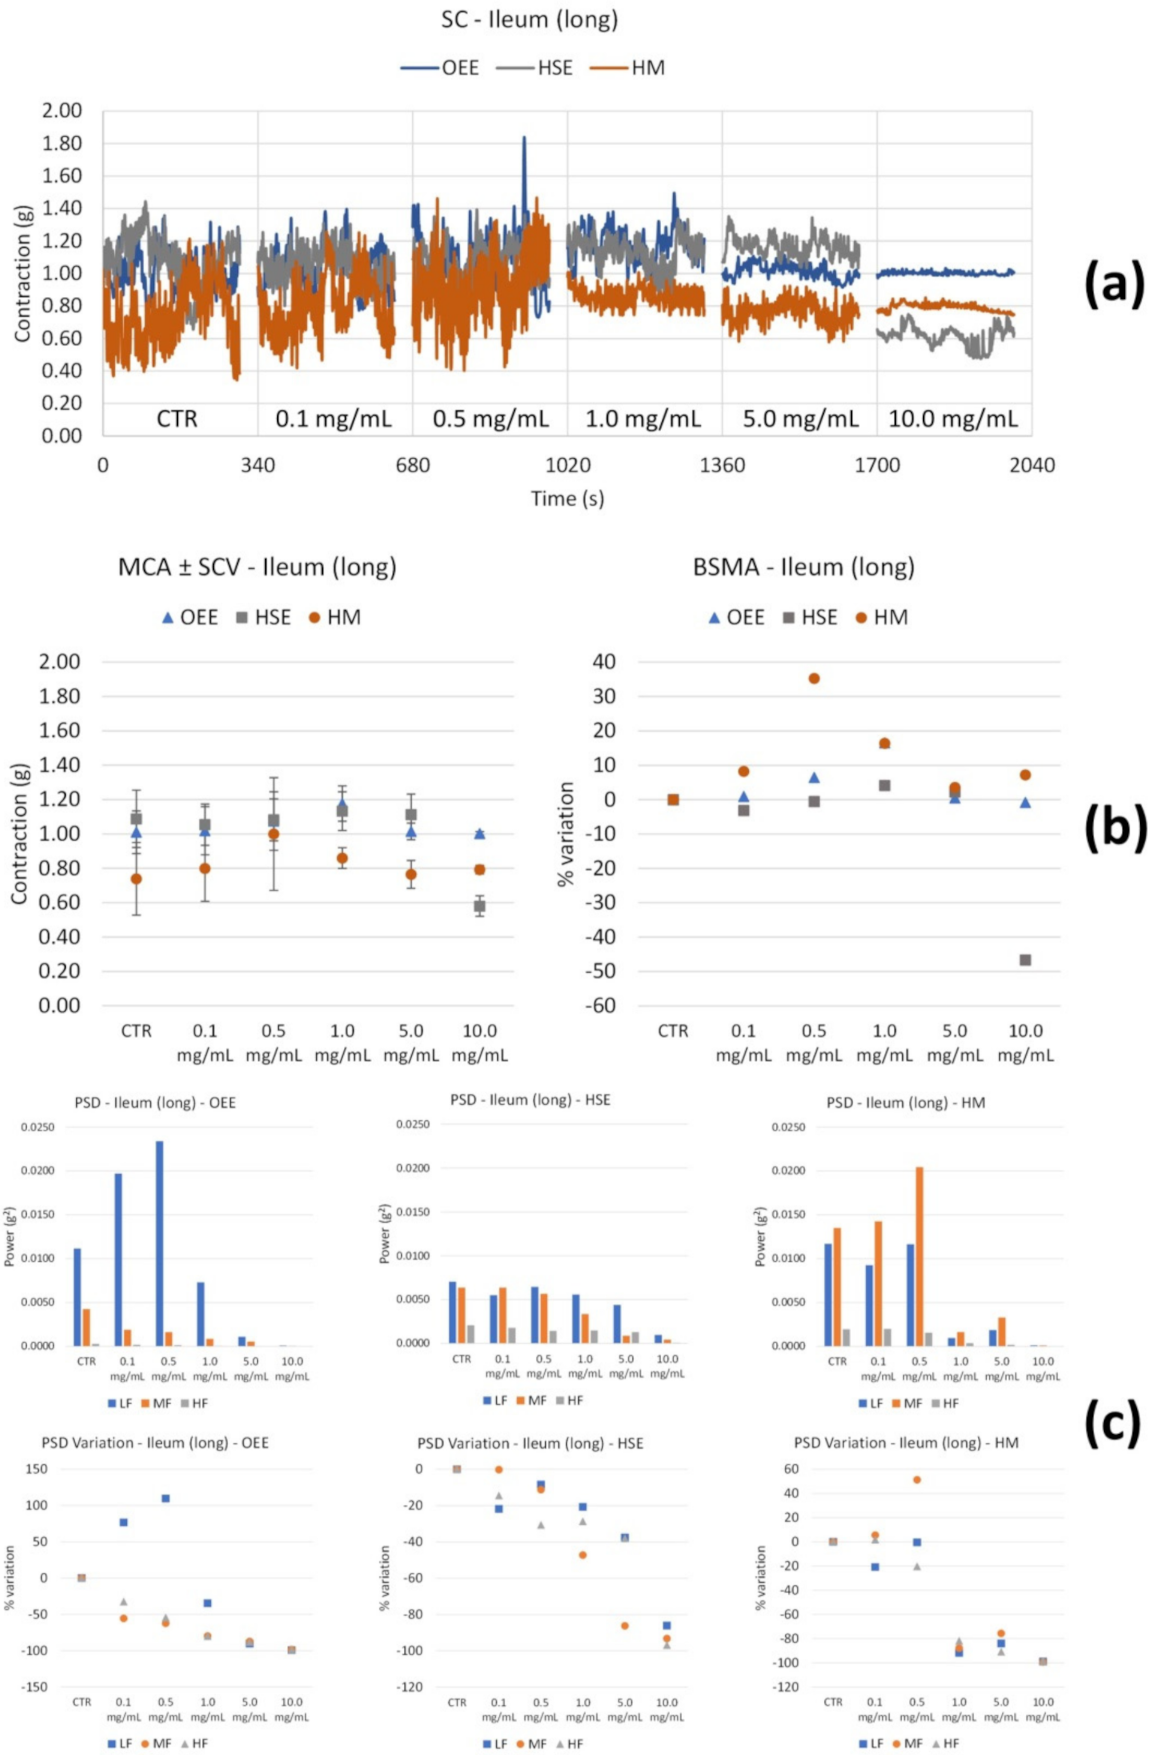
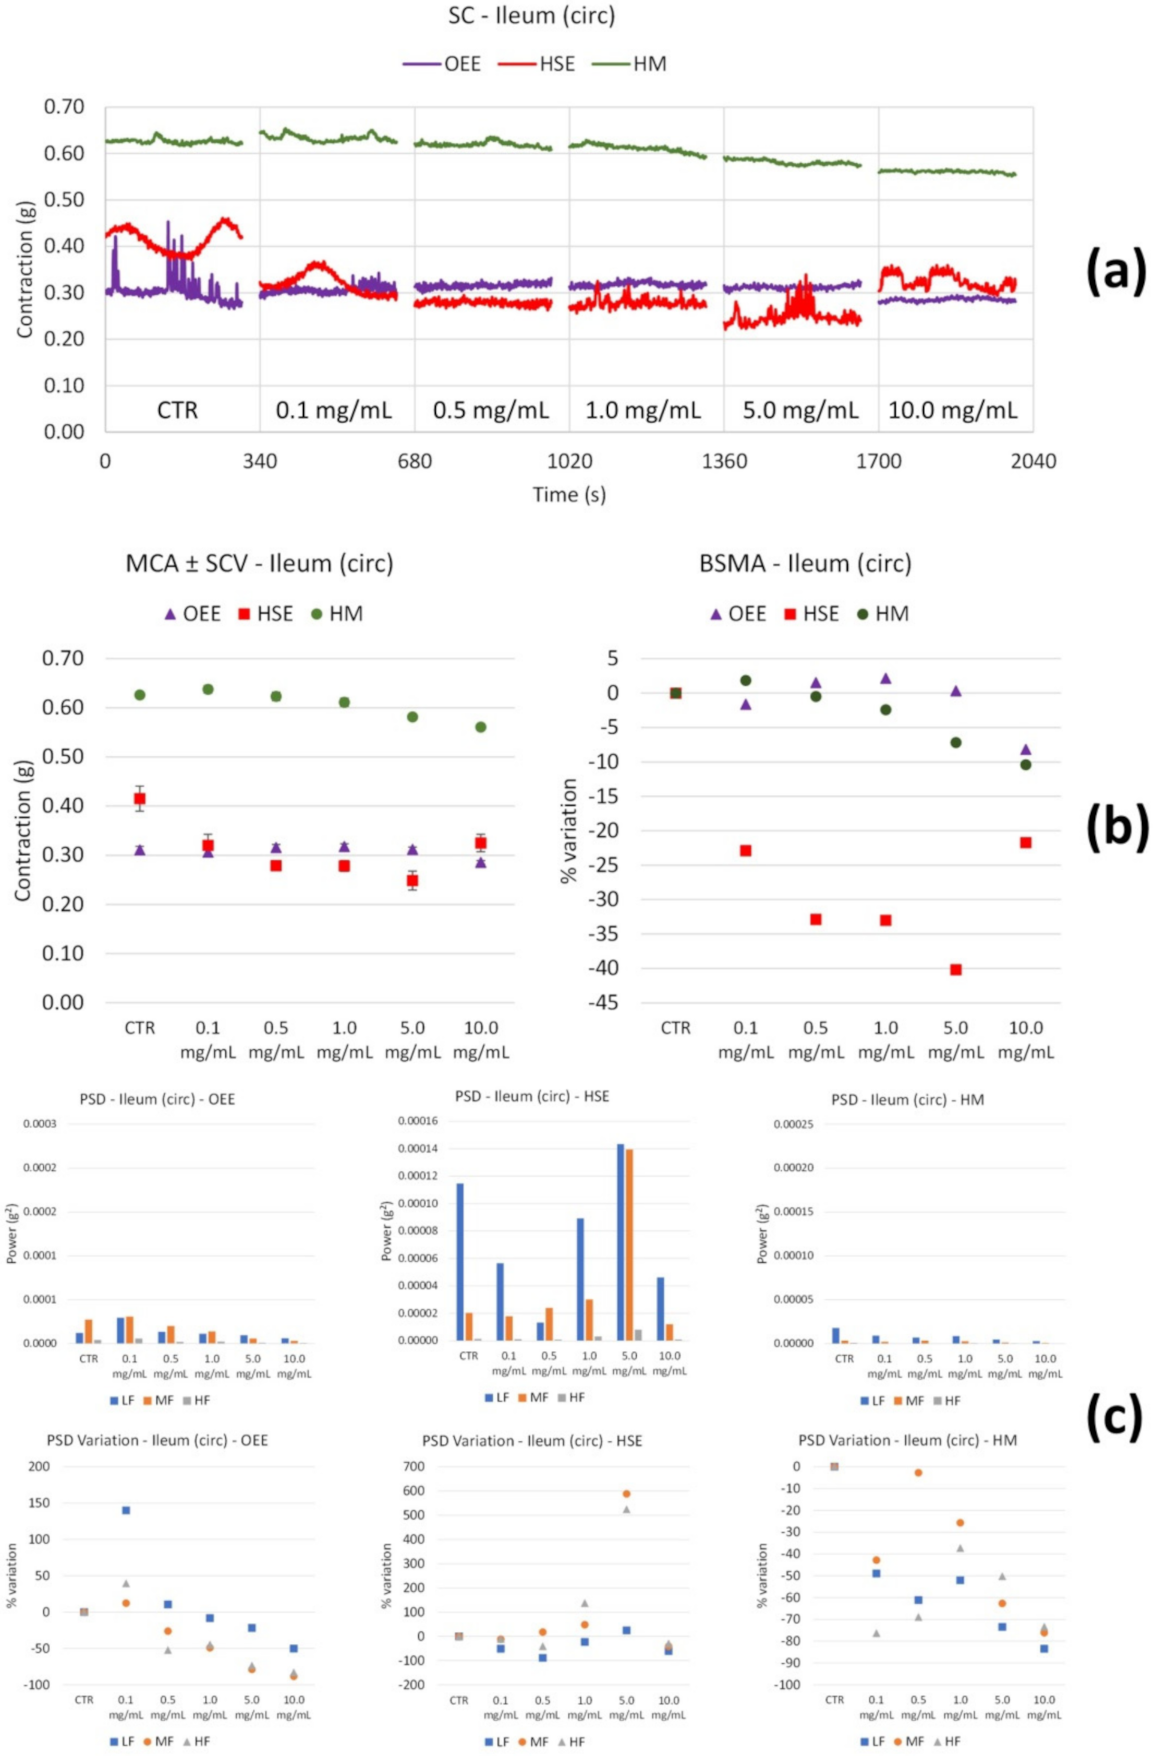
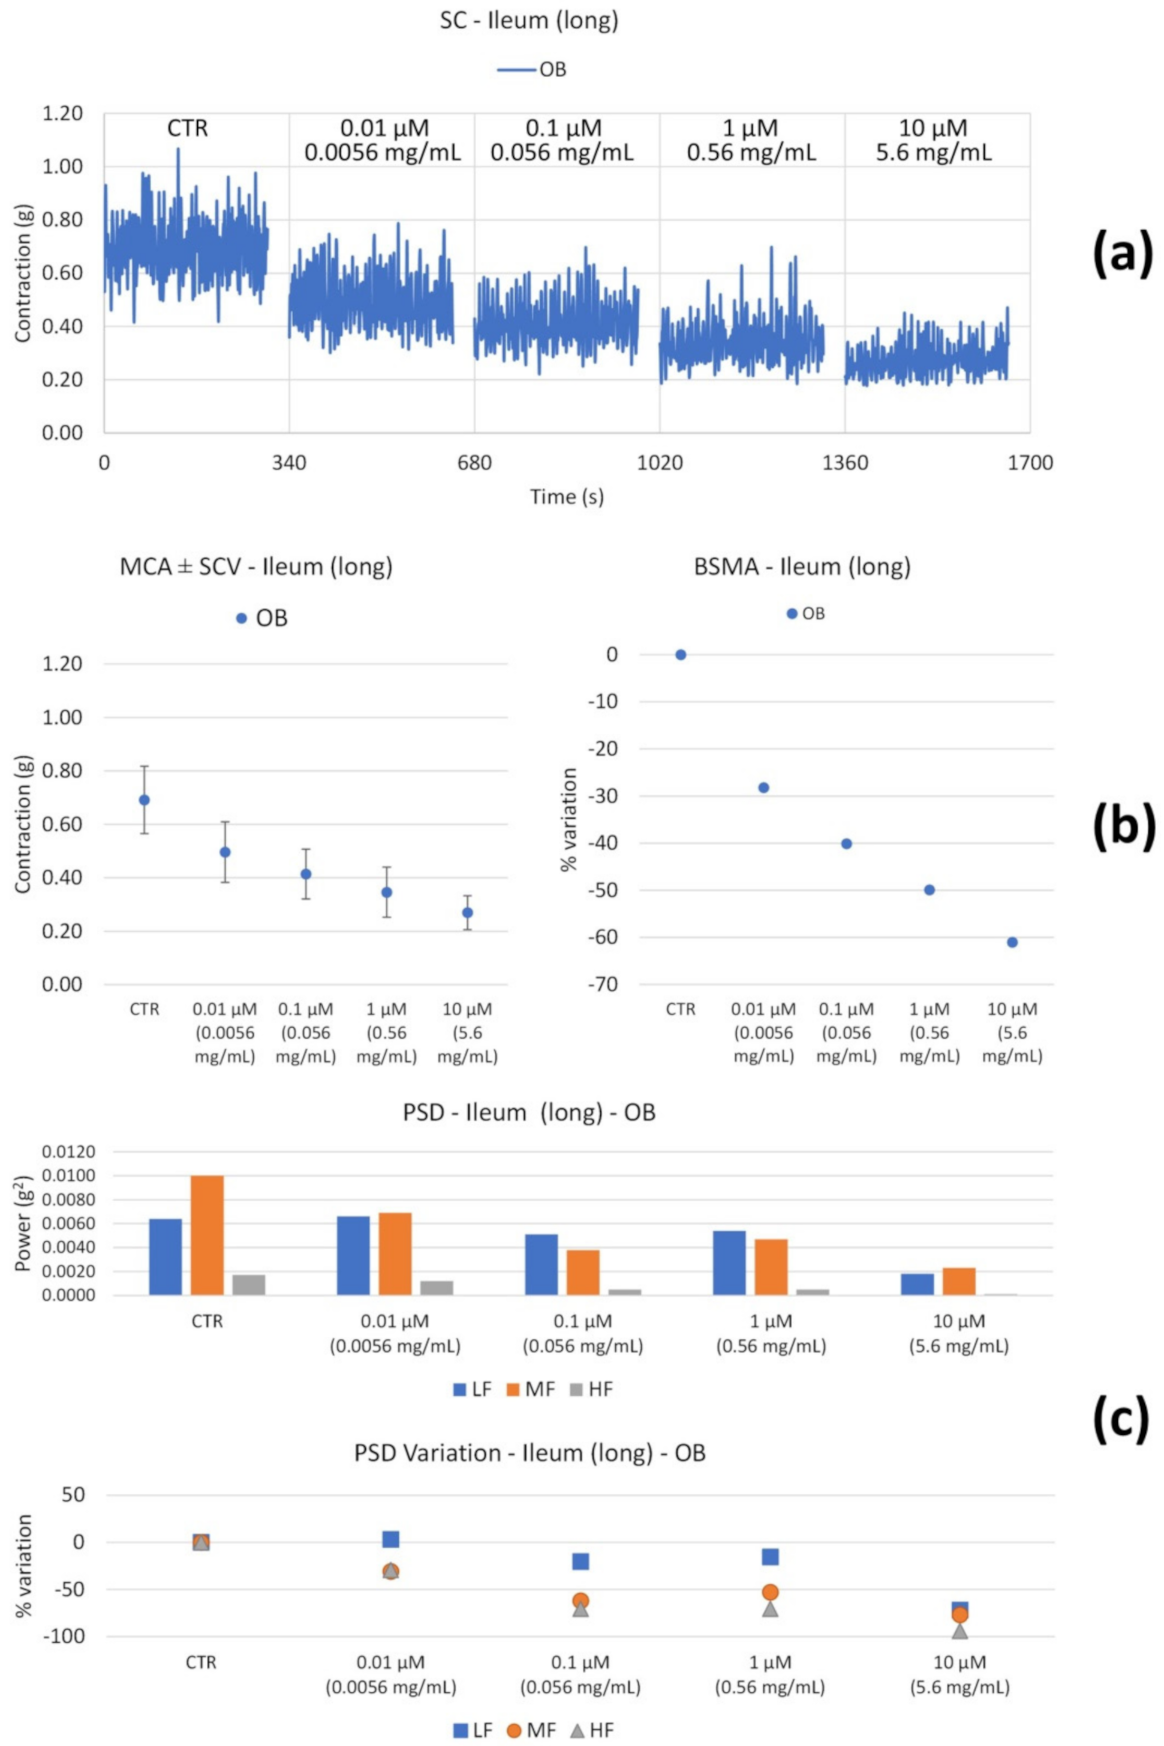
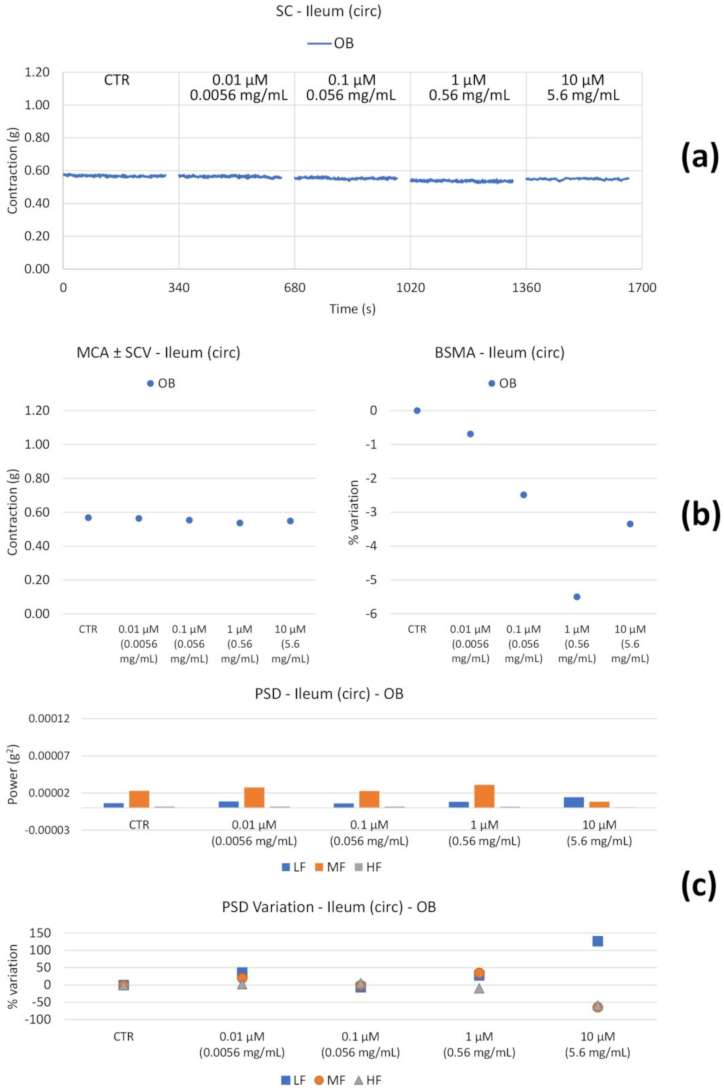
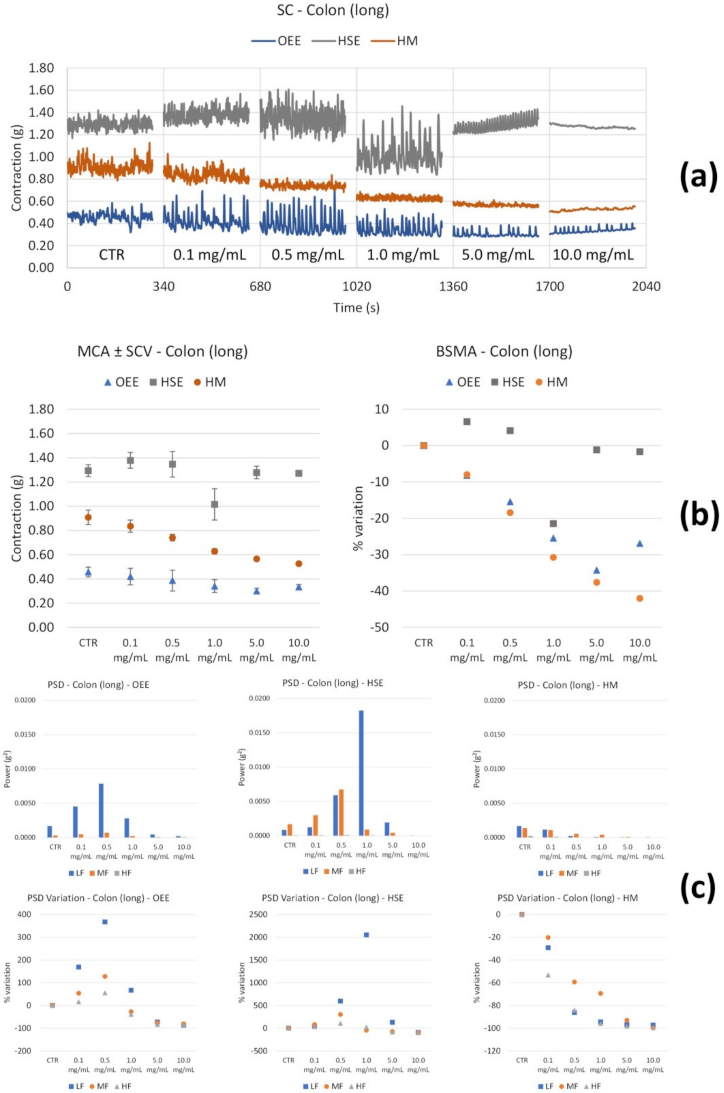
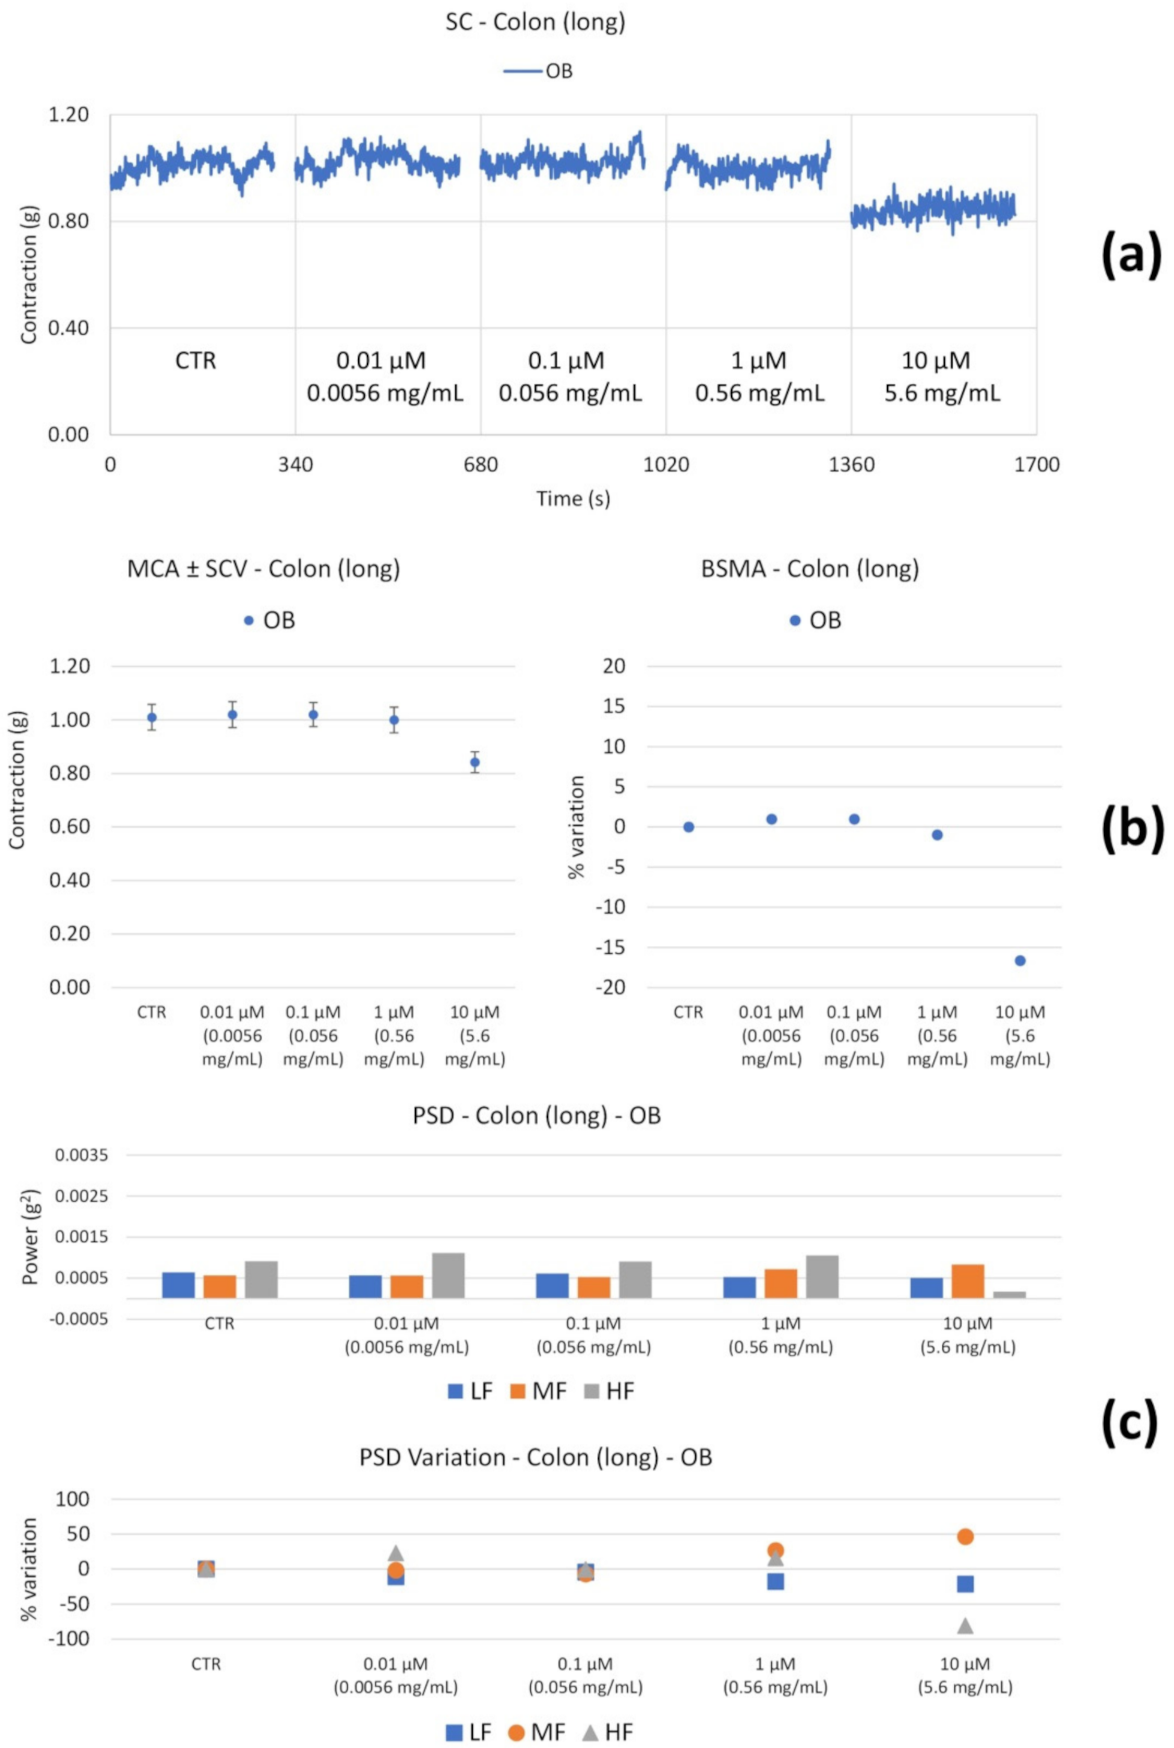
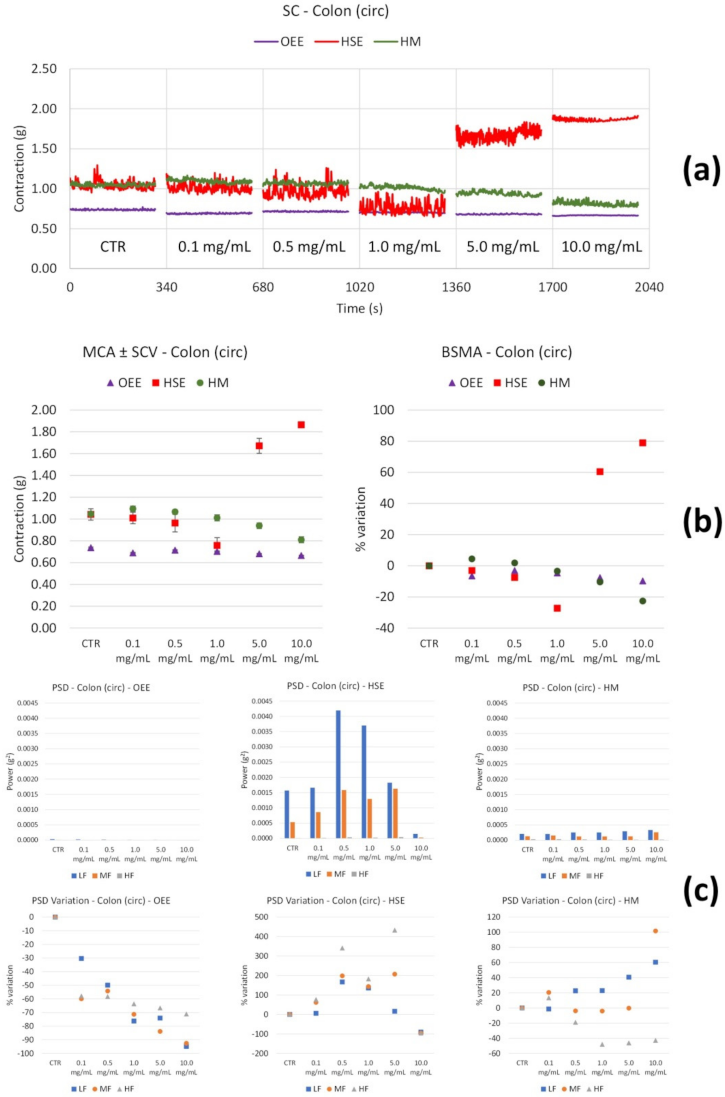
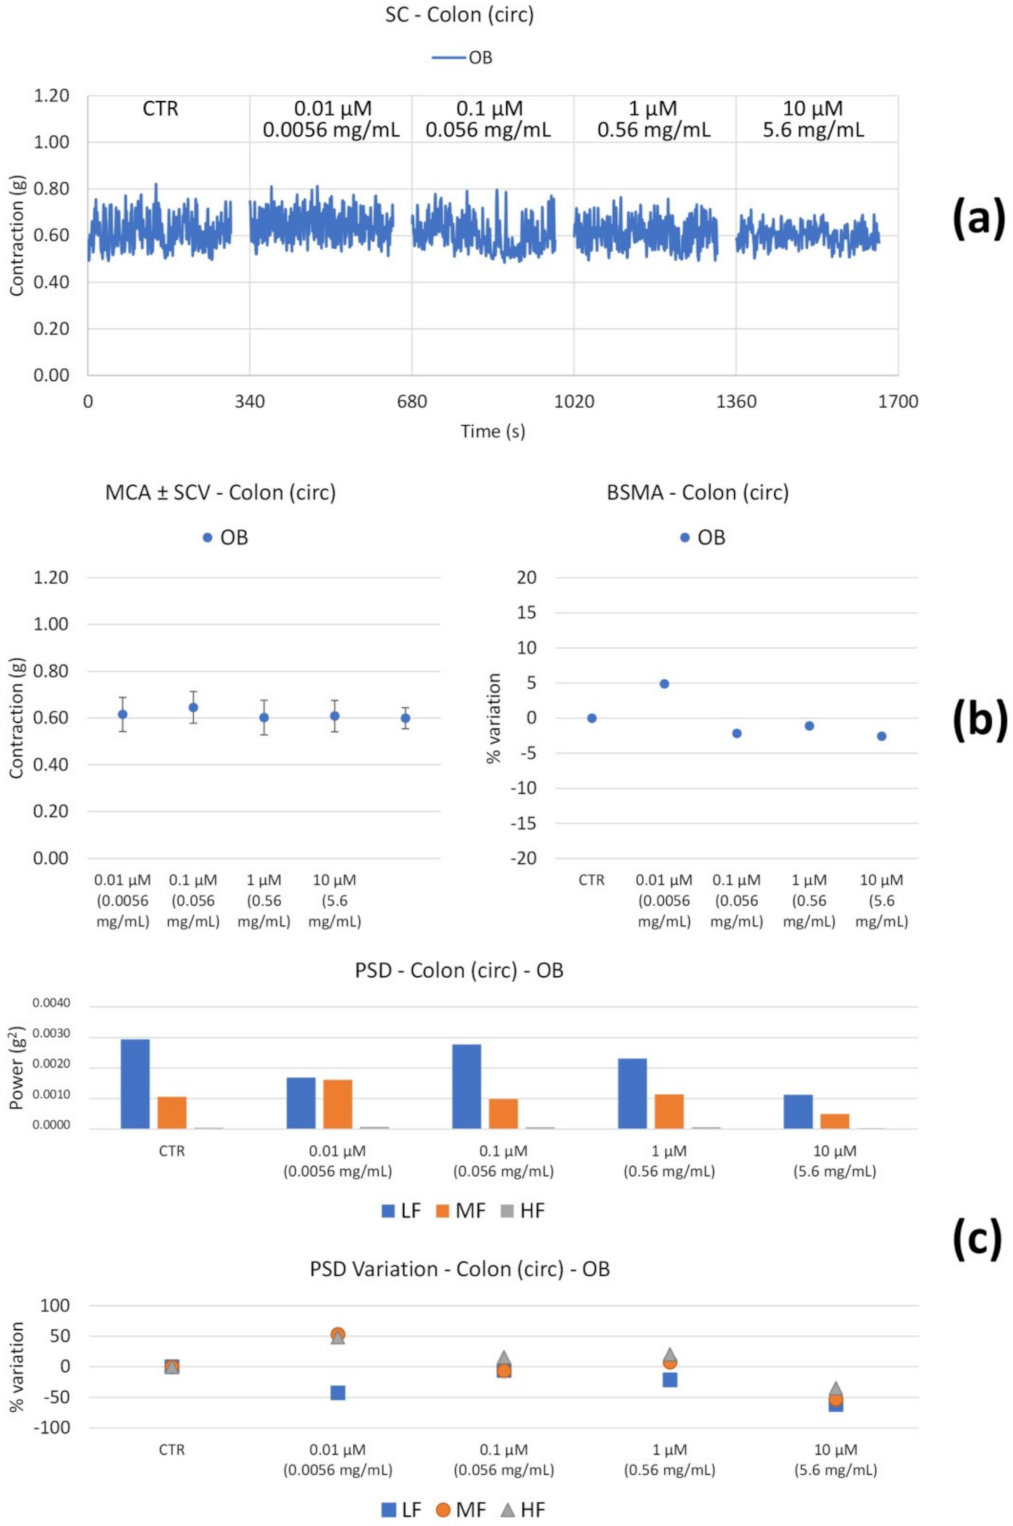
3.2.2. Spontaneous Contractility
3.2.3. Off Target: Effect on Cardiovascular System
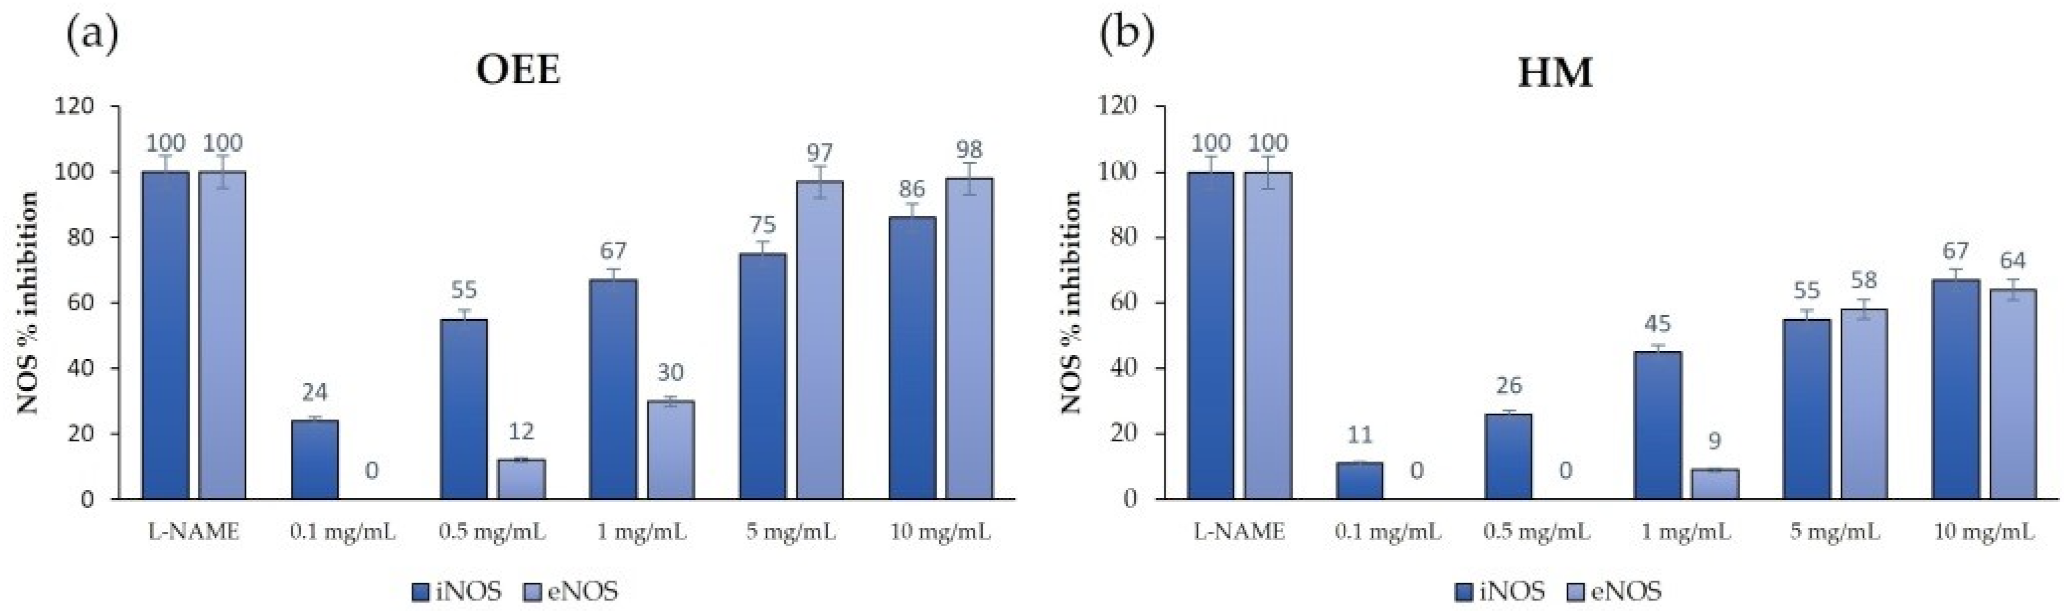
3.3. Target and off Target: iNOS and eNOS
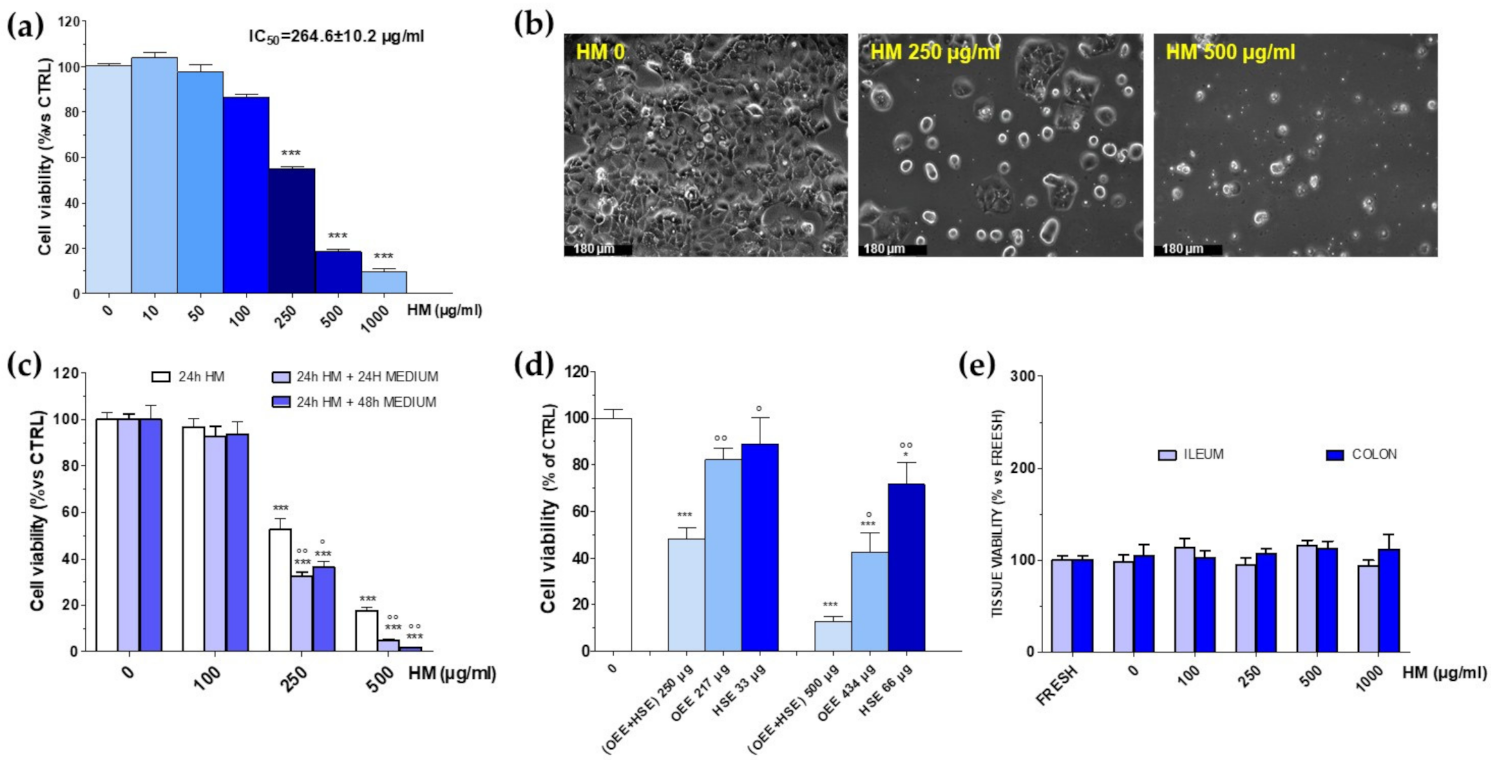
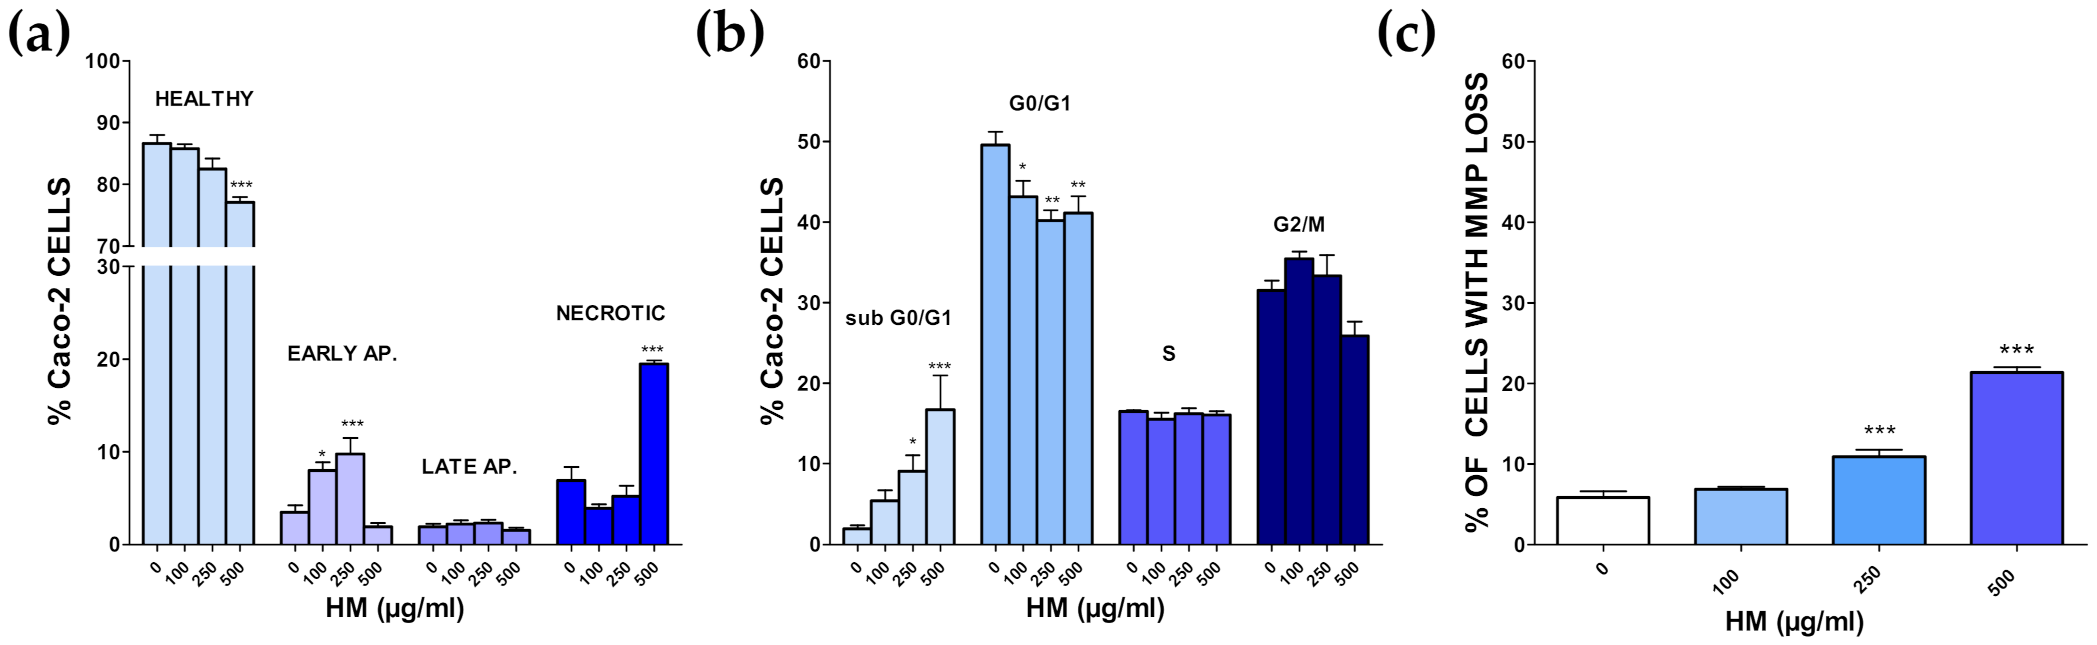
3.4. Additional Target: Anticancer Activities
4. Discussion
5. Conclusions
Author Contributions
Funding
Institutional Review Board Statement
Informed Consent Statement
Data Availability Statement
Conflicts of Interest
References
- Santini, A.; Tenore, G.C.; Novellino, E. Nutraceuticals: A paradigm of proactive medicine. Eur. J. Pharm. Sci. 2017, 96, 53–61. [Google Scholar] [CrossRef] [PubMed]
- Budriesi, R.; Ioan, P.; Micucci, M.; Micucci, E.; Limongelli, V.; Chiarini, A. Stop Fitan: Antispasmodic Effect of Natural Extract of Chestnut Wood in Guinea Pig Ileum and Proximal Colon Smooth Muscle. J. Med. Food 2010, 13, 1104–1110. [Google Scholar] [CrossRef]
- Budriesi, R.; Vivarelli, F.; Canistro, D.; Aldini, R.; Babot Marquillas, C.; Corazza, I.; Fato, R.; Cirillo, S.; Bergamini, C.; D’Errico, A.; et al. Liver and intestinal protective effects of Castanea sativa Mill. bark extract in high-fat diet rats. PLoS ONE 2018, 13, e0201540. [Google Scholar] [CrossRef] [PubMed]
- Micucci, M.; Ioan, P.; Aldini, R.; Cevenini, M.; Alvisi, V.; Ruffilli, C.; Chiarini, A.; Budriesi, R. Castanea sativa Mill. extract contracts gallbladder and relaxes sphincter of Oddi in guinea pig: A natural approach to biliary tract motility disorders. J. Med. Food 2014, 17, 795–803. [Google Scholar] [CrossRef]
- Micucci, M.; Protti, M.; Aldini, R.; Frosini, M.; Corazza, I.; Marzetti, C.; Mattioli, L.B.; Tocci, G.; Chiarini, A.; Mercolini, L.; et al. Thymus vulgaris L. essential oil solid formulation: Chemical profile, spasmolytic and antimicrobial effects. Biomolecules 2020, 10, 860. [Google Scholar] [CrossRef]
- Micucci, M.; Budriesi, R.; Aldini, R.; Fato, R.; Bergamini, C.; Vivarelli, F.; Canistro, D.; Bolchi, C.; Chiarini, A.; Rizzardi, N.; et al. Castanea sativa Mill. bark extract cardiovascular effects in a rat model of high-fat diet. Phytother. Res. 2021, 35, 2145–2156. [Google Scholar] [CrossRef]
- Ma, X.H.; Zheng, C.J.; Han, L.Y.; Xie, B.; Jia, J.; Cao, Z.W.; Li, Y.X.; Chen, Y.Z. Synergistic therapeutic actions of herbal ingredients and their mechanism from molecular interaction and network perspectives. Drug Discov. Today 2009, 14, 579–588. [Google Scholar] [CrossRef]
- Micucci, M.; Malaguti, M.; Toschi, T.G.; Di Lecce, G.; Aldini, R.; Angeletti, A.; Chiarini, A.; Budriesi, R.; Hrelia, S. Cardiac and Vascular Synergic Protective Effect of Olea europea L. Leaves and Hibiscus sabdariffa L. Flower Extracts. Oxid. Med. Cell Longev. 2015, 2015, 318125. [Google Scholar] [CrossRef] [Green Version]
- Micucci, M.; Angeletti, A.; Cont, M.; Corazza, I.; Aldini, R.; Donadio, E.; Chiarini, A.; Budriesi, R. Hibiscus sabdariffa L. Flowers and Olea europea L. Leaves Extract-Based Formulation for Hypertension Care: In Vitro Efficacy and Toxicological Profile. J. Med. Food 2016, 19, 504–512. [Google Scholar] [CrossRef]
- Zamponi, G.W.; Striessnig, J.; Koschak, A.; Dolphin, A.C. The Physiology, Pathology, and Pharmacology of Voltage-Gated Calcium Channels and Their Future Therapeutic Potential. Pharmacol. Rev. 2015, 67, 821–870. [Google Scholar] [CrossRef] [Green Version]
- Ioan, P.; Carosati, E.; Micucci, M.; Cruciani, G.; Broccatelli, F.; Zhorov, B.S.; Chiarini, A.; Budriesi, R. 1,4-Dihydropyridine scaffold in medicinal chemistry, the story so far and perspectives (part 1): Action in ion channels and GPCRs. Curr. Med. Chem. 2011, 18, 4901–4922. [Google Scholar] [CrossRef]
- Carosati, E.; Ioan, P.; Micucci, M.; Broccatelli, F.; Cruciani, G.; Zhorov, B.S.; Chiarini, A.; Budriesi, R. 1,4-Dihydropyridine scaffold in medicinal chemistry, the story so far and perspectives (part 2): Action in other targets and antitargets. Curr. Med. Chem. 2012, 19, 4306–4323. [Google Scholar] [CrossRef]
- Camilleri, M.; Boeckxstaens, G. Dietary and pharmacological treatment of abdominal pain in IBS. Gut 2017, 66, 966–974. [Google Scholar] [CrossRef]
- Sohn, J.J.; Schetter, A.J.; Yfantis, H.G.; Ridnour, L.A.; Horikawa, I.; Khan, M.A.; Robles, A.I.; Hussain, S.P.; Goto, A.; Bowman, E.D.; et al. Macrophages, Nitric Oxide and microRNAs are associated with DNA damage response pathway and senescence in inflammatory bowel disease. PLoS ONE 2012, 7, e44156. [Google Scholar] [CrossRef] [Green Version]
- Maccallini, C.; Arias, F.; Gallorini, M.; Amoia, P.; Ammazzalorso, A.; De Filippis, B.; Fantacuzzi, M.; Giampietro, L.; Cataldi, A.; Camacho, M.E.; et al. Antiglioma activity of aryl and amido-aryl acetamidine derivatives targeting iNOS: Synthesis and biological evaluation. ACS Med. Chem. Lett. 2020, 11, 1470–1475. [Google Scholar] [CrossRef]
- Gallorini, M.; Maccallini, C.; Ammazzalorso, A.; Amoia, P.; De Filippis, B.; Fantacuzzi, M.; Giampietro, L.; Cataldi, C.; Amoroso, R. The selective acetamidine-based iNOS inhibitor CM544 reduces glioma cell proliferation by enhancing PARP-1 cleavage in vitro. Int. J. Mol. Sci. 2019, 20, 495. [Google Scholar] [CrossRef] [Green Version]
- Wang, H.; Wang, L.; Xie, Z.; Zhou, S.; Li, Y.; Zhou, Y.; Sun, M. Nitric Oxide (NO) and NO Synthases (NOS)-based targeted therapy for colon cancer. Cancers 2020, 12, 1881. [Google Scholar] [CrossRef]
- Pasanisi, P.; Gariboldi, M.; Verderio, P.; Signoroni, S.; Mancini, A.; Rivoltini, L.; Milione, M.; Masci, E.; Ciniselli, C.M.; Bruno, E.; et al. A Pilot Low-Inflammatory Dietary Intervention to Reduce Inflammation and Improve Quality of Life in Patients with Familial Adenomatous Polyposis: Protocol Description and Preliminary Results. Integr. Cancer Ther. 2019, 18, 1534735419846400. [Google Scholar] [CrossRef]
- Perrinjaquet-Moccetti, T.; Busjahn, A.; Schmidlin, C.; Schmidt, A.; Bradl, B.; Aydogan, C. Food supplementation with an olive (Olea europaea L.) leaf extract reduces blood pressure in borderline hypertensive monozygotic twins. Phytother. Res. 2008, 22, 1239–1242. [Google Scholar] [CrossRef]
- Chiano, E.; Micucci, M.; Budriesi, R.; Mattioli, L.B.; Marzetti, C.; Corsini, M.; Frosini, M. Hibiscus Flowers and Olive Leaf Extracts Activate Apoptosis in SH-SY5Y Cells. Antioxidants 2021, 10, 1962. [Google Scholar] [CrossRef]
- McGrath, J.C.; Drummond, G.B.; McLachlan, E.M.; Kilkenny, C.; Wainwright, C.L. Guidelines for reporting experiments involving animals: The ARRIVE guidelines. Br. J. Pharmacol. 2010, 160, 1573–1576. [Google Scholar] [CrossRef] [Green Version]
- Maccallini, C.; Gallorini, M.; Sisto, F.; Akdemir, A.; Ammazzalorso, A.; De Filippis, B.; Fantacuzzi, M.; Giampietro, L.; Carradori, S.; Cataldi, A.; et al. New azolyl-derivatives as multitargeting agents against breast cancer and fungal infections: Synthesis, biological evaluation and docking study. J. Enzym. Inhib. Med. Chem. 2021, 36, 1632–1645. [Google Scholar] [CrossRef]
- Terzuoli, E.; Nannelli, G.; Frosini, M.; Giachetti, A.; Ziche, M.; Donnini, S. Inhibition of cell cycle progression by the hydroxytyrosol-cetuximab combination yields enhanced chemotherapeutic efficacy in colon cancer cells. Oncotarget 2017, 8, 83207–83224. [Google Scholar] [CrossRef] [Green Version]
- Chiaino, E.; Micucci, M.; Durante, M.; Budriesi, R.; Gotti, R.; Marzetti, C.; Chiarini, A.; Frosini, M. Apoptotic-Induced Effects of Acacia Catechu Willd. Extract in Human Colon Cancer Cells. Int. J. Mol. Sci. 2020, 21, 2102. [Google Scholar] [CrossRef] [Green Version]
- Santulli, C.; Brizi, C.; Micucci, M.; Del Genio, A.; De Cristofaro, A.; Bracco, F.; Pepe, G.L.; di Perna, I.; Budriesi, R.; Chiarini, A.; et al. Castanea sativa Mill. Bark Extract Protects U-373 MG Cells and Rat Brain Slices Against Ischemia and Reperfusion Injury. J. Cell Biochem. 2017, 118, 839–850. [Google Scholar] [CrossRef]
- Chiaino, E.; Micucci, M.; Cosconati, S.; Novellino, E.; Budriesi, R.; Chiarini, A.; Frosini, M. Olive Leaves and Hibiscus Flowers Extracts-Based Preparation Protect Brain from Oxidative Stress-Induced Injury. Antioxidants 2020, 9, 806. [Google Scholar] [CrossRef]
- Tallarida, R.J.; Murray, R.B. Manual of Pharmacologic Calculations with Computer Programs, 2nd ed.; Springer: New York, NY, USA, 1987; pp. 31–35. [Google Scholar]
- Motulsky, H.J. Prism 5 Statistics Guide; GraphPad Software Inc.: San Diego, CA, USA, 2007; Available online: https://cdn.graphpad.com/faq/2/file/Prism_v5_Statistics_Guide.pdf (accessed on 21 June 2021).
- Motulsky, H.; Christopoulos, A. Fitting Models to Biological Data Using Linear and Non-Linear Regression. 2003. Available online: https://www.facm.ucl.ac.be/cooperation/Vietnam/WBI-Vietnam-October-2011/Modelling/RegressionBook.pdf (accessed on 21 June 2021).
- Drossman, D.A. The functional gastrointestinal disorders and the Rome III process. Gastroenterology 2006, 130, 1377–1390. [Google Scholar] [CrossRef]
- Sinagra, E.; Morreale, G.C.; Mohammadian, G.; Fusco, G.; Guarnotta, V.; Tomasello, G.; Cappello, F.; Rossi, F.; Amvrosiadis, G.; Raimondo, D. New therapeutic perspectives in irritable bowel syndrome: Targeting low-grade inflammation, immuno-neuroendocrine axis, motility, secretion and beyond. World J. Gastroenterol. 2017, 23, 6593–6627. [Google Scholar] [CrossRef] [Green Version]
- Barbara, G.; Cremon, C.; De Giorgio, R.; Dothel, G.; Zecchi, L.; Bellacosa, L.; Carini, G.; Stanghellini, V.; Corinaldesi, R. Mechanisms Underlying Visceral Hypersensitivity in Irritable Bowel Syndrome. Curr. Gastroenterol. Rep. 2011, 13, 308–315. [Google Scholar] [CrossRef]
- Kobayashi, S.; Ikeda, K.; Suzuki, M.; Yamada, T.; Miyata, K. Effects of YM950, a novel muscarinic M3 receptor antagonist, on experimental models of bowel dysfunction in vivo. Jpn. J. Pharmacol. 2001, 86, 281–288. [Google Scholar] [CrossRef] [Green Version]
- Golder, M.; Burleigh, D.E.; Belai, A.; Ghali, L.; Ashby, D.; Lunniss, P.J.; Navsaria, H.A.; Williams, N.S. Smooth muscle cholinergic denervation hypersensitivity in diverticular disease. Lancet 2003, 361, 1945–1951. [Google Scholar] [CrossRef]
- Lee, K.J. Pharmacologic Agents for Chronic Diarrhea. Intest. Res. 2015, 13, 306–312. [Google Scholar] [CrossRef] [Green Version]
- Petkov, V.; Manolov, P. Pharmacological analysis of the iridoid oleuropein. Arzneimittelforschung 1972, 22, 1476–1486. [Google Scholar]
- Esmaeili-Mahani, S.; Rezaeezadeh-Roukerd, M.; Esmaeilpour, K.; Abbasnejad, M.; Rasoulian, B.; Sheibani, V.; Kaeidi, A.; Hajializadeh, Z. Olive (Olea europaea L.) leaf extract elicits antinociceptive activity, potentiates morphine analgesia and suppresses morphine hyperalgesia in rats. J. Ethnopharmacol. 2010, 132, 200–205. [Google Scholar] [CrossRef]
- Xu, F.; Li, Y.; Zheng, M.; Xi, X.; Zhang, X.; Han, C. Structure Properties, Acquisition Protocols and Biological Activities of Oleuropein Aglycone. Front. Chem. 2018, 6, 239. [Google Scholar] [CrossRef] [PubMed] [Green Version]
- Camilleri, M.; Ford, A.C. Pharmacotherapy for Irritable Bowel Syndrome. J. Clin. Med. 2017, 6, 101. [Google Scholar] [CrossRef] [Green Version]
- Zhao, Z.; Ukidve, A.; Kim, J.; Mitragotri, S. Targeting Strategies for Tissue-Specific Drug Delivery. Cell 2020, 181, 151–167. [Google Scholar] [CrossRef]
- Ali, M.K.; Ashraf, A.; Biswas, N.N.; Karmakar, U.K.; Afroz, S. Antinociceptive, anti-inflammatory and antidiarrheal activities of ethanolic calyx extract of Hibiscus sabdariffa Linn. (Malvaceae) in mice. Chin. J. Integr. Med. 2011, 9, 626–631. [Google Scholar] [CrossRef] [PubMed]
- Diez-Echave, P.; Vezza, T.; Rodríguez-Nogales, A.; Ruiz-Malagón, A.J.; Hidalgo-García, L.; Garrido-Mesa, J.; Molina-Tijeras, J.A.; Romero, M.; Robles-Vera, I.; Pimentel-Moral, S.; et al. The prebiotic properties of Hibiscus sabdariffa extract contribute to the beneficial effects in diet-induced obesity in mice. Food Res. Int. 2020, 127, 108722. [Google Scholar] [CrossRef]
- Sayago-Ayerdi, S.G.; Zamora-Gasga, V.M.; Venema, K. Changes in gut microbiota in predigested Hibiscus sabdariffa L calyces and Agave (Agave tequilana weber) fructans assessed in a dynamic in vitro model (TIM-2) of the human colon. Food Res. Int. 2020, 132, 109036. [Google Scholar] [CrossRef]
- Lubis, M.; Siregar, G.A.; Bangun, H.; Ilyas, S. The effect of roselle flower petals extract (Hibiscus sabdariffa Linn.) on reducing inflammation in dextran sodium sulfateinduced colitis. Med. Glas. 2020, 17, 395–3401. [Google Scholar]
- Torchilin, V.P. Drug targeting. Eur. J. Pharm. Sci. 2000, 11 (Suppl. 2), S81–S91. [Google Scholar] [CrossRef]
- Kotla, N.G.; Rana, S.; Sivaraman, G.; Sunnapu, O.; Vemula, P.K.; Pandit, A.; Rochev, Y. Bioresponsive drug delivery systems in intestinal inflammation: State-of-the-art and future perspectives. Adv. Drug Deliv. Rev. 2019, 146, 248–266. [Google Scholar] [CrossRef] [PubMed]
- Chourasia, M.K.; Jain, S.K. Pharmaceutical approaches to colon targeted drug delivery systems. J. Pharm. Pharm. Sci. 2003, 6, 33–66. [Google Scholar] [PubMed]
- Ginger, E.; Andújar, I.; Recio, M.C.; Ríos, J.L.; Cerdá-Nicolás, J.M.; Giner, R.M. Oleuropein ameliorates acute colitis in mice. J. Agric. Food Chem. 2011, 59, 12882–12892. [Google Scholar] [CrossRef]
- Ginger, E.; Giner, E.; Recio, M.C.; Ríos, J.L.; Giner, R.M. Oleuropein protects against dextran sodium sulfate-induced chronic colitis in mice. J. Nat. Prod. 2013, 76, 1113–1120. [Google Scholar] [CrossRef]
- Fakhraei, N.; Abdolghaffari, A.H.; Delfan, B.; Abbasi, A.; Rahimi, N.; Khansari, A.; Rahimian, R.; Dehpour, A.R. Protective effect of hydroalcoholic olive leaf extract on experimental model of colitis in rat: Involvement of nitrergic and opioidergic systems. Phytother. Res. 2014, 28, 1367–1373. [Google Scholar] [CrossRef] [PubMed]
- Coussens, L.M.; Werb, Z. Inflammation and cancer. Nature 2002, 420, 860–867. [Google Scholar] [CrossRef] [PubMed]
- Rejhova, A.; Opattova, A.; Cumova, A.; Sliva, D.; Vodicka, P. Natural compounds and combination therapy in colorectal cancer treatment. Eur. J. Med. Chem. 2018, 144, 582–594. [Google Scholar] [CrossRef]
- Ruzzolini, J.; Peppicelli, S.; Bianchini, F.; Andreucci, E.; Urciuoli, S.; Romani, A.; Tortora, K.; Caderni, G.; Nediani, C.; Calorini, L. Cancer Glycolytic Dependence as a New Target of Olive Leaf Extract. Cancers 2020, 12, 317. [Google Scholar] [CrossRef] [Green Version]
- Ruzzolini, J.; Peppicelli, S.; Andreucci, E.; Bianchini, F.; Scardigli, A.; Romani, A.; la Marca, G.; Nediani, C.; Calorini, L. Oleuropein, the Main Polyphenol of Olea Europaea Leaf Extract, Has an Anti-Cancer Effect on Human BRAF Melanoma Cells and Potentiates the Cytotoxicity of Current Chemotherapies. Nutrients 2018, 10, 1950. [Google Scholar] [CrossRef] [Green Version]
- Borzì, A.; Biondi, A.; Basile, F.; Luca, S.; Vicari, E.; Vacante, M. Olive Oil Effects on Colorectal Cancer. Nutrients 2018, 11, 32. [Google Scholar] [CrossRef] [PubMed] [Green Version]
- Sepporta, M.V.; Fuccelli, R.; Rosignoli, P.; Ricci, G.; Servili, M.; Fabiani, R. Oleuropein Prevents Azoxymethane-Induced Colon Crypt Dysplasia and Leukocytes DNA Damage in A/J Mice. J. Med. Food 2016, 19, 983–989. [Google Scholar] [CrossRef] [PubMed]
- Riaz, G.; Chopra, R. A review on phytochemistry and therapeutic uses of Hibiscus sabdariffa L. Biomed. Pharmacother. 2018, 102, 575–586. [Google Scholar] [CrossRef]
- Mazziotti, A.; Mazzotti, F.; Pantusa, M.; Sportelli, L.; Sindona, G. Pro-oxidant activity of oleuropein determined in vitro by electron spin resonance spin-trapping methodology. J. Agric. Food Chem. 2006, 54, 7444–7449. [Google Scholar] [CrossRef] [PubMed]
- Imran, M.; Nadeem, M.; Gilani, S.A.; Khan, S.; Sajid, M.W.; Amir, R.M. Antitumor Perspectives of Oleuropein and Its Metabolite Hydroxytyrosol: Recent Updates. J. Food Sci. 2018, 83, 1781–1791. [Google Scholar] [CrossRef] [Green Version]
- From the American Association of Neurological Surgeons (AANS); American Society of Neuroradiology (ASNR); Cardiovascular and Interventional Radiology Society of Europe (CIRSE); Canadian Interventional Radiology Association (CIRA); Congress of Neurological Surgeons (CNS); European Society of Minimally Invasive Neurological Therapy (ESMINT); European Society of Neuroradiology (ESNR); European Stroke Organization (ESO); Society for Cardiovascular Angiography and Interventions (SCAI); Society of Interventional Radiology (SIR); et al. Multisociety Consensus Quality Improvement Revised Consensus Statement for Endovascular Therapy of Acute Ischemic Stroke. Int. J. Stroke 2018, 13, 612–632. [Google Scholar]
- Tsai, T.C.; Huang, H.P.; Chang, Y.C.; Wang, C.J. An anthocyanin-rich extract from Hibiscus sabdariffa Linnaeus inhibits N-nitrosomethylurea-induced leukemia in rats. J. Agric. Food Chem. 2014, 62, 1572–1580. [Google Scholar] [CrossRef]
- Yang, C.S.; Wang, H.; Chen, J.X.; Zhang, J. Effects of tea catechins on cancer signaling pathways. Enzymes 2014, 36, 195–221. [Google Scholar]
- Goldsmith, C.D.; Bond, D.R.; Jankowski, H.; Weidenhofer, J.; Stathopoulos, C.E.; Roach, P.D.; Scarlett, C.J. The olive biophenols oleuropein and hydroxytyrosol selectively reduce proliferation, influence the cell cycle, and induce apoptosis in pancreatic cancer cells. Int. J. Mol. Sci. 2018, 19, 1937. [Google Scholar] [CrossRef] [Green Version]
- Uranga, J.A.; López-Miranda, V.; Lombó, F.; Abalo, R. Food, nutrients and nutraceuticals affecting the course of inflammatory bowel disease. Pharmacol. Rep. 2016, 68, 816–826. [Google Scholar] [CrossRef] [PubMed]


| Compound | HSE a | OEE a |
|---|---|---|
| Hibiscus acid | 139.20 ± 0.47 | |
| Secoiridoids b | 309.83 ± 0.65 | |
| Hydroxycinnamic acids | 4.67 ± 0.44 | |
| Flavonols | 0.69 ± 0.06 | |
| Flavones | 10.77 ± 0.93 |
| Ileum | Colon | |||||
|---|---|---|---|---|---|---|
| % Intrinsic Activity a | IC50 b (mg/mL) | 95% C.L. | % Intrinsic Activity a | IC50 b (mg/mL) | 95% C.L. | |
| OEE | 90.0 ± 1.7 (10.0 mg/mL) | 0.77 | 0.68−0.89 | 75.0 ± 2.4 (0.4 mg/mL) | 0.13 | 0.08−0.20 |
| HSE | 21.0 ± 0.7 (5.0 mg/mL) | 20.0 ± 1.3 (10.0 mg/mL) | ||||
| HM | 90.0 ± 1.2 (10.0 mg/mL) | 1.39 | 1.13−1.54 | 85.0 ± 1.3 (1.0 mg/mL) | 0.28 | 0.22−0.36 |
| OB # | 90 ± 3 (0.0056 mg/mL, 10 µM) | 0.0048 (8.52 µM) | 0.0040−0.0057 (7.14−10.11 µM) | 90 ± 2.3 (0.02 mg/mL, 50 µM) | 0.0019 (3.43 µM) | 0.0015−0.0025 (2.65−4.44 µM) |
| Ileum | Tone | Variability | |
|---|---|---|---|
| OEE | Long | ↑ up to 5.0 mg/mL | ↓↓↓ LF from 1.0 mg/mL |
| Circ | ↔ | ↑ LF and MF (only at 0.1 mg/mL), then ↓ | |
| HSE | Long | ↓↓↓ only at 10.0 mg/mL | ↓ all the FB (only at 10.0 mg/mL) |
| Circ | ↓ with concentration, maximum effect at 5.0 mg/mL | ↑↑↑ LF and MF (at 5.0 mg/mL) | |
| HM | Long | ↑ up to 0.5 mg/mL, then ↓ | ↔ up to 0.5 mg/mL, then ↓ at all the FB |
| Circ | ↔ up to 1.0 mg/mL, then ↓ | ↓ with concentration of all FB | |
| OB | Long | ↓ with concentration | Global reduction; MF and HF progressive ↓; ↓↓↓ LF only at high concentrations. |
| Circ | ↔ | ↔ | |
| Colon | Tone | Variability | |
|---|---|---|---|
| OEE | Long | ↓ maximal effect at 5.0 mg/mL | ↑ LF and MF bands (up to 0.5 mg/mL), then ↓ |
| Circ | ↓ (very weak) with concentration | ↓ of all the FB with concentration | |
| HSE | Long | ↓ only at 1.0 mg/mL | ↑ LF (up to 1.0 mg/mL); ↑MF (up to 0.5 mg/mL); ↓ of ll the FB for higher frequencies. |
| Circ | ↓ (up to 1.0 mg/mL), then ↑↑↑ | ↑↑↑ of LF and MF (0.5 and 1.0 mg/mL): (at 10.0 mg/mL) | |
| HM | Long | ↓ with concentration | ↓ with concentrations of all FB |
| Circ | ↓ (weak) with concentration | ↑ LF with concentration; MF ↑ (at 10.0 mg/mL) | |
| OB | Long | ↓ (only at 0.0056 mg/mL) | ↓HF (at 0.0056 mg/mL) |
| Circ | ↔ | ↓ (weak) LF (at 0.0056 mg/mL) | |
| Left Atrium | Right Atrium | Aorta | ||||||||||
|---|---|---|---|---|---|---|---|---|---|---|---|---|
| Negative Inotropy | Negative Inotropy | Negative Chronotropy | Vasorelaxant | |||||||||
| Intrinsic Activity a | EC50 b | 95% C.L. | Intrinsic Activity c | EC50 b | 95% C.L. | Intrinsic Activity d | EC50 b | 95% C.L. | Intrinsic Activity e | EC50 b | 95% C.L. | |
| OEE | 68.0 ± 2.4 (1) | 0.14 | 0.10–0.18 | 81.0 ± 1.5 (1) | 0.35 | 0.28–0.35 | 37.0 ± 2.4 (10) | 90.0 ± 1.1 (10) | 5.15 | 4.68–5.59 | ||
| HSE | 76.0 ± 0.9 (1) | 0.27 | 0.21–0.35 | 71.0 ± 2.4 (1) | 0.26 | 0.19–0.34 | 46.0 ± 0.7 (1) | 93.0± 1.4 (10) | 6.63 | 6.34–6.92 | ||
| HM | 60.0 ± 1.4 (1.0) | 0.16 | 0.12–0.20 | 84.0 ± 2.0 (10) | 1.21 | 1.10–1.33 | 70.0 ± 3.6 (10) | 5.89 | 5.56–6.25 | |||
| OB # | 92.0 ± 1.6 | 69.0 ± 1.6 | 1.0 ± 0.1 | 5.0 ± 0.2 | ||||||||
| (0.00056) | 0.000021 | 0.000019–0.000022 | (0.0056) | 0.000027 | 0.000021–0.000031 | (0.056) | (0.056) | |||||
| (1) | 0.037 | 0.034–0.039 | (10) | 0.049 | 0.037–0.055 | (100) | (100) | |||||
| iNOS | eNOS | eNOS/iNOS Selectivity | |
|---|---|---|---|
| IC50 (mg/mL) | |||
| OEE | 0.485 ± 0.024 | 1.460 ± 0.071 | 3.140 |
| HM | 0.743 ± 0.029 | 2.051 ± 0.094 | 2.760 |
Publisher’s Note: MDPI stays neutral with regard to jurisdictional claims in published maps and institutional affiliations. |
© 2022 by the authors. Licensee MDPI, Basel, Switzerland. This article is an open access article distributed under the terms and conditions of the Creative Commons Attribution (CC BY) license (https://creativecommons.org/licenses/by/4.0/).
Share and Cite
Mattioli, L.B.; Frosini, M.; Amoroso, R.; Maccallini, C.; Chiano, E.; Aldini, R.; Urso, F.; Corazza, I.; Micucci, M.; Budriesi, R. Olea europea L. Leaves and Hibiscus sabdariffa L. Petals Extracts: Herbal Mix from Cardiovascular Network Target to Gut Motility Dysfunction Application. Nutrients 2022, 14, 463. https://doi.org/10.3390/nu14030463
Mattioli LB, Frosini M, Amoroso R, Maccallini C, Chiano E, Aldini R, Urso F, Corazza I, Micucci M, Budriesi R. Olea europea L. Leaves and Hibiscus sabdariffa L. Petals Extracts: Herbal Mix from Cardiovascular Network Target to Gut Motility Dysfunction Application. Nutrients. 2022; 14(3):463. https://doi.org/10.3390/nu14030463
Chicago/Turabian StyleMattioli, Laura Beatrice, Maria Frosini, Rosa Amoroso, Cristina Maccallini, Elda Chiano, Rita Aldini, Francesco Urso, Ivan Corazza, Matteo Micucci, and Roberta Budriesi. 2022. "Olea europea L. Leaves and Hibiscus sabdariffa L. Petals Extracts: Herbal Mix from Cardiovascular Network Target to Gut Motility Dysfunction Application" Nutrients 14, no. 3: 463. https://doi.org/10.3390/nu14030463
APA StyleMattioli, L. B., Frosini, M., Amoroso, R., Maccallini, C., Chiano, E., Aldini, R., Urso, F., Corazza, I., Micucci, M., & Budriesi, R. (2022). Olea europea L. Leaves and Hibiscus sabdariffa L. Petals Extracts: Herbal Mix from Cardiovascular Network Target to Gut Motility Dysfunction Application. Nutrients, 14(3), 463. https://doi.org/10.3390/nu14030463