Article

Lactiplantibacillus plantarum DSM20174 Attenuates the Progression of Non-Alcoholic Fatty Liver Disease by Modulating Gut Microbiota, Improving Metabolic Risk Factors, and Attenuating Adipose Inflammation

by
José I. Riezu-Boj
1,2,3,†,
Miguel Barajas
4,†,
Tania Pérez-Sánchez
4,
María J. Pajares
3,4,
Miriam Araña
4,
Fermín I. Milagro
1,2,3,5,*,‡ and
Raquel Urtasun
4,*,‡
1
Department of Nutrition, Food Sciences, and Physiology, University of Navarra, 31008 Pamplona, Spain
2
Center for Nutrition Research, University of Navarra, 31008 Pamplona, Spain
3
Navarra Institute for Health Research (IdiSNA), 31008 Pamplona, Spain
4
Biochemistry Area, Department of Health Science, Public University of Navarre, 31008 Pamplona, Spain
5
Centro de Investigación Biomédica en Red Fisiopatología de la Obesidad y Nutrición (CIBERobn), Instituto de Salud Carlos III, 28029 Madrid, Spain
*
Authors to whom correspondence should be addressed.
These authors contributed equally to this work.
R.U. and F.I.M. share senior authorship.
Nutrients 2022, 14(24), 5212; https://doi.org/10.3390/nu14245212
Submission received: 2 November 2022 / Revised: 26 November 2022 / Accepted: 1 December 2022 / Published: 7 December 2022
(This article belongs to the Special Issue Role of Lactobacillus and Probiotics in Human Health and Diseases)

Abstract

:
Non-alcoholic fatty liver disease (NAFLD) is the most common cause of chronic liver disease, reaching epidemic proportions worldwide. Targeting the gut–adipose tissue–liver axis by modulating the gut microbiota can be a promising therapeutic approach in NAFLD. Lactiplantibacillus plantarum, a potent lactic-acid-producing bacterium, has been shown to attenuate NAFLD. However, to our knowledge, the possible effect of the Lactiplantibacillus plantarum strain DSM20174 (L.p. DSM20174) on the gut–adipose tissue axis, diminishing inflammatory mediators as fuel for NAFLD progression, is still unknown. Using a NAFLD mouse model fed a high-fat, high-fructose (HFHF) diet for 10 weeks, we show that L.p DSM20174 supplementation of HFHF mice prevented weight gain, improved glucose and lipid homeostasis, and reduced white adipose inflammation and NAFLD progression. Furthermore, 16S rRNA gene sequencing of the faecal microbiota suggested that treatment of HFHF-fed mice with L.p DSM20174 changed the diversity and altered specific bacterial taxa at the levels of family, genus, and species in the gut microbiota. In conclusion, the beneficial effects of L.p DSM20174 in preventing fatty liver progression may be related to modulations in the composition and potential function of gut microbiota associated with lower metabolic risk factors and a reduced M1-like/M2-like ratio of macrophages and proinflammatory cytokine expression in white adipose tissue and liver.

1. Introduction

Non-alcoholic fatty liver disease (NAFLD) is reaching epidemic proportions worldwide, being the leading cause of chronic liver disease [1]. Excessive accumulation of triglycerides within hepatocytes characterises steatosis. However, the presence of additional histological abnormalities, such as lobular inflammation and hepatocyte injury, may determinate progression to a more severe stage termed as non-alcoholic steatohepatitis (NASH). NASH can lead to serious liver damage, including cirrhosis and hepatocarcinoma (HCC) [2]. Although individuals with steatosis have a benign clinical course, a wide range of affected patients (10–30%) develop NASH over time, with a poor long-term prognosis [3]. However, despite significant efforts in recent years to discover new drugs, no approved therapies are yet available to treat NASH. NAFLD is closely related to metabolic syndrome, insulin resistance, and type 2 diabetes mellitus [4]. Although overweight and obesity are the main drivers to develop metabolic syndrome and NAFLD, not all patients with obesity progress to metabolic fatty liver disease.
The underlying mechanism for the development and progression of NAFLD is complex and multifactorial [5,6]. Pathological connections between several organs, including an intricate triangle interplay between the gut, adipose tissue, and liver, seems to be involved [7,8]. In the liver, uncontrollable lipotoxicity facilitates reactive oxygen species (ROS) formation, which ultimately activates a cascade of apoptotic signals, thus promoting liver injury, inflammation, and fibrogenesis [9]. Moreover, the liver integrates gut- and adipose-tissue-derived signals, contributing to NASH progression [10]. Obesity and diet composition may affect gut microbial homeostasis and the intestinal integrity barrier, thus favouring gut–liver dysfunction. For example, disturbed intestinal permeability favours the influx of bacterial products and pathogen-associated molecular patterns (PAMPs) into the gut–liver axis, contributing to inflammation that further triggers NASH progression [11,12]. Gut-bacteria-derived lipopolysaccharide (LPS) and other PAMPs may also be key drivers of adipose tissue inflammation. Thus, metabolically unhealthy adipose tissue is characterised by an increase in proinflammatory macrophages also known as “M1” along with a decrease in anti-inflammatory macrophages or “M2” [13]. M1 macrophages secrete pro-inflammatory cytokines that ultimately inhibit insulin signalling in adipocytes, contributing to systemic insulin resistance. In contrast, M2 macrophages secrete anti-inflammatory cytokines that maintain insulin responsiveness [14,15]. A pivotal role for macrophages in the crosstalk between adipose tissue and NAFLD has been proposed. In this regard, several studies point to the fact that adipose tissue inflammation probably precedes liver inflammation. Supporting this idea, mouse models of NASH show increased expression of macrophage and inflammatory genes in adipose tissue earlier that in the liver [16,17]. In addition, intervention of NAFLD by removing the inflamed white adipose tissue (WAT) prevented NASH progression in animal models [18]. On the other hand, macrophages from obese visceral adipose tissue transplanted into mice amplified hepatic inflammation through increased hepatic macrophage infiltration [19]. In recent years, increasingly more attention has been paid to the role of gut microecology on diseases. In this regard, scientific evidence shows that beneficial bacteria or probiotics can modulate the gut microbiome. They are considered as a novel approach to prevent and treat different metabolic diseases such as NAFLD [20]. Lactobacillus plantarum (now known as Lactiplantibacillus plantarum, L.p.) is considered a potential probiotic and is present in various environments, such as soil and the human gut [21]. Different strains of L.p. have demonstrated beneficial effects on NAFLD through various mechanisms such as restoration of gut microbiota [22] and intestinal permeability [23], also reducing the novo fatty acid synthesis [21], oxidant stress [21,24], metabolic endotoxemia [25], and liver inflammation [23]. However, to our knowledge, the potential effect of the strain type L.p. DSM20174 on NAFLD progression is still unknown. Therefore, the present study aimed to investigate the beneficial effect of L.p DSM20174 on the modulation of gut microbial composition and its possible relationship with metabolic risk factors and adipose tissue inflammation in a mouse model of high-fat, high-fructose diet (HFHF)-induced NAFLD.

2. Materials and Methods

2.1. Animal and Experimental Design

The animal care and use protocol was approved by the Institutional Committee on Care and Use of Laboratory Animals (CEEA, University of Navarra, Protocol number: 017-20). All animal procedures were performed in accordance with the guidelines on animal welfare of the European Directive 2010/63/EEC and the RD 53/2013. All animal handling and methods complied with the ARRIVE guidelines. The 8-week-old male C57BL/6 mice were purchased from Envigo Laboratories (Horst, The Netherlands). After two weeks of acclimation, the animals were randomly divided and allocated into three groups (n = 6 each). In the normal diet group (ND group), animals received a chow diet (2014 Tekland Global 14% Protein Rodent Maintenance Diet, Envigo, Horst, The Netherlands) and water. In the high-fat, high-fructose group (HFHF group), animals were fed with a high-fat diet rich in lard (60% kcal from fat Teklad Diet TD.06414, Envigo) and fructose (Sigma-Aldrich, St. Louis, MO, USA) at 10% in the drinking water for 10 weeks. The HFHF group plus Lactobacillum plantarum DSM20174 involved ingesting L.p 39 (IAM 12477), a type strain isolated from a pickled cabbage from the Spanish Collection of Type Cultures (CECT) (reference CECT 748T), for 10 weeks (HFHF + L.p group).
The nutritional content of the experimental diets is shown in Tables S1 and S2. In the HFHF + L.p group, the probiotic was administrated at a daily dose of 1 × 10⁹ CFU per animal, mixed in with the experimental diet. At the end of the experimental period (10 weeks), animals were sacrificed by cervical dislocation after overnight fasting for the collection of tissues and blood samples.

2.2. Body Weight and Serum Biochemical Analysis

During the experimental study, body weight was measured weekly. Serum was obtained from blood samples after centrifugation at a maximum speed of 3.000 rpm for 15 min at 4 °C in a Beckman coulter centrifuge. The supernatant (serum) was collected and diluted 1/10 with saline for the determination of cholesterol, HDL cholesterol (HDL), triglycerides (TG), and non-esterified fatty acids (NEFA) on a Roche/Hitachi Cobas analyser system.

2.3. Fasting Blood Glucose and Tolerance Test

Mice were fasted overnight, with free access to water prior to the test, and blood samples were obtained from the tip of the tail vein. Glucose concentrations were monitored using a pre-calibrated glucometer (Accu-chek Aviva, Roche, Basel, Switzeland), and glycemia was recorded once a week. Serum C-peptide was assayed by the sandwich ELISA method using an Ultra-Sensitive Mouse C-peptide ELISA kit (Abynkek Biopharma, Derio, Spain). The glucose tolerance test (GTT) was assessed at the end of the experimental animal protocol.
Mice were fasted overnight, and 2 g/kg body weight of glucose was injected intraperitoneally. Measurement of blood glucose levels was performed at 0, 20, 40, 60, 90, and 120 min after glucose injection by collection of tail blood samples. The area under the curve (AUC) of glucose values was assessed for each group from 0 to 120 min. The Homeostasis Model Assessment of Insulin Resistance (HOMA-IR) by C-peptide was calculated by the formula: HOMA-IR = serum C-peptide (nmol L−1) × serum glucose (nmol L−1)/22.5 [26]. The product of fasting triglycerides and glucose (TYG index) is a commonly used insulin resistance marker related to metabolic disorders [27]. The TYG index was calculated following the formula: TYG index = ln [Fasting triglyceride (mg/dL) × Fasting glucose (mg/dL)]/2.

2.4. Liver and Adipose Histology and Morphometry

Liver and epididymal adipose tissue obtained from necropsy were fixed in 10% formalin for 24 h. The tissues were dehydrated with xylene, were paraffin embedded, and were processed for haematoxylin and eosin (H&E) staining. For immunohistochemical (IHC) analysis, sections of white adipose tissue (WAT) and liver were stained with a primary anti-macrophage CD68 antibody (Cell signalling) and F4/80 antibody (Millipore), respectively, and counterstained with haematoxylin. The slides were digitised using a histology slide scanner Amperio CS (Leica Biosystems). The morphometric estimation of hepatic steatosis and the semi-quantitative IHC of CD68 and F4/80 was analysed with ImageJ Fiji software. To quantify adipocyte number and areas in the adipose tissue, digital images were analysed with the Adiposoft software (CIMA, University of Navarra).

2.5. Quantitative Real-Time PCR (RT-qPCR)

Total RNA was extracted from the livers and adipose tissue of mice using an RNAeasy Mini Kit (Qiagen, Germantown, MD, USA). Then, cDNA synthesis (RT) was performed with RT Premix (Invitrogen). Quantitative real-time PCRs (qPCR) were performed with the IQ SYBR Green Supermix (Bio-Rad, Hercules, CA, USA) in a CFX96 Real-Time System (Bio-Rad, Hercules, CA, USA). Gene expression was normalised relative to that of the housekeeping gene RPLPO (ribosomal protein lateral stalk subunit PO). The primer pairs used are listed in Table 1. Heat map and hierarchical clustering of gene expression was calculated using CFX manager software version 1.5 (Bio-rad, Hercules, CA, USA).

2.6. Faecal Microbiome Analysis

Faecal samples were collected at the end of the study before the dissection of the mice, using an aseptic technique and immediately frozen at −80 °C for metagenomic analyses. Faecal DNA was extracted from the stool samples obtained from the three mice groups (n = 6 mice per group) at the end of the experimental animal protocol and sequenced on the MiSeq platform (Illumina, San Diego, CA, USA) in CIMA Labs Diagnostics (Pamplona, Spain). Bacterial DNA isolation was carried out with a Promega-Maxwell® RSC equipment using the Maxwell RSC Fecal Microbiome DNA Kit (Promega Corporation, Madison, WI, USA). For each DNA sample, the V3–V4 hypervariable regions of the 16S rRNA gene were amplified using specific primers (Illumina). The 16S rRNA sequences were filtered following quality criteria of the processing pipeline LotuS (release 1.58) [28]. The pipeline includes UPARSE de novo sequence clustering for the identification of OTUs (operational taxonomic units) and their abundance matrix generation by similarities in DNA sequence (Table S3). Finally, taxonomy was assigned using the Greengenes database. The OTUs not identified with this database were reanalysed by BLAST and the Ribosomal Database Project (RDP).

2.7. Statistical Analysis

Except for microbiota, statistical analyses were performed with GraphPad Prism 8.0 software. Data were expressed as the mean ± standard deviation (SD). The statistical analyses of body weight, serum glucose levels over time, and glucose tolerance test were performed by two-way repeated measures ANOVA followed by Bonferroni post hoc test. Comparisons among groups were tested by one-way analysis of variance (ANOVA) followed by Bonferroni post hoc test. Student’s t or Mann–Whitney U test was used for the two group comparisons once normality was calculated with a Shapiro–Wilk test. p < 0.05 was considered statistically significant. Microbiota data (as families, genera, and species) were analysed using the MicrobiomeAnalyst platform [29]. Alpha diversity of gut microbiota (observed genera and species) were analysed using a nonparametric test. Analysis of the β-diversity represented by principal coordinate analysis (PCoA) was calculated using the Bray–Curtis index and PERMANOVA test. Statistical differences in microbiota abundances between groups were tested by EdgeR (Empirical Analysis for Digital Gene Expression in R) previously normalised using trimmed mean of values normalisation (TMM). The association between microbiota and underlying factors contributing to NAFLD was evaluated by Spearman correlation using Stata 16 separately in metabolic parameters and inflammatory gene expression corrected by FDR (considered significant when FDR < 0.05).

3. Results

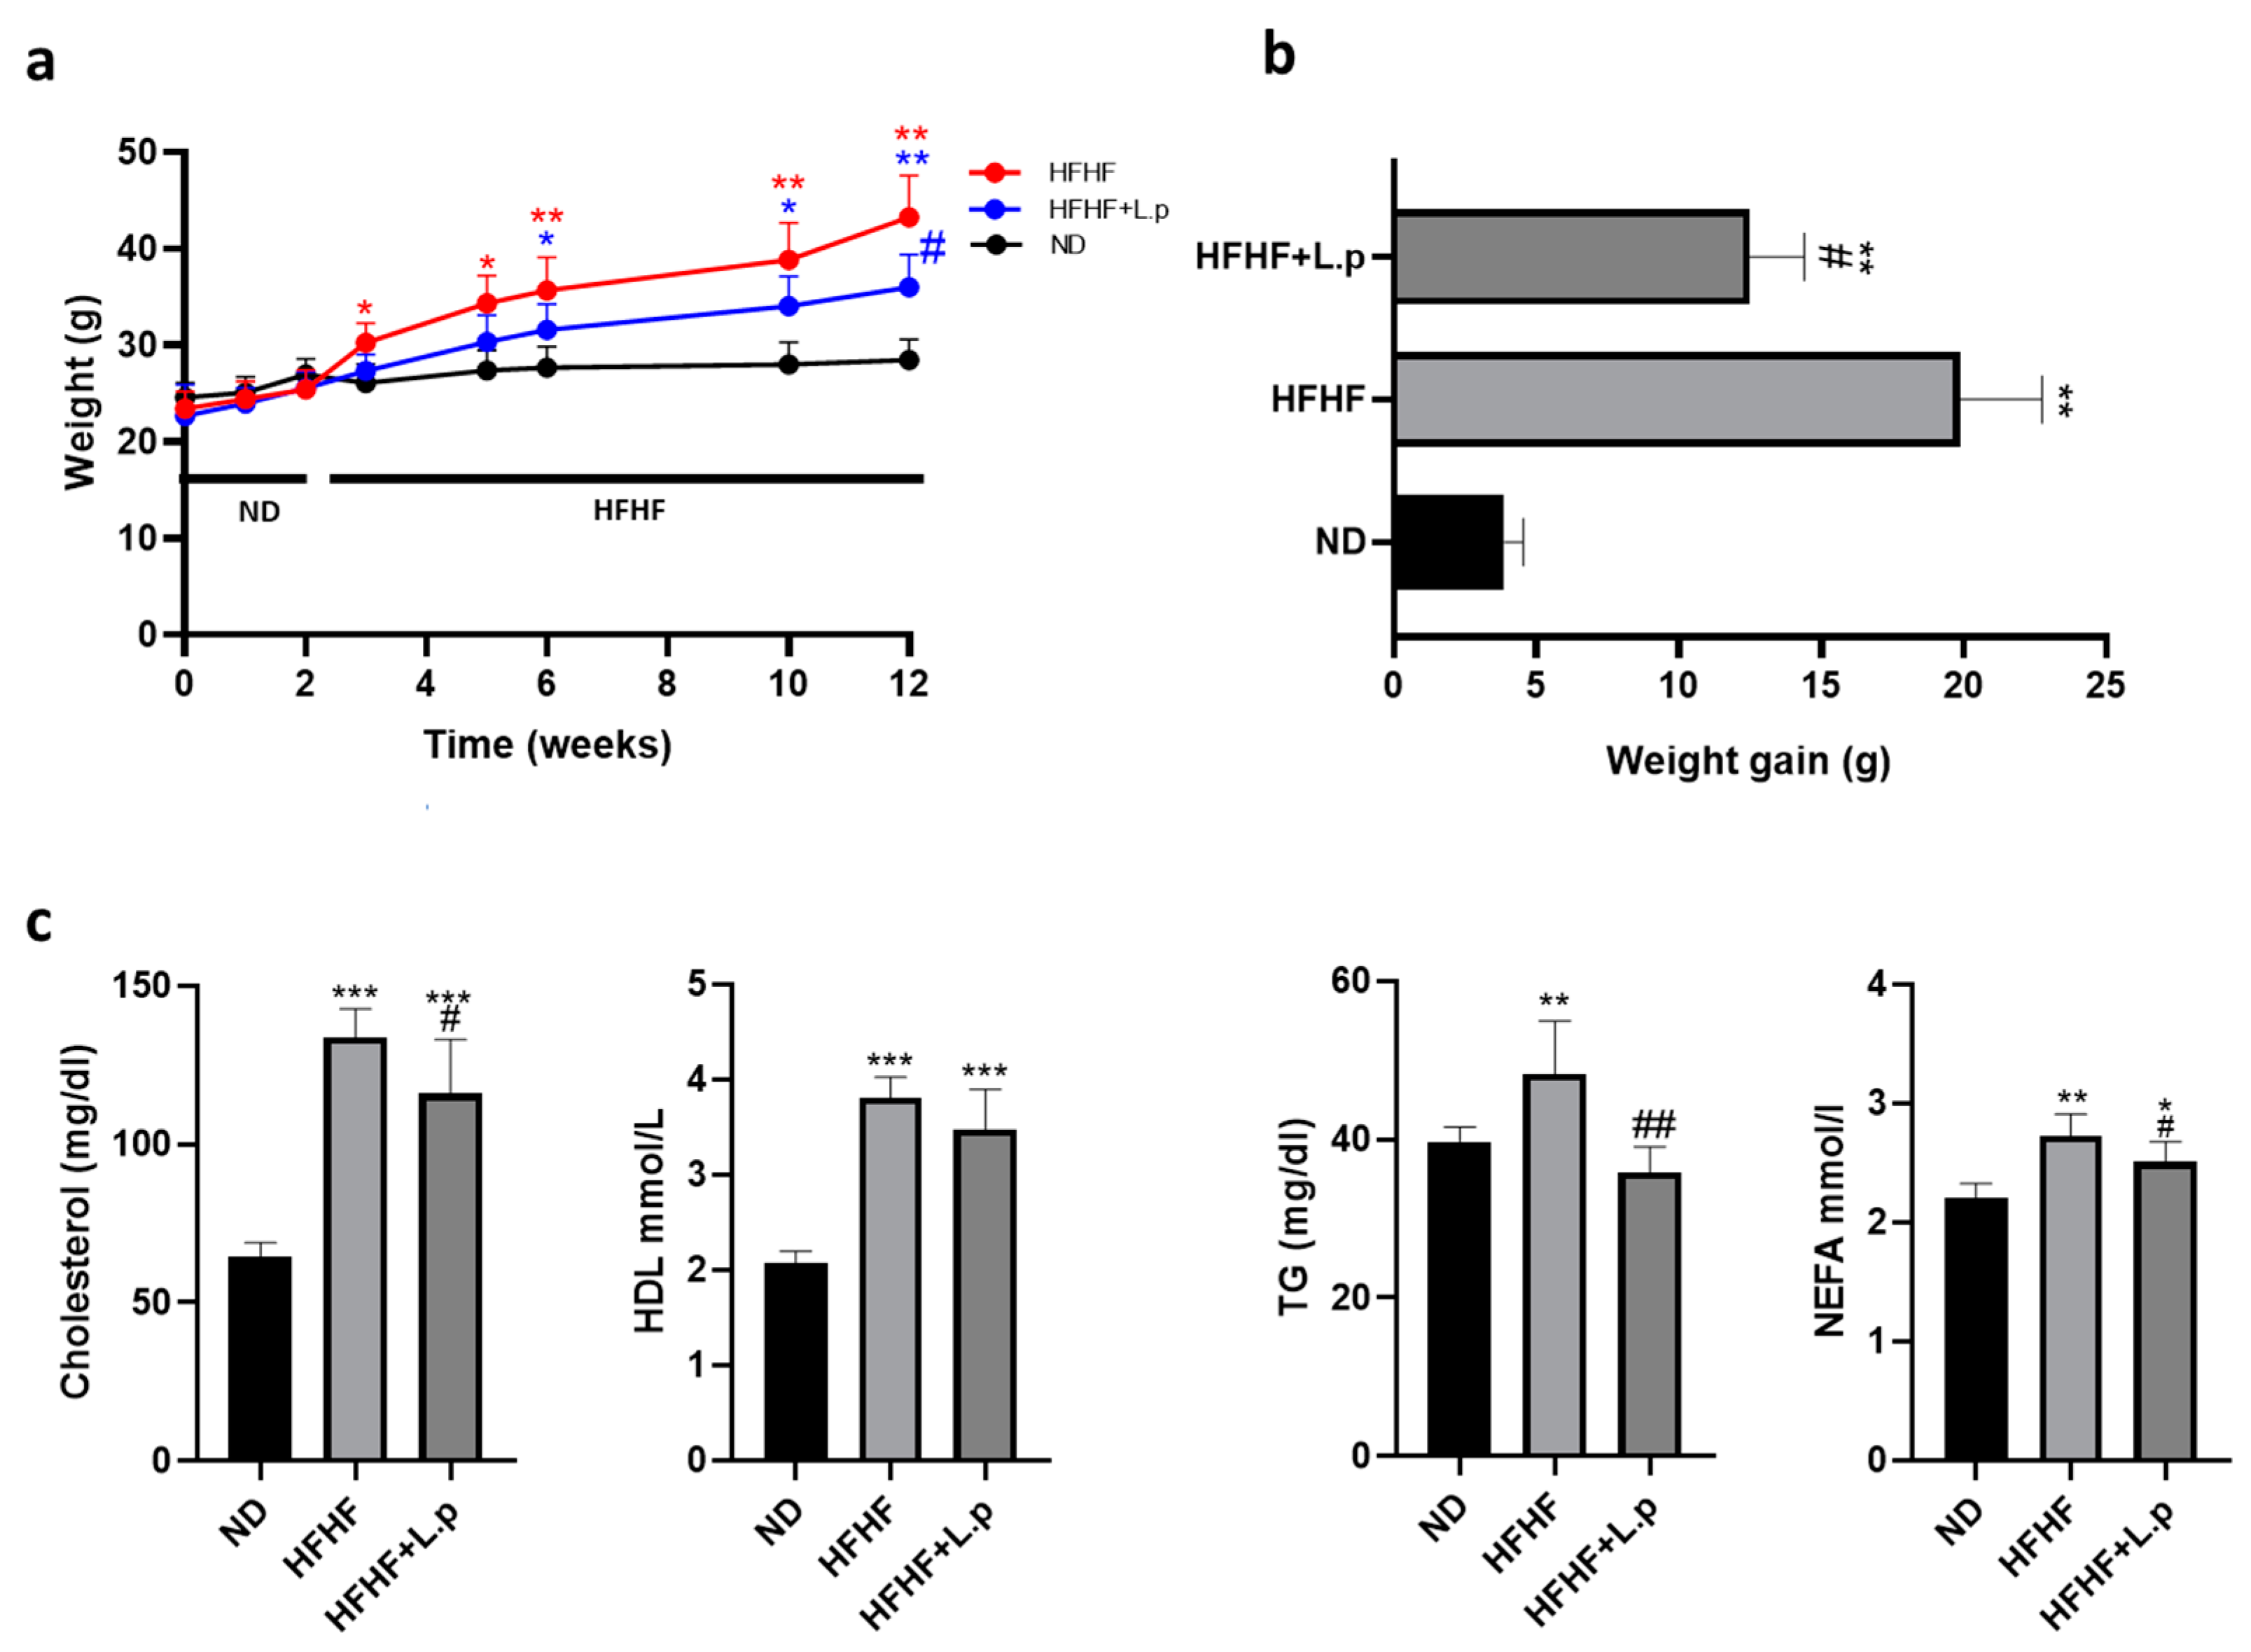
3.1. Effect of Lactiplantibacillus plantarum DSM 20174 on Body Weight and Serum Lipids

To investigate the effects of Lactiplantibacillus plantarum DSM 20174 (L.p DSM20174) on NAFLD, we established a murine model of NAFLD by feeding mice with an HFHF diet for ten weeks. HFHF feeding increased body weight significantly compared with the ND group (Figure 1a,b). Notably, L.p DSM20174 supplementation significantly prevented body weight gain in the HFHF-fed mice at the end of the experiment (Figure 1a,b). Serum levels of total cholesterol, HDL, TG, and NEFAs were significantly increased in the HFHF group (Figure 1c). After ten weeks, L.p DSM20174 supplementation in HFHF-fed mice significantly reduced serum TG, total cholesterol, and NEFAs compared with the HFHF group (Figure 1c). There were no significant differences in the serum levels of HDL among the HFHF groups (Figure 1c).

3.2. Effect of Lactiplantibacillus plantarum DSM 20174 on Glucose Metabolism

After ten weeks of HFHF feeding, fasting glucose, c-peptide levels, and HOMA-IR in the HFHF group were found to be significantly higher than in the ND group (Figure 2a,b). In contrast, glucose, serum c-peptide levels, and HOMA-IR remained lower in the HFHF group supplemented with L.p DSM20174 (Figure 2a,b). As expected, mice fed the HFHF diet showed significantly impaired glucose tolerance and insulin sensitivity compared to those in the ND group, as measured by the glucose tolerance test (GTT) (Figure 2c). In the GTT, the HFHF group had significantly higher blood glucose levels at 0, 40, 90, and 120 min compared to the ND group. Moreover, L.p DSM20174 administration significantly prevented the impaired glucose tolerance caused by the HFHF diet (Figure 2c). Similarly, the AUC derived from the GTT was significantly larger for the HFHF group compared with the rest of groups (Figure 2c). HFHF consumption increased the TYG index, with L.p DSM20174 significantly decreasing this index (Figure 2d).

3.3. Effect of Lactiplantibacillus plantarum DSM 20174 on Adipose Tissue Inflammation

Histological examination of WAT showed that HFHF diet increased the size of adipocytes at the end of the experiment (Figure 3a). This trend was further confirmed by quantification of adipocyte area using automated software, which showed that the average area was 4846 ± 650 µm2 for mice on an HFHF diet, while that for those on ND was only 1159 ± 475 µm2. Supplementation of HFHF with L.p DSM20174 had no significant effect on mean adipocyte size or surface area (4529 ± 757 µm2) (Figure 3b). Expansion of WAT and hypertrophy of adipocytes are usually associated with adipose inflammation. WAT inflammation was defined by the presence of dead adipocytes surrounded by macrophages forming crown-like structures (CLS). After ten weeks of HFHF diet exposure, the CLS were present in the WAT samples. Interestingly, supplementation with L.p DSM20174 decreased the number of CLS (Figure 3a, arrowheads). Moreover, aggregates of CD68-positive macrophages were significantly higher in CLS surrounding individual adipocytes of the HFHF group as a hallmark of localised chronic inflammation. On the contrary, the WAT of the HFHF mice supplemented with L.p DSM20174 showed significantly fewer CD68-positive macrophage rings around the adipocytes (Figure 3c). To further confirm the presence of adipose tissue inflammation, we studied the expression of various macrophage and inflammatory genes. Adipose tissue macrophages (ATMs) were classified as M1 or “classically activated” and M2 or “alternatively activated” macrophages. HFHF diet alters the balance of ATMs towards the pro-inflammatory M1 phenotype. The expression of pan-macrophage marker genes (F4/80 and CD68) and M1-associated genes (MCP1, CD44 and CD11c) increased remarkably in the HFHF group. However, L.p DSM20174 supplementation significantly attenuated F4/80, MCP1, and CD11c mRNA and decreased CD68 and CD44 mRNA expression (Figure 3d). Moreover, L.p DSM20174 treatment significantly upregulated the expression of M2-associated genes, including CHI3L3 and RETNLA. L.p DSM20174 supplementation also decreased the gene expression of Th1 pro-inflammatory cytokines (IL1B and IL6) and increased Th2 anti-inflammatory factors (IL4 and IL5) in the WAT of the HFHF-fed mice. Previous works demonstrated that pro-inflammatory cytokine secretion compromised adipogenesis by blocking the PPARγ transcriptional network in adipose tissue [30,31]. Our results are consistent with these findings and showed less PPARγ and SREBP gene expression in the adipose tissue of the HFHF-fed mice compared with those in the ND group. However, L.p DSM20174 supplementation ameliorated the downregulation of those genes in HFHF-fed mice (Figure 3d).

3.4. Effect of Lactiplantibacillus plantarum DSM 20174 on Hepatic Lipid Acumulation

Scientific evidence has shown that low-grade inflammation causes adipose tissue dysfunction. These alterations have been associated with local and systemic insulin resistance and lipid deposition in non-adipose organs such as the liver [28,29]. Our data indicate that HFHF diet consumption for ten weeks leads to development of NAFLD in mice. Histological analysis of the liver sections showed no signs of steatosis in the ND group. The liver of HFHF-fed mice accumulated extensive microvesicular steatosis and showed a slight increase in portal and lobular inflammation (Figure 4a). However, L.p DSM20174 supplementation significantly prevented HFHF-induced steatosis and lobular inflammation (Figure 4a,b). We also performed immunostaining for F4/80 as a monocyte-macrophage marker of hepatic infiltration and distribution in the liver. In the ND and HFHF group supplemented with L.p DSM20174, macrophages showed a scattered distribution in the liver. On the other hand, in the HFHF group, some macrophages aggregated to surround hepatocytes with large lipid droplets, a phenomenon previously termed “hepatic CLS” [30]. The number of F4/80-positive hepatic CLS was significantly increased in the HFHF group (Figure 4b). To confirm lipid accumulation and hepatic inflammatory status, we analysed the expression of several genes involved in lipid metabolism and inflammation in the liver. Our results showed a significant increase in the mRNA expression of adipogenic (PPARγ, CD36), lipogenic (FASN), and fatty acid β-oxidation (CPT1) genes in the HFHF group compared to the ND and HFHF + L.p groups. The relative gene expression of IL6, TLR4, and MCP1 was significantly lower in the L.p DSM20174 treatment group compared to the HFHF group. No significant differences were found in F4/80 gene expression (Figure 4c). Hierarchical cluster analysis of these genes grouped HFHF separately from the rest of the groups (Figure 4d).

3.5. Effect of Lactiplantibacillus plantarum DSM 20174 on the Diversity of the Intestinal Microbiota

Recent pieces of evidence have demonstrated that gut microbiota might be a potential target for treating obesity and related metabolic diseases, such as NAFLD [32]. Nonetheless, there is growing evidence that some dietary substances, especially probiotics and prebiotics, can modulate gut microbiota.
This study examined the effect of L.p DSM20174 on the composition and diversity of gut microbiota of HFHF-fed mice. HFHF groups showed a significant increase in Firmicutes/Bacteroidetes ratio (ND = 0.47 ± 0.24; HFHF = 1.52 ± 1.06 and HFHF + L.p = 1.44 ± 1.09). The α-diversity of gut microbiota (measured as the number of unique taxa observed in each sample) was significantly higher in the HFHF group supplemented with L.p DSM20174 compared to ND and HFHF groups in terms of genera (Figure 5(aA)) and species (Figure 5(aB)). Analysis of the β-diversity represented by principal coordinate analysis (PCoA) based on Bray–Curtis dissimilarity of the genus profiles showed significant compositional differences among the three groups (Figure 5b). The results were statistically validated by the pairwise PERMANOVA p-value of <0.001.

3.6. Effect of Lactiplantibacillus plantarum DSM 20174 on Gut Microflora

Using the EdgeR statistical method, we analysed the differential abundance in gut microbiota composition among the three groups. We have only on those taxa (families, genera, and species) that present significant differences between HFHF and HFHF + L.p (Figure 6). At the family level, in the HFHF group, the relative abundance of Christenseneliaceae (belonging to the phylum Firmicutes) was significantly higher than in the ND group.
Interestingly, L.p DSM20174 supplementation in the HFHF diet reduced the relative abundance of this family (Figure 6a). At the genus level, in the HFHF group, the relative abundance of Christensenella and Phocaicola was higher than in the ND group. In contrast, the relative abundance of Acetatifactor, Duncaniella, Monoglobus and Lawsonibacter was lower in the HFHF group compared to the ND group. Interestingly, L.p DSM20174 supplementation partially prevented the HFHF-diet-induced changes in the relative abundance of these six genera (Figure 6b). At the species level, L.p DSM20174 supplementation significantly reduced Ruminococcus torques levels compared to the HFHF and ND groups (Figure 6c). Finally, Lactiplantibacillus plantarum spp. was detected only in faecal samples of mice supplemented with L.p DSM20174.

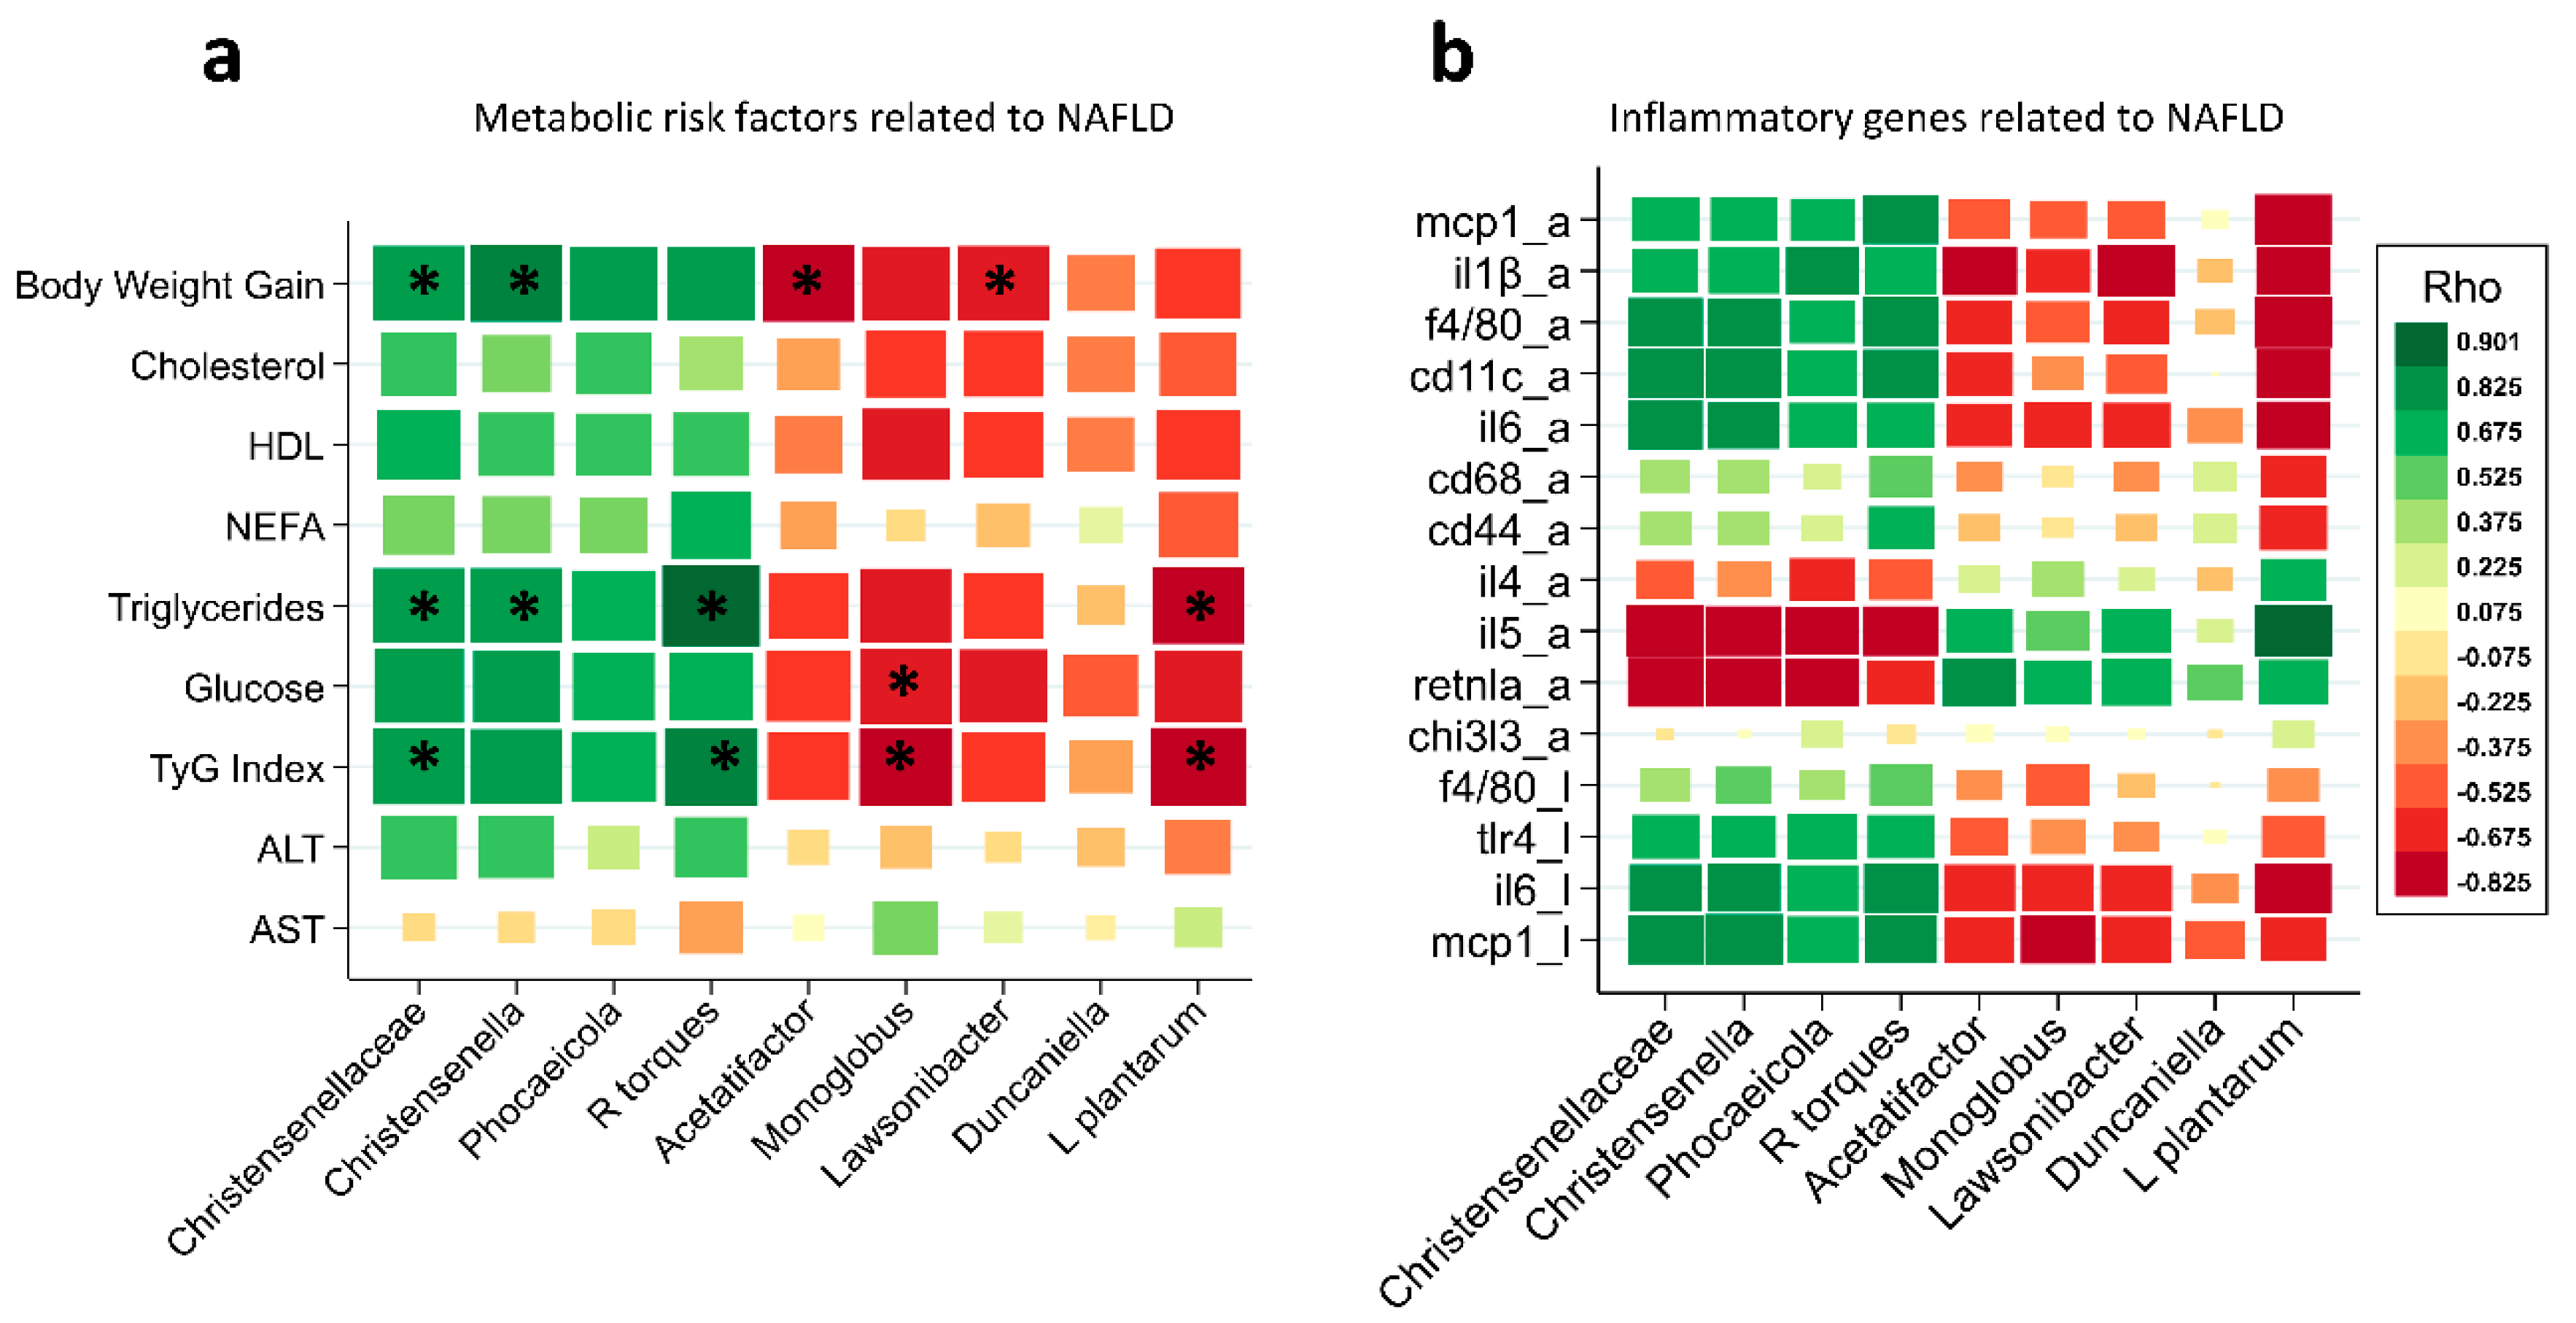
3.7. Association of Some Microbial Taxa with Urderlying Factors Contributing to NAFLD

Spearman’s correlation coefficient was used to analyse the relations between significant intestinal bacteria changes in HFHF-fed mice and metabolic risk factors (Figure 7a) or inflammatory genes (Figure 7b) associated with NAFLD.
First, the association between metabolic risk factors associated with NAFLD and gut microbiota changes was studied. As shown in Figure 7a, body weight gain, triglyceride levels, and the TYG index showed a positive and strong association with the Christensenellaceae family, Christensenella genus, and Ruminococcus torques. In contrast, Monoglobus levels were negatively associated with the TYG index and blood glucose, Lactiplantibacillus plantarum abundance was negatively associated with the TYG index and triglyceride levels, and Acetatifactor and Lawsonibacter abundances were negatively correlated with body weight gain.
Second, it is well known that NAFLD progression is associated with impaired function of genes involved in WAT and hepatic inflammation. To comprehensively analyse the relations between inflammatory gene expression and gut microbiota, another correlation matrix was generated. The expression of pan- (F4/80) and M1 (MCP1, CD11c) macrophage markers and proinflammatory (IL1B, IL6) genes in WAT and liver were positively associated with Christensenellaceae, Christensenella, Phocaicola, and Ruminococcus torque abundance. In contrast, the same microbial taxa correlated negatively with the expression of a M2-macrophage-related gene (RENTLA) and with the IL5 gene in WAT. On the other hand, Acetatifactor and Lawsonibacter were negatively associated with IL1B gene expression in WAT but positively correlated with RENTLA expression. Lactiplantibacillus plantarum DSM20174 correlated negatively with the expression of pan- (F4/80) and M1 (MCP1, CD11c) macrophage markers and pro-inflammatory (IL1B, IL6) genes in WAT and liver but positively correlated with the expression of IL5 in WAT (Figure 7b).

4. Discussion

Lactiplantibacillus plantarum is a lactic-acid-producing bacterium found in many fermented foods. Different strains of Lactiplantibacillus plantarum reduce metabolic abnormalities, including obesity-induced hepatic steatosis [21,22,23,24,25]. However, the role of Lactiplantibacillus plantarum DSM 20174 (L.p DSM20174) in preventing NAFLD progression has not yet been demonstrated. Our results showed that L.p DSM20174 supplementation could improve diet-induced obesity, ameliorate glucose and lipid metabolic disturbances, and prevent hepatic steatosis in a diet-induced NAFLD mouse model. The beneficial effects of L.p DSM20174 can be explained by different mechanisms, including the modulation of gut microbiota composition associated with lower metabolic risk factors and a reduced M1/M2 macrophage ratio in WAT. Both mechanisms could play essential roles in preventing fatty liver progression in a diet-induced obese model of NAFLD in mice.
Association of the gut microbiota with metabolic risk factors in NAFLD
Regarding the first mechanism, diet is considered the primary driver of gut microbiome community structure. Beta-diversity showed that HFHF feeding significantly impacted gut microbial composition and significantly altered the relative abundance of bacteria consistent with previous reports [33]. L.p DSM20174 supplementation significantly restored the relative abundance values of specific bacterial taxa to near normal levels.
Moreover, it increased the alpha diversity of the gut microbiota (associated with a healthy state of the individual). Our results, in agreement with previous studies in mice, showed that Christensenellaceae and Christensenella increased their relative abundance in the gut in response to HFD feeding [34,35,36]. The correlation matrix analyses also showed that Christensenellaceae and Christensenella positively correlated with body weight gain, triglyceride levels, and the TYG index, a marker of insulin resistance with high specificity in identifying metabolic syndrome [27]. L.p DSM20174 supplementation decreased the relative abundance of Christensenellaceae and Christensenella and reduced the body weight gain, serum lipid levels, and the TYG index, decreasing the likelihood of suffering from insulin resistance and metabolic syndrome in an HFFD-fed mouse model. In addition, L.p DSM20174 significantly reduced the relative abundance of Ruminococcus torques, positively associated with triglyceride levels and TYG index. Consistent with this, previous researchers showed that a HFHF diet resulted in dysbiosis with increased Bacteroides spp. and Ruminococcus torques [37]. Furthermore, a recent study demonstrated that Ruminococcus torques is one of the most predictive bacterial species for obesity [38]. Our research also showed that the relative abundance of Acetatifactor and Lawsinobacter correlated negatively with increased body weight. L.p DSM20174 administration specifically increased the relative abundance of Acetatifactor to levels even higher than usual. In the literature, the Acetatifactor genus has been described to activate the bile acid membrane receptor TGR4 and, in this way, stimulate GLP-1 secretion, which improves obesity [39] and, consequently, liver function and tolerance to insulin and glucose [40]. The present work also describes that the abundance of Monoglobus and Lactiplantibacillus plantarum spp. increases after L.p DSM20174 supplementation in HFHF mice. Interestingly, Monoglobus and Lactiplantibacillus plantarum spp. correlated negatively with an altered lipid profile, glucose levels, and TYG index. Monoglogus pectinilyticus spp., which has a highly specialised glycobiome for pectin degradation, is present in humans with a high intake of dietary fibre and pectin [41] and is more common in the gut microbiome of mice fed a very low-calorie diet [42]. Several studies have demonstrated the beneficial effect of oral treatments with different strains of Lactiplantibacillus plantarum in lowering blood triglyceride levels [43,44]. However, to our knowledge, this is the first study to show a negative correlation between the relative abundance of Lactiplantibacillus plantarum spp. in the gut and an altered lipid profile.
Association of the gut microbiota with adipose tissue inflammation.
Regarding the second mechanism, our results demonstrate that L.p DSM20174 plays an essential role in modulating the inflammatory response in the white adipose tissue by shifting adipose M1/M2 polarisation toward the M2 phenotype. The M2 activation inflammatory program in adipose tissue may prevent disease progression locally and in the liver. In the literature, the importance of ATMs in NAFLD was further corroborated in humans, as both the adipose tissue expression of pro-inflammatory genes and the number of ATMs were associated with the progression of NAFLD [45]. The influence of L.p DSM20174 on the gut microbiota may be involved in modulating the inflammatory response in adipose tissue. In this sense, increased abundance of Acetatifactor, Monoglobus, Lawsonibacter, and Lactiplantibacillus plantarum spp., together with decreased abundance of Christensenellaceae, Christensenella, Phocaeicola, and Ruminococcus torques, positively correlated with a reduced M1/M2 ratio of macrophages, increased the expression of the Il5 gene in adipose tissue, and decreased expression of pro-inflammatory markers in the liver. The role of L.p in triggering macrophages to the M2 phenotype has been previously described in the literature. L.p-derived extracellular vesicles induced macrophage polarisation towards the M2 state in human monocytic cells [46]. Furthermore, Lactiplantibacillus plantarum CLP-0611 polarises M1- to M2-like macrophages, thereby ameliorating colitis in mouse models [47]. However, further studies are necessary to elucidate the underlying mechanism of L.p in switching M1/M2 phenotypes in adipose tissue.
In summary, our results demonstrate that L.p DSM20174 supplementation could prevent HFHF-induced NAFLD in mice. The potential mechanism involved in this phenomenon could be due to the observed changes in the abundance of functionally relevant gut bacteria that could be directly related with decreased metabolic risk factors and the M1/M2 inflammatory state in adipose tissue.

Supplementary Materials

The following supporting information can be downloaded at: https://www.mdpi.com/article/10.3390/nu14245212/s1, Table S1: Composition of rodent maintenance diet; Table S2: Composition of mice high-fat diet; Table S3: OTU table.

Author Contributions

Conceptualisation, F.I.M., M.B. and R.U.; methodology, R.U., T.P.-S., M.B. and M.J.P.; investigation and formal analysis, R.U., M.A., M.J.P., M.B. and J.I.R.-B.; writing—original draft preparation, R.U. and J.I.R.-B.; writing—review and editing, R.U., M.B., J.I.R.-B. and F.I.M.; supervision, F.I.M., M.B., J.I.R.-B. and R.U.; funding acquisition, F.I.M., R.U. and M.B. All authors have read and agreed to the published version of the manuscript.

Funding

This research was funded by Department of University, Innovation, and Digital Transformation Government of Navarra, grant number Microliver-PC131-132.

Institutional Review Board Statement

The animal study protocol was approved by the Institutional Committee on Care and Use of Laboratory Animals (CEEA, University of Navarra (Protocol number: 017-20)). All animal procedures were performed in accordance with the guidelines on animal welfare of the European Directive 2010/63/EEC and the RD 53/2013. All animal handling and methods complied with the ARRIVE guidelines.

Informed Consent Statement

Not applicable.

Data Availability Statement

Public databases used in this study included Greengenes (http://greengenes.lbl.gov), the Ribosomal Database Project (RDP; http://rdp.cme.msu.edu), and the NCBI (http://www.ncbi.nlm.nih.gov/taxonomy) accessed on 12 September 2022. The datasets generated or analysed during the current study are available on request from the corresponding author.

Acknowledgments

We would like to thank the CIMA LAB Diagnostics facilities (Pamplona, Spain) for the 16S amplicon sequencing and Elisabeth Guruceaga (from the Bioinformatics Platform, Center for Applied Medical Research, Pamplona, Spain) for the taxonomy analysis.

Conflicts of Interest

The authors declare no conflict of interest.

References

  1. Kaufmann, B.; Reca, A.; Wang, B.; Friess, H.; Feldstein, A.E.; Hartmann, D. Mechanisms of nonalcoholic fatty liver disease and implications for surgery. Langenbeck’s Arch. Surg. 2021, 406, 1–17. [Google Scholar] [CrossRef] [PubMed]
  2. Schuster, S.; Cabrera, D.; Arrese, M.; Feldstein, A.E. Triggering and resolution of inflammation in NASH. Nat. Rev. Gastroenterol. Hepatol. 2018, 15, 349–364. [Google Scholar] [CrossRef] [PubMed]
  3. Dyson, J.K.; Anstee, Q.M.; McPherson, S. Review: Non-alcoholic fatty liver disease: A practical approach to diagnosis and staging. Frontline Gastroenterol. 2014, 5, 211. [Google Scholar] [CrossRef] [PubMed] [Green Version]
  4. Godoy-Matos, A.F.; Silva Júnior, W.S.; Valerio, C.M. NAFLD as a continuum: From obesity to metabolic syndrome and diabetes. Diabetol. Metab. Syndr. 2020, 12, 60. [Google Scholar] [CrossRef] [PubMed]
  5. Buzzetti, E.; Pinzani, M.; Tsochatzis, E.A. The multiple-hit pathogenesis of non-alcoholic fatty liver disease (NAFLD). Metab.-Clin. Exp. 2016, 65, 1038–1048. [Google Scholar] [CrossRef]
  6. Peiseler, M.; Tacke, F. Inflammatory Mechanisms Underlying Nonalcoholic Steatohepatitis and the Transition to Hepatocellular Carcinoma. Cancers 2021, 13, 730. [Google Scholar] [CrossRef]
  7. Li, X.; Wang, H. Multiple organs involved in the pathogenesis of non-alcoholic fatty liver disease. Cell Biosci. 2020, 10, 140. [Google Scholar] [CrossRef]
  8. Kořínková, L.; Pražienková, V.; Černá, L.; Karnošová, A.; Železná, B.; Kuneš, J.; Maletínská, L. Pathophysiology of NAFLD and NASH in Experimental Models: The Role of Food Intake Regulating Peptides. Front. Endocrinol. 2020, 11, 597583. [Google Scholar] [CrossRef]
  9. Rada, P.; González-Rodríguez, Á.; García-Monzón, C.; Valverde, Á.M. Understanding lipotoxicity in NAFLD pathogenesis: Is CD36 a key driver? Cell Death Dis. 2020, 11, 802. [Google Scholar] [CrossRef]
  10. Tilg, H.; Adolph, T.E.; Moschen, A.R. Multiple Parallel Hits Hypothesis in Nonalcoholic Fatty Liver Disease: Revisited after a Decade. Hepatology 2020, 73, 2021. [Google Scholar] [CrossRef]
  11. Albillos, A.; de Gottardi, A.; Rescigno, M. The gut-liver axis in liver disease: Pathophysiological basis for therapy. J. Hepatol. 2020, 72, 558–577. [Google Scholar] [CrossRef] [PubMed] [Green Version]
  12. Kolodziejczyk, A.A.; Zheng, D.; Shibolet, O.; Elinav, E. The role of the microbiome in NAFLD and NASH. EMBO Mol. Med. 2019, 11, e9302. [Google Scholar] [CrossRef] [PubMed]
  13. Tran, H.Q.; Bretin, A.; Adeshirlarijaney, A.; Yeoh, B.S.; Vijay-Kumar, M.; Zou, J.; Gewirtz, A.T. “Western Diet”-Induced Adipose Inflammation Requires a Complex Gut Microbiota. Cell. Mol. Gastroenterol. Hepatol. 2020, 9, 313–333. [Google Scholar] [CrossRef] [PubMed] [Green Version]
  14. Thomas, D.; Apovian, C. Macrophage functions in lean and obese adipose tissue. Metabolism 2017, 72, 120–143. [Google Scholar] [CrossRef]
  15. Russo, L.; Lumeng, C.N. Properties and functions of adipose tissue macrophages in obesity. Immunology 2018, 155, 407–417. [Google Scholar] [CrossRef] [Green Version]
  16. Du Plessis, J.; Van Pelt, J.; Korf, H.; Mathieu, C.; Van der Schueren, B.; Lannoo, M.; Van der Merwe, S. Association of Adipose Tissue Inflammation with Histologic Severity of Nonalcoholic Fatty Liver Disease. Gastroenterology 2015, 149, e635–e648. [Google Scholar] [CrossRef] [Green Version]
  17. Stanton, M.C.; Chen, S.C.; Jackson, J.V.; Rojas-Triana, A.; Kinsley, D.; Cui, L.; Jenh, C.H. Inflammatory Signals shift from adipose to liver during high fat feeding and influence the development of steatohepatitis in mice. J. Inflamm. 2011, 8, 1–14. [Google Scholar] [CrossRef] [Green Version]
  18. Mulder, P.; Morrison, M.C.; Wielinga, P.Y.; van Duyvenvoorde, W.; Kooistra, T.; Kleemann, R. Surgical removal of inflamed epididymal white adipose tissue attenuates the development of non-alcoholic steatohepatitis in obesity. Int. J. Obes. 2016, 40, 675–684. [Google Scholar] [CrossRef] [Green Version]
  19. Bijnen, M.; Josefs, T.; Cuijpers, I.; Maalsen, C.J.; Van De Gaar, J.; Vroomen, M.; Wouters, K. Adipose tissue macrophages induce hepatic neutrophil recruitment and macrophage accumulation in mice. Gut 2018, 67, 1317–1327. [Google Scholar] [CrossRef]
  20. Khan, A.; Ding, Z.; Ishaq, M.; Bacha, A.S.; Khan, I.; Hanif, A.; Guo, X. Understanding the Effects of Gut Microbiota Dysbiosis on Nonalcoholic Fatty Liver Disease and the Possible Probiotics Role: Recent Updates. Int. J. Biol. Sci. 2021, 17, 818–833. [Google Scholar] [CrossRef]
  21. Li, C.; Nie, S.P.; Zhu, K.X.; Ding, Q.; Li, C.; Xiong, T.; Xie, M.Y. Lactobacillus plantarum NCU116 improves liver function, oxidative stress and lipid metabolism in rats with high fat diet induced non-alcoholic fatty liver disease. Food Funct. 2014, 5, 3216–3223. [Google Scholar] [CrossRef] [PubMed]
  22. Park, E.J.; Lee, Y.S.; Kim, S.M.; Park, G.S.; Lee, Y.H.; Jeong, D.Y.; Lee, H.J. Beneficial Effects of Lactobacillus plantarum Strains on Non-Alcoholic Fatty Liver Disease in High Fat/High Fructose Diet-Fed Rats. Nutrients 2020, 12, 542. [Google Scholar] [CrossRef] [PubMed] [Green Version]
  23. Zhao, Z.; Chen, L.; Zhao, Y.; Wang, C.; Duan, C.; Yang, G.; Li, S. Lactobacillus plantarum NA136 ameliorates nonalcoholic fatty liver disease by modulating gut microbiota, improving intestinal barrier integrity, and attenuating inflammation. Appl. Microbiol. Biotechnol. 2020, 104, 5273–5282. [Google Scholar] [CrossRef] [PubMed]
  24. Zhao, Z.; Wang, C.; Zhang, L.; Zhao, Y.; Duan, C.; Zhang, X.; Li, S. Lactobacillus plantarum NA136 improves the non-alcoholic fatty liver disease by modulating the AMPK/Nrf2 pathway. Appl. Microbiol. Biotechnol. 2019, 103, 5843–5850. [Google Scholar] [CrossRef] [PubMed]
  25. Kim, H.; Kim, J.K.; Kim, J.Y.; Jang, S.E.; Han, M.J.; Kim, D.H. Lactobacillus plantarum LC27 and Bifidobacterium longum LC67 simultaneously alleviate high-fat diet-induced colitis, endotoxemia, liver steatosis, and obesity in mice. Nutr. Res. 2019, 67, 78–89. [Google Scholar] [CrossRef]
  26. Kim, J.D.; Kang, S.J.; Lee, M.K.; Park, S.E.; Rhee, E.J.; Park, C.Y.; Lee, W.Y. C-Peptide-Based Index Is more Related to Incident Type 2 Diabetes in Non-Diabetic Subjects than Insulin-Based Index. Endocrinol. Metab. 2016, 31, 320–327. [Google Scholar] [CrossRef] [Green Version]
  27. Shin, K.-A. Triglyceride and Glucose (TyG) Index is a Clinical Surrogate Marker for the Diagnosis of Metabolic Syndrome. Biomed. Sci. Lett. 2017, 23, 348–354. [Google Scholar] [CrossRef] [Green Version]
  28. Hildebrand, F.; Tadeo, R.; Voigt, A.Y.; Bork, P.; Raes, J. LotuS: An efficient and user-friendly OTU processing pipeline. Microbiome 2014, 2, 30. [Google Scholar] [CrossRef] [Green Version]
  29. Chong, J.; Liu, P.; Zhou, G.; Xia, J. Using MicrobiomeAnalyst for comprehensive statistical, functional, and meta-analysis of microbiome data. Nat. Protoc. 2020, 15, 799–821. [Google Scholar] [CrossRef]
  30. Caër, C.; Rouault, C.; Le Roy, T.; Poitou, C.; Aron-Wisnewsky, J.; Torcivia, A.; André, S. Immune cell-derived cytokines contribute to obesity-related inflammation, fibrogenesis and metabolic deregulation in human adipose tissue. Sci. Rep. 2017, 7, 3000. [Google Scholar] [CrossRef]
  31. Nagy, Z.S.; Czimmerer, Z.; Szanto, A.; Nagy, L. Pro-inflammatory cytokines negatively regulate PPARγ mediated gene expression in both human and murine macrophages via multiple mechanisms. Immunobiology 2013, 218, 1336–1344. [Google Scholar] [CrossRef] [PubMed]
  32. Bouter, K.E.; van Raalte, D.H.; Groen, A.K.; Nieuwdorp, M. Role of the Gut Microbiome in the Pathogenesis of Obesity and Obesity-Related Metabolic Dysfunction. Gastroenterology 2017, 152, 1671–1678. [Google Scholar] [CrossRef] [PubMed]
  33. Daniel, H.; Gholami, A.M.; Berry, D.; Desmarchelier, C.; Hahne, H.; Loh, G.; Clavel, T. High-fat diet alters gut microbiota physiology in mice. ISME J. 2014, 8, 295–308. [Google Scholar] [CrossRef]
  34. Wang, Y.; Yao, W.; Li, B.; Qian, S.; Wei, B.; Gong, S.; Wei, M. Nuciferine modulates the gut microbiota and prevents obesity in high-fat diet-fed rats. Exp. Mol. Med. 2020, 52, 1959–1975. [Google Scholar] [CrossRef]
  35. Song, Y.; Shen, H.; Liu, T.; Pan, B.; De Alwis, S.; Zhang, W.; Zhang, T. Effects of three different mannans on obesity and gut microbiota in high-fat diet-fed C57BL/6J mice. Food Funct. 2021, 12, 4606–4620. [Google Scholar] [CrossRef] [PubMed]
  36. Liu, Z.; Wang, N.; Ma, Y.; Wen, D. Hydroxytyrosol improves obesity and insulin resistance by modulating gut microbiota in high-fat diet-induced obese mice. Front. Microbiol. 2019, 10, 390. [Google Scholar] [CrossRef] [PubMed] [Green Version]
  37. Martinez-Medina, M.; Denizot, J.; Dreux, N.; Robin, F.; Billard, E.; Bonnet, R.; Barnich, N. Western diet induces dysbiosis with increased E coli in CEABAC10 mice, alters host barrier function favouring AIEC colonisation. Gut 2014, 63, 116–124. [Google Scholar] [CrossRef]
  38. Meijnikman, A.S.; Aydin, O.; Prodan, A.; Tremaroli, V.; Herrema, H.; Levin, E.; Nieuwdorp, M. Distinct differences in gut microbial composition and functional potential from lean to morbidly obese subjects. J. Intern. Med. 2020, 288, 699–710. [Google Scholar] [CrossRef]
  39. De Oca alejandra, P.Z.M.T.S.; PelliTero, S.; PUig-DoMingo, M. Obesity and GLP-1. Minerva Endocrinol. 2021, 46, 168–176. [Google Scholar] [CrossRef]
  40. Pathak, P.; Xie, C.; Nichols, R.G.; Ferrell, J.M.; Boehme, S.; Krausz, K.W.; Chiang, J.Y. Intestine farnesoid X receptor agonist and the gut microbiota activate G-protein bile acid receptor-1 signaling to improve metabolism. Hepatology 2018, 68, 1574–1588. [Google Scholar] [CrossRef]
  41. Kim, C.C.; Healey, G.R.; Kelly, W.J.; Patchett, M.L.; Jordens, Z.; Tannock, G.W.; Rosendale, D.I. Genomic insights from Monoglobus pectinilyticus: A pectin-degrading specialist bacterium in the human colon. ISME J. 2019, 13, 1437–1456. [Google Scholar] [CrossRef] [PubMed]
  42. Sbierski-Kind, J.; Grenkowitz, S.; Schlickeiser, S.; Sandforth, A.; Friedrich, M.; Kunkel, D.; von Schwartzenberg, R.J. Effects of caloric restriction on the gut microbiome are linked with immune senescence. Microbiome 2022, 10, 57. [Google Scholar] [CrossRef] [PubMed]
  43. Ahn, H.Y.; Kim, M.; Ahn, Y.T.; Sim, J.H.; Choi, I.D.; Lee, S.H.; Lee, J.H. The triglyceride-lowering effect of supplementation with dual probiotic strains, Lactobacillus curvatus HY7601 and Lactobacillus plantarum KY1032: Reduction of fasting plasma lysophosphatidylcholines in nondiabetic and hypertriglyceridemic subjects. Nutr. Metab. Cardiovasc. Dis. 2015, 25, 724–733. [Google Scholar] [CrossRef]
  44. Choi, I.D.; Kim, S.H.; Jeong, J.W.; Lee, D.E.; Huh, C.S.; Hong, S.S.; Ahn, Y.T. Triglyceride-Lowering Effects of Two Probiotics, Lactobacillus plantarum KY1032 and Lactobacillus curvatus HY7601, in a Rat Model of High-Fat Diet-Induced Hypertriglyceridemia. J. Microbiol. Biotechnol. 2016, 26, 483–487. [Google Scholar] [CrossRef] [PubMed]
  45. Alisi, A.; Carpido, G.; Oliveria Felipe, L.; Panera, N.; Valerio, N.; Gaudio, E. The role of tissue macrophage-mediated inflammation on NAFLD pathogenesis and its clinical implications. Mediat. Inflamm. 2017, 2017, 8162421. [Google Scholar] [CrossRef] [PubMed] [Green Version]
  46. Kim, W.; Lee, E.J.; Bae, I.H.; Myoung, K.; Kim, S.T.; Park, P.J.; Cho, E.G. Lactobacillus plantarum-derived extracellular vesicles induce anti-inflammatory M2 macrophage polarization in vitro. J. Extracell. Vesicles 2020, 9, 1793514. [Google Scholar] [CrossRef]
  47. Jang, S.E.; Han, M.J.; Kim, S.Y.; Kim, D.H. Lactobacillus plantarum CLP-0611 ameliorates colitis in mice by polarizing M1 to M2-like macrophages. Int. Immunopharmacol. 2014, 21, 186–192. [Google Scholar] [CrossRef]
Figure 1. Body weight, weight gain, and serum lipid profile in HFHF mice. (a) Changes of body weight during the animal experimental study. (b) Differences of body weight gain between groups. (c) Levels of total cholesterol, HDL, triglycerides (TG), and non-esterified fatty acids (NEFA). Data are expressed as mean ± SEM. * p  <  0.05, ** p  <  0.01, *** p  <  0.001 vs. ND group: # p  <  0.05, ## p  <  0.01 vs. HFHF diet.
Nutrients 14 05212 g001
Figure 2. The effect of L.p DSM20174 supplementation on glucose homeostasis and TYG index. (a) Fasting blood glucose measured at several time points during the experimental procedure. (b) Serum c-peptide and HOMA-IR index. (c) Blood glucose levels in response to glucose tolerance test (GTT). Effect on area under de curve (AUC). (d) Triglyceride glucose (TYG) index. Data are expressed as mean ± SEM. * p < 0.05, *** p < 0.001 vs. ND; # p < 0.05, ## p < 0.01, ### p < 0.001 vs. HFHF.
Nutrients 14 05212 g002
Figure 3. L.p DSM20174 supplementation reduced white adipose tissue inflammation in HFHF-fed mice. (a) Images of haematoxylin and eosin (H&E)-stained sections of white adipose tissue (WAT). Arrowheads indicate crown-like structures (CLS). Representative immunostaining for CD-68. (b) Mean adipocyte area. (c) CD-68 positive area (%). (d) Relative gene expression of the Pan, M1, and M2 macrophage markers; Th1 and Th2 cytokines; and adipogenic genes. All genes were normalised to expression of RPLPO. Blue arrows indicate decreased M1 macrophage marker expression, whereas red arrows show increased M2 macrophage marker expression. Data are expressed as mean ± SEM. * p < 0.05, ** p < 0.01, *** p < 0.001 vs. ND; # p < 0.05 vs. HFHF.
Nutrients 14 05212 g003
Figure 4. Effect of L.p DSM20174 on liver lipid content and inflammation. (a) Images of haematoxylin and eosin (H&E)-stained sections of liver. Black arrowheads indicate lobular inflammation. Representative immunostaining for F4/80. Red arrowheads indicate hepatic crown-like structures (h-CLS). (b) Percentage of hepatic steatosis. The number of inflammatory foci per cm2. The number of hCLS F4/80 positive cells per cm2. (c) Fold changes in expression of genes related to adipogenic, lipogenic, fatty acid β-oxidation functions, and liver inflammation. All genes were normalised to expression of RPLPO. (d) Hierarchical heatmap clustering of lipid metabolism and inflammatory gene expression in liver mice. Red and green shading represent higher and lower relative expression levels, respectively. Data are expressed as mean ± SEM. * p < 0.05, ** p < 0.01, *** p < 0.001 vs. ND; # p < 0.05, ## p < 0.01 vs. HFHF.
Nutrients 14 05212 g004
Figure 5. L.p DSM20174 modified the diversity of gut microbiota. (a) Alpha diversity, measured by observed genera (A) and species (B) in faecal samples of ND, HFHF, and HFHF + L.p mice. Mean values and interquartile ranges are indicated in the plots. (b) Beta-diversity (mean of different genera within mice). * Significant difference between HFHF and HFHF + L.p (p < 0.05). Red boxes and circles represent the ND group, green boxes and circles represent the HFHF group, and blue boxes and circles represent the HFHF + L.p group (n = 6 mice per each group).
Nutrients 14 05212 g005
Figure 6. L.p DSM20174 supplementation altered the composition of gut microbiota in HFHF-fed mice. The relative abundance at (a) family, (b) genus, and (c) species levels in the faecal samples from the three groups. Mean values and interquartile ranges are indicated in the plots. ** p < 0.01, *** p < 0.001. Red boxes represent the ND group, green boxes represent the HFHF group, and blue boxes represent the HFHF + L.p group.
Nutrients 14 05212 g006
Figure 7. Correlation of gut microbiota changes with underlying factors related to NAFLD: (a) metabolic risk factors related to NAFLD; (b) inflammatory genes related to NAFLD; “a” in adipose tissue: “l” in liver. Spearman correlation coefficients (Rho) and the corresponding p-values were calculated on the basis of comparisons of the relative abundance from species, genera, and families, as well as the underlying factors related to NAFLD. The green colour indicates a positive correlation coefficient, and the red colour represents a negative coefficient (* FDR p < 0.05).
Nutrients 14 05212 g007
Table 1. Primer sequences for qPCR.
GeneForward Primer 5′-3′Reverse Primer 5′-3′Product Size (bp)Annealing Temp (°)
RPLPOAACATCTCCCCCTTCTCCTTGAAGGCCTTGACCTTTTCAG27062
PPARGGCTGTTATGGGTGAAACTCTGGAATAATAAGGTGGAGATGCAGG35660
CD36CACAGCTGCCTTCTGAAATGTGTGGTTTCTACGTGGCCCGGTTCTAATTC17160
PPARαACTGGTAGTCTGCAAAACCAAAAGAGCCCCATCTGTCCTCTC15360
SREBPCACTTCATCAAGGCAGACTCCGGTAGCGCTTCTCAATGGC28460
FASAGCCATGGAGGAGGTGGTGATGTGTGCCTGCTTGGGGTGGAC22360
IL1BTCGCTCAGGGTCACAAGAAACATCAGAGGCAAGGAGGAAAAC7360
IL6ACAAGTCGGAGGCTTAATTACACATTTGCCATTGCACAACTCTTTTC7260
CPT1TCTAGGCAATGCCGTTCACGAGCACATGGGCACCATAC9960
F4/80CCTGGACGAATCCTGTGAAGGGTGGGACCACAGAGAGTTG6460
CD68GTGTCTGATCTTGCTAGGACCTGTGCTTTCTGTGGCTGTAG11860
TLR4GCCTTTCAGGGAATTAAGCTCCAGATCAACCGATGGACGTGTAA11560
MCP1TGATCCCAATGAGTAGGCTGGAGATGTCTGGACCCATTCCTTCTTG13262
CD44CTGGATCAGGCATTGATGATGGCCATCCTGGTGGTTGTCTG15760
CD11cGATGGCTCGGGTAGCATCAGTGAGGACCTTGGTGGCATCT29560
RETNLACTGGGATGACTGCTACTGGGCAGTGGTCCAGTCAACGAGTA10860
CHI3L3CCAGCAGAAGCTCTCCAGAAGTCAGCTGGTAGGAAGATCCCA16160
IL4ACGAAGAACACCACAGAGTGATGTGGACTTGGACTC19560
IL5TGTTGACAAGCAATGAGACGATGAAATAGCATTTCCACAGTACCCCCA13660
Publisher’s Note: MDPI stays neutral with regard to jurisdictional claims in published maps and institutional affiliations.

