
The Diagnostic and Prognostic Value of the Triglyceride-Glucose Index in Metabolic Dysfunction-Associated Fatty Liver Disease (MAFLD): A Systematic Review and Meta-Analysis


Abstract
1. Introduction
2. Materials and Methods
2.1. Sources and Methods of Data Retrieval
2.2. Inclusion Criteria and Exclusion Criteria
2.3. Data Extraction
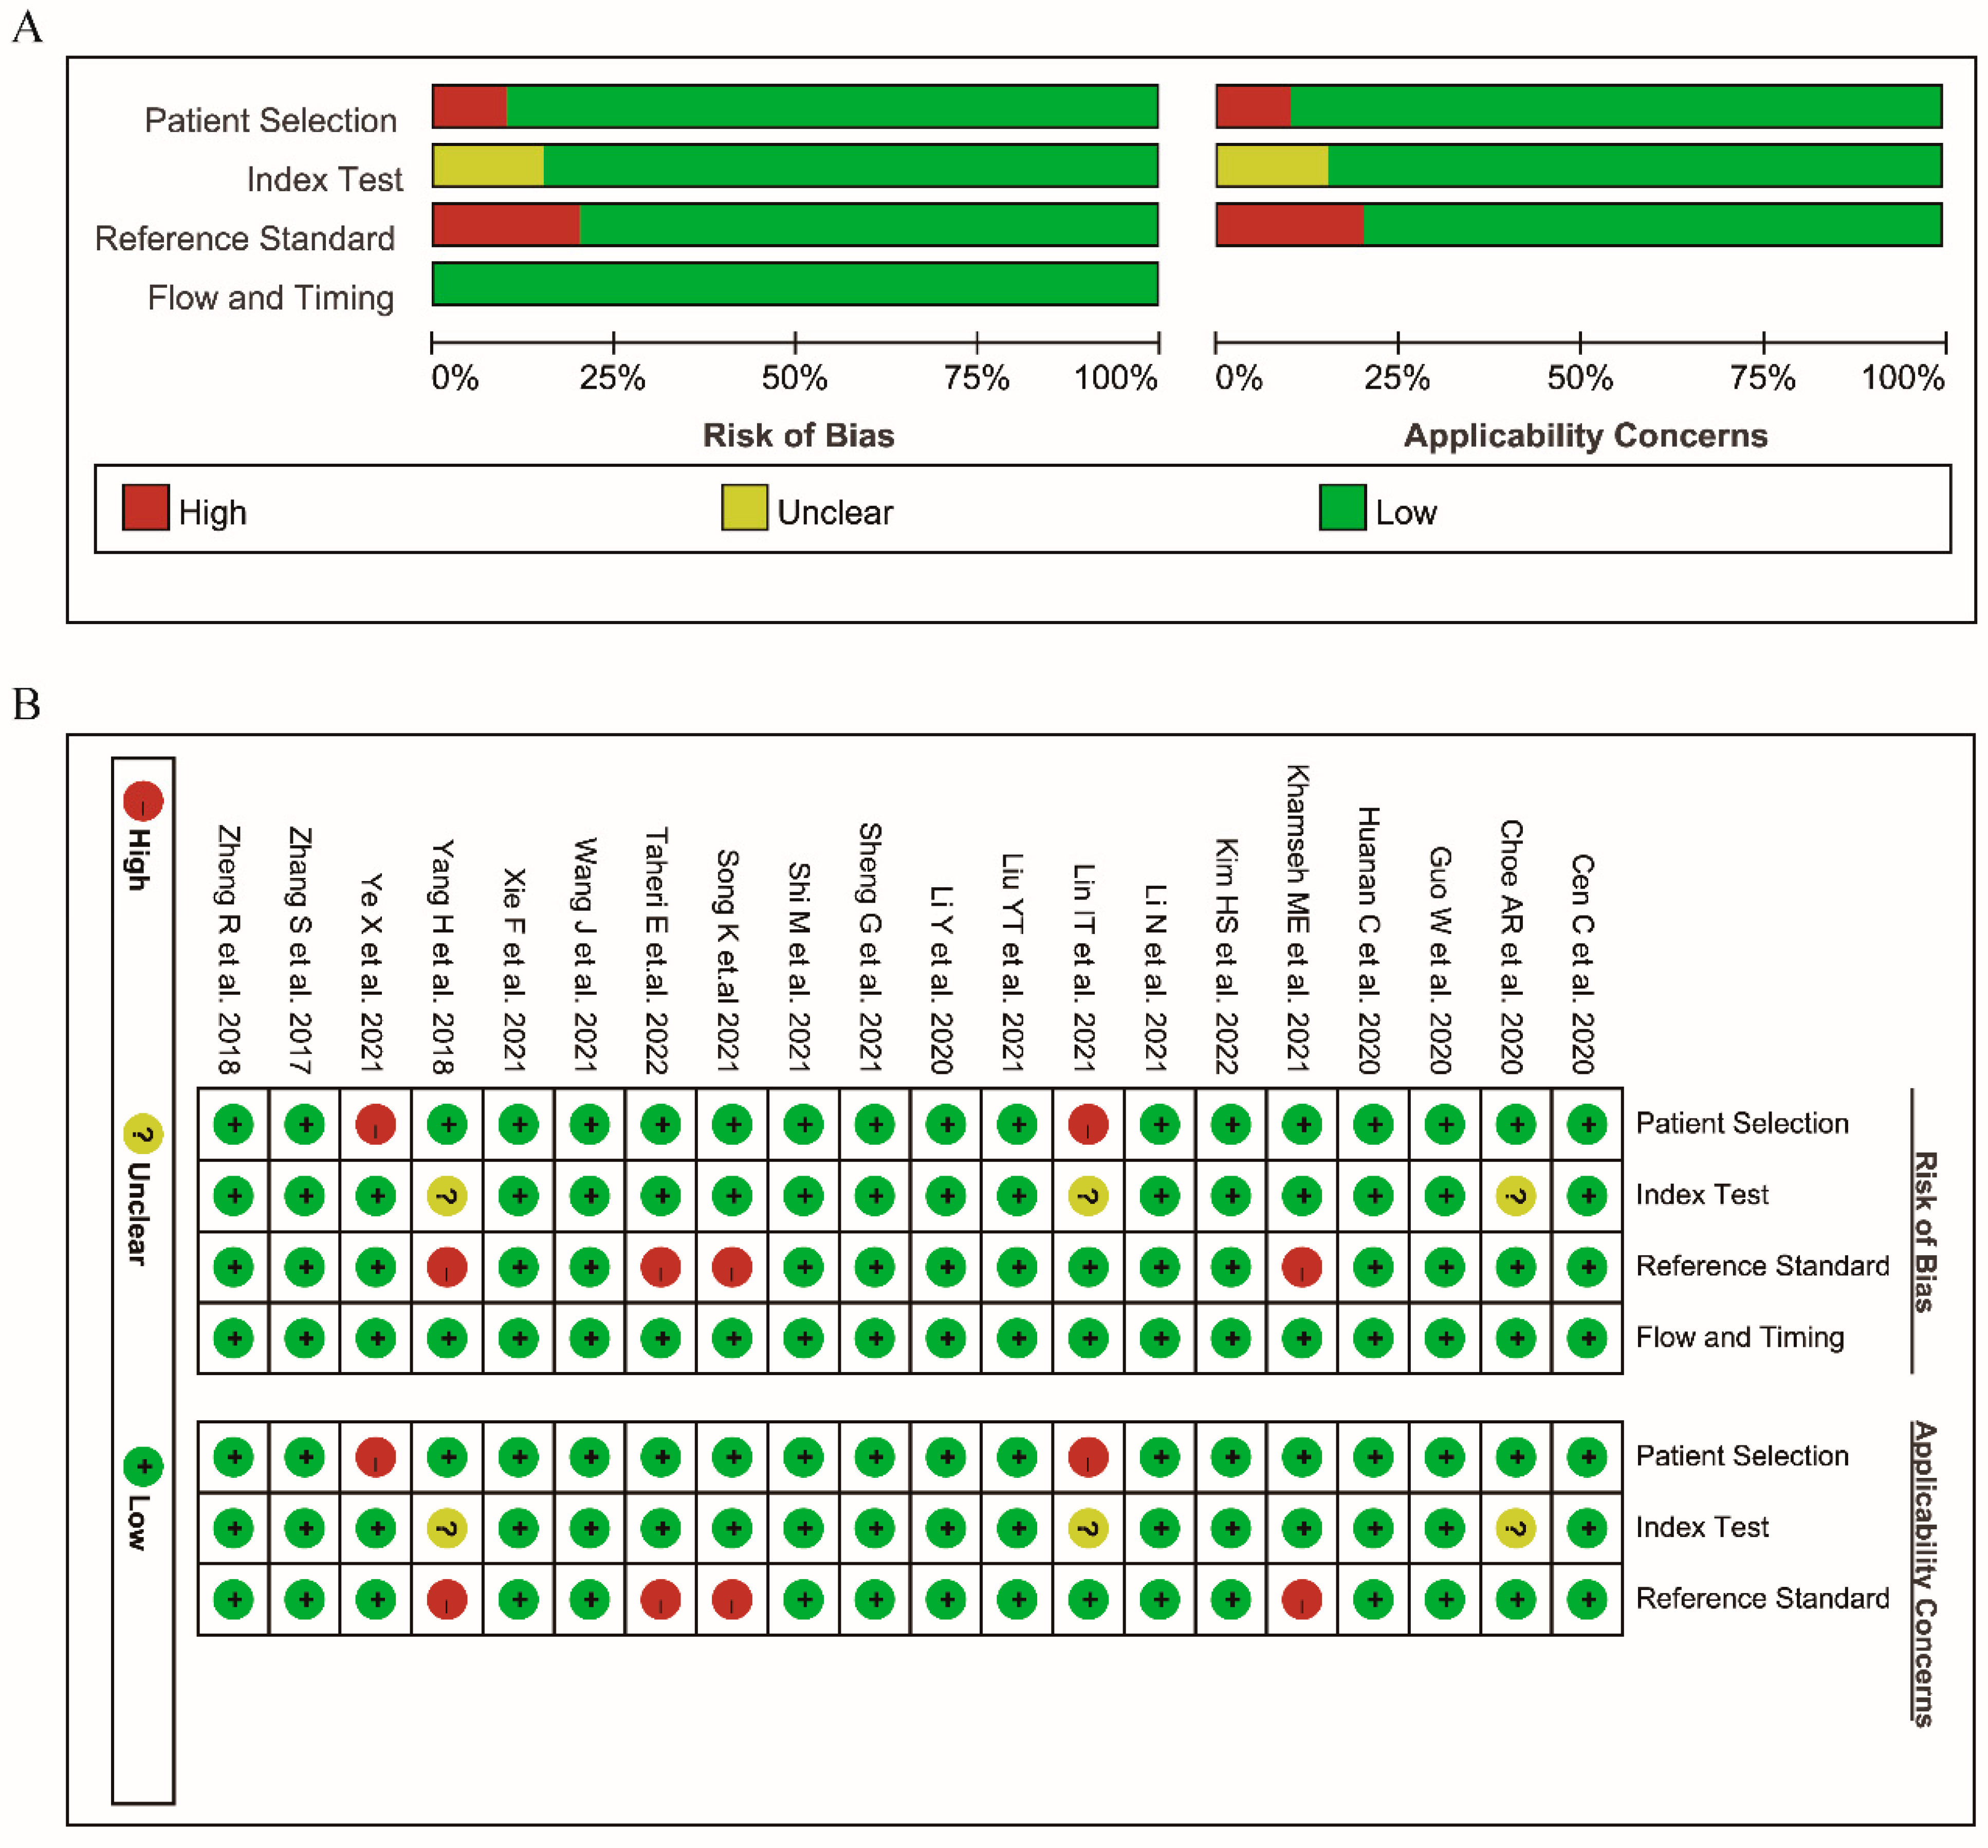
2.4. Quality Assessment
2.5. Statistical Analysis
3. Results
3.1. Literature Search
3.2. Characteristics of the Included Studies
3.3. Diagnostic Efficiency (Threshold Effect)
3.4. Different Cut-Off Values of the TyG Index
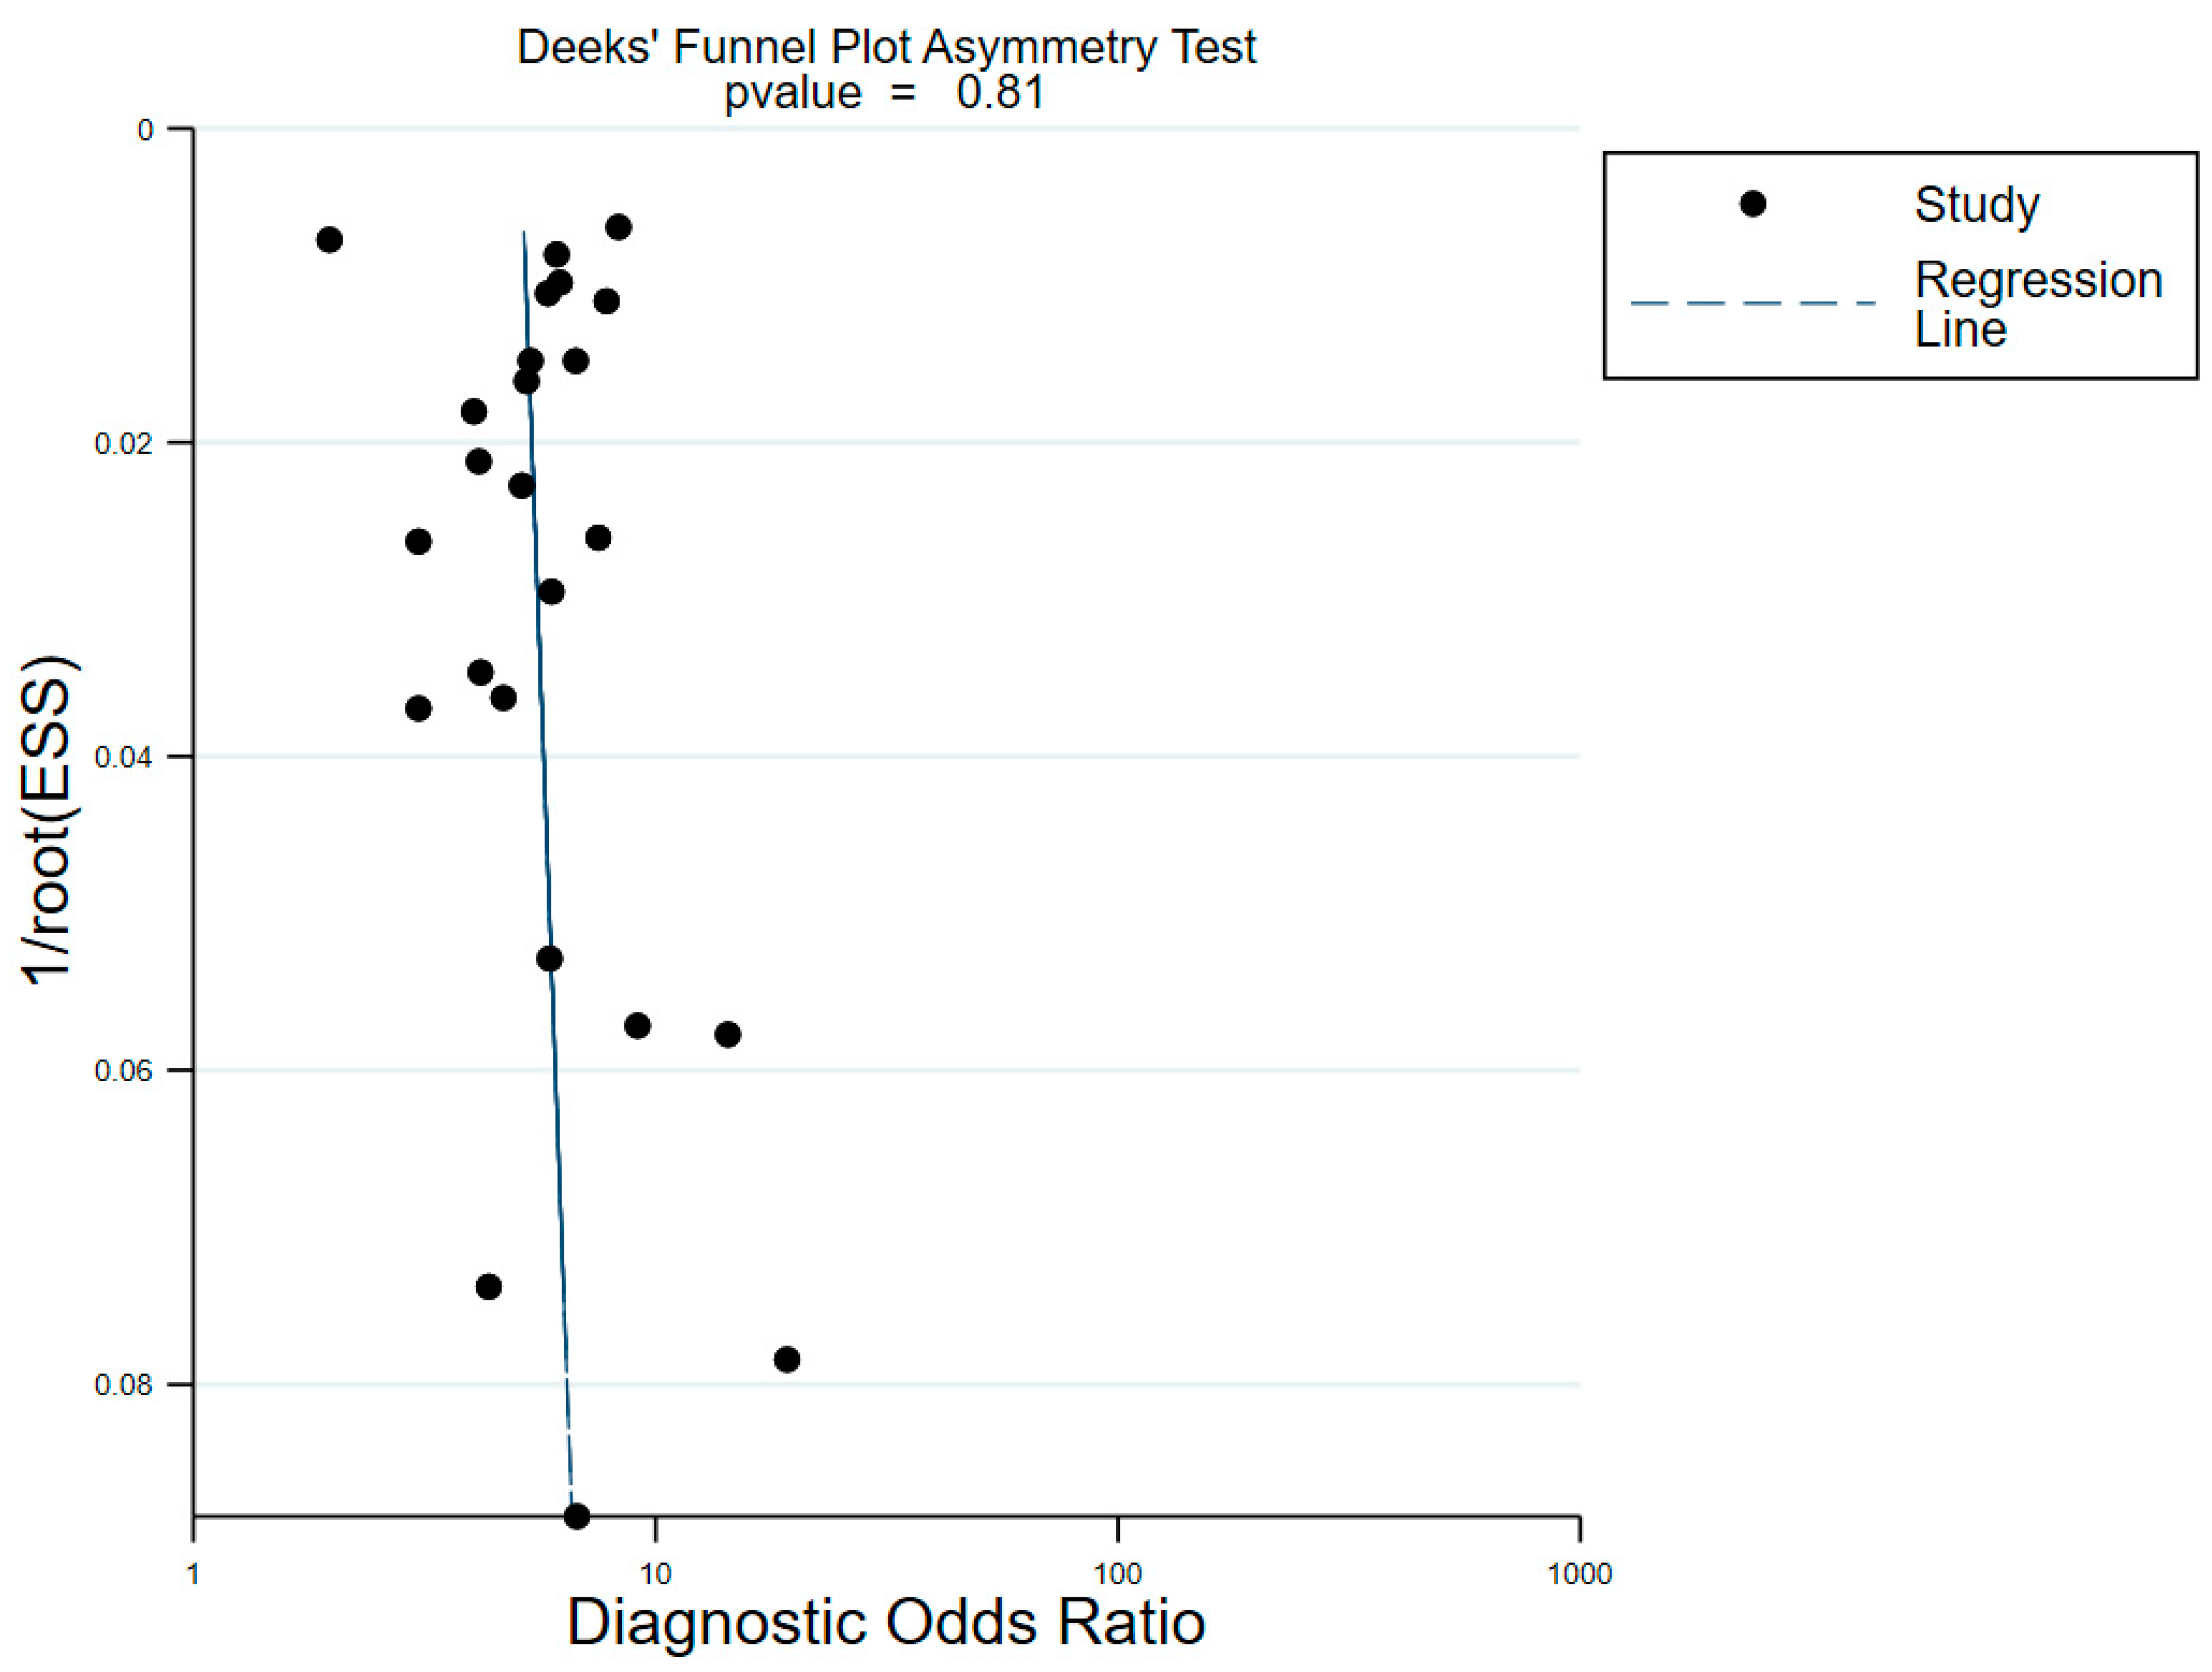
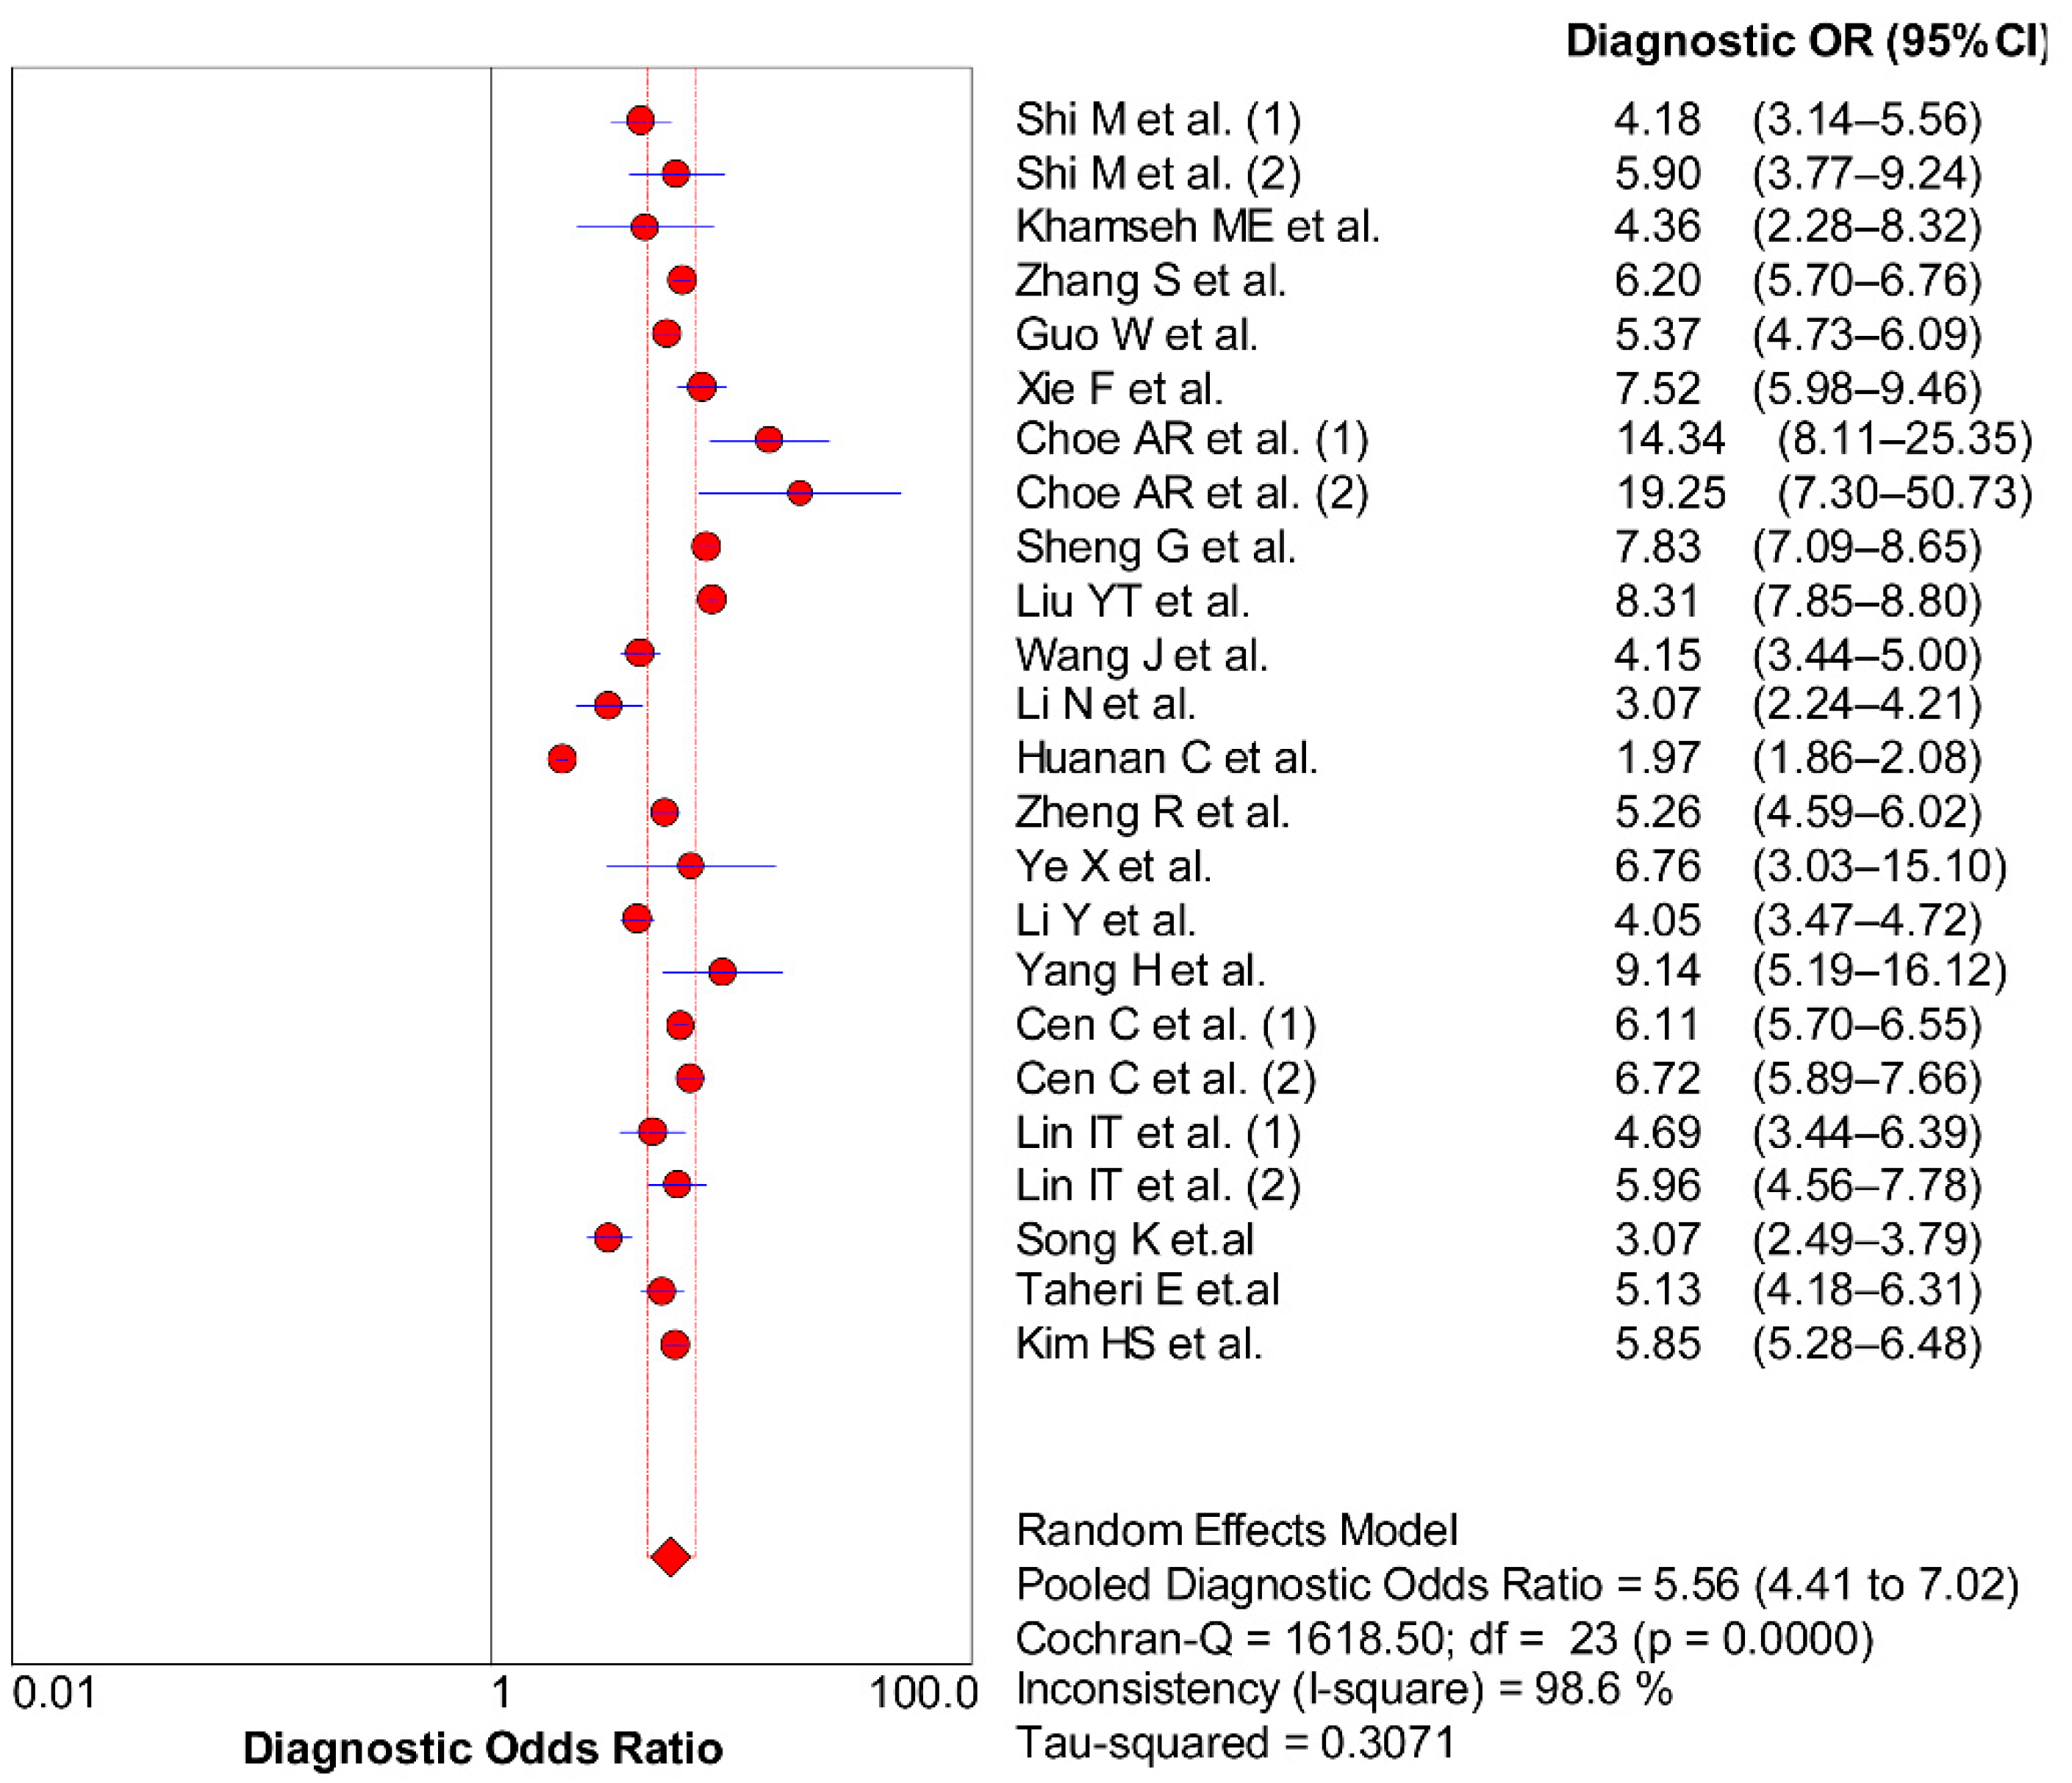
3.5. Non-Threshold Effect
4. Discussion
5. Conclusions
Author Contributions
Funding
Institutional Review Board Statement
Informed Consent Statement
Data Availability Statement
Conflicts of Interest
References
- Chalasani, N.; Younossi, Z.; Lavine, J.E.; Diehl, A.M.; Brunt, E.M.; Cusi, K.; Charlton, M.; Sanyal, A.J. The diagnosis and management of non-alcoholic fatty liver disease: Practice Guideline by the American Association for the Study of Liver Diseases, American College of Gastroenterology, and the American Gastroenterological Association. Hepatology 2012, 55, 2005–2023. [Google Scholar] [CrossRef] [PubMed]
- Younossi, Z.M.; Koenig, A.B.; Abdelatif, D.; Fazel, Y.; Henry, L.; Wymer, M. Global epidemiology of nonalcoholic fatty liver disease-Meta-analytic assessment of prevalence, incidence, and outcomes. Hepatology 2016, 64, 73–84. [Google Scholar] [CrossRef] [PubMed]
- Younossi, Z.M.; Blissett, D.; Blissett, R.; Henry, L.; Stepanova, M.; Younossi, Y.; Racila, A.; Hunt, S.; Beckerman, R. The economic and clinical burden of nonalcoholic fatty liver disease in the United States and Europe. Hepatology 2016, 64, 1577–1586. [Google Scholar] [CrossRef] [PubMed]
- Li, L.; Liu, D.W.; Yan, H.Y.; Wang, Z.Y.; Zhao, S.H.; Wang, B. Obesity is an independent risk factor for non-alcoholic fatty liver disease: Evidence from a meta-analysis of 21 cohort studies. Obes. Rev. 2016, 17, 510–519. [Google Scholar] [CrossRef] [PubMed]
- Barchetta, I.; Cimini, F.A.; Cavallo, M.G. Vitamin D and Metabolic Dysfunction-Associated Fatty Liver Disease (MAFLD): An Update. Nutrients 2020, 12, 3302. [Google Scholar] [CrossRef]
- Wang, X.J.; Malhi, H. Nonalcoholic Fatty Liver Disease. Ann. Intern. Med. 2018, 169, Itc65–itc80. [Google Scholar] [CrossRef]
- Khan, R.S.; Bril, F.; Cusi, K.; Newsome, P.N. Modulation of Insulin Resistance in Nonalcoholic Fatty Liver Disease. Hepatology 2019, 70, 711–724. [Google Scholar] [CrossRef]
- Zhang, Z.; Wang, J.; Wang, H. Correlation of blood glucose, serum chemerin and insulin resistance with NAFLD in patients with type 2 diabetes mellitus. Exp. Ther. Med. 2018, 15, 2936–2940. [Google Scholar] [CrossRef]
- Tomizawa, M.; Kawanabe, Y.; Shinozaki, F.; Sato, S.; Motoyoshi, Y.; Sugiyama, T.; Yamamoto, S.; Sueishi, M. Triglyceride is strongly associated with nonalcoholic fatty liver disease among markers of hyperlipidemia and diabetes. Biomed. Rep. 2014, 2, 633–636. [Google Scholar] [CrossRef]
- Zhang, S.; Du, T.; Zhang, J.; Lu, H.; Lin, X.; Xie, J.; Yang, Y.; Yu, X. The triglyceride and glucose index (TyG) is an effective biomarker to identify nonalcoholic fatty liver disease. Lipids Health Dis. 2017, 16, 15. [Google Scholar] [CrossRef]
- Zhang, S.; Du, T.; Li, M.; Jia, J.; Lu, H.; Lin, X.; Yu, X. Triglyceride glucose-body mass index is effective in identifying nonalcoholic fatty liver disease in nonobese subjects. Medicine 2017, 96, e7041. [Google Scholar] [CrossRef] [PubMed]
- Whiting, P.F.; Rutjes, A.W.; Westwood, M.E.; Mallett, S.; Deeks, J.J.; Reitsma, J.B.; Leeflang, M.M.; Sterne, J.A.; Bossuyt, P.M. QUADAS-2: A revised tool for the quality assessment of diagnostic accuracy studies. Ann. Intern. Med. 2011, 155, 529–536. [Google Scholar] [CrossRef] [PubMed]
- Leeflang, M.M.; Deeks, J.J.; Gatsonis, C.; Bossuyt, P.M. Systematic reviews of diagnostic test accuracy. Ann. Intern. Med. 2008, 149, 889–897. [Google Scholar] [CrossRef] [PubMed]
- Zamora, J.; Abraira, V.; Muriel, A.; Khan, K.; Coomarasamy, A. Meta-DiSc: A software for meta-analysis of test accuracy data. BMC Med. Res. Methodol. 2006, 6, 31. [Google Scholar] [CrossRef] [PubMed]
- Higgins, J.P.; Thompson, S.G.; Deeks, J.J.; Altman, D.G. Measuring inconsistency in meta-analyses. BMJ 2003, 327, 557–560. [Google Scholar] [CrossRef]
- Deeks, J.J.; Macaskill, P.; Irwig, L. The performance of tests of publication bias and other sample size effects in systematic reviews of diagnostic test accuracy was assessed. J. Clin. Epidemiol. 2005, 58, 882–893. [Google Scholar] [CrossRef]
- Moses, L.E.; Shapiro, D.; Littenberg, B. Combining independent studies of a diagnostic test into a summary ROC curve: Data-analytic approaches and some additional considerations. Stat. Med. 1993, 12, 1293–1316. [Google Scholar] [CrossRef]
- Reitsma, J.B.; Glas, A.S.; Rutjes, A.W.; Scholten, R.J.; Bossuyt, P.M.; Zwinderman, A.H. Bivariate analysis of sensitivity and specificity produces informative summary measures in diagnostic reviews. J. Clin. Epidemiol. 2005, 58, 982–990. [Google Scholar] [CrossRef]
- Jones, C.M.; Athanasiou, T. Summary receiver operating characteristic curve analysis techniques in the evaluation of diagnostic tests. Ann. Thorac. Surg. 2005, 79, 16–20. [Google Scholar] [CrossRef]
- Glas, A.S.; Lijmer, J.G.; Prins, M.H.; Bonsel, G.J.; Bossuyt, P.M. The diagnostic odds ratio: A single indicator of test performance. J. Clin. Epidemiol. 2003, 56, 1129–1135. [Google Scholar] [CrossRef]
- Shi, M.; Liu, P.; Li, J.; Su, Y.; Zhou, X.; Wu, C.; Chen, X.; Zheng, C. The performance of noninvasive indexes of adults in identification of nonalcoholic fatty liver disease in children. J. Diabetes 2021, 13, 744–753. [Google Scholar] [CrossRef] [PubMed]
- Guo, W.; Lu, J.; Qin, P.; Li, X.; Zhu, W.; Wu, J.; Xu, N.; Zhang, Q. The triglyceride-glucose index is associated with the severity of hepatic steatosis and the presence of liver fibrosis in non-alcoholic fatty liver disease: A cross-sectional study in Chinese adults. Lipids Health Dis. 2020, 19, 218. [Google Scholar] [CrossRef] [PubMed]
- Xie, F.; Pei, Y.; Zhou, Q.; Cao, D.; Wang, Y. Comparison of obesity-related indices for identifying nonalcoholic fatty liver disease: A population-based cross-sectional study in China. Lipids Health Dis. 2021, 20, 132. [Google Scholar] [CrossRef] [PubMed]
- Sheng, G.; Lu, S.; Xie, Q.; Peng, N.; Kuang, M.; Zou, Y. The usefulness of obesity and lipid-related indices to predict the presence of Non-alcoholic fatty liver disease. Lipids Health Dis. 2021, 20, 134. [Google Scholar] [CrossRef]
- Liu, Y.T.; Wang, W.; Tong, J.; Wang, B.Y. Relationship between triglyceride-glucose index and non-alcoholic fatty liver disease. Zhonghua Gan Zang Bing Za Zhi = Zhonghua Ganzangbing Zazhi = Chin. J. Hepatol. 2021, 29, 451–455. [Google Scholar] [CrossRef]
- Wang, J.; Su, Z.; Feng, Y.; Xi, R.; Liu, J.; Wang, P. Comparison of several blood lipid-related indexes in the screening of non-alcoholic fatty liver disease in women: A cross-sectional study in the Pearl River Delta region of southern China. BMC Gastroenterol. 2021, 21, 482. [Google Scholar] [CrossRef]
- Li, N.; Tan, H.; Xie, A.; Li, C.; Fu, X.; Xang, W.; Kirim, A.; Huang, X. Value of the triglyceride glucose index combined with body mass index in identifying non-alcoholic fatty liver disease in patients with type 2 diabetes. BMC Endocr. Disord. 2022, 22, 101. [Google Scholar] [CrossRef]
- Huanan, C.; Sangsang, L.; Amoah, A.N.; Yacong, B.; Xuejiao, C.; Zhan, S.; Guodong, W.; Jian, H.; Songhe, S.; Quanjun, L. Relationship between triglyceride glucose index and the incidence of non-alcoholic fatty liver disease in the elderly: A retrospective cohort study in China. BMJ Open 2020, 10, e039804. [Google Scholar] [CrossRef] [PubMed]
- Zheng, R.; Du, Z.; Wang, M.; Mao, Y.; Mao, W. A longitudinal epidemiological study on the triglyceride and glucose index and the incident nonalcoholic fatty liver disease. Lipids Health Dis. 2018, 17, 262. [Google Scholar] [CrossRef]
- Ye, X.; Li, J.; Wang, H.; Wu, J. Pentraxin 3 and the TyG Index as Two Novel Markers to Diagnose NAFLD in Children. Dis. Markers 2021, 2021, 8833287. [Google Scholar] [CrossRef]
- Li, Y.; Zheng, R.; Li, J.; Feng, S.; Wang, L.; Huang, Z. Association between triglyceride glucose-body mass index and non-alcoholic fatty liver disease in the non-obese Chinese population with normal blood lipid levels: A secondary analysis based on a prospective cohort study. Lipids Health Dis. 2020, 19, 229. [Google Scholar] [CrossRef]
- Yang, H.; Chen, G.; Song, C.; Li, D.; Ma, Q.; Chen, G.; Li, X. A novel index including SNPs for the screening of nonalcoholic fatty liver disease among elder Chinese: A population-based study. Medicine 2018, 97, e0272. [Google Scholar] [CrossRef]
- Cen, C.; Wang, W.; Yu, S.; Tang, X.; Liu, J.; Liu, Y.; Zhou, L.; Yu, J.; Zheng, S. Development and validation of a clinical and laboratory-based nomogram to predict nonalcoholic fatty liver disease. Hepatol. Int. 2020, 14, 808–816. [Google Scholar] [CrossRef] [PubMed]
- Lin, I.T.; Lee, M.Y.; Wang, C.W.; Wu, D.W.; Chen, S.C. Gender Differences in the Relationships among Metabolic Syndrome and Various Obesity-Related Indices with Nonalcoholic Fatty Liver Disease in a Taiwanese Population. Int. J. Environ. Res. Public Health 2021, 18, 857. [Google Scholar] [CrossRef] [PubMed]
- Khamseh, M.E.; Malek, M.; Abbasi, R.; Taheri, H.; Lahouti, M.; Alaei-Shahmiri, F. Triglyceride Glucose Index and Related Parameters (Triglyceride Glucose-Body Mass Index and Triglyceride Glucose-Waist Circumference) Identify Nonalcoholic Fatty Liver and Liver Fibrosis in Individuals with Overweight/Obesity. Metab. Syndr. Relat. Disord. 2021, 19, 167–173. [Google Scholar] [CrossRef]
- Taheri, E.; Pourhoseingholi, M.A.; Moslem, A.; Hassani, A.H.; Mousavi Jarrahi, A.; Asadzadeh Aghdaei, H.; Zali, M.R.; Hatami, B. The triglyceride-glucose index as a clinical useful marker for metabolic associated fatty liver disease (MAFLD): A population-based study among Iranian adults. J. Diabetes Metab. Disord. 2022, 21, 97–107. [Google Scholar] [CrossRef] [PubMed]
- Choe, A.R.; Ryu, D.R.; Kim, H.Y.; Lee, H.A.; Lim, J.; Kim, J.S.; Lee, J.K.; Kim, T.H.; Yoo, K. Noninvasive indices for predicting nonalcoholic fatty liver disease in patients with chronic kidney disease. BMC Nephrol. 2020, 21, 50. [Google Scholar] [CrossRef] [PubMed]
- Song, K.; Park, G.; Lee, H.S.; Lee, M.; Lee, H.I.; Choi, H.S.; Suh, J.; Kwon, A.; Kim, H.S.; Chae, H.W. Comparison of the Triglyceride Glucose Index and Modified Triglyceride Glucose Indices to Predict Nonalcoholic Fatty Liver Disease in Youths. J. Pediatr. 2022, 242, 79–85.e71. [Google Scholar] [CrossRef] [PubMed]
- Kim, H.S.; Cho, Y.K.; Kim, E.H.; Lee, M.J.; Jung, C.H.; Park, J.Y.; Kim, H.K.; Lee, W.J. Triglyceride Glucose-Waist Circumference Is Superior to the Homeostasis Model Assessment of Insulin Resistance in Identifying Nonalcoholic Fatty Liver Disease in Healthy Subjects. J. Clin. Med. 2021, 11, 41. [Google Scholar] [CrossRef]
- Fazel, Y.; Koenig, A.B.; Sayiner, M.; Goodman, Z.D.; Younossi, Z.M. Epidemiology and natural history of non-alcoholic fatty liver disease. Metabolism 2016, 65, 1017–1025. [Google Scholar] [CrossRef]
- Younossi, Z.; Anstee, Q.M.; Marietti, M.; Hardy, T.; Henry, L.; Eslam, M.; George, J.; Bugianesi, E. Global burden of NAFLD and NASH: Trends, predictions, risk factors and prevention. Nat. Rev. Gastroenterol. Hepatol. 2018, 15, 11–20. [Google Scholar] [CrossRef] [PubMed]
- Younossi, Z.M.; Loomba, R.; Anstee, Q.M.; Rinella, M.E.; Bugianesi, E.; Marchesini, G.; Neuschwander-Tetri, B.A.; Serfaty, L.; Negro, F.; Caldwell, S.H.; et al. Diagnostic modalities for nonalcoholic fatty liver disease, nonalcoholic steatohepatitis, and associated fibrosis. Hepatology 2018, 68, 349–360. [Google Scholar] [CrossRef] [PubMed]
- Poynard, T.; Ratziu, V.; Charlotte, F.; Messous, D.; Munteanu, M.; Imbert-Bismut, F.; Massard, J.; Bonyhay, L.; Tahiri, M.; Thabut, D.; et al. Diagnostic value of biochemical markers (NashTest) for the prediction of non alcoholo steato hepatitis in patients with non-alcoholic fatty liver disease. BMC Gastroenterol. 2006, 6, 34. [Google Scholar] [CrossRef] [PubMed]
- Poynard, T.; Ratziu, V.; Naveau, S.; Thabut, D.; Charlotte, F.; Messous, D.; Capron, D.; Abella, A.; Massard, J.; Ngo, Y.; et al. The diagnostic value of biomarkers (SteatoTest) for the prediction of liver steatosis. Comp. Hepatol. 2005, 4, 10. [Google Scholar] [CrossRef]
- Bedogni, G.; Bellentani, S.; Miglioli, L.; Masutti, F.; Passalacqua, M.; Castiglione, A.; Tiribelli, C. The Fatty Liver Index: A simple and accurate predictor of hepatic steatosis in the general population. BMC Gastroenterol. 2006, 6, 33. [Google Scholar] [CrossRef]
- Morling, J.R.; Fallowfield, J.A.; Guha, I.N.; Nee, L.D.; Glancy, S.; Williamson, R.M.; Robertson, C.M.; Strachan, M.W.; Price, J.F. Using non-invasive biomarkers to identify hepatic fibrosis in people with type 2 diabetes mellitus: The Edinburgh type 2 diabetes study. J. Hepatol. 2014, 60, 384–391. [Google Scholar] [CrossRef]
- Simental-Mendía, L.E.; Simental-Mendía, E.; Rodríguez-Hernández, H.; Rodríguez-Morán, M.; Guerrero-Romero, F. The product of triglycerides and glucose as biomarker for screening simple steatosis and NASH in asymptomatic women. Ann. Hepatol. 2016, 15, 715–720. [Google Scholar] [CrossRef]
- Simental-Mendía, L.E.; Rodríguez-Morán, M.; Guerrero-Romero, F. The product of fasting glucose and triglycerides as surrogate for identifying insulin resistance in apparently healthy subjects. Metab. Syndr. Relat. Disord. 2008, 6, 299–304. [Google Scholar] [CrossRef]
- Jin, J.L.; Sun, D.; Cao, Y.X.; Guo, Y.L.; Wu, N.Q.; Zhu, C.G.; Gao, Y.; Dong, Q.T.; Zhang, H.W.; Liu, G.; et al. Triglyceride glucose and haemoglobin glycation index for predicting outcomes in diabetes patients with new-onset, stable coronary artery disease: A nested case-control study. Ann. Med. 2018, 50, 576–586. [Google Scholar] [CrossRef]
- Liu, X.Z.; Xu, X.; Zhu, J.Q.; Zhao, D.B. Association between three non-insulin-based indexes of insulin resistance and hyperuricemia. Clin. Rheumatol. 2019, 38, 3227–3233. [Google Scholar] [CrossRef]
- Subasi, C.F.; Aykut, U.E.; Yilmaz, Y. Comparison of noninvasive scores for the detection of advanced fibrosis in patients with nonalcoholic fatty liver disease. Eur. J. Gastroenterol. Hepatol. 2015, 27, 137–141. [Google Scholar] [CrossRef]
- Xiao, G.; Yang, J.; Yan, L. Comparison of diagnostic accuracy of aspartate aminotransferase to platelet ratio index and fibrosis-4 index for detecting liver fibrosis in adult patients with chronic hepatitis B virus infection: A systemic review and meta-analysis. Hepatology 2015, 61, 292–302. [Google Scholar] [CrossRef] [PubMed]
- Er, L.K.; Wu, S.; Chou, H.H.; Hsu, L.A.; Teng, M.S.; Sun, Y.C.; Ko, Y.L. Triglyceride Glucose-Body Mass Index Is a Simple and Clinically Useful Surrogate Marker for Insulin Resistance in Nondiabetic Individuals. PLoS ONE 2016, 11, e0149731. [Google Scholar] [CrossRef] [PubMed]
- Zeng, Z.Y.; Liu, S.X.; Xu, H.; Xu, X.; Liu, X.Z.; Zhao, X.X. Association of triglyceride glucose index and its combination of obesity indices with prehypertension in lean individuals: A cross-sectional study of Chinese adults. J. Clin. Hypertens. 2020, 22, 1025–1032. [Google Scholar] [CrossRef]
- Du, Z.; Xing, L.; Lin, M.; Sun, Y. Estimate of prevalent ischemic stroke from triglyceride glucose-body mass index in the general population. BMC Cardiovasc. Disord. 2020, 20, 483. [Google Scholar] [CrossRef] [PubMed]
- Xue, Y.; Xu, J.; Li, M.; Gao, Y. Potential screening indicators for early diagnosis of NAFLD/MAFLD and liver fibrosis: Triglyceride glucose index-related parameters. Front. Endocrinol. 2022, 13, 951689. [Google Scholar] [CrossRef]
- Wang, R.; Dai, L.; Zhong, Y.; Xie, G. Usefulness of the triglyceride glucose-body mass index in evaluating nonalcoholic fatty liver disease: Insights from a general population. Lipids Health Dis. 2021, 20, 77. [Google Scholar] [CrossRef] [PubMed]
- Simental-Mendía, L.E.; Ortega-Pacheco, C.J.; García-Guerrero, E.; Sicsik-Aragón, M.A.; Guerrero-Romero, F.; Martínez-Aguilar, G. The triglycerides and glucose index is strongly associated with hepatic steatosis in children with overweight or obesity. Eur. J. Pediatr. 2021, 180, 1755–1760. [Google Scholar] [CrossRef]
- Kitae, A.; Hashimoto, Y.; Hamaguchi, M.; Obora, A.; Kojima, T.; Fukui, M. The Triglyceride and Glucose Index Is a Predictor of Incident Nonalcoholic Fatty Liver Disease: A Population-Based Cohort Study. Can. J. Gastroenterol. Hepatol. 2019, 2019, 5121574. [Google Scholar] [CrossRef]
- Smiderle, C.; Coral, G.; Carli, L.; Mattos, A.; Mattos, A.; Tovo, C. Performace of Triglyceride-Glucose Index on Diagnosis and Staging of Nafld in Obese Patients. Arq. Gastroenterol. 2021, 58, 139–144. [Google Scholar] [CrossRef]


| Criteria | Descriptions and Search Terms Used for each Criteria |
|---|---|
| NAFLD/MAFLD | Non-alcoholic fatty liver OR Non alcoholic Fatty Liver Disease OR Nonalcoholic Fatty Livers OR NAFLD OR Nonalcoholic Fatty Liver Disease OR Nonalcoholic OR Nonalcoholic Steatohepatitis OR nonalcohol-related fatty liver disease OR non-alcohol-related fatty liver disease OR non-alcohol related fatty liver disease OR Nonalcoholic Steatohepatitides OR NASH OR nonalcoholic fatty liver disease OR Nonalcoholic Fatty Liver Disease OR Nonalcoholic Steatohepatitis OR non-alcoholic steatohepatitis OR fatty liver OR NASH/non-alcoholic steatohepatitis OR nonalcohol-related fatty liver disease OR non-alcohol related fatty liver disease OR Metabolic dysfunction-associated fatty liver disease OR MAFLD OR MAFLD-related cirrhosis OR metabolic associated fatty liver disease |
| TyG index | triglyceride-glucose index OR triglyceride glucose index OR TyG index OR triglyceride and glucose index OR triglyceride–glucose (T/Gly) index OR TyGs OR triglyceride glucose indices OR The triglyceride-glucose index OR Triglyceride/glucose index OR Triglycerides and glucose index OR triglycerides/glucose Index (TyG Index) |
| Author | Year | Country | Age | Disease | AUC (95% CI) | Design | Reference Standard | Samples | Cut-Off | tp | fp | fn | tn |
|---|---|---|---|---|---|---|---|---|---|---|---|---|---|
| Mengte Shi et al [21]. (1) | 2021 | China | ≤18 | no | 0.733 (0.698, 0.768) | RP | ultrasonography | 1291 | 8.42 | 165 | 300 | 96 | 730 |
| Mengte Shi et al [21]. (2) | 2021 | China | ≤18 | no | 0.769 (0.719, 0.818) | RP | ultrasonography | 554 | 8.42 | 75 | 113 | 37 | 329 |
| Mohammad E. Khamseh et al [35]. | 2021 | Iran | 30–65 | obesity | 0.676 (0.598, 0.754) | RP | Transient elastography | 184 | - | 76 | 41 | 20 | 47 |
| Shujun Zhang et al [10]. | 2017 | China | ≥20 | no | 0.782 (0.773, 0.790) | RP | ultrasonography | 10,761 | 8.5 | 3140 | 1892 | 1209 | 4520 |
| Wen Guo et al [22]. | 2020 | China | ≥18 | no | 0.761 (0.747, 0.774) | RP | ultrasonography | 4784 | 8.7 | 2049 | 582 | 853 | 1300 |
| Fangfei Xie et al [23]. | 2021 | China | ≥18 | no | 0.807 (0.785, 0.828) | RP | ultrasonography | 1748 | 4.75 | 379 | 312 | 147 | 910 |
| A Reum Choe et al [37]. (1) | 2020 | Korea | ≥18 | CKD | 0.85 (0.80, 0.90) | RP | ultrasonography | 567 | 0.146 | 72 | 109 | 17 | 369 |
| A Reum Choe et al [37]. (2) | 2020 | Korea | ≥18 | CKD | 0.84 (0.78, 0.90) | RP | ultrasonography | 252 | 0.146 | 46 | 65 | 5 | 136 |
| Guotai Sheng et al [24]. | 2021 | Japan | - | no | 0.8084 (0.7996, 0.8173) | RP | ultrasonography | 14,251 | 8.2059 | 1899 | 3348 | 608 | 8396 |
| Liu Yiting et al [25]. | 2021 | China | 18–80 | no | 0.816 (0.811, 0.820) | RP | ultrasonography | 25,535 | 6.9 | 9022 | 4104 | 2595 | 9814 |
| Jingrui Wang et al [26]. | 2021 | China | 19–93 | no | 0.725 (0.705, 0.746) | RP | ultrasonography | 3239 | 8.55 | 534 | 1061 | 178 | 1466 |
| Nong Li et al [27]. | 2021 | China | - | T2D | 0.651 (0.611, 0.691) | RP | ultrasonography | 826 | 6.5 | 291 | 73 | 261 | 201 |
| Chen Huanan et al [28]. | 2020 | China | >60 | no | 0.60 (0.58, 0.61) | RP | ultrasonography | 46,693 | 8.63 | 2851 | 13,951 | 2809 | 27,082 |
| Rongjiong Zheng et al [29]. | 2018 | China | ≥18 | no | 0.76 (0.74, 0.77) | P | ultrasonography | 4539 | 8.52 | 935 | 885 | 455 | 2264 |
| Xiaolin Ye et al [30]. | 2021 | China | 3–14 | no | 0.765 (0.682, 0.835) | RP | ultrasonography | 134 | 8.16 | 52 | 25 | 12 | 39 |
| Yaling Li et al [31]. | 2020 | China | 14–90 | no | 0.7264 (0.7096, 0.7433) | P | ultrasonography | 9767 | 8.3219 | 590 | 3280 | 251 | 5646 |
| Huanhuan Yang et al [32]. | 2018 | China | >60 | no | 0.793 | RP | ultrasonography | 918 | - | 80 | 123 | 17 | 239 |
| Chao Cen et al [33]. (1) | 2020 | China | 18–75 | no | 0.774 (0.767, 0.781) | RP | ultrasonography | 16,468 | 6.95 | 4470 | 2960 | 1791 | 7247 |
| Chao Cen et al [33]. (2) | 2020 | China | 18–75 | no | 0.783 (0.769, 0.796) | RP | ultrasonography | 5000 | 6.87 | 1320 | 1002 | 439 | 2239 |
| I-Ting Lin et al [34]. (1) | 2021 | China | - | MetS | 0.697 | RP | ultrasonography | 764 | - | 262 | 155 | 92 | 255 |
| I-Ting Lin et al [34]. (2) | 2021 | China | - | MetS | 0.747 | RP | ultrasonography | 1205 | - | 373 | 284 | 99 | 449 |
| Kyungchul Song, et.al [38]. | 2021 | Korea | 10–19 | no | 0.667 (0.636, 0.697) | RP | ALT (>26 U/L for boys and >22 U/L for girls) | 3728 | 8.391 | 215 | 895 | 190 | 2428 |
| Ehsaneh Taheri et.al [36]. | 2022 | Iran | 35–70 | obesity/T2D | 0.862 (0.856, 0.877) | RP | Fatty liver index ≥ 60 Overweight or obese/T2DM | 1932 | 8.62 | 790 | 447 | 178 | 517 |
| Hwi Seung Kim et al [39]. | 2022 | Korea | - | obesity | 0.770 (0.762, 0.778) | RP | ultrasonography | 10,585 | - | 2728 | 3331 | 556 | 3970 |
| Sensitivity | Specificity | AUC | |
|---|---|---|---|
| TyG-BMI | 0.79 (0.73, 0.84) | 0.75 (0.63, 0.84) | 0.84 (0.80, 0.87) |
| TyG-WC | 0.82 (0.74, 0.88) | 0.69 (0.61, 0.76) | 0.81 (0.77, 0.84) |
| TyG | 0.73 (0.69, 0.76) | 0.67 (0.65, 0.70) | 0.75 (0.71, 0.79) |
| Cut-Off < 6 (n = 3) | Cut-Off 6–8 (n = 4) | Cut-Off 8–8.5 (n = 6) | Cut-Off ≥ 8.5 (n = 6) | |
|---|---|---|---|---|
| Pooled sensitivity (95%CI) | 0.75 (0.71, 0.78) | 0.75 (0.74, 0.75) | 0.72 (0.70, 0.73) | 0.64 (0.64, 0.65) |
| Pooled specificity (95%CI) | 0.74 (0.72, 0.76) | 0.71 (0.70, 0.71) | 0.69 (0.68, 0.69) | 0.66 (0.66, 0.67) |
| Pooled PLR (95%CI) | 3.01 (2.60, 3.48) | 2.47 (2.33, 2.63) | 2.22 (1.87, 2.63) | 1.99 (1.61, 2.45) |
| Pooled NLR (95%CI) | 0.27 (0.17, 0.44) | 0.41 (0.33, 0.51) | 0.45 (0.35, 0.59) | 0.45 (0.33, 0.62) |
| DOR (95%CI) | 11.39 (6.30, 20.57) | 5.98 (4.69, 7.63) | 4.92 (3.33, 7.26) | 4.40 (2.63, 7.37) |
| DOR (Cochran Q-value), (P) | 7.09 (0.029) | 75.03 (<0.001) | 96.32 (<0.001) | 661.86 (<0.001) |
| Spearman (P) | 0.50 (0.667) | 0.80 (0.200) | 0.60 (0.208) | 0.60 (0.208) |
| AUC (SE) | 0.81 ± 0.01 | 0.77 ± 0.01 | 0.75 ± 0.02 | 0.72 ± 0.02 |
Publisher’s Note: MDPI stays neutral with regard to jurisdictional claims in published maps and institutional affiliations. |
© 2022 by the authors. Licensee MDPI, Basel, Switzerland. This article is an open access article distributed under the terms and conditions of the Creative Commons Attribution (CC BY) license (https://creativecommons.org/licenses/by/4.0/).
Share and Cite
Wang, J.; Yan, S.; Cui, Y.; Chen, F.; Piao, M.; Cui, W. The Diagnostic and Prognostic Value of the Triglyceride-Glucose Index in Metabolic Dysfunction-Associated Fatty Liver Disease (MAFLD): A Systematic Review and Meta-Analysis. Nutrients 2022, 14, 4969. https://doi.org/10.3390/nu14234969
Wang J, Yan S, Cui Y, Chen F, Piao M, Cui W. The Diagnostic and Prognostic Value of the Triglyceride-Glucose Index in Metabolic Dysfunction-Associated Fatty Liver Disease (MAFLD): A Systematic Review and Meta-Analysis. Nutrients. 2022; 14(23):4969. https://doi.org/10.3390/nu14234969
Chicago/Turabian StyleWang, Jing, Shoumeng Yan, Yani Cui, Feinan Chen, Meihua Piao, and Weiwei Cui. 2022. "The Diagnostic and Prognostic Value of the Triglyceride-Glucose Index in Metabolic Dysfunction-Associated Fatty Liver Disease (MAFLD): A Systematic Review and Meta-Analysis" Nutrients 14, no. 23: 4969. https://doi.org/10.3390/nu14234969
APA StyleWang, J., Yan, S., Cui, Y., Chen, F., Piao, M., & Cui, W. (2022). The Diagnostic and Prognostic Value of the Triglyceride-Glucose Index in Metabolic Dysfunction-Associated Fatty Liver Disease (MAFLD): A Systematic Review and Meta-Analysis. Nutrients, 14(23), 4969. https://doi.org/10.3390/nu14234969