Article

Deciphering the Efficacy and Mechanism of Astragalus membranaceus on High Altitude Polycythemia by Integrating Network Pharmacology and In Vivo Experiments

1
School of Life Sciences, Northwestern Polytechnical University, Xi’an 710072, China
2
Research Center of Special Environmental Biomechanics & Medical Engineering, Northwestern Polytechnical University, Xi’an 710072, China
3
General Station for Drug & Instrument Supervision and Control, Joint Logistics Support Force, PLA, Dalian 116041, China
4
School of Computer Science, Northwestern Polytechnical University, Xi’an 710072, China
*
Authors to whom correspondence should be addressed.
These authors contributed equally to this work.
Nutrients 2022, 14(23), 4968; https://doi.org/10.3390/nu14234968
Submission received: 1 September 2022 / Revised: 11 November 2022 / Accepted: 17 November 2022 / Published: 23 November 2022
(This article belongs to the Section Phytochemicals and Human Health)

Abstract

:
Hypoxic exposure makes plateau migrators susceptible to high altitude polycythemia (HAPC). Astragalus membranaceus (AM) is an edible and medicinal plant with remarkable immunomodulatory activities. The purpose of this study was to discover if AM could be a candidate for the prevention of HAPC and its mechanism. Here, network pharmacology was applied to screen active compounds, key targets, and enriched pathways of AM in the treatment of HAPC. Molecular docking evaluated the affinity between compounds and core targets. Subsequently, the mechanisms of AM were further verified using the hypoxia exposure-induced mice model of HAPC. The network pharmacology analysis and molecular docking results identified 14 core targets of AM on HAPC, which were predominantly mainly enriched in the HIF-1 pathway. In the HAPC animal models, we found that AM inhibited the differentiation of hematopoietic stem cells into the erythroid lineage. It also suppressed the production of erythrocytes and hemoglobin in peripheral blood by reducing the expression of HIF-1α, EPO, VEGFA, and Gata-1 mRNA. Furthermore, AM downregulated the expression of IL-6, TNF-α, and IFN-γ mRNA, thereby alleviating organ inflammation. In conclusion, AM supplementation alleviates hypoxia-induced HAPC in mice, and TNF-α, AKT1, HIF-1α, VEGFA, IL-6, and IL-1B may be the key targets.

1. Introduction

A high altitude is an area higher than 1500 m above sea level, in which approximately 500 million people live worldwide [1]. Here, the extreme environment of hypoxia is the greatest challenge to people’s health [2]. It causes tissue anoxia, and erythropoietin (EPO) increases, resulting in an overproduction of red blood cells [3,4]. These symptoms are clinically referred to as high altitude polycythemia (HAPC) [5]. Advanced HAPC can lead to brain damage [6], cardiac failure [7], and neurological illness [8,9]. Anticoagulants and estrogen medications are currently commonly utilized to treat the condition [10,11], but their side effects, including renal failure, nausea, vomiting, dizziness, and exhaustion [12], are readily apparent. Recently, a number of natural compounds have demonstrated therapeutic potential for hypoxic illness [13,14,15]. They are easily accessible, have many physiological effects, and are non-toxic. Consequently, it is vital to seek out natural ingredients for the treatment of HAPC.
Astragalus membranaceus (AM) is one of the most popular Chinese herbal remedies [16]. More than 100 chemicals, including flavonoids, saponins, polysaccharides, and amino acids, have been discovered in AM [17]. They have numerous physiological functions, including immunological modulation, anti-oxidation, and anti-inflammation [18,19]. By regulating T-cell responses, Astragaloside IV suppresses pulmonary vascular remodeling and hypoxic pulmonary hypertension, according to pharmacological investigations [20]. Astragaloside IV preserves vascular endothelial cell function in mouse models generated by chronic intermittent hypoxia via the Calain-1/SIRT1/AMPK signaling pathway [21]. The aqueous extract of AM significantly enhances cognitive function in rats exposed to hypoxia [22]. Based on the above reports, it is important to investigate the main active components and targets of AM in the treatment or prevention of HAPC.
By establishing the component-target-disease network, network pharmacology can systematically describe the mechanism by which medicine mitigates disease [23]. It is appropriate to identify the therapeutic components of complex medications, such as natural products [24]. In this study, we utilized network pharmacology and molecular docking techniques to screen the common targets of HAPC and AM. An “AM-component-target-disease” network was constructed to explain the main active components and key targets of AM in the treatment of HAPC. In addition, a mouse model of HAPC was established to verify the efficacy of AM in treating HAPC and modulating key targets. This study will provide a theoretical framework for AM to prevent HAPC, and a basis for the creation of active components in AM.

2. Materials and Methods

2.1. Network Pharmacology Analysis

2.1.1. Collection and Analysis of Targets of AM and HAPC

The active ingredients of AM were screened by the Traditional Chinese Medicine Systems Pharmacology (TCMSP; http://lsp.nwu.edu.cn/tcmsp.php, accessed on 20 May 2022) database [25]. The filtering criteria were oral availability (OB) ≥ 30% and drug-like properties (DL) ≥ 0.18 [26]. The relevant targets of active ingredients screened were determined by TCMSP, STITCH (http://stitch.embl.de, accessed on 20 May 2022, confidence = 0.4, the maximum number of interactors ≤ 50), and Swisstargetprediction (http://www.swisstargetprediction.ch/, accessed on 20 May 2022, probability > 0.6).
The HAPC-related targets were retrieved from the Genecards (https://www.genecards.org/, accessed on 20 May 2022) database using the “High Altitude Polycythemia” term. Meanwhile, we selected differentially expressed genes (DEGs) in the GSE46480 dataset for a more comprehensive collection of disease targets. The GSE46480 dataset contained transcriptome sequencing data of peripheral blood mononuclear cells from 98 volunteers, all of whom developed HAPC symptoms three days after entering the plateau. We screened 15 volunteers with small differences at baseline and counted DEGs associated with HAPC (|log2 Fold Change| ≥ 1, p.adjusted < 0.05) using the “Limma” R package (version 3.42.2).
The targets collected above were converted to standard target names (species: Homo sapiens) using the UniProtKB (https://www.uniprot.org/, accessed on 22 May 2022) database. The targets shared by active ingredients and diseases were found by the jvenn (http://jvenn.toulouse.inra.fr/app/index.html/, accessed on 22 May 2022) platform. These targets can be potential targets for AM against HAPC.

2.1.2. Protein–Protein Interactions (PPI) Network and Core Target Analysis

The PPI networks for common targets of AM and HAPC were established by the STRING (version 11.5, https://cn.string-db.org/, accessed on 22 May 2022, minimum required interaction score ≥ 0.7) database. Cytoscape 3.8.2 was further used to visualize and analyze PPI networks, and to build drug-active component-target, drug-active component-target-disease, and active component-target-pathway networks.
For each target in the PPI network, the degree centrality (DC), betweenness centrality (BC), and closeness centrality (CC) values were calculated by the CytoNCA plug-in. We selected core targets that satisfied the criteria (greater than or equal to the median of two values of DC, CC, and BC).

2.1.3. Analysis of Pathway Enrichment

The pathway enrichment analysis of drug-disease common targets and core targets was performed using the DAVID database (https://david.ncifcrf.gov/, accessed on 25 May 2022). A value of p < 0.05 was taken as the screening criterion for the pathway.

2.2. Molecular Docking of Active Components-Core Targets

The 3D structures of the active ingredients were obtained through the ZINC (https://zinc15.docking.org/, accessed on 25 May 2022) database and saved in mol2 format for the docking ligands. The 3D models of the core targets (X-ray-determined lowest resolution proteins, Homo sapiens limited) in PDB format were obtained through the PSCB PDB (https://www.rcsb.org/, accessed on 25 May 2022) database. Water molecules and excess ligands were removed by the Pymol software 2.4.0a0. We applied the Swissdock (http://www.swissdock.ch/, accessed on 25 May 2022) platform to perform molecular docking. Finally, Pymol software was used to visualize the molecular docking results.

2.3. Animals

Six-week-old male C57BL/6J mice (weighting 17–20 g) were acquired from the Experimental Animal Center, College of Medicine, Xi’an Jiaotong University (Xi’an, China). All mice were adaptively maintained for a week in the environment with a temperature of 22 ± 2 °C, a humidity of 55–60%, and a 12 h light-dark cycle. Food and water were provided ad libitum. Subsequent procedures were approved by the Medical and Laboratory Animal Ethics Committee of Northwestern Polytechnical University, under approval number 202201168.

2.4. Establishment of HAPC Model

Mice were randomly divided into three groups after adaptive feeding for a week: (1) Normoxic group (n = 6, 21% O2); (2) Hypoxic group (n = 6), mice were placed in a hypobaric hypoxic chamber (model: DWC50-IIIC; Lihang, Guizhou, China). It was raised to a height of 5300 m at the velocity of 25 m/s (389 mmHg, 10.9 kPa, 12% O2) for 21 days of hypoxia, during which the chamber was opened 1 h per day for gavage operations and replenishment of food and water [27]. (3) Hypoxic + AM group (n = 6, mice were gavaged AM at the dose of 100 mg/kg once daily during hypoxia of 12% O2) (Yuanye, S27211) [28]. Meanwhile, mice in the Normoxic and Hypoxic groups were gavaged with an equal volume of ultrapure water daily. The body weights of these mice were recorded weekly. After 21 days, the HAPC model was assessed by testing peripheral blood.

2.5. Blood Counts

At the end of the experiment (21 days), whole blood was obtained from the orbit of mice. Red blood cell (RBC), hemoglobin (HGB), hematocrit (HCT), white blood cell (WBC), platelet (PLT), and neutrophil (NEUT) were subsequently measured with an automated hematology analyzer (Sysmex, Shanghai, China). Criteria for HAPC diagnosis: HGB ≥ 210 g/L [27].

2.6. Organ Morphology

After the mice were sacrificed by cervical dislocation, some organs (heart, liver, spleen, lung, kidney, brain) were rapidly separated. Organ coefficients (organ weight/body weight × 100%) were calculated after removing fat and blood from the surface. They were fixed in 4% paraformaldehyde for 48 h, then embedded with paraffin, histologically sectioned, and stained with hematoxylin-eosin (H&E). Images were obtained using a sectioning scanner (model: Science, Zhiying, Shandong, China).

2.7. Cell Preparation and Flow Cytometry

Mice femurs and tibias were isolated, and bone marrow (BM) cells were flushed from the marrow and placed in phosphate-buffered saline (PBS) with 2% fetal bovine serum (FBS). The pellet was then removed by filtration, and RBCs were discarded using red blood cell lysate (TIANGEN, RT122-02). Bone marrow mononuclear cells (MNCs) were obtained after washing twice with PBS.
Hematopoietic stem cells (HSCs) were labeled with phycoerythrin FITC-conjugated antibodies against CD3, B220, CD11b, Ter-119, and Gr-1 (eBioscience, #22-7770-72); PE anti-Sca-1, clone D7 (eBioscience, #12-5981-81); AF700 anti-c-kit clone 2B8 (BioLegend, #105846); APC anti-CD34, clone MEC14.7 (BioLegend, #119309); BV510 anti-CD16/32, clone 93 (BioLegend, #101333); Pecp/cyanine 5.5 anti-IL-7R, clone A7R34 (BioLegend, #135022); BV421 anti-CD135, cloneA2F10 (BioLegend, #135313).
HSCs were defined as LSK (LinSca-1+c-kit+), common myeloid progenitor (CMP) as LinSca-1c-kit+CD34+CD16/32, granulocyte-macrophage progenitor (GMP) as LinSca-1c-kit+CD34+CD16/32+, megakaryocyte-progenitor erythrocyte (MEP) as LinSca-1c-kit+CD34CD16/32, and common lymphoid progenitor (CLP) as LinCD135+IL-7R+. After washing, the labeled cells were analyzed on flow cytometer (model: BD-FACSCelesta, BD, San Jose, CA, USA). The results were evaluated with FlowJo (version 10.6.2). Adhesive cells were first removed with FSC-H and FSC-A, most mature cells were removed by Lin, and HSCs were selected based on Sca-1+c-kit+. Unstained samples, single staining, and FMO-1 controls were used to define the gate boundaries.

2.8. Quantitative Real-Time PCR (qRT-PCR)

Total RNA from MNCs was extracted and isolated using TRIzol (Invitrogen, 10296010). Reverse transcription was performed using a cDNA reverse transcription kit (TransGen, AU341) according to the manufacturer’s instructions (50 °C for 5 min, 85 °C for 5 s). A qRT-PCR was subsequently performed with SYBR-green SuperMix (TransGen, AQ601) on real-time PCR systems (Bio-Rad, CFX96). The cDNA was amplified by 40 PCR cycles (95 °C for 3 min, 95 °C for 10 s, 56 °C for 30 s, 72 °C for 30 s), and the mRNA expression of each gene was normalized to β-actin mRNA and quantified by the 2−ΔΔCt method. Primer sequences are shown in Table 1 (primers designed by Sangon, and primer specificity was verified using agarose gel electrophoresis following qRT-PCR).

2.9. Statistical Analysis

All data were expressed as means ± standard error of mean (SEM). Comparisons between two groups were assessed using unpaired Student’s t-test, and comparisons for more than two groups were analyzed using a one-way ANOVA followed by Tukey’s test (GraphPad Prism 9.0).

3. Results

3.1. Identification of Components in AM and Target Prediction

The research workflow is shown in Figure 1. A total of 87 AM components were searched and collected from TCSMP, and 20 active compounds were selected for database establishment using OB ≥ 30% and DL ≥ 0.18 as screening conditions (Table 2). Furthermore, we collected the targets of 20 active compounds in AM from the TCMSP, SwissTargetPrediction, and STITCH databases. After integrating UniProt database entries and removing duplicates, 386 AM targets were found, constituting a network of “AM-component-targets” (Figure 2).

3.2. Screened Targets Related HAPC

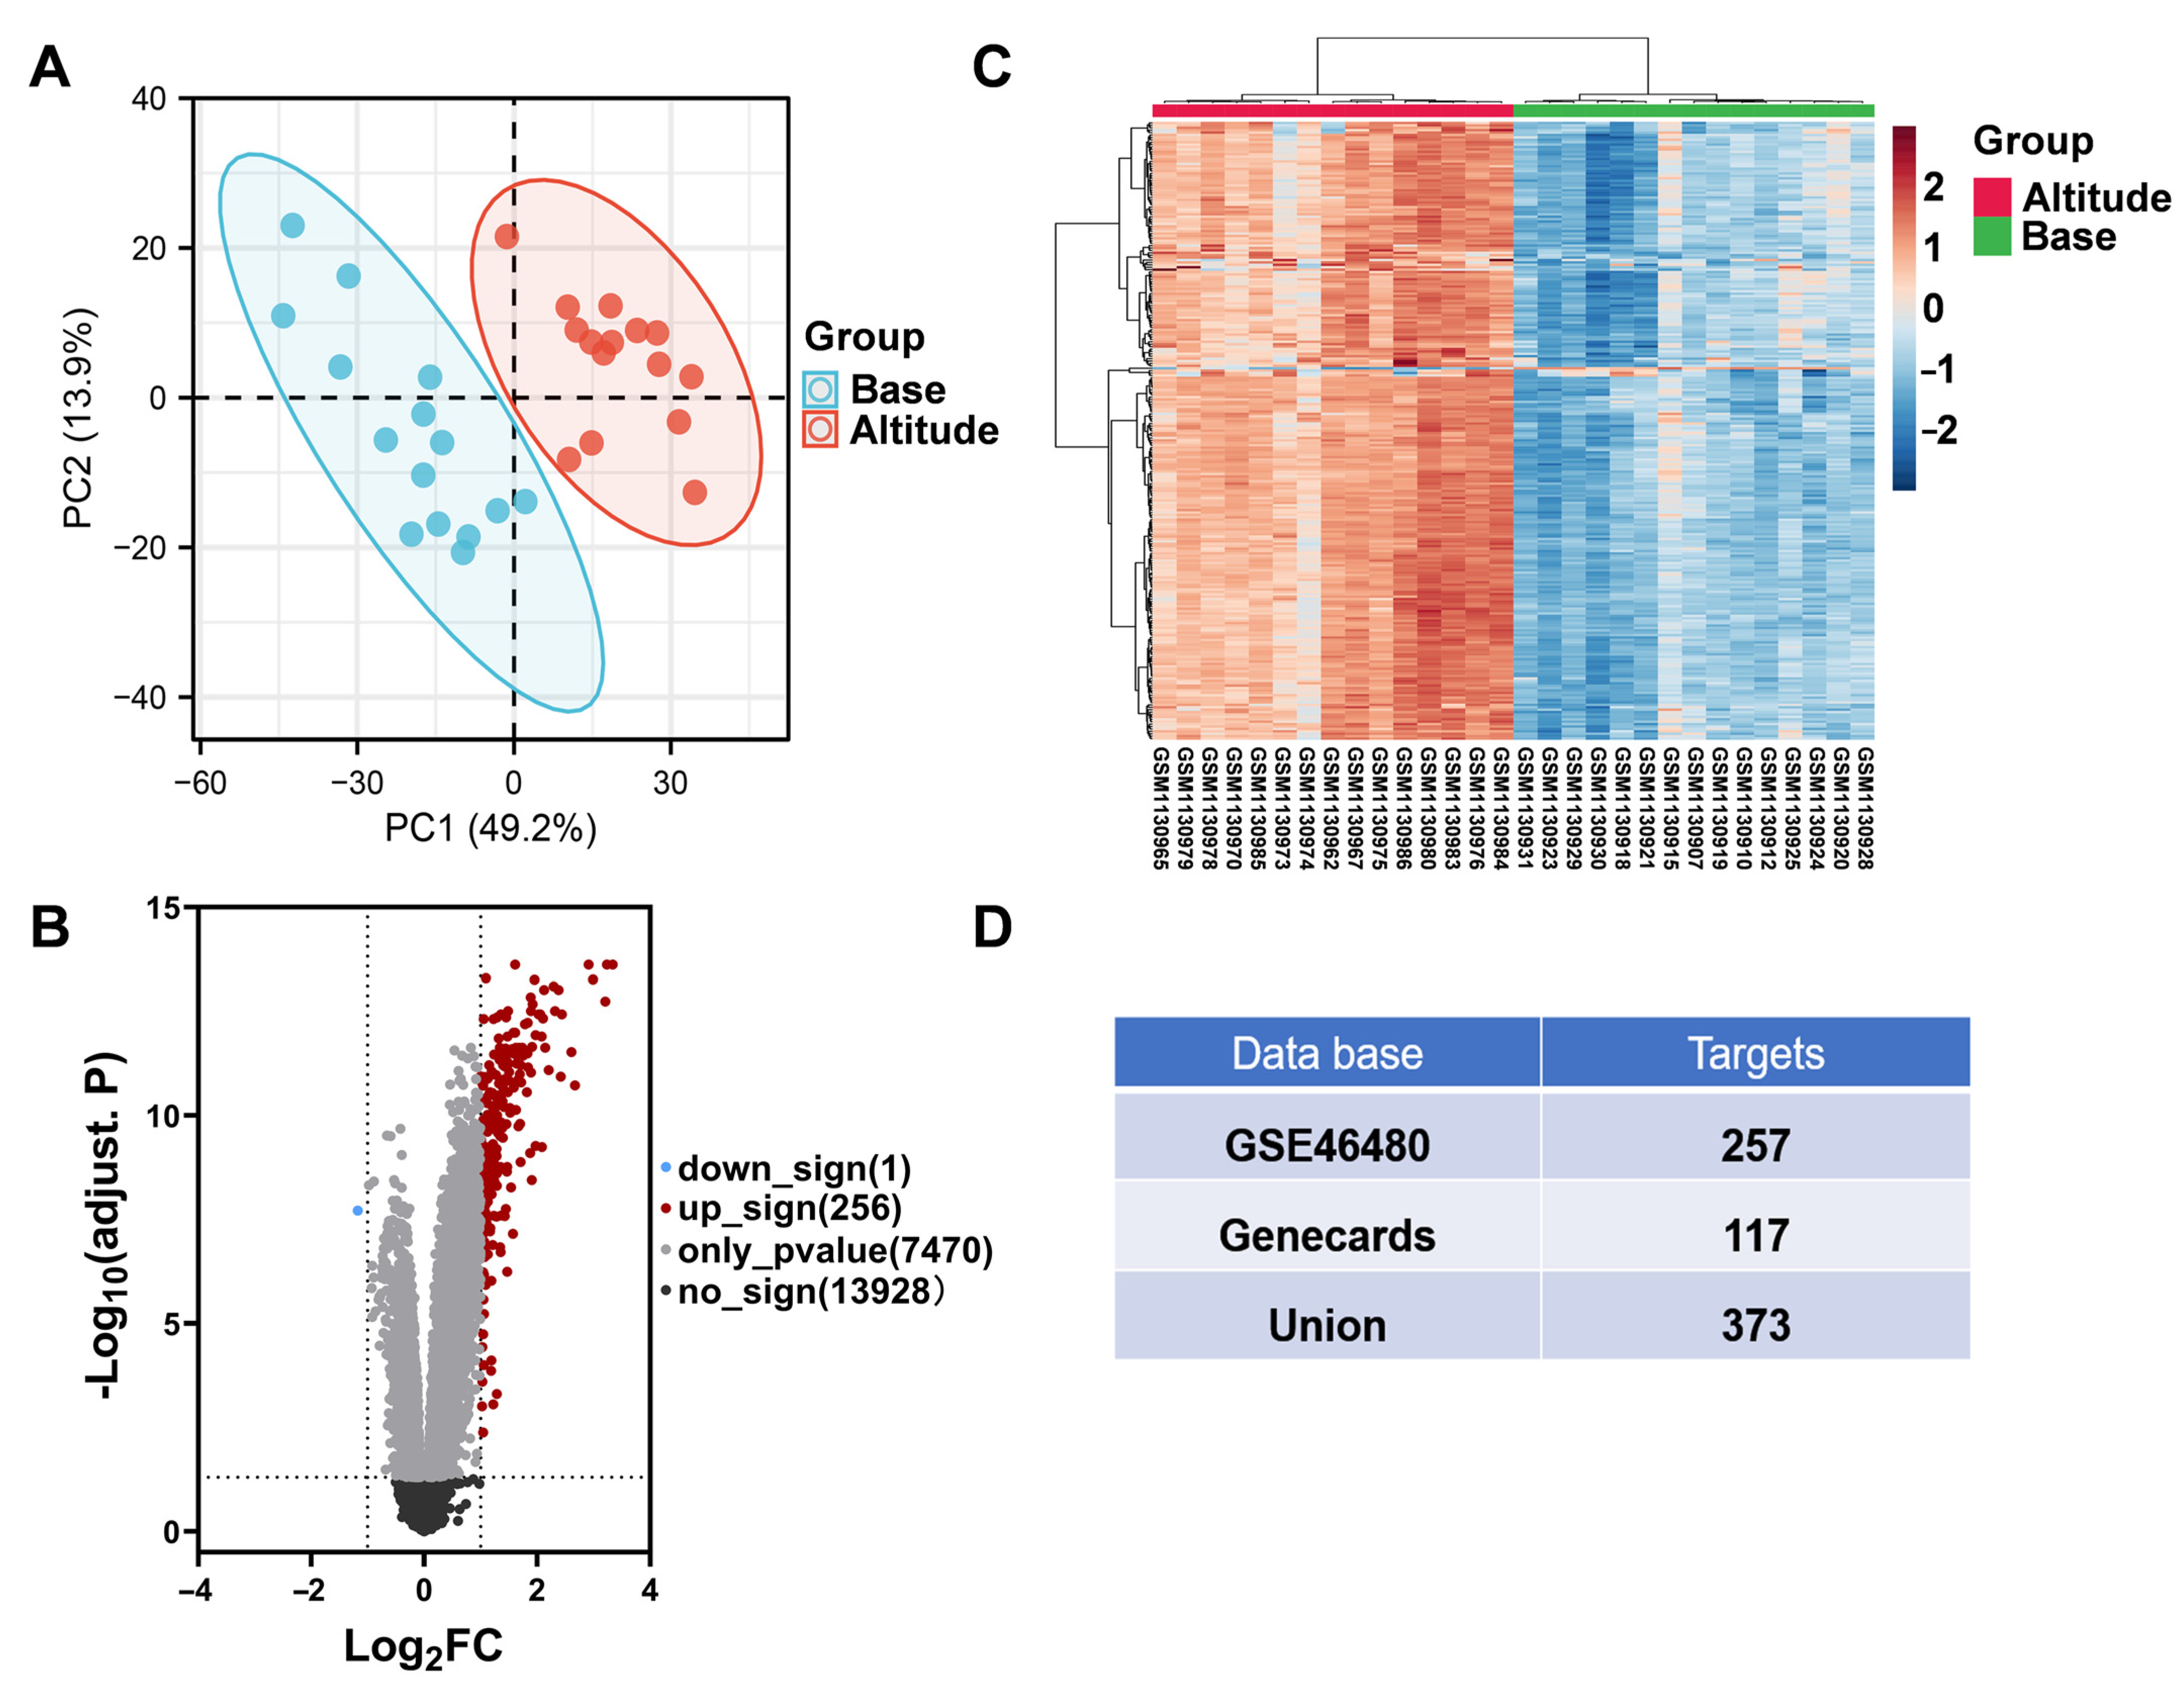
Subsequently, we obtained 117 HAPC targets from the Genecards database and 257 targets from the GEO database (Supplementary Table S1). The GSE46480 microarray dataset contained the gene expression in PBMCs of 98 participants with HAPC symptoms at sea level (before entering the high altitudes region) and high altitudes (3 days of high altitudes exposure), using p < 0.05 as a threshold. The PCA analysis and differential gene analysis obtained a total of 257 DEGs, and volcano plots showed that 256 DEGs were upregulated and 1 DEG was downregulated at high altitudes (Figure 3A–C). Finally, 373 predicted targets for HAPC were collected from the GeneCards database and GSE46480 datasets (Figure 3D).

3.3. Identified 36 Common Targets between AM and HAPC

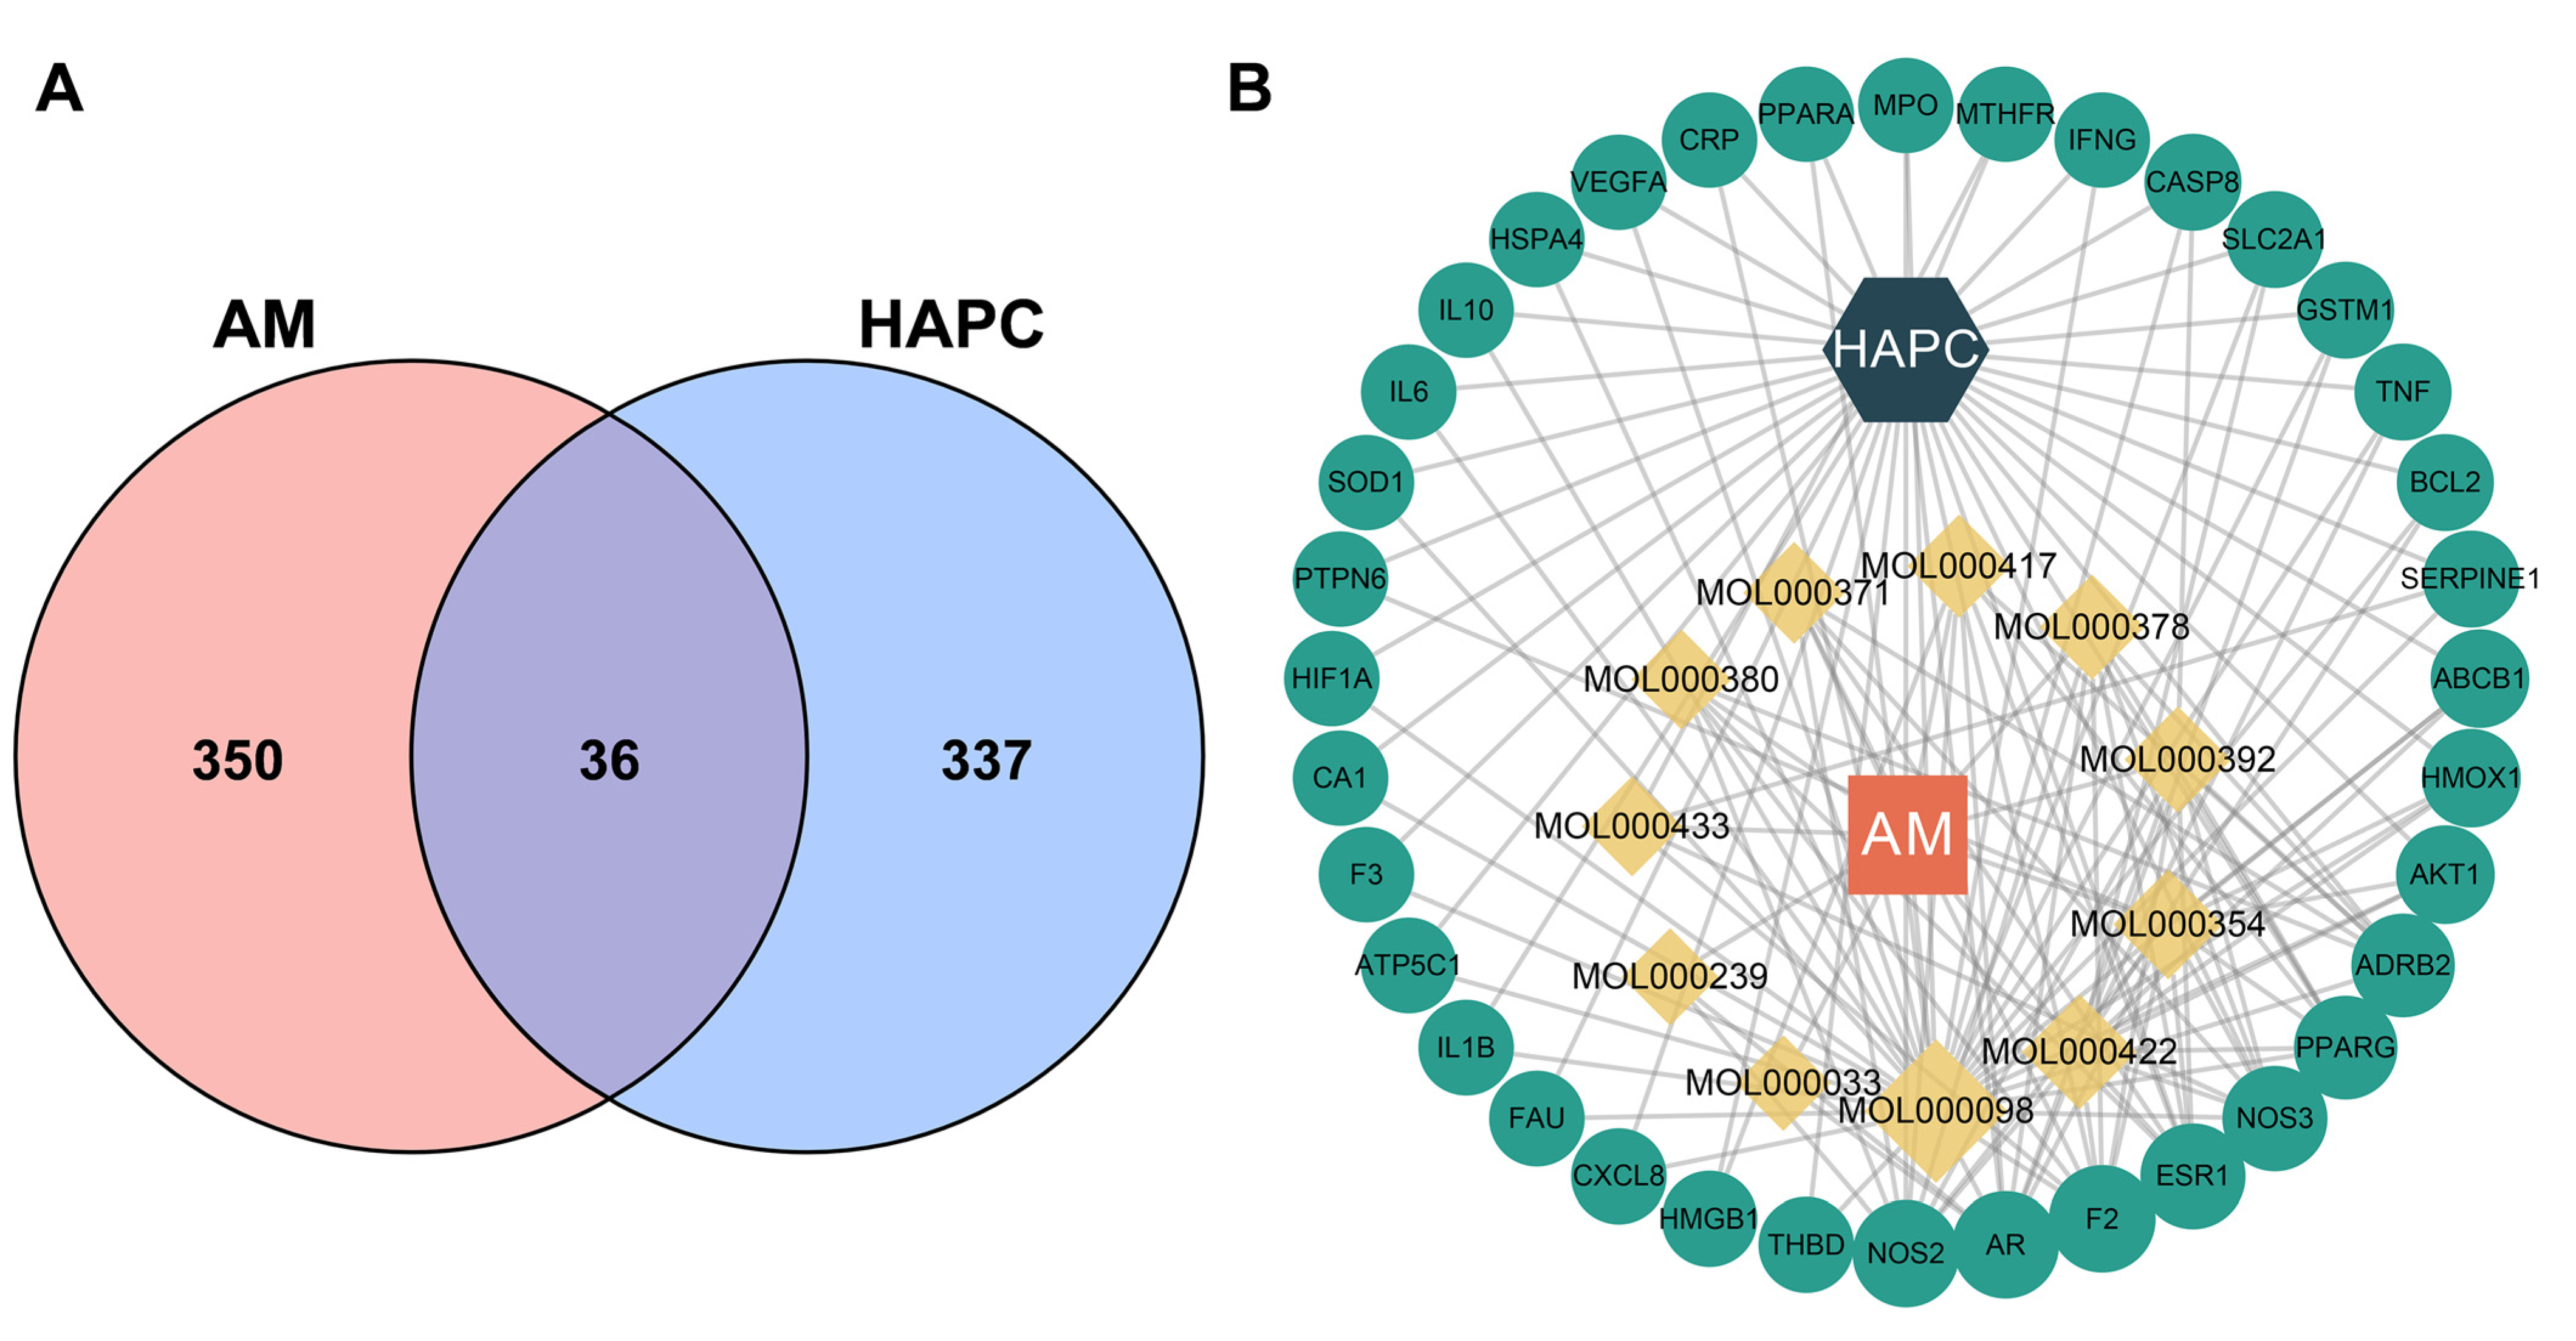
To explore potential pathways of AM in treating HAPC, 386 AM-related targets were intersected with 373 HAPC-related targets, resulting in 36 common targets (Figure 4A and Table 3), which could serve as prospective targets of AM for the treatment of HAPC. Cytoscape 3.8.3 was used to construct a drug-compound-potential-target-disease interaction network (Figure 4B).

3.4. Analyzed Core Targets of AM on HAPC

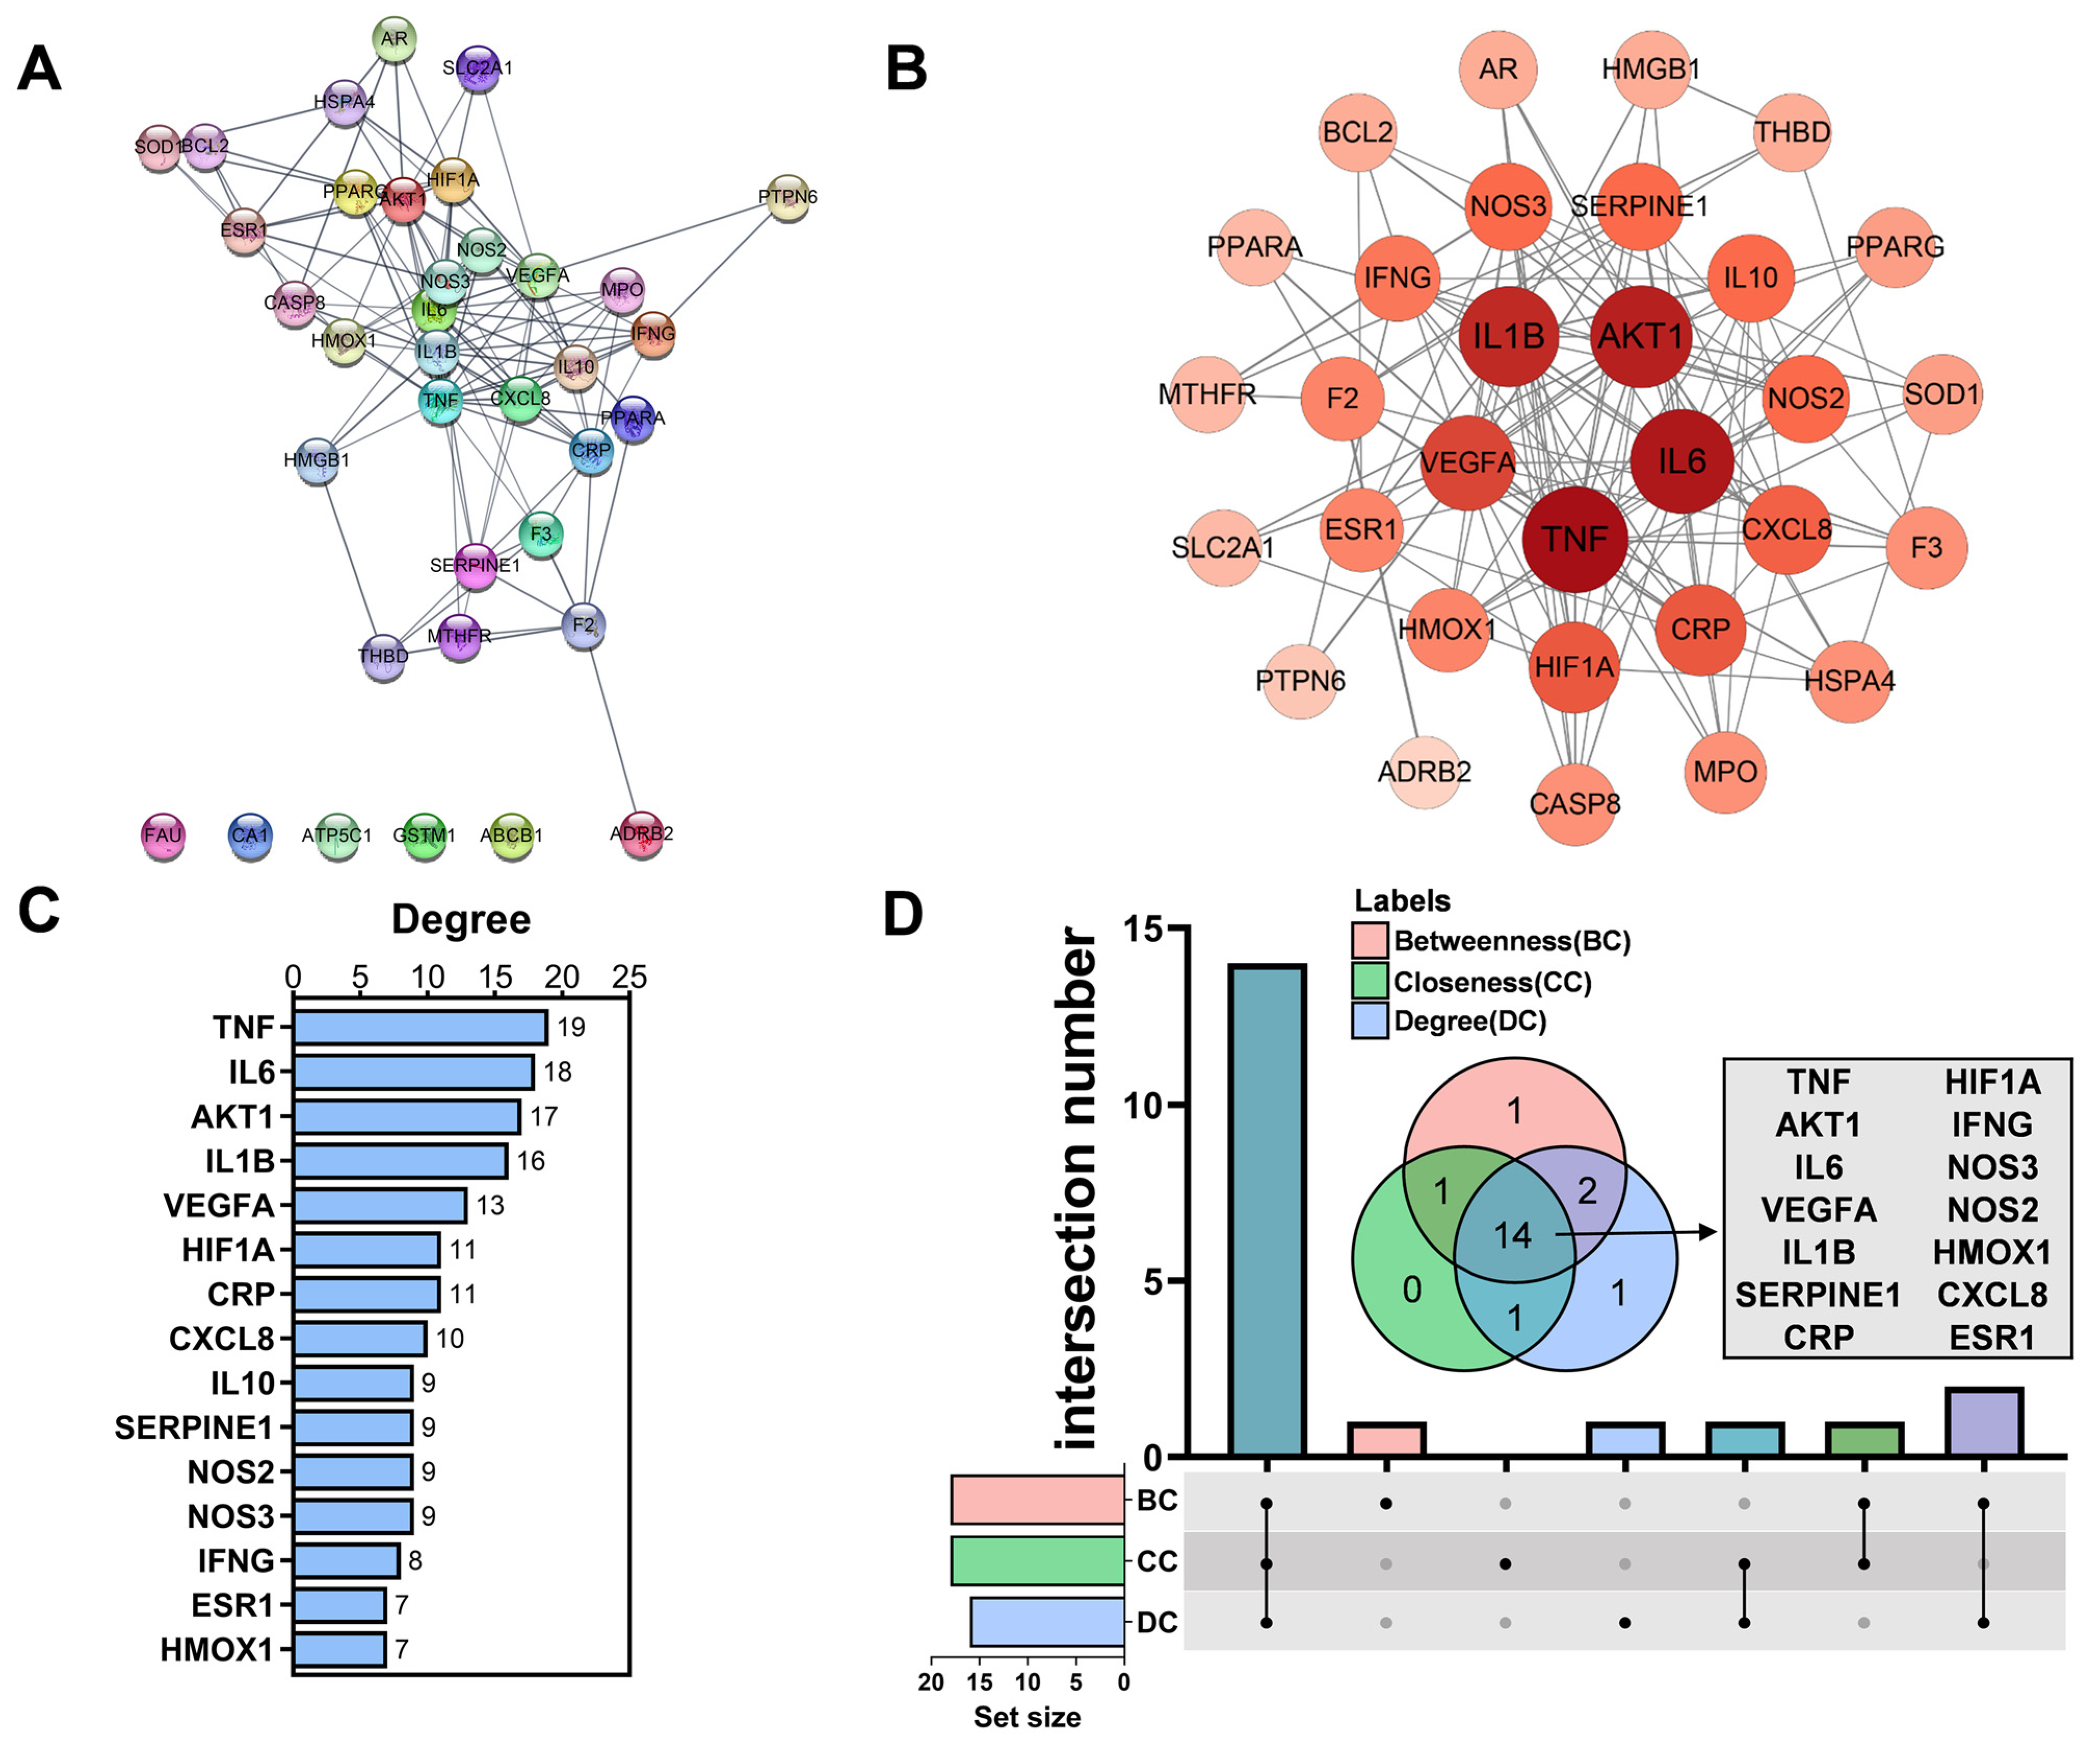
To further screen the core targets, a PPI network of 36 common targets was established (Figure 5A,B). TNF, IL6, AKT1, IL1B, and VEGFA showed the highest degree of cross-linking to other targets in the PPI network (Figure 5C). DC, CC, and BC can be used to find key nodes in the network. Therefore, we selected core targets (DC, CC, and BC values ≥ the median) in the PPI network. Finally, we obtained a total of 14 core targets, which were TNF, AKT1, IL6, VEGFA, IL1B, SERPINE1, CRP, NOS3, HIF1A, NOS2, IFNG, HMOX1, CXCL8, and ESR1 (Figure 5D and Table 4).

3.5. Enriched Pathway Analysis of Common Targets and Core Targets

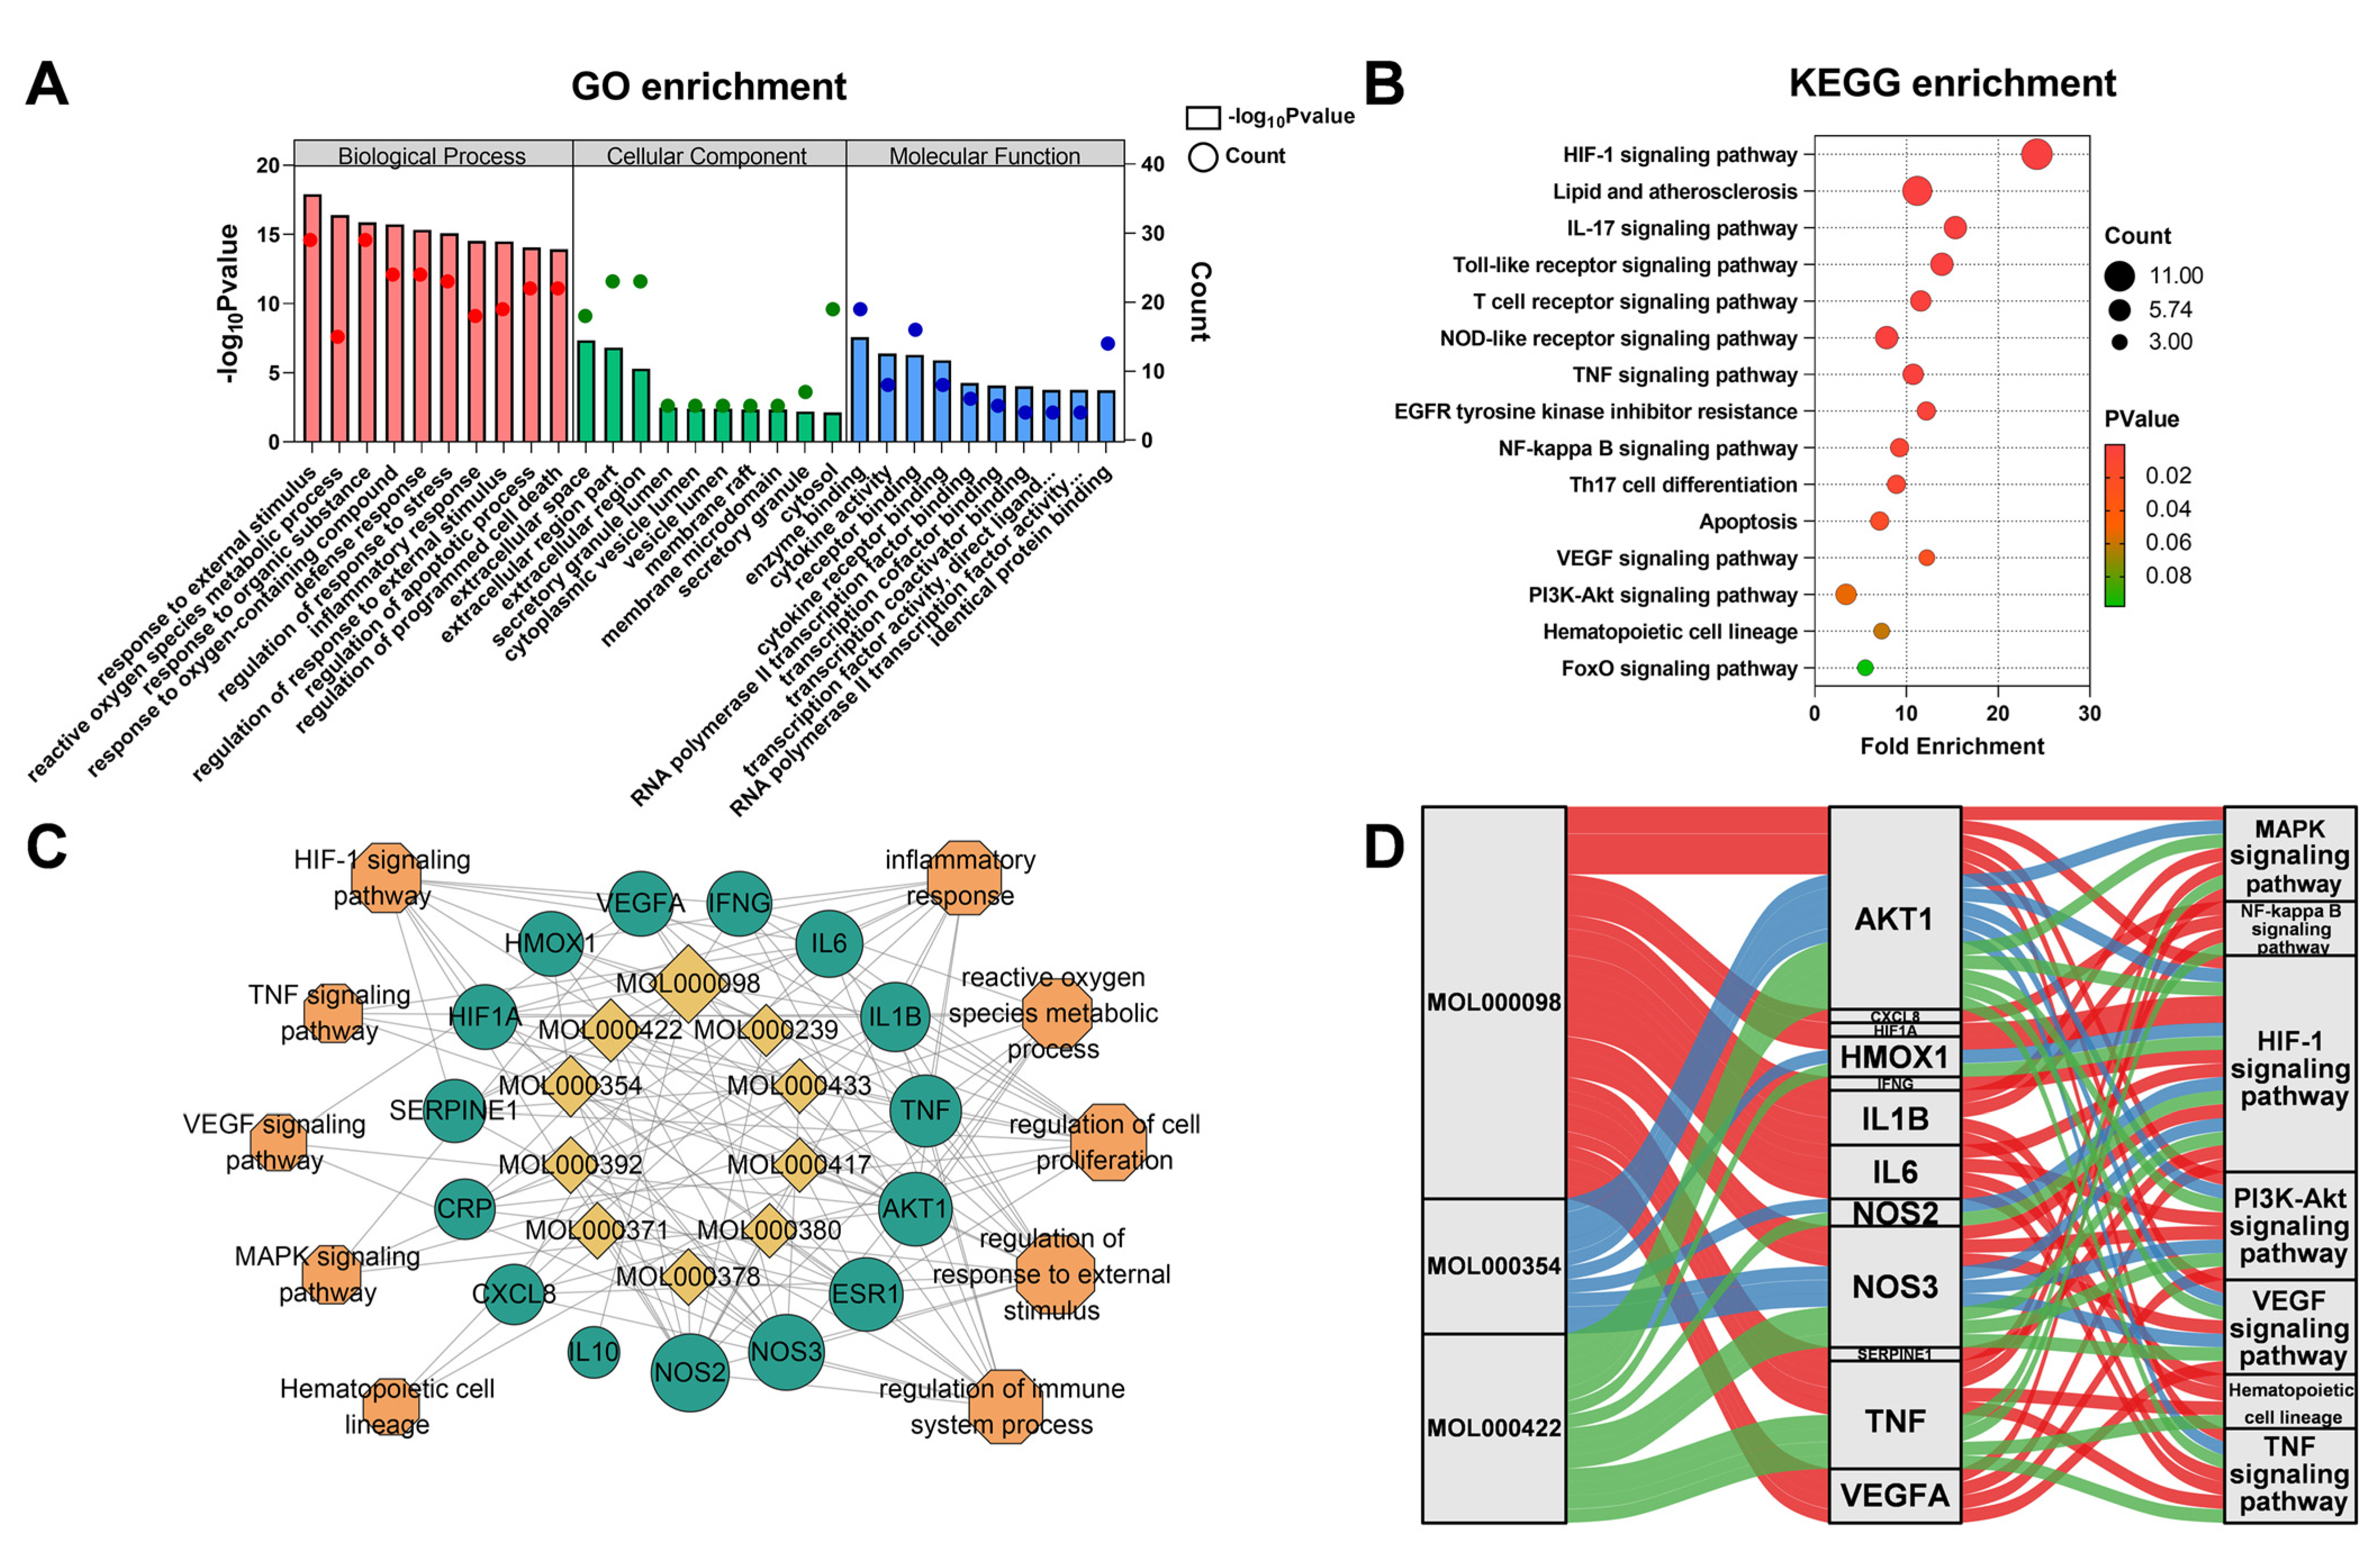
To explore the mechanisms of AM for HAPC, we performed a pathway enrichment analysis using the DAVID database. KEGG and GO enriched pathways were screened by p < 0.05. We analyzed biological processes (BPs), cellular components (CCs), and molecular functions (MFs). In total, 1545 GO terms were significantly abundant, including 46 MFs, 20 CCs, and 1479 BPs (Supplementary Table S2). The top 10 significantly abundant terms in MFs, CCs, and BPs were shown in Figure 6A. The results showed that the main MFs were enzyme-binding, cytokine activity, and receptor-binding. The main CCs were extracellular space, extracellular region part, and extracellular region. The main BPs were a response to external stimulus, reactive oxygen species metabolic process, and response to the organic substance. In addition, the KEGG pathway enrichment analysis identified 75 pathways (p < 0.05) (Figure 6B and Supplementary Table S2). These targets were mainly involved in the HIF-1 signaling pathway and inflammatory signaling pathways.
Further, we analyzed the pathways involved in 14 core targets. It was found that the HIF-1 signaling pathway was significantly enriched (9/14) (Figure 6C and Supplementary Table S3). An active compound-core-target-pathway network was established using the Sankey diagram (Figure 6D). Through these core targets, AM was involved in the regulation of the HIF-1 pathway, TNF pathway, and hematopoietic cell lineage.

3.6. Molecular Docking Verified the Binding Mode of Compounds to Targets

Molecular docking mainly investigates the interaction between small molecules and proteins and predicts their binding modes and affinity magnitudes. It is generally believed that the necessary condition for small molecules to modulate protein activity is that they can enter and anchor in the active pocket of the protein [29]. It is mainly characterized by its stable binding to amino acid residues of proteins through intermolecular forces; that is, the intermolecular affinity ≤ –5 kcal/mol. On the basis of this assumption, we selected the core target as the receptor and investigated its ability to interact with compounds. The molecular docking results are shown in Table 5. Some molecules with the highest affinity to the core target of binding patterns were screened for visualization (Figure 7). The results showed that quercetin had the highest affinity with 10 core targets (HIF1A, VEGFA, AKT1, TNF, IL6, IFNG, IL1B, HMOX1, CXCL8, and CRP).

3.7. AM Relieved Hematological Abnormalities in HAPC Mice

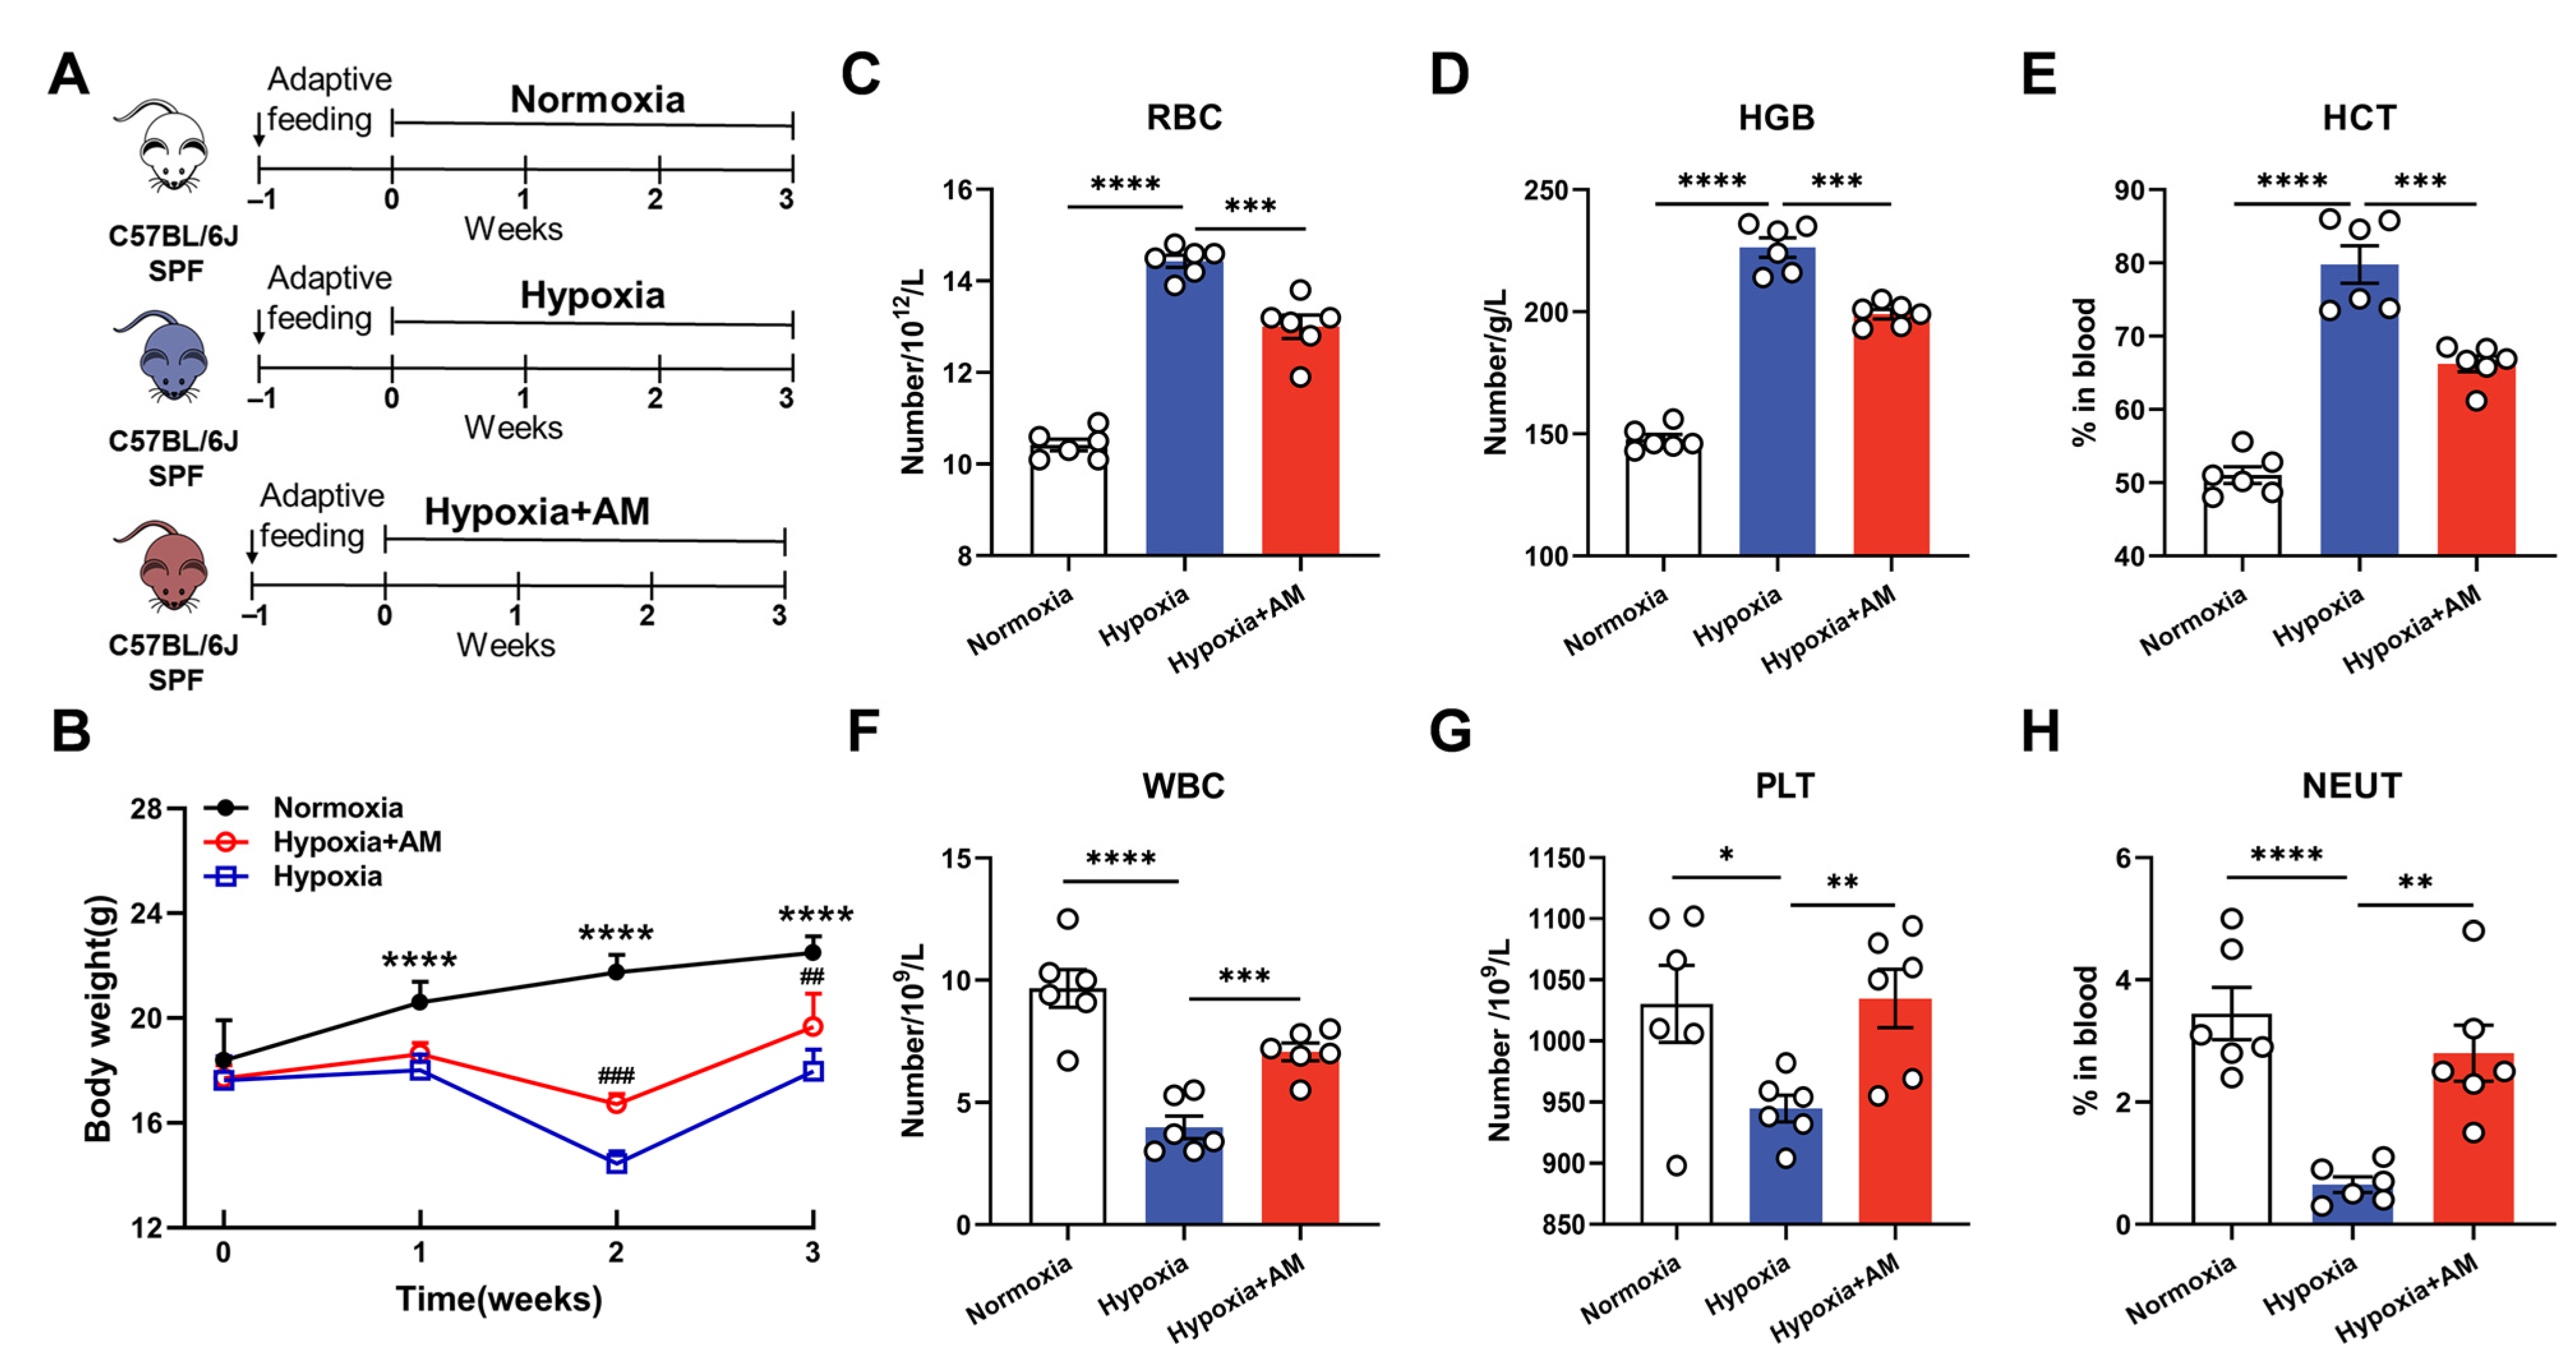
Then, we established a mouse model of HAPC to validate the molecular mechanism of AM for the prevention of HAPC. The experimental design is shown in Figure 8A. During the hypoxic exposure, mice were administered with AM for 21 days. At the end of the experiment, we discovered that the Hypoxic group had 20% less body mass than the Normoxic group. However, mice treated with AM gained 9% more weight than those in the Hypoxic group (Figure 8B).
To assess the influence of AM on the hematological parameters of HAPC under a hypoxic environment, we analyzed the amounts of blood components in mice. Compared to the Normoxic group, the RBC, HGB, and HCT levels increased in the Hypoxic group. However, AM therapy was able to reduce the RBC, HGB, and HCT levels (Figure 8C–E). After hypoxia treatment, WBC, PLT, and NEUT were dramatically lowered, and AM may alleviate this result (Figure 8F–H). According to the research, AM ameliorated hematological abnormalities in HAPC mice.

3.8. AM Alleviated Hypoxia-Induced Organ Damage

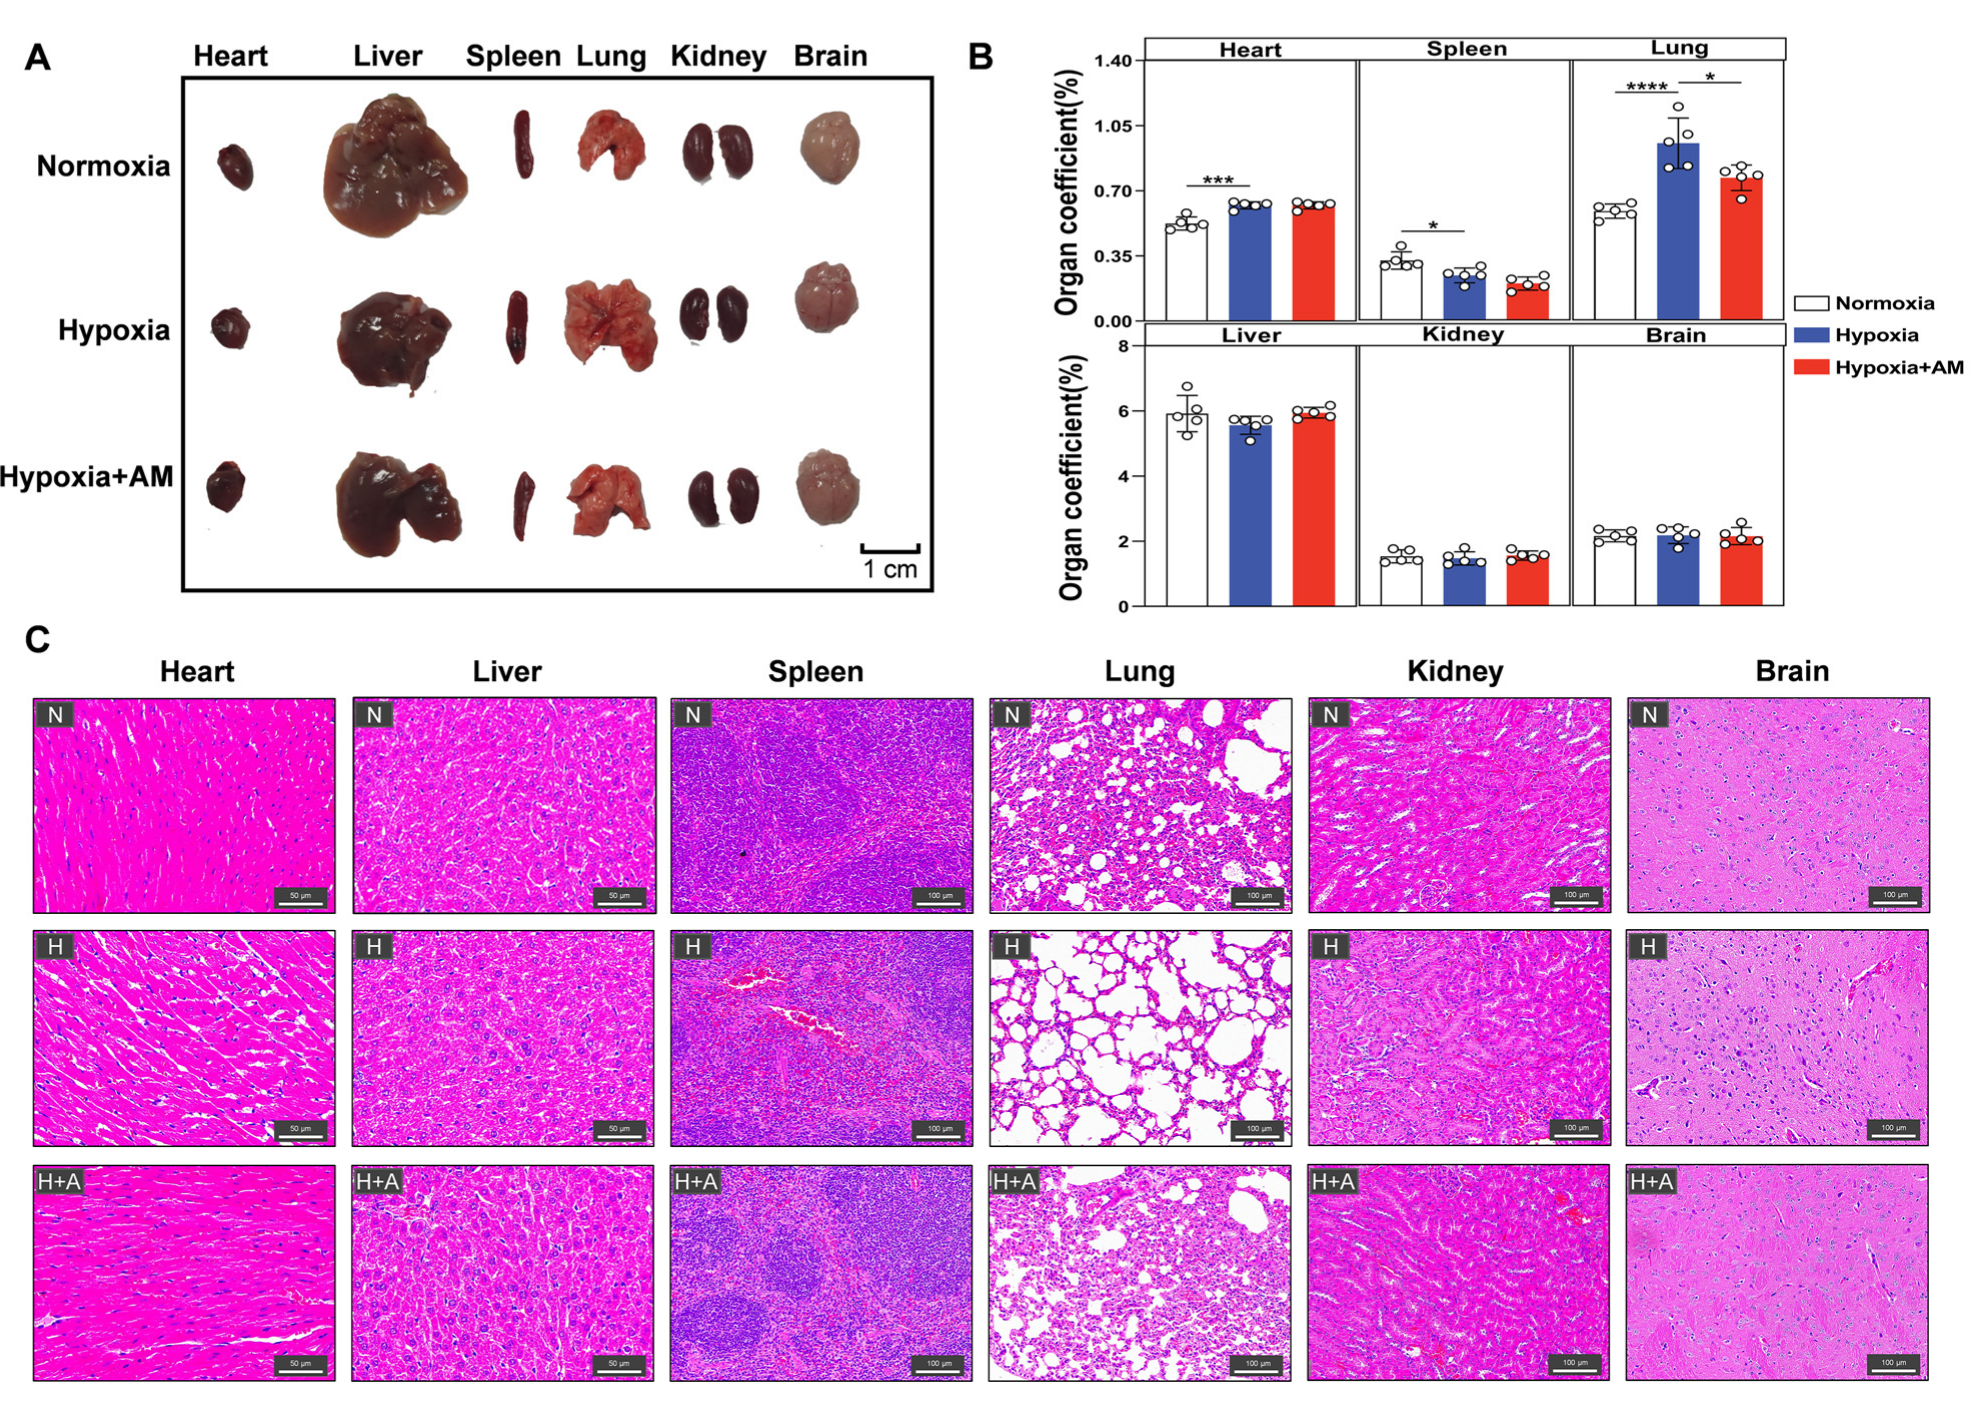
To determine if AM protected the organs in HAPC mice, we isolated organs from mice (Figure 9A), assessed organ coefficients, and evaluated organ pathology using H&E staining. In comparison to the Normoxic group, the organs of the Hypoxic group were considerably injured by inflammatory infiltration. It was mainly characterized by an increased cardiac coefficient, muscle fiber rupture, disorganized hepatic lobule structure, irregular hepatic cord arrangement, decreased spleen coefficient, disorganized red and white pulp structure, enlarged alveoli, significant renal fibrosis, and disorganized neuronal cells in the brain. Interestingly, the organ damage was markedly alleviated after AM was administered (Figure 9B,C). These findings indicated that AM mitigated organ damage caused by oxidative stress and inflammatory infiltration under hypoxia.

3.9. AM Inhibited Erythroid Differentiation of HSCs in BM

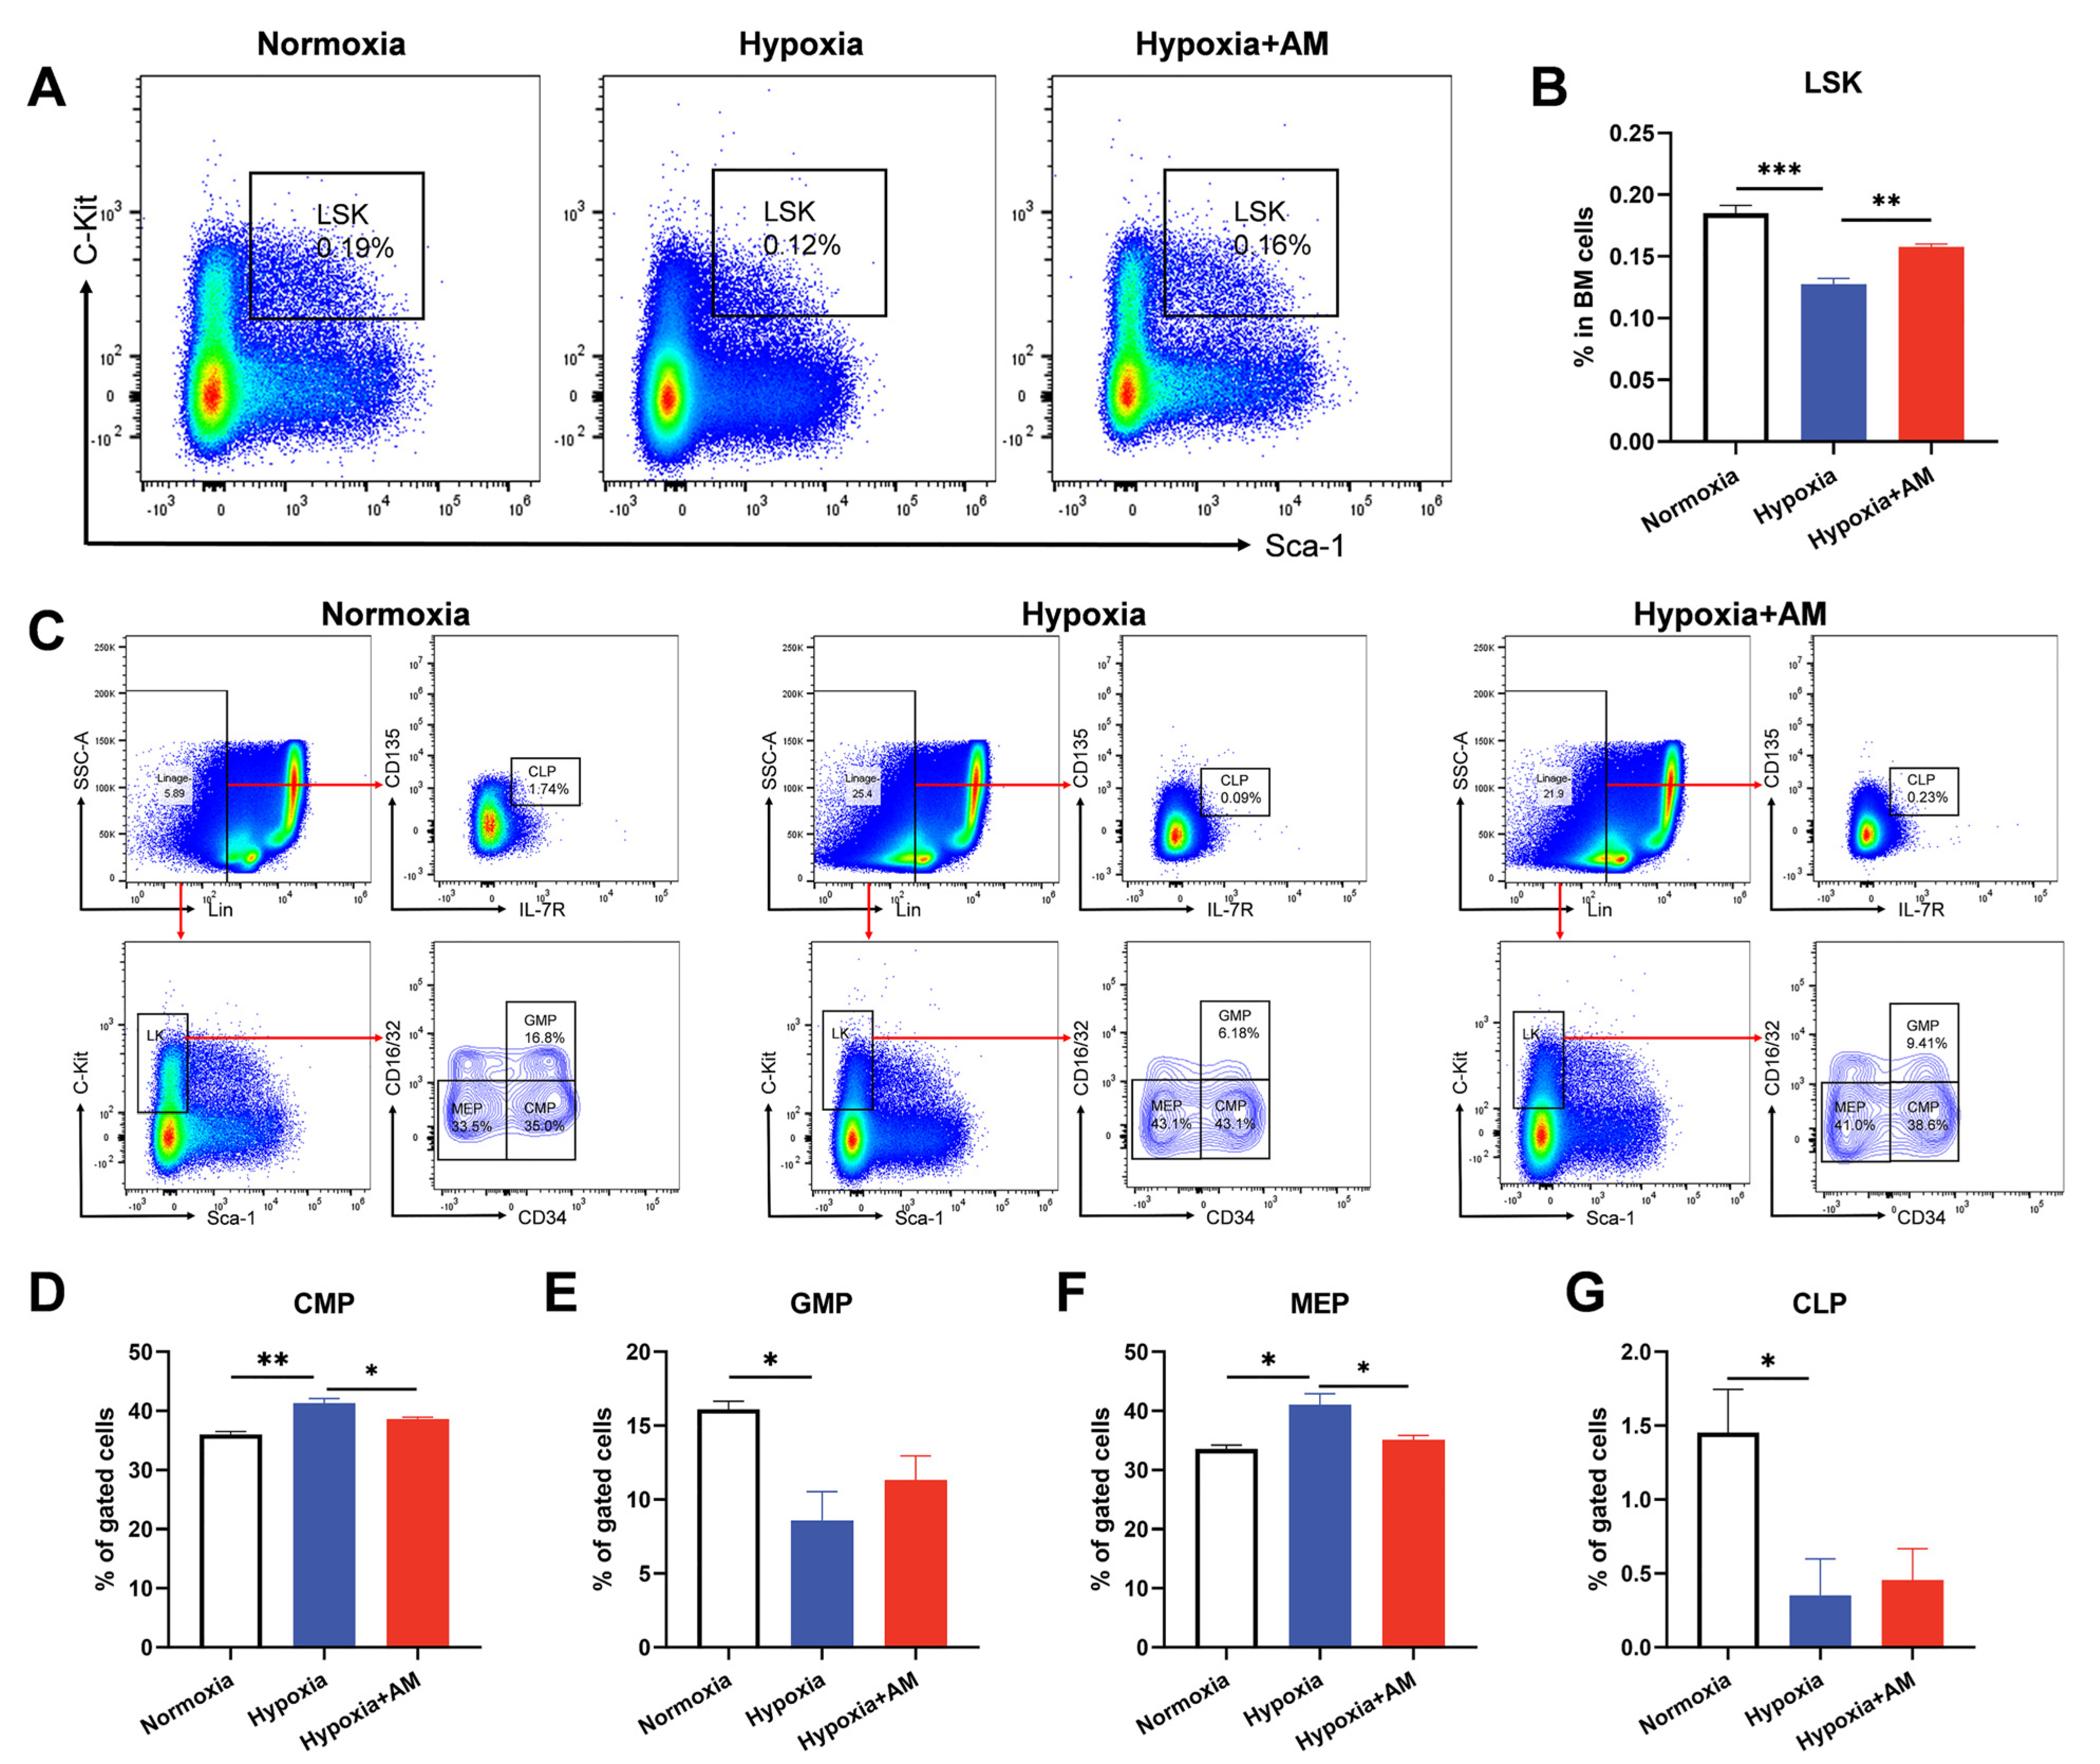
Erythrocyte originates from HSCs, which differentiate and eventually form mature erythrocytes in BM. Therefore, we examined the proportion and potential for the differentiation of HSCs. The results showed that the percentage of HSCs (defined as LinSca1+c-Kit+, LSK) in the Hypoxic group was significantly lower than that in the Normoxic group. AM therapy significantly increased the proportion of HSCs (Figure 10A,B). To investigate the influence of AM on hematopoietic differentiation, the percentages of CMP, CLP, GMP, and MEP were determined. Interestingly, compared with the Normoxic group, mice in the Hypoxic group showed higher CMP and MEP levels but lower GMP and CLP levels. AM can diminish the increase in CMP and MEP (Figure 10C–G). Overall, the AM therapy diminished the issue of erythroid overproduction caused by hypoxia.

3.10. The Effect of AM on the HIF-1 Signaling Pathway in HAPC Mice

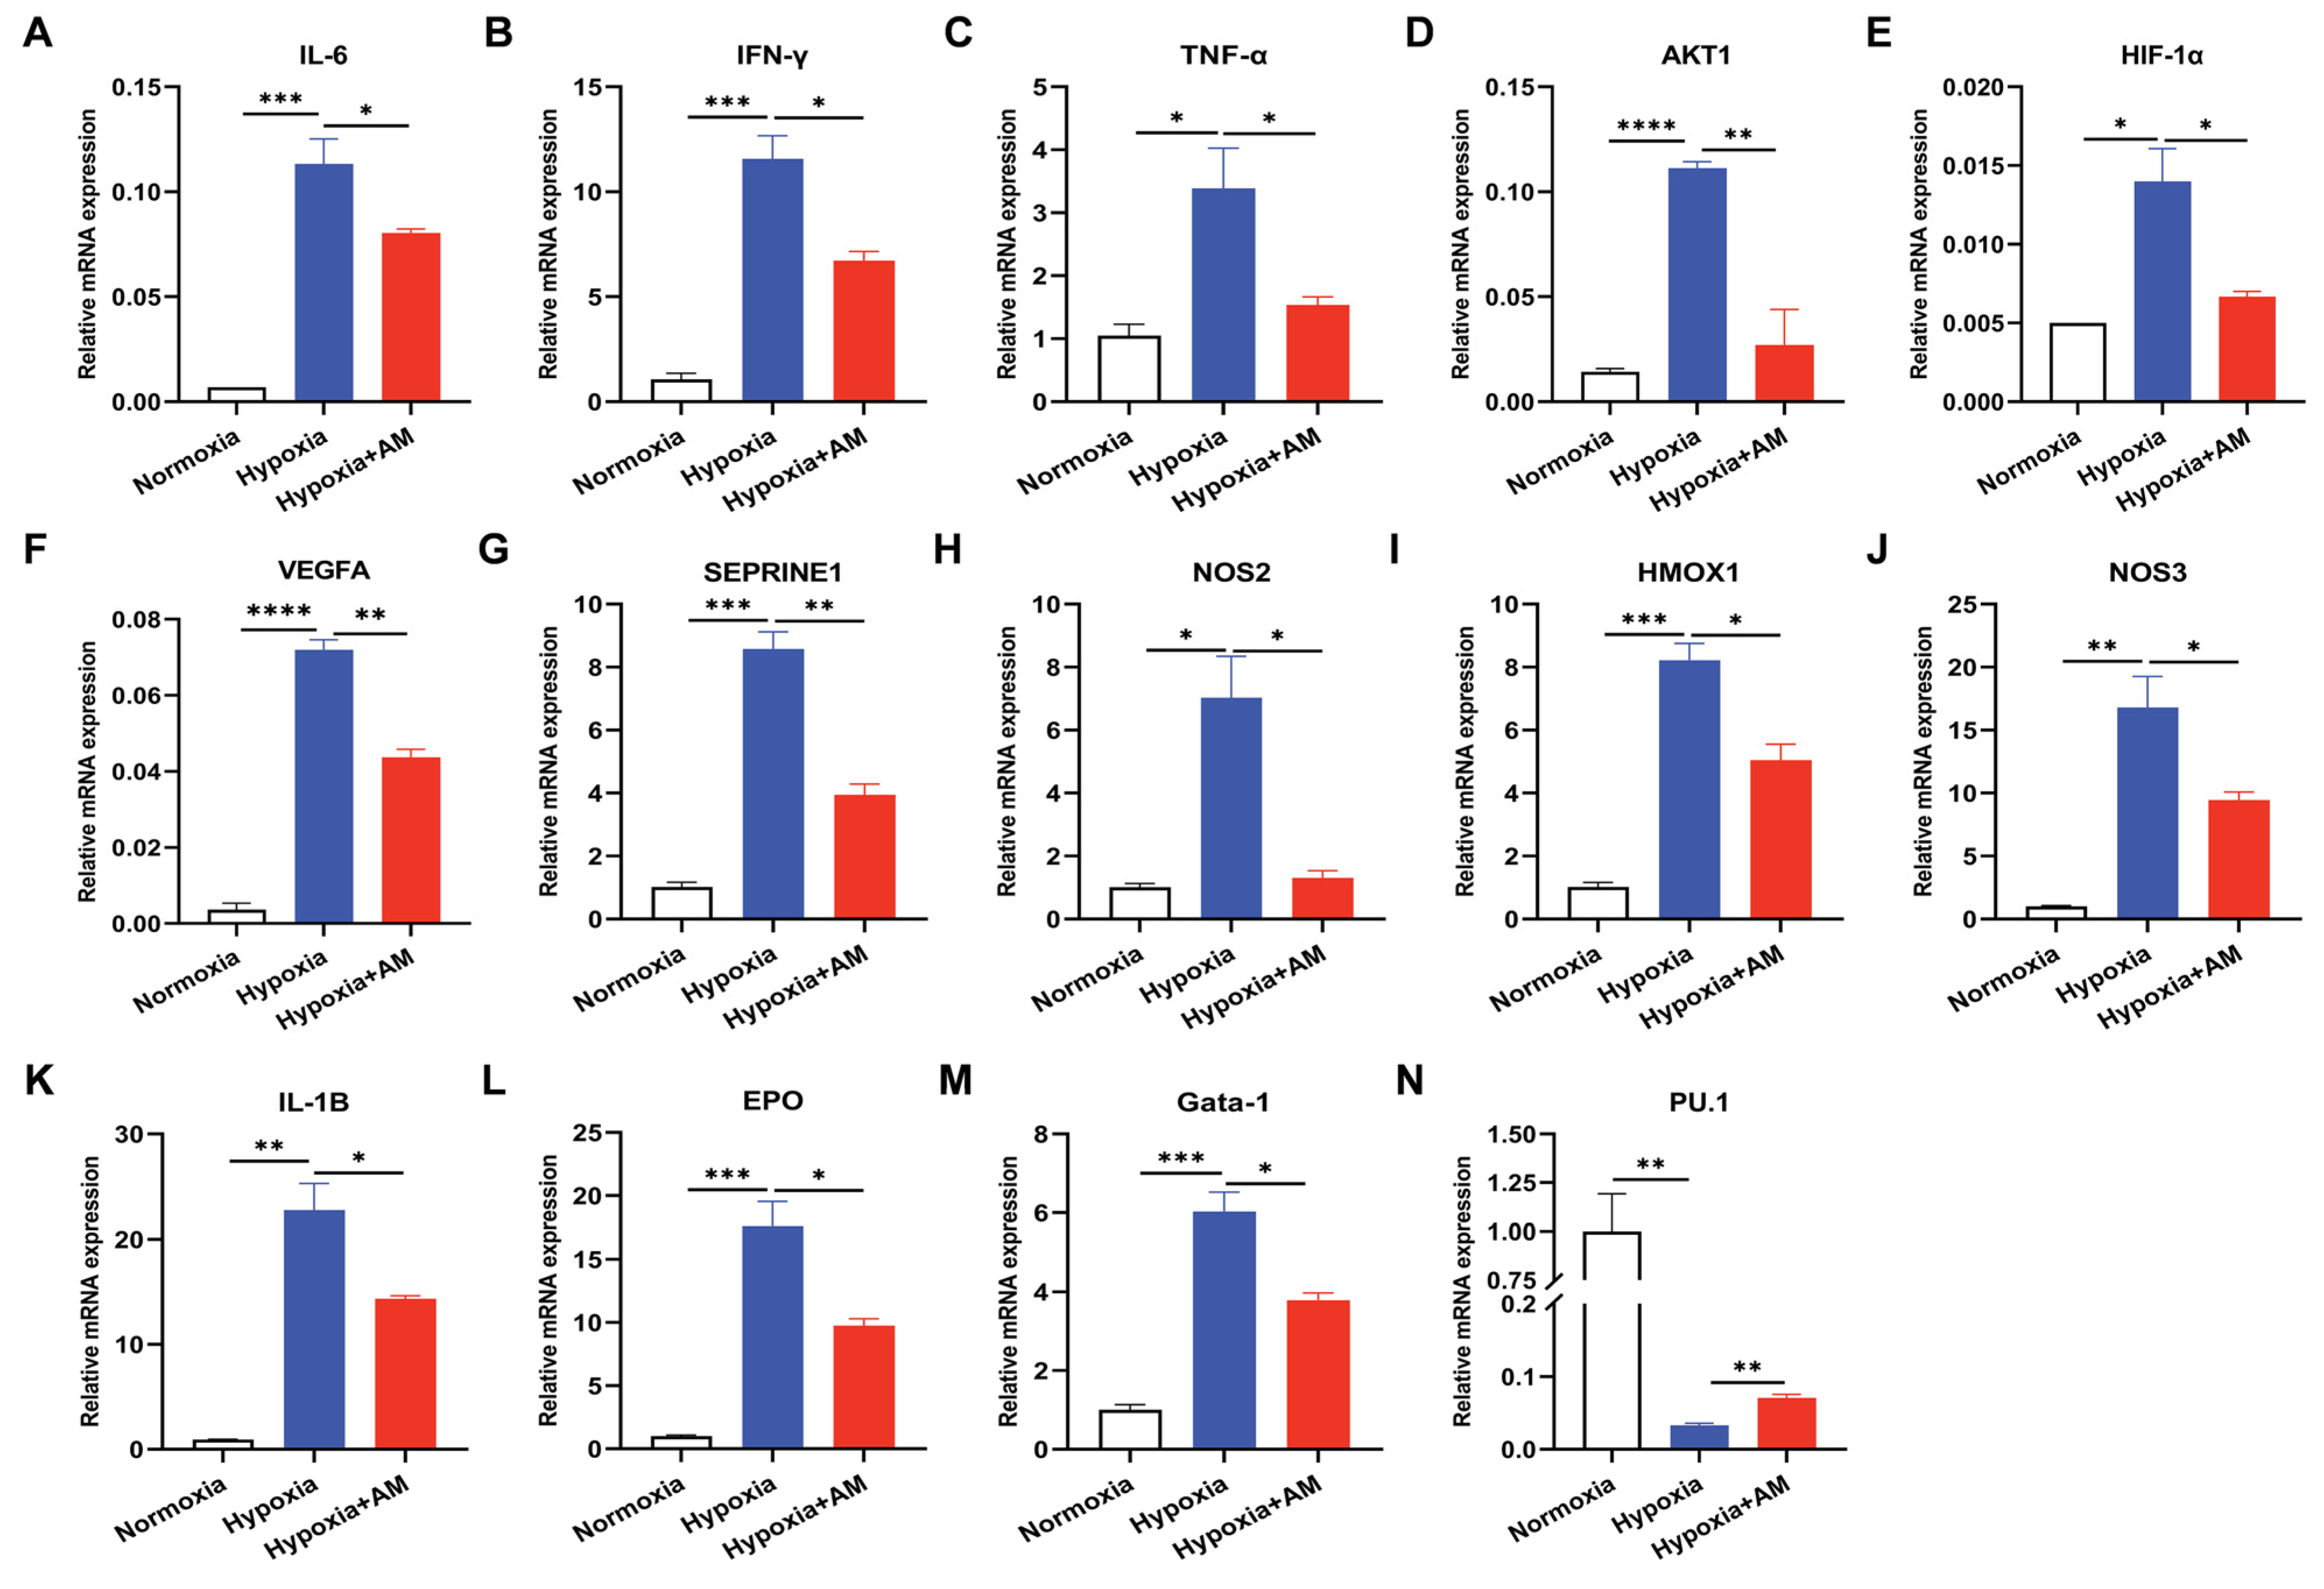
According to the outcomes of bioinformatics and molecular docking, AM may alleviate HAPC through 14 core targets. In addition, we conducted studies to confirm the levels of core target gene expression. The qRT-PCR results indicated that AM decreased the hypoxia-induced HIF-1α mRNA expression (p < 0.05). AKT-1 was a major regulator of HIF-1α [30], and AM declined AKT-1 mRNA expression (p < 0.01). As illustrated in Figure 11, HMOX1, NOS2, NOS3, EPO, VEGFA, and SERPONE1 were all downstream molecules of the HIF-1 signaling pathway. Compared to the Hypoxic group, AM lowered the expression of HMOX1 (p < 0.05), NOS2 (p < 0.05), NOS3 (p < 0.05), EPO (p < 0.05), VEGFA (p < 0.01), and SERPONE1 (p < 0.01) mRNA. In the detection of HSC transcription factors, AM increased the expression of myeloid transcription factor PU.1 (p < 0.01) and diminished the expression of lymphoid Gata-1 (p < 0.05) transcription factors (Figure 11). These results validated the network pharmacology analysis and revealed that AM can prevent the development of HAPC, in which HIF-1 is likely to play a crucial role in the signaling pathway.

4. Discussion

As a common disease of high-altitude migrants, the main clinical manifestations of HAPC are polycythemia and tissue inflammatory damage. Numerous investigations have demonstrated that inflammatory factor levels correlate closely with HAPC [17]. For example, plasma levels of IL-6 and IL-8 are elevated in the HAPC population [31]. It has been demonstrated that IL-10 and IL-22 in peripheral blood induce HAPC by altering iron metabolism (maintaining erythropoiesis) [32]. Interestingly, the proteomic analysis also revealed that the differential proteins detected in HAPC patients predominantly involved inflammatory and immune response pathways [33]. As a medication-food homologous plant, AM has anti-inflammatory, anti-oxidant, and immunomodulatory properties [17,18]. AM has been reported to reduce the release of reactive oxygen species (ROS) and decrease inflammatory responses in intestinal epithelial cells [34]. It can also ameliorate cardiomyocyte inflammatory injury through NF-κB and PI3K/AKT signaling pathways [35]. However, whether AM is a potential option for treating HAPC is unknown. In this study, we systematically investigated the effect and mechanism of AM that prevented the development of HAPC by combining network pharmacology with animal experiments.
Through a bioinformatics analysis, we discovered that AM might regulate HAPC-related targets via quercetin, kaempferol, and iso-rhamnetin as active components. As an anti-oxidant and anti-inflammatory agent, quercetin has been reported to reduce hypoxia-induced hematological changes and brain edema [36]. Interestingly, kaempferol raises ATP levels by enhancing mitochondrial complex activity under hypoxia [37]. Isorhamnet significantly inhibits HIF-1a accumulation under hypoxia [38]. However, the precise roles and interactions of these active components of AM remain unknown. It requires additional research.
Moreover, compared to other compounds, quercetin had the highest affinity with the majority of core targets (10/14) (AKT1, IL6, VEGFA, SERPINE1, NOS3, HIF1A, NOS2, IFNG, HMOX1). These core targets were mainly enriched in the HIF-1 and TNF pathways. These results revealed that AM might ameliorate HAPC by modulating HIF-1 and TNF pathways.
Quercetin, one of the most extensively studied flavonoids, has anti-inflammatory and vascular protection effects [39,40], which can reduce inflammation by inhibiting the production of NOS2 [18]. Recent research has demonstrated that the HIF-1 pathway under hypoxia can not only regulate the development of disease but also exert protective effects following injury [41]. HIF-1α, the key gene in this pathway, is an oxygen-sensitive transcription factor. Under the hypoxic condition, HIF-1α accumulates and translocates into the nucleus [42], thereby activating target genes such as EPO and VEGFA [43]. VEGFA is essential for vascular remodeling during tissue repair following inflammation or injury [44]. Hypoxia increases erythropoiesis by stimulating EPO expression at high altitudes [45]. IL-6 inflammatory factor functions as an upstream gene of the HIF-1 signaling pathway, promoting HIF-1α transcription via the JAK/STAT3 pathway, and IFN-γ can also induce HIF-1 expression [46]. AKT1 participates in the PI3K/AKT signaling pathway, and it regulates the stability of HIF-1 [47].
By assessing RBC, HGB, and HCT parameters in the peripheral blood of mice, we successfully established a mouse model of HAPC [27]. In the present study, we observed that hypoxia induction increased the expression of HIF-1α and EPO expression in bone marrow, whereas AM treatment reduced their expression. This indicates that AM can reduce RBC production by inhibiting EPO expression. Long-term exposure to hypoxic environments causes impaired vascular function [48], brain damage, lung tissue lesions, and inflammatory cell infiltration [5,6,49]. In this research, we found that AM significantly ameliorated the organ damage of mice caused by hypoxia; decreased inflammatory infiltration; and reduced the expression of inflammatory cytokines IL-1β, IL-6, TNF-α, and IFN-γ mRNA. As reported, HSCs play a crucial role in erythropoiesis during hypoxia [50]. In this study, our results showed that HSCs decreased, and MEPs increased after hypoxia, while HSCs increased, and MEPs decreased following AM administration. Furthermore, the qRT-PCR revealed that AM decreased the expression of Gata-1 mRNA while increasing the expression of PU.1 mRNA. PU.1 is an erythropoiesis suppressor that influences erythrocyte development [51], and its expression is regulated by TNF-α [52]. Gata-1 is an essential hematopoietic transcription factor that promotes erythropoiesis in BM [53]. Our findings indicated that AM reduced the development of HAPC by HIF-1α, EPO, IL-1β, IL-6, TNF-α, IFN-γ, PU.1, and Gata-1 targets, in which HIF-1 is likely to be a critical signaling pathway (Figure 12).
In this study, AM was used to conduct animal experiments and investigate its mechanism for the prevention of HAPC. AM contains additional chemical components, and interactions between these compounds are possible. The research on traditional Chinese medicine mechanisms tends to be precise. Next, we will evaluate the influence of active components of AM on the treatment of HAPC and their interaction.

5. Conclusions

This study is the first to evaluate the efficiency of AM on HAPC by combining network pharmacology and animal experiments. Here, we systematically analyzed the mechanisms of AM alleviating HAPC, which provided a theoretical basis for the prevention of HAPC.

Supplementary Materials

The following supporting information can be downloaded at: https://www.mdpi.com/article/10.3390/nu14234968/s1, Table S1. DEGs of HAPC; Table S2. GO and KEGG analysis of common targets; Table S3. GO and KEGG analysis of core targets.

Author Contributions

X.L. (Xiru Liu) and H.Z. performed experiments and wrote the article. H.Z. analyzed and visualized bioinformatics data. X.L. (Xiru Liu) and J.Y. contributed to the establishment of the HAPC model and performed some studies. X.L. (Xiang Li), J.L. and J.H. reviewed the article and provided suggestions. H.Y. and X.S. designed the idea and determined the final version. All authors have read and agreed to the published version of the manuscript.

Funding

This work was funded by the 111 Project (Grant No. BP0719007), National Natural Science Foundation of China (Grant No. 12002285), Natural Science Foundation of Shaanxi (Grant No. 2020JZ-11), and Fundamental Research Funds for the Central Universities (Grant No. D5000220026).

Institutional Review Board Statement

All animal experiments were performed in accordance with the protocol (Number: 202201168) approved by the Medical and Laboratory Animal Ethics Committee of Northwestern Polytechnical University.

Data Availability Statement

All data relevant to the study are included in the article or uploaded as online supplemental information.

Conflicts of Interest

There are no conflict of interest among the authors participating in this study.

References

  1. Tremblay, J.C.; Ainslie, P.N. Global and country-level estimates of human population at high altitude. Proc. Natl. Acad. Sci. USA 2021, 118, e2102463118. [Google Scholar] [CrossRef] [PubMed]
  2. West, J.B. Oxygen Conditioning: A New Technique for Improving Living and Working at High Altitude. Physiology 2016, 31, 216–222. [Google Scholar] [CrossRef] [PubMed] [Green Version]
  3. Yang, M.; Zhu, M.M.; Song, K.; Wuren, T.N.; Yan, J.; Ge, R.L.; Ji, L.H.; Cui, S. VHL gene methylation contributes to excessive erythrocytosis in chronic mountain sickness rat model by upregulating the HIF-2alpha/EPO pathway. Life Sci. 2021, 266, 118873. [Google Scholar] [CrossRef] [PubMed]
  4. Kasperska, A.; Zembron-Lacny, A. The effect of intermittent hypoxic exposure on erythropoietic response and hematological variables in elite athletes. Physiol. Res. 2020, 69, 283–290. [Google Scholar] [CrossRef] [PubMed]
  5. Wang, H.; Tang, C.; Dang, Z.; Yong, A.; Liu, L.; Wang, S.; Zhao, M. Clinicopathological characteristics of high-altitude polycythemia-related kidney disease in Tibetan inhabitants. Kidney Int. 2022, 102, 196–206. [Google Scholar] [CrossRef]
  6. Chen, K.; Li, N.; Fan, F.; Geng, Z.; Zhao, K.; Wang, J.; Zhang, Y.; Tang, C.; Wang, X.; Meng, X. Tibetan Medicine Duoxuekang Capsule Ameliorates High-Altitude Polycythemia Accompanied by Brain Injury. Front. Pharmacol. 2021, 12, 680636. [Google Scholar] [CrossRef]
  7. Gao, X.; Zhang, Z.; Li, X.; Li, C.; Hao, J.; Luo, Y.; Lei, M.; Li, J.; Liu, C.; He, K. Macitentan Attenuates Chronic Mountain Sickness in Rats by Regulating Arginine and Purine Metabolism. J. Proteome Res. 2020, 19, 3302–3314. [Google Scholar] [CrossRef]
  8. Liu, P.; Zou, D.; Yi, L.; Chen, M.L.; Gao, Y.X.; Zhou, R.; Zhang, Q.Y.; Zhou, Y.; Zhu, J.D.; Chen, K.; et al. Quercetin ameliorates hypobaric hypoxia-induced memory impairment through mitochondrial and neuron function adaptation via the PGC-1alpha pathway. Restor. Neurol. Neurosci. 2015, 33, 143–157. [Google Scholar]
  9. Bao, H.H.; Li, R.Y.; He, M.L.; Kang, D.J.; Zhao, L.L. DTI Study on Brain Structure and Cognitive Function in Patients with Chronic Mountain Sickness. Sci. Rep. 2019, 9, 19334. [Google Scholar] [CrossRef] [Green Version]
  10. Lu, H.; Zhang, H.Q.; Jiang, Y.Y. Methazolamide in high-altitude illnesses. Eur. J. Pharm. Sci. 2020, 148, 105326. [Google Scholar] [CrossRef]
  11. Xie, H.; Xu, G.; Aa, J.; Gu, S.; Gao, Y. Modulation of Perturbed Cardiac Metabolism in Rats Under High-Altitude Hypoxia by Combination Treatment With L-carnitine and Trimetazidine. Front. Physiol. 2021, 12, 671161. [Google Scholar] [CrossRef]
  12. Rivera-Ch, M.; Leon-Velarde, F.; Huicho, L. Treatment of chronic mountain sickness: Critical reappraisal of an old problem. Respir. Physiol. Neurobiol. 2007, 158, 251–265. [Google Scholar] [CrossRef]
  13. Jiang, S.; Jiao, G.; Chen, Y.; Han, M.; Wang, X.; Liu, W. Astragaloside IV attenuates chronic intermittent hypoxia-induced myocardial injury by modulating Ca2+ homeostasis. Cell Biochem. Funct. 2020, 38, 710–720. [Google Scholar] [CrossRef]
  14. Zheng, K.Y.; Choi, R.C.; Xie, H.Q.; Cheung, A.W.; Guo, A.J.; Leung, K.W.; Chen, V.P.; Bi, C.W.; Zhu, K.Y.; Chan, G.K.; et al. The expression of erythropoietin triggered by danggui buxue tang, a Chinese herbal decoction prepared from radix Astragali and radix Angelicae Sinensis, is mediated by the hypoxia-inducible factor in cultured HEK293T cells. J. Ethnopharmacol. 2010, 132, 259–267. [Google Scholar] [CrossRef]
  15. Chen, J.K.; Guo, M.K.; Bai, X.H.; Chen, L.Q.; Su, S.M.; Li, L.; Li, J.Q. Astragaloside IV ameliorates intermittent hypoxia-induced inflammatory dysfunction by suppressing MAPK/NF-kappaB signalling pathways in Beas-2B cells. Sleep Breath. 2020, 24, 1237–1245. [Google Scholar] [CrossRef]
  16. Fu, J.; Wang, Z.H.; Huang, L.F.; Zheng, S.H.; Wang, D.M.; Chen, S.L.; Zhang, H.T.; Yang, S.H. Review of the botanical characteristics, phytochemistry, and pharmacology of Astragalus membranaceus (Huangqi). Phytother. Res. 2014, 28, 1275–1283. [Google Scholar] [CrossRef]
  17. Zheng, Y.J.; Ren, W.Y.; Zhang, L.N.; Zhang, Y.M.; Liu, D.L.; Liu, Y.Q. A Review of the Pharmacological Action of Astragalus Polysaccharide. Front. Pharmacol. 2020, 11, 349. [Google Scholar] [CrossRef] [Green Version]
  18. Auyeung, K.K.; Han, Q.B.; Ko, J.K. Astragalus membranaceus: A Review of Its Protection Against Inflammation and Gastrointestinal Cancers. Am. J. Chin. Med. 2016, 44, 1–22. [Google Scholar] [CrossRef]
  19. Li, M.; Han, B.; Zhao, H.; Xu, C.Y.; Xu, D.K.; Sieniawska, E.; Lin, X.M.; Kai, G.Y. Biological active ingredients of Astragali Radix and its mechanisms in treating cardiovascular and cerebrovascular diseases. Phytomedicine 2022, 98, 153918. [Google Scholar] [CrossRef]
  20. Li, C.; Zhu, H.; Zhang, S.; Meng, F.; Li, S.; Li, G.; Zha, J.; Wu, S.; Zhu, L.; Dai, A. Astragaloside IV ameliorates pulmonary vascular remodeling in hypoxia-induced pulmonary hypertension by restraining the T follicular helper cell response and expanding T follicular regulatory cell response. Phytomedicine 2022, 102, 154171. [Google Scholar] [CrossRef]
  21. Zhao, F.; Meng, Y.; Wang, Y.; Fan, S.; Liu, Y.; Zhang, X.; Ran, C.; Wang, H.; Lu, M. Protective effect of Astragaloside IV on chronic intermittent hypoxia-induced vascular endothelial dysfunction through the calpain-1/SIRT1/AMPK signaling pathway. Front. Pharmacol. 2022, 13, 920977. [Google Scholar] [CrossRef] [PubMed]
  22. Du, X.; Liu, T.L.; Tao, W.D.; Li, M.X.; Li, X.L.; Yan, L. Effect of aqueous extract of Astragalus membranaceus on behavioral cognition of rats living at high altitude. J. Tradit. Chin. Med. 2022, 42, 58–64. [Google Scholar] [PubMed]
  23. Yoo, S.; Kim, K.; Nam, H.; Lee, D. Discovering Health Benefits of Phytochemicals with Integrated Analysis of the Molecular Network, Chemical Properties and Ethnopharmacological Evidence. Nutrients 2018, 10, 1042. [Google Scholar] [CrossRef] [PubMed] [Green Version]
  24. Wang, L.; Zheng, W.; Yang, J.; Ali, A.; Qin, H. Mechanism of Astragalus membranaceus Alleviating Acquired Hyperlipidemia Induced by High-Fat Diet through Regulating Lipid Metabolism. Nutrients 2022, 14, 954. [Google Scholar] [CrossRef] [PubMed]
  25. Ru, J.L.; Li, P.; Wang, J.A.; Zhou, W.; Li, B.H.; Huang, C.; Li, P.D.; Guo, Z.H.; Tao, W.Y.; Yang, Y.F.; et al. TCMSP: A database of systems pharmacology for drug discovery from herbal medicines. J. Cheminform. 2014, 6, 13. [Google Scholar] [CrossRef] [Green Version]
  26. Hou, F.F.; Yu, Z.Y.; Cheng, Y.; Liu, Y.; Liang, S.; Zhang, F. Deciphering the pharmacological mechanisms of Scutellaria baicalensis Georgi on oral leukoplakia by combining network pharmacology, molecular docking and experimental evaluations. Phytomedicine 2022, 103, 154195. [Google Scholar] [CrossRef]
  27. Li, P.B.; Nie, H.J.; Liu, W.; Deng, B.N.; Zhu, H.L.; Duan, R.F.; Chen, Z.L.; Wang, H. A rat model of high altitude polycythemia rapidly established by hypobaric hypoxia exposure. Zhongguo Ying Yong Sheng Li Xue Za Zhi 2014, 30, 526–531. [Google Scholar]
  28. Liu, Y.; Liu, F.; Yang, Y.; Li, D.; Lv, J.; Ou, Y.; Sun, F.; Chen, J.; Shi, Y.; Xia, P. Astragalus polysaccharide ameliorates ionizing radiation-induced oxidative stress in mice. Int. J. Biol. Macromol. 2014, 68, 209–214. [Google Scholar] [CrossRef]
  29. Pinzi, L.; Rastelli, G. Molecular Docking: Shifting Paradigms in Drug Discovery. Int. J. Mol. Sci. 2019, 20, 4331. [Google Scholar] [CrossRef] [Green Version]
  30. Wang, R.R.; Yuan, T.Y.; Chen, D.; Chen, Y.C.; Sun, S.C.; Wang, S.B.; Kong, L.L.; Fang, L.H.; Du, G.H. Dan-Shen-Yin Granules Prevent Hypoxia-Induced Pulmonary Hypertension via STAT3/HIF-1alpha/VEGF and FAK/AKT Signaling Pathways. Front. Pharmacol. 2022, 13, 844400. [Google Scholar] [CrossRef]
  31. Brewster, L.M.; Bain, A.R.; Garcia, V.P.; Fandl, H.K.; Stone, R.; DeSouza, N.M.; Greiner, J.J.; Tymko, M.M.; Vizcardo-Galindo, G.A.; Figueroa-Mujica, R.J.; et al. Global REACH 2018: Dysfunctional extracellular microvesicles in Andean highlander males with excessive erythrocytosis. Am. J. Physiol. Heart Circ Physiol. 2021, 320, H1851–H1861. [Google Scholar] [CrossRef]
  32. Liu, Y.S.; Huang, H.; Zhou, S.M.; Tian, H.J.; Li, P. Excessive Iron Availability Caused by Disorders of Interleukin-10 and Interleukin-22 Contributes to High Altitude Polycythemia. Front. Physiol. 2018, 9, 548. [Google Scholar] [CrossRef]
  33. Wang, Z.K.; Liu, F.J.; Ye, S.L.; Jiang, P.; Yu, X.C.; Xu, J.; Du, X.; Ma, L.; Cao, H.J.; Yuan, C.; et al. Plasma proteome profiling of high-altitude polycythemia using TMT-based quantitative proteomics approach. J. Proteom. 2019, 194, 60–69. [Google Scholar] [CrossRef]
  34. Adesso, S.; Russo, R.; Quaroni, A.; Autore, G.; Marzocco, S. Astragalus membranaceus Extract Attenuates Inflammation and Oxidative Stress in Intestinal Epithelial Cells via NF-kappaB Activation and Nrf2 Response. Int. J. Mol. Sci. 2018, 19, 800. [Google Scholar] [CrossRef] [Green Version]
  35. Liu, T.L.; Zhang, M.J.; Niu, H.Y.; Liu, J.; Ruilian, M.A.; Wang, Y.; Xiao, Y.F.; Xiao, Z.B.; Sun, J.J.; Dong, Y.; et al. Astragalus polysaccharide from Astragalus Melittin ameliorates inflammation via suppressing the activation of TLR-4/NF-kappaB p65 signal pathway and protects mice from CVB3-induced virus myocarditis. Int. J. Biol. Macromol. 2019, 126, 179–186. [Google Scholar] [CrossRef]
  36. Patir, H.; Sarada, S.K.; Singh, S.; Mathew, T.; Singh, B.; Bansal, A. Quercetin as a prophylactic measure against high altitude cerebral edema. Free Radic. Biol. Med. 2012, 53, 659–668. [Google Scholar] [CrossRef]
  37. Akiyama, M.; Mizokami, T.; Miyamoto, S.; Ikeda, Y. Kaempferol increases intracellular ATP content in C2C12 myotubes under hypoxic conditions by suppressing the HIF-1alpha stabilization and/or by enhancing the mitochondrial complex IV activity. J. Nutr. Biochem. 2022, 103, 108949. [Google Scholar] [CrossRef]
  38. Seo, S.; Seo, K.; Ki, S.H.; Shin, S.M. Isorhamnetin Inhibits Reactive Oxygen Species-Dependent Hypoxia Inducible Factor (HIF)-1alpha Accumulation. Biol. Pharm. Bull. 2016, 39, 1830–1838. [Google Scholar] [CrossRef] [Green Version]
  39. Hermankova, E.; Zatloukalova, M.; Biler, M.; Sokolova, R.; Bancirova, M.; Tzakos, A.G.; Kren, V.; Kuzma, M.; Trouillas, P.; Vacek, J. Redox properties of individual quercetin moieties. Free Radic. Biol. Med. 2019, 143, 240–251. [Google Scholar] [CrossRef]
  40. Cruz-Zuniga, J.M.; Soto-Valdez, H.; Peralta, E.; Mendoza-Wilson, A.M.; Robles-Burgueno, M.R.; Auras, R.; Gamez-Meza, N. Development of an antioxidant biomaterial by promoting the deglycosylation of rutin to isoquercetin and quercetin. Food Chem. 2016, 204, 420–426. [Google Scholar] [CrossRef]
  41. Corrado, C.; Fontana, S. Hypoxia and HIF Signaling: One Axis with Divergent Effects. Int. J. Mol. Sci. 2020, 21, 5611. [Google Scholar] [CrossRef] [PubMed]
  42. Gossage, L.; Eisen, T.; Maher, E.R. VHL, the story of a tumour suppressor gene. Nat. Rev. Cancer 2015, 15, 55–64. [Google Scholar] [CrossRef] [PubMed]
  43. Ong, S.G.; Hausenloy, D.J. Hypoxia-inducible factor as a therapeutic target for cardioprotection. Pharmacol. Ther. 2012, 136, 69–81. [Google Scholar] [CrossRef] [PubMed]
  44. Wu, W.K.; Llewellyn, O.P.; Bates, D.O.; Nicholson, L.B.; Dick, A.D. IL-10 regulation of macrophage VEGF production is dependent on macrophage polarisation and hypoxia. Immunobiology 2010, 215, 796–803. [Google Scholar] [CrossRef] [PubMed]
  45. Jelkmann, W. Erythropoietin. J. Endocrinol. Investig. 2003, 26, 832–837. [Google Scholar] [CrossRef]
  46. Takeda, N.; O’Dea, E.L.; Doedens, A.; Kim, J.W.; Weidemann, A.; Stockmann, C.; Asagiri, M.; Simon, M.C.; Hoffmann, A.; Johnson, R.S. Differential activation and antagonistic function of HIF-{alpha}cc isoforms in macrophages are essential for NO homeostasis. Genes Dev. 2010, 24, 491–501. [Google Scholar] [CrossRef] [Green Version]
  47. LaGory, E.L.; Giaccia, A.J. The ever-expanding role of HIF in tumour and stromal biology. Nat. Cell Biol. 2016, 18, 356–365. [Google Scholar] [CrossRef] [Green Version]
  48. Tymko, M.M.; Lawley, J.S.; Ainslie, P.N.; Hansen, A.B.; Hofstaetter, F.; Rainer, S.; Amin, S.; Moralez, G.; Gasho, C.; Vizcardo-Galindo, G.; et al. Global Reach 2018 Heightened Alpha-Adrenergic Signaling Impairs Endothelial Function during Chronic Exposure to Hypobaric Hypoxia. Circ. Res. 2020, 127, e1–e13. [Google Scholar] [CrossRef]
  49. Salama, S.A.; Omar, H.A.; Maghrabi, I.A.; AlSaeed, M.S.; El-Tarras, A.E. Iron supplementation at high altitudes induces inflammation and oxidative injury to lung tissues in rats. Toxicol. Appl. Pharmacol. 2014, 274, 1–6. [Google Scholar] [CrossRef]
  50. Li, P.; Huang, J.; Tian, H.J.; Huang, Q.Y.; Jiang, C.H.; Gao, Y.Q. Regulation of bone marrow hematopoietic stem cell is involved in high-altitude erythrocytosis. Exp. Hematol. 2011, 39, 37–46. [Google Scholar] [CrossRef]
  51. Willcockson, M.A.; Taylor, S.J.; Ghosh, S.; Healton, S.E.; Wheat, J.C.; Wilson, T.J.; Steidl, U.; Skoultchi, A.I. Runx1 promotes murine erythroid progenitor proliferation and inhibits differentiation by preventing Pu.1 downregulation. Proc. Natl. Acad. Sci. USA 2019, 116, 17841–17847. [Google Scholar] [CrossRef] [Green Version]
  52. Grigorakaki, C.; Morceau, F.; Chateauvieux, S.; Dicato, M.; Diederich, M. Tumor necrosis factor alpha-mediated inhibition of erythropoiesis involves GATA-1/GATA-2 balance impairment and PU.1 over-expression. Biochem. Pharmacol. 2011, 82, 156–166. [Google Scholar] [CrossRef]
  53. Love, P.E.; Warzecha, C.; Li, L.Q. Ldb1 complexes: The new master regulators of erythroid gene transcription. Trends Genet. 2014, 30, 1–9. [Google Scholar] [CrossRef]
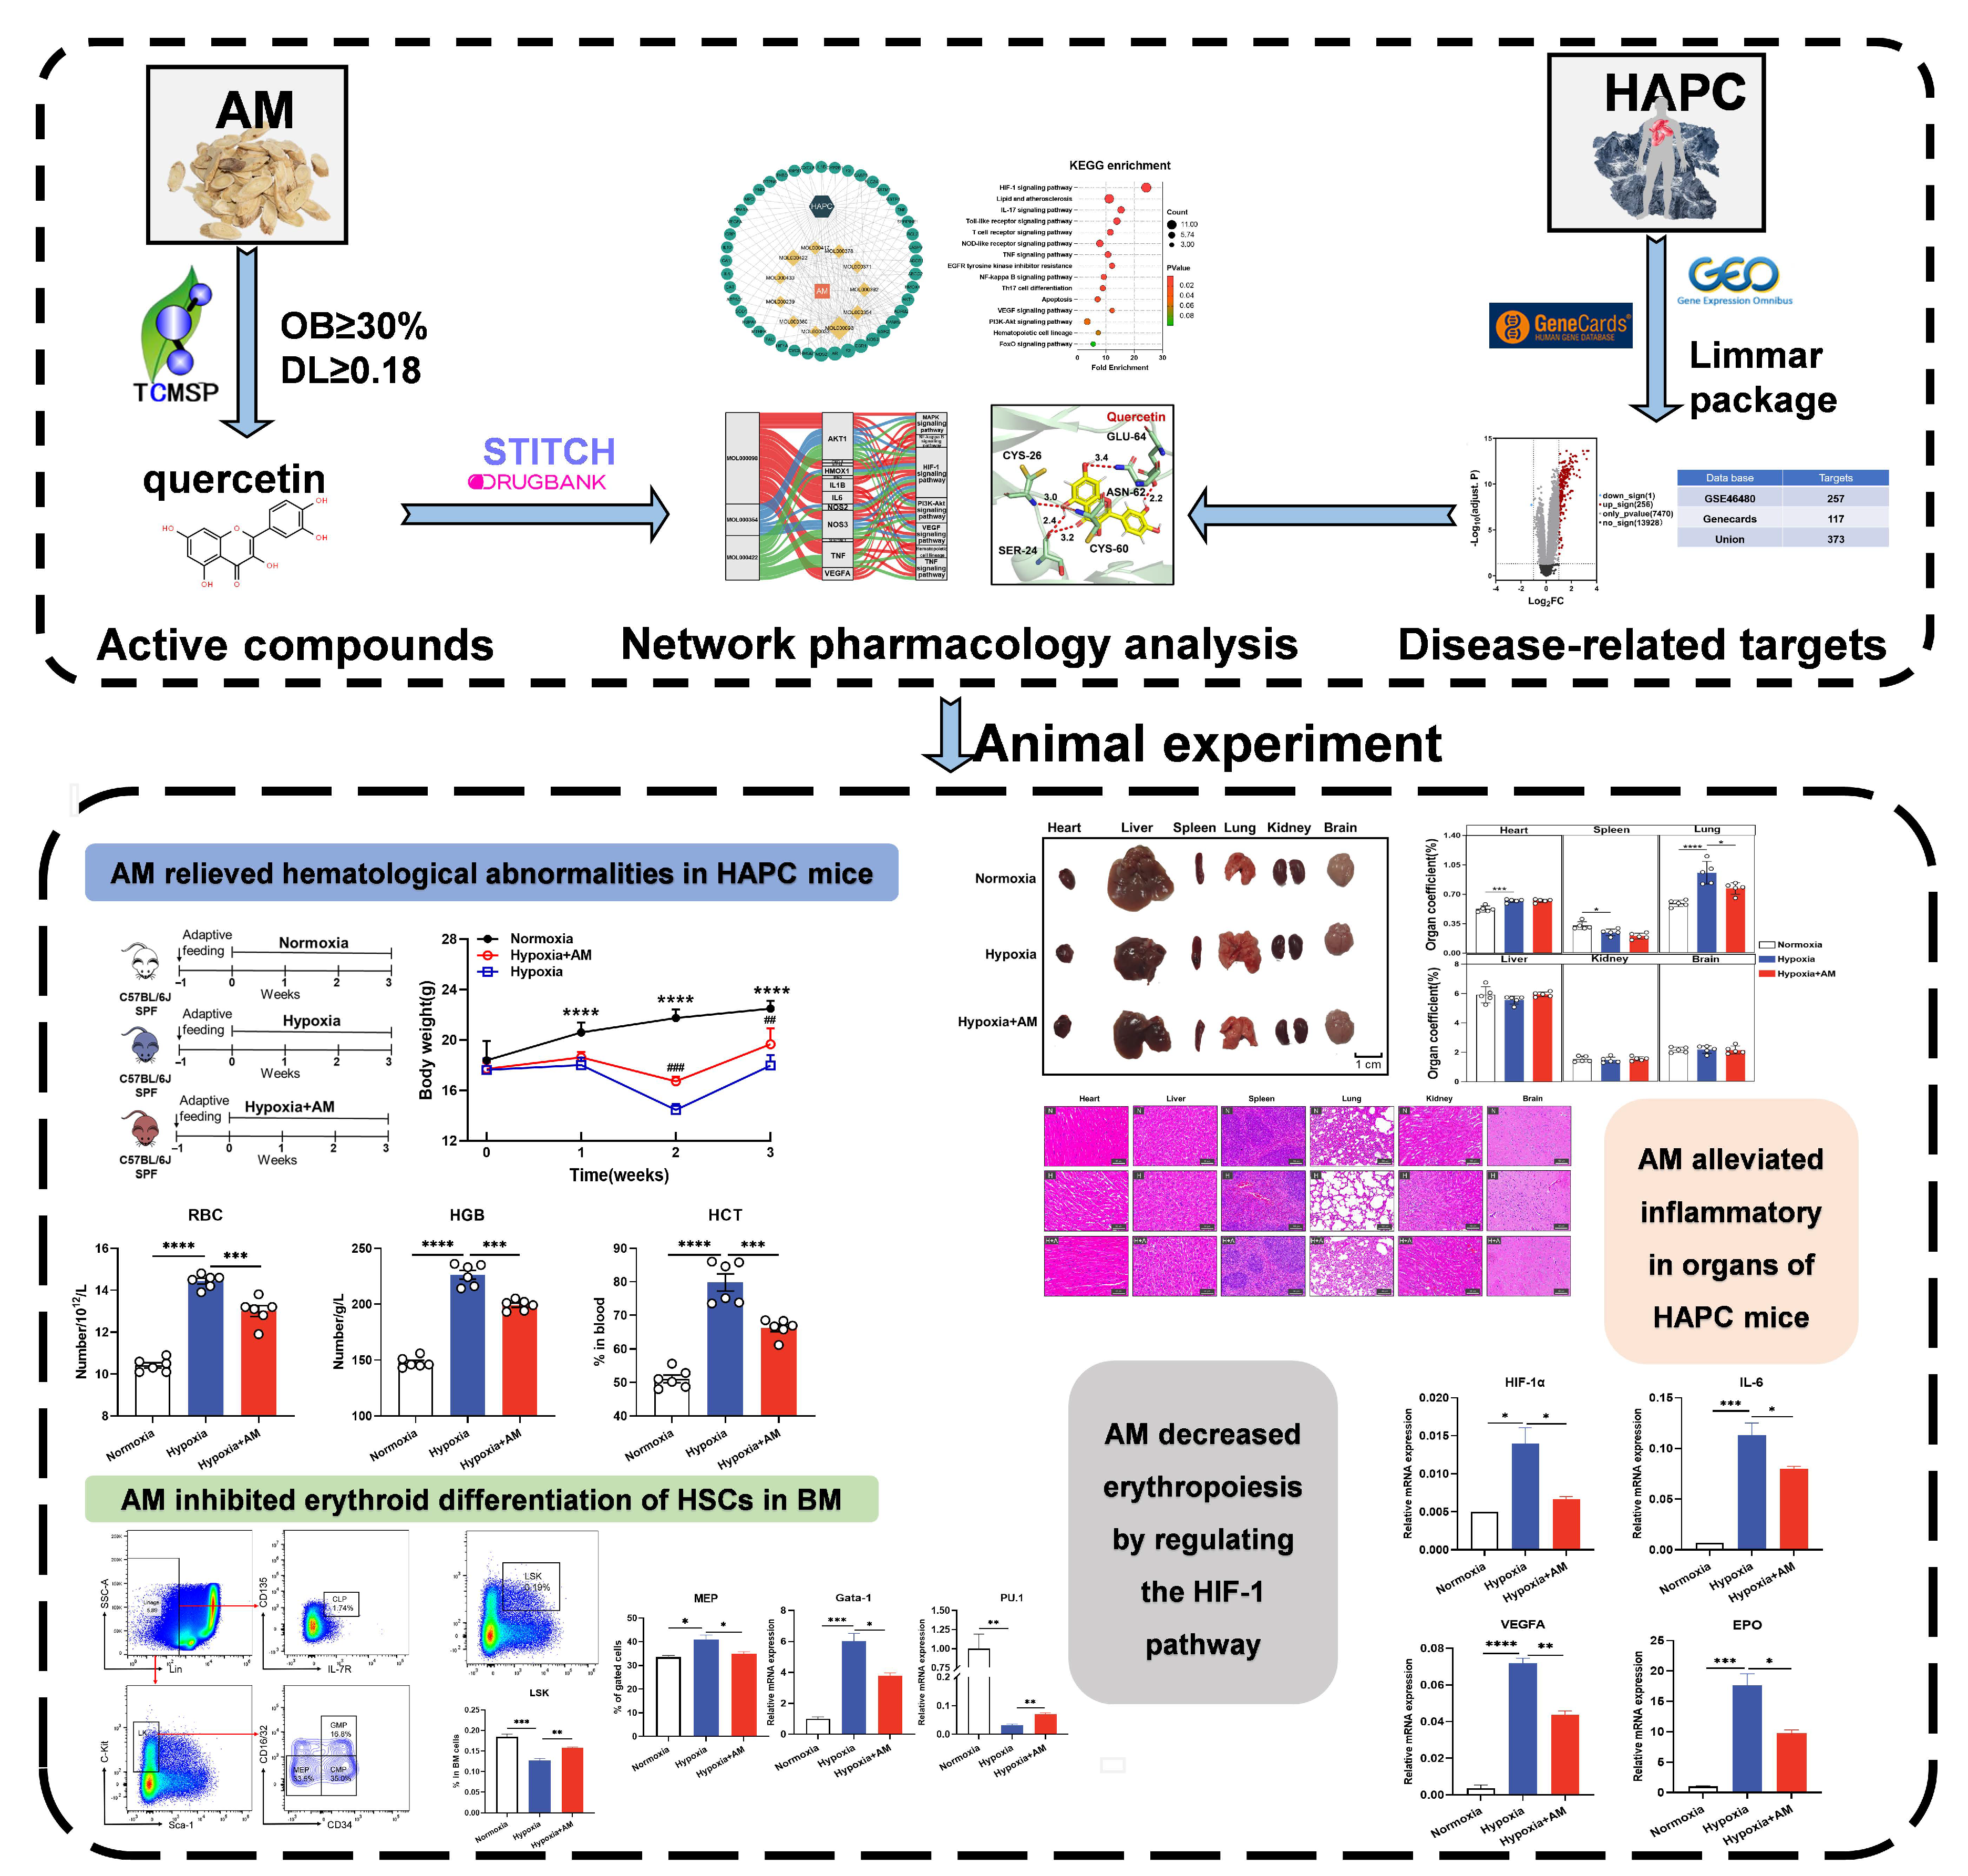
Figure 1. The workflow of this research. * p < 0.05, ** p < 0.01, *** p < 0.001, **** p < 0.0001; Normoxia vs. Hypoxia. ## p < 0.01, ### p < 0.001; Hypoxia + AM vs. Hypoxia.
Nutrients 14 04968 g001
Figure 2. Construction of drug-compound-target network. The orange squares, yellow diamonds, and green dots represent the drug, the ingredient, and the target, respectively. AM: Astragalus membranaceus. The MOL ID of a compound was abbreviated to the last three digits.
Nutrients 14 04968 g002
Figure 3. Screening for HAPC-related targets. (A) PCA analysis of gene expression in volunteers from the GSE46480 dataset. (BC) Volcano plot (B) and clustered heat map of DEGs (C) from volunteers in the plateau environment compared to baseline. (D) The union of HAPC targets from different databases.
Nutrients 14 04968 g003
Figure 4. Identified common targets of AM for the treatment of HAPC. (A) Venn diagram showed the common targets of AM and HAPC. (B) Drug-component-target-disease network. The orange squares, yellow diamonds, green dots, and dark green hexagons represent the drug, component, target, and disease. AM: Astragalus membranaceus; HAPC: high altitude polycythemia.
Nutrients 14 04968 g004
Figure 5. Obtained core targets of AM towards HAPC. (A) PPI network of drug–disease intersection targets. The minimum required interaction score was set to 0.7 by the STRING database. (B) Visualization of the PPI network by Cytoscape. No-edge nodes have been removed. (C) Top 15 targets in the PPI network ranked by degree. (D) Venn diagram showed the core targets. Targets meeting BC ≥ 10.95 (median), CC ≥ 0.145 (median), and DC ≥ 7 (median) were screened.
Nutrients 14 04968 g005
Figure 6. Pathway enrichment analysis. (A,B) Enrichment analysis of GO (A) and KEGG (B) pathways for common targets. (C) GO-BP and KEGG pathway enrichment analysis of core targets. (D) Component-core-target-pathway of Sankey diagram.
Nutrients 14 04968 g006
Figure 7. Molecular docking of core targets with active components. (AJ) Molecular docking pattern of quercetin with HIF1A (A), VEGFA (B), AKT1 (C), TNF (D), IL6 (E), IFNG (F), IL1B (G), HMOX1 (H), CXCL8 (I), and CRP (J). (L,M) Molecular docking pattern diagram of folsaeure with NOS3 (L) and SERPINE (M). (K,N) Molecular docking pattern of calycosin with NOS2 (K) and ESR1 (N). The 3D structures of core targets were from the PDB database with the corresponding PDB ID listed in parentheses after the target name. Molecules were anchored into the active pocket by binding to amino acid residues of the core target. Intermolecular hydrogen bonds were displayed as red dashed lines with bond lengths annotated next to them in angstroms.
Nutrients 14 04968 g007
Figure 8. AM relieved hematological abnormalities in HAPC mice. (A) The design of animal experiments. Animals were kept in a low-pressure hypoxic chamber for 3 weeks to establish a HAPC model and the Normoxic animals as controls. One group of model animals was supplemented with AM by gavage to assess its effect on HAPC. (B) The changes of body weight in mice after 3 weeks of different treatments. n = 6. **** p < 0.0001; Normoxia vs. Hypoxia. ## p < 0.01, ### p < 0.001; Hypoxia + AM vs. Hypoxia. (CH) The analysis of peripheral blood from mice in different groups. RBC, red blood cell; HGB, hemoglobin concentration; HCT, hematocrit; WBC, white blood cells; PLT, platelets; NEUT, neutrophils. n = 6. * p < 0.05, ** p < 0.01, *** p < 0.001, **** p < 0.0001. Compared with the Hypoxic group.
Nutrients 14 04968 g008
Figure 9. AM alleviated inflammatory in organs of HAPC mice. (AC) Organ samples from mice 3 weeks after various treatments (A), organ indices (B), and organ H&E staining (C). N, normoxia; H, hypoxia; H + Q, hypoxia + AM. 20× (scale bar = 100 μm), 40× (scale bar = 50 μm). n = 5. * p < 0.05; *** p < 0.001; **** p < 0.0001. Compared with the Hypoxic group.
Nutrients 14 04968 g009
Figure 10. AM inhibited erythroid differentiation of HSCs in BM. (A,B) Flow cytometry determined the percentage of HSCs in BM from mice with different treatment. (CG) Percentage of CMP, GMP, MEP, and CLP by flow cytometry in BM of each group. CMP, common myeloid progenitor; GMP, granulocyte/monocyte progenitor; MEP, megakaryocyte/erythrocyte progenitor; CLP, common lymphoid progenitor. n = 4. * p < 0.05; ** p < 0.01; *** p < 0.001. Compared with the Hypoxic group.
Nutrients 14 04968 g010
Figure 11. AM decreased erythropoiesis by regulating the HIF-1 pathway. (AN) qRT-PCR was used to assess the differential expression of IL-6 (A), IFN-γ (B), TNF-α (C), AKT1 (D), HIF-1α (E), VEGFA (F), SEPRINE1 (G), NOS2 (H), HMOX1 (I), NOS3 (J), IL-1B (K), EPO (L), Gata-1 (M), and PU.1 (N) mRNA in BM from various groups. n = 4. * p < 0.05; ** p < 0.01; *** p < 0.001; **** p < 0.0001. Compared with the Hypoxic group.
Nutrients 14 04968 g011
Figure 12. The mechanisms of HAPC alleviation by AM in hypoxia. The regulation of genes by AM is represented by blue arrows, and the regulation of cells by AM is shown by orange arrows, with upregulation denoted by an up arrow and downregulation by a down arrow. Compared with the Hypoxic group.
Nutrients 14 04968 g012
Table 1. The primer sequences of qRT-PCR.
Target GenePrimer Sequence
β-actinForward 5′-GCTGTATTCCCCTCCATCGTG-3′
Reverse 5′-CACGGTTGGCCTTAGGGTTCAG-3′
VEGFAForward 5′-ATCGAGTACATCTTCAAGCCAT-3′
Reverse 5′-GTGAGGTTTGATCCGCATAATC-3′
HIF-1αForward 5′-TGACGGCGACAGGGTTTACA-3′
Reverse 5′-AATATGGCCCGTGCAGTGAA-3′
TNF-αForward 5′-ATGTCTCAGCCTCTTCTCATTC-3′
Reverse 5′-GCTTGTCACTCGAATTTTGAGA-3′
IL-6Forward 5′-TAGTCCTTCCTACCCCAATTTCC-3′
Reverse 5′-TTGGTCCTTAGCCACTCCTTC-3′
IL-1BForward 5′-CACTACAGGCTCCGAGATGAACAAC-3′
Reverse 5′-TGTCGTTGCTTGGTTCTCCTTGTAC-3′
Gata-1Forward 5′-GTCCTCACCATCAGATTCCACAG-3′
Reverse 5′-GAGTGCCGTCTTGCCATAGG-3′
PU.1Forward 5′-AGGAGTCTTCTACGACCTGGA-3′
Reverse 5′-GAAGGCTTCATAGGGAGCGAT-3′
IFN-γForward 5′-GCCACGGCACAGTCATTGA-3′
Reverse 5′-TGCTGATGGCCTGATTGTCTT-3′
AKT1Forward 5′-GCCCTCAAGTACTCATTCCAG-3′
Reverse 5′-ACACAATCTCCGCACCATAG-3′
SEPRINE1Forward 5′-GGAATAAGGCGAGTTGGAAGAA-3′
Reverse 5′ GGCCGTTCGATAATCGGTCTAT-3′
NOS2Forward 5′-GGAGTGACGGCAAACATGACT-3′
Reverse 5′-TCGATGCACAACTGGGTGAAC-3′
HMOX1Forward 5′-GATAGAGCGCAACAAGCAGAA-3′
Reverse 5′-CAGTGAGGCCCATACCAGAAG-3′
NOS3Forward 5′-TGTGACCCTCACCGCTACAA-3′
Reverse 5′-GCACAATCCAGGCCCAATC-3′
EPOForward 5′-ACTCTCCTTGCTACTGATTCCT-3′
Reverse 5′-ATCGTGACATTTTCTGCCTCC-3′
Table 2. The active components in AM.
Mol ID aMol Name bOB c (%)DL dPubChem ID
MOL000098Quercetin46.430.285280343
MOL000211Mairin55.380.7864971
MOL000239Kumatakenin50.830.35318869
MOL000296Hederagenin36.910.7573299
MOL000354Isorhamnetin49.60.315281654
MOL000387Bifendate31.10.67108213
MOL000392Formononetin69.670.215280378
MOL000398Isoflavanone109.990.3160767
MOL000417Calycosin47.750.245280448
MOL000422Kaempferol41.880.245280863
MOL000433Folsaeure (FA)68.960.70576037
MOL000442Sucrose39.050.485316760
MOL0003713,9-di-O-methylnissolin53.740.4815689655
MOL0003745′-hydroxyiso-muronulatol-2′,5′-di-O-glucoside41.720.7NA
MOL0003787-O-methylisomucronulatol74.690.315689652
MOL000379Methylnissolin-3-O-Glucoside36.740.9274977390
MOL000380Methylnissolin64.260.4214077830
MOL000438(R)-Isomucronulatol67.670.2610380176
MOL000439Isomucronulatol-7,2′-di-O-glucosiole49.280.6215689653
MOL000033(24S)-24-Propylcholesta-5-ene-3beta-ol36.230.7815976101
a MOL ID: The molecular ID assigned to the compound by the TCMSP database; b MOL ID: The name of compound; c OB: The value of oral bioavailability; d DL: The value of drug similarity.
Table 3. The common targets between AM and HAPC.
No.Gene NameProtein NamePubChem ID
1NOS2nitric oxide synthase 2P35228
2ARandrogen receptorP10275
3ESR1estrogen receptor 1P03372
4PPARGperoxisome proliferator activated receptor gammaP37231
5PTPN6protein tyrosine phosphatase non-receptor type 6P29350
6F2coagulation factor II, thrombinP00734
7NOS3nitric oxide synthase 3P29474
8ADRB2adrenoceptor beta 2P07550
9AKT1AKT serine/threonine kinase 1P31749
10BCL2BCL2 apoptosis regulatorP10415
11TNFtumor necrosis factorP01375
12HMOX1heme oxygenase 1P09601
13GSTM1glutathione S-transferase mu 1P09488
14VEGFAvascular endothelial growth factor AP15692
15IL10interleukin 10P22301
16IL6interleukin 6P05231
17CASP8caspase 8Q14790
18SOD1superoxide dismutase 1P00441
19HIF1Ahypoxia inducible factor 1 subunit alphaQ16665
20F3coagulation factor III, tissue factorP13726
21IL1Binterleukin 1 betaP01584
22CXCL8C-X-C motif chemokine ligand 8P10145
23THBDthrombomodulinP07204
24SERPINE1serpin family E member 1P05121
25IFNGinterferon gammaP01579
26MPOmyeloperoxidaseP05164
27PPARAperoxisome proliferator activated receptor alphaQ07869
28CRPC-reactive proteinP02741
29ABCB1ATP binding cassette subfamily B member 1P08183
30SLC2A1solute carrier family 2 member 1P11166
31MTHFRmethylenetetrahydrofolate reductaseP42898
32HSPA4heat shock protein family A P34932
33CA1carbonic anhydrase 1P00915
34ABCB1ATP-dependent translocase ABCB1P08183
35HMGB1high mobility group protein B1P09429
36SLC2A1solute carrier family 2, facilitated glucose transporter member 1P11166
Table 4. The values of core targets.
Gene NameDC aBC bCC c
TNF19133.58630.157658
AKT117128.27610.154185
IL61897.265470.156951
VEGFA1396.639910.153509
IL1B1672.267460.154867
SERPINE1959.166420.148936
CRP1154.564170.150862
NOS3939.746130.150215
HIF1A1134.520480.150215
NOS2918.64650.150215
IFNG817.086510.145833
HMOX1713.844440.147059
CXCL81013.1320.151515
ESR1712.391060.145228
a DC: The degree value corresponding to the target site in the PPI network; b BC: The betweenness value corresponding to the target site in the PPI network; c CC: The closeness value corresponding to the target site in the PPI network.
Table 5. The score of molecular docking.
Core TargetsPDB ID aCompoundsAffinity (kcal/mol)
TNF2E7AQuercetin−6.807
Kaempferol−6.581
AKT11UNQQuercetin−7.517
Kaempferol−7.351
Isorhamnetin−7.456
IL61ALUQuercetin−7.495
VEGFA1MKKQuercetin−7.804
IL1B5R8QQuercetin−7.277
HIF1A4H6JQuercetin−7.090
SERPINE11LJ5Quercetin−7.512
Folsaeure (FA)−8.197
CRP3PVNQuercetin−7.399
CXCL84XDXQuercetin−7.367
IFNG1FYHQuercetin−7.295
NOS23E7GFormononetin−7.922
Kumatakenin−8.035
Isorhamnetin−7.665
Calycosin−8.134
Kaempferol−7.604
3,9-di-O-methylnissolin−8.069
7-O-methylisomucronulatol−8.097
Methylnissolin−7.966
NOS34D1PFormononetin−7.696
Quercetin−7.719
Isorhamnetin−7.964
Kaempferol−7.461
3,9-di-O-methylnissolin−7.877
7-O-methylisomucronulatol−8.235
Folsaeure (FA)−9.103
HMOX11N45Quercetin−7.604
Isorhamnetin−7.509
Kaempferol−7.319
ESR17NFBFormononetin−6.988
Isorhamnetin−7.148
Calycosin−8.170
Kaempferol−7.187
3,9-di-O-methylnissolin−7.308
7-O-methylisomucronulatol−7.375
Methylnissolin−6.975
a PDB ID: The ID assigned to the protein by the PDB database.
Publisher’s Note: MDPI stays neutral with regard to jurisdictional claims in published maps and institutional affiliations.