
Apelin-13 and Asprosin in Adolescents with Anorexia Nervosa and Their Association with Psychometric and Metabolic Variables
 , ,
, ,
Abstract
1. Introduction
2. Materials and Methods
2.1. Biochemical Analysis
2.2. Statistics
3. Results
3.1. Demographic Data and Clinical Assessments
3.2. Asprosin and Apelin-13 Levels
3.3. Correlations between Asprosin and Apelin-13 and Metabolic Variables in AN Patients
3.4. Relationships between Asprosin and Apelin-13 and Psychometric Variables in AN Patients
4. Discussion
5. Conclusions
6. Limitations
Author Contributions
Funding
Institutional Review Board Statement
Informed Consent Statement
Data Availability Statement
Conflicts of Interest
Abbreviations
| AN | anorexia nervosa |
| AN1 | adolescents with anorexia nervosa in extremely low body weight |
| AN2 | adolescents after partial normalization of body weight |
| APE | apelin |
| APE-13 | apelin-13 |
| ASP | asprosin |
| BDI | The Beck Depression Inventory |
| CG | healthy control group |
| CNS | Central Nervous System |
| CYBOCS | Children’s Yale–Brown Obsessive Compulsive Scale |
| EAT-26 | the Eating Attitude Test |
| HAMD | the Hamilton Depression Rating Scale |
| OCD | Obsessive compulsive disorder |
References
- Watson, H.J.; Yilmaz, Z.; Thornton, L.M.; Hübel, C.; Coleman, J.R.I.; Gaspar, H.A.; Bryois, J.; Hinney, A.; Leppä, V.M.; Mattheisen, M.; et al. Genome-wide association study identifies eight risk loci and implicates metabo-psychiatric origins for anorexia nervosa. Nat. Genet. 2019, 51, 1207–1214. [Google Scholar] [CrossRef] [PubMed]
- Van Eeden, A.E.; Van Hoeken, D.; Hoek, H.W. Incidence, prevalence and mortality of anorexia nervosa and bulimia nervosa. Curr. Opin. Psychiatry 2021, 34, 515–524. [Google Scholar] [CrossRef]
- Martínez-González, L.; Fernández-Villa, T.; Molina, A.J.; Delgado-Rodríguez, M.; Martín, V. Incidence of Anorexia Nervosa in Women: A Systematic Review and Meta-Analysis. Int. J. Environ. Res. Public Health 2020, 17, 3824. [Google Scholar] [CrossRef]
- Monteleone, P.; Maj, M. Dysfunctions of leptin, ghrelin, BDNF and endocannabinoids in eating disorders: Beyond the homeostatic control of food intake. Psychoneuroendocrinology 2013, 38, 312–330. [Google Scholar] [CrossRef] [PubMed]
- Bulik, C.M.; Flatt, R.; Abbaspour, A.; Carroll, I. Reconceptualizing anorexia nervosa. Psychiatry Clin. Neurosci. 2019, 73, 518–525. [Google Scholar] [CrossRef]
- Liu, C.M.; Kanoski, S.E. Homeostatic and non-homeostatic controls of feeding behavior: Distinct vs. common neural systems. Physiol. Behav. 2018, 193, 223–231. [Google Scholar] [CrossRef]
- Grau, A.; Magallón-Neri, E.; Faus, G.; Feixas, G. Cognitive impairment in eating disorder patients of short and long-term duration: A case–control study. Neuropsychiatr. Dis. Treat. 2019, 15, 1329–1341. [Google Scholar] [CrossRef] [PubMed]
- Jung, T.W.; Kim, H.C.; Kim, H.U.; Park, T.; Park, J.; Kim, U.; Kim, M.K.; Jeong, J.H. Asprosin attenuates insulin signaling pathway through PKCδ-activated ER stress and inflammation in skeletal muscle. J. Cell. Physiol. 2019, 234, 20888–20899. [Google Scholar] [CrossRef]
- Duerrschmid, C.; He, Y.; Wang, C.; Li, C.; Bournat, J.C.; Romere, C.; Saha, P.K.; Lee, M.E.; Phillips, K.J.; Jain, M.; et al. Asprosin is a centrally acting orexigenic hormone. Nat. Med. 2017, 23, 1444–1453. [Google Scholar] [CrossRef]
- Romere, C.; Duerrschmid, C.; Bournat, J.; Constable, P.; Jain, M.; Xia, F.; Saha, P.K.; Del Solar, M.; Zhu, B.; York, B.; et al. Asprosin, a Fasting-Induced Glucogenic Protein Hormone. Cell 2016, 165, 566–579. [Google Scholar] [CrossRef]
- Li, E.; Shan, H.; Chen, L.; Long, A.; Zhang, Y.; Liu, Y.; Jia, L.; Wei, F.; Han, J.; Li, T.; et al. OLFR734 Mediates Glucose Metabolism as a Receptor of Asprosin. Cell Metab. 2019, 30, 319–328.e8. [Google Scholar] [CrossRef] [PubMed]
- Beutler, L.R.; Knight, Z.A. A Spotlight on Appetite. Neuron 2018, 97, 739–741. [Google Scholar] [CrossRef] [PubMed]
- Mayer, J. Regulation of energy intake and the body weight: The glucostatic theory and the lipostatic hypothesis. Ann. N. Y. Acad. Sci. 1955, 63, 15–43. [Google Scholar] [CrossRef] [PubMed]
- Drapeau, V.; King, N.; Hetherington, M.; Doucet, E.; Blundell, J.; Tremblay, A. Appetite sensations and satiety quotient: Predictors of energy intake and weight loss. Appetite 2007, 48, 159–166. [Google Scholar] [CrossRef]
- Du, C.; Wang, C.; Guan, X.; Li, J.; Du, X.; Xu, Z.; Li, B.; Liu, Y.; Fu, F.; Huo, H.; et al. Asprosin is associated with anorexia and body fat mass in cancer patients. Support. Care Cancer 2021, 29, 1369–1375. [Google Scholar] [CrossRef]
- Benini, L.; Todesco, T.; Dalle Grave, R.; Deiorio, F.; Salandini, L.; Vantini, I. Gastric emptying in patients with restricting and binge/purging subtypes of anorexia nervosa. Am. J. Gastroenterol. 2004, 99, 1448–1454. [Google Scholar] [CrossRef] [PubMed]
- Heruc, G.A.; Little, T.J.; Kohn, M.R.; Madden, S.; Clarke, S.D.; Horowitz, M.; Feinle-Bisset, C. Effects of starvation and short-term refeeding on gastric emptying and postprandial blood glucose regulation in adolescent girls with anorexia nervosa. Am. J. Physiol. Endocrinol. Metab. 2018, 315, E565–E573. [Google Scholar] [CrossRef]
- O’Carroll, A.M.; Selby, T.L.; Palkovits, M.; Lolait, S.J. Distribution of mRNA encoding B78/apj, the rat homologue of the human APJ receptor, and its endogenous ligand apelin in brain and peripheral tissues. Biochim. Biophys. Acta 2000, 1492, 72–80. [Google Scholar] [CrossRef]
- Li, L.; Yang, G.; Li, Q.; Tang, Y.; Yang, M.; Yang, H.; Li, K. Changes and relations of circulating visfatin, apelin, and resistin levels in normal, impaired glucose tolerance, and type 2 diabetic subjects. Exp. Clin. Endocrinol. Diabetes 2006, 114, 544–548. [Google Scholar] [CrossRef]
- El Wakeel, M.A.; El-Kassas, G.M.; Kamhawy, A.H.; Galal, E.M.; Nassar, M.S.; Hammad, E.M.; El-Zayat, S.R. Serum Apelin and Obesity-Related Complications in Egyptian Children. Open Access Maced. J. Med. Sci. 2018, 6, 1354–1358. [Google Scholar] [CrossRef]
- Boucher, J.; Masri, B.; Daviaud, D.; Gesta, S.; Guigné, C.; Mazzucotelli, A.; Castan-Laurell, I.; Tack, I.; Knibiehler, B.; Carpéné, C.; et al. Apelin, a newly identified adipokine up-regulated by insulin and obesity. Endocrinology 2005, 146, 1764–1771. [Google Scholar] [CrossRef] [PubMed]
- Heinonen, M.V.; Purhonen, A.K.; Miettinen, P.; Pääkkönen, M.; Pirinen, E.; Alhava, E.; Åkerman, K.; Herzig, K.H. Apelin, orexin-A and leptin plasma levels in morbid obesity and effect of gastric banding. Regul. Pept. 2005, 130, 7–13. [Google Scholar] [CrossRef] [PubMed]
- Ba, H.J.; Chen, H.S.; Su, Z.; Du, M.L.; Chen, Q.L.; Li, Y.H.; Ma, H.M. Associations between Serum Apelin-12 Levels and Obesity-Related Markers in Chinese Children. PLoS ONE 2014, 9, e86577. [Google Scholar] [CrossRef]
- Suriyaprom, K.; Pheungruang, B.; Tungtrongchitr, R.; Sroijit, O.U.Y. Relationships of apelin concentration and APLN T-1860C polymorphism with obesity in Thai children. BMC Pediatr. 2020, 20, 455. [Google Scholar] [CrossRef]
- Kotanidou, E.P.; Kalinderi, K.; Kyrgios, I.; Efraimidou, S.; Fidani, L.; Papadopoulou-Alataki, E.; Eboriadou-Petikopoulou, M.; Galli-Tsinopoulou, A. Apelin and G212A apelin receptor gene polymorphism in obese and diabese youth. Pediatr. Obes. 2015, 10, 213–219. [Google Scholar] [CrossRef] [PubMed]
- Tapan, S.; Tascilar, E.; Abaci, A.; Sonmez, A.; Kilic, S.; Erbil, M.K.; Ozcan, O. Decreased plasma apelin levels in pubertal obese children. J. Pediatr. Endocrinol. Metab. 2010, 23, 1039–1046. [Google Scholar] [CrossRef] [PubMed]
- Liu, W.; Yan, J.; Pan, W.; Tang, M. Apelin/Elabela-APJ: A novel therapeutic target in the cardiovascular system. Ann. Transl. Med. 2020, 8, 243. [Google Scholar] [CrossRef]
- Mughal, A.; O’Rourke, S.T. Vascular effects of apelin: Mechanisms and therapeutic potential. Pharmacol. Ther. 2018, 190, 139–147. [Google Scholar] [CrossRef]
- Ostrowska, Z.; Ziora, K.; Oświȩcimska, J.; Świȩtochowska, E.; Marek, B.; Kajdaniuk, D.; Wołkowska-Pokrywa, K.; Kos-Kudła, B. Bone metabolism, osteoprotegerin, receptor activator of nuclear factor-kB ligand and selected adipose tissue hormones in girls with anorexia nervosa. Endokrynol. Pol. 2014, 65, 33–39. [Google Scholar] [CrossRef][Green Version]
- Aminyavari, S.; Zahmatkesh, M.; Farahmandfar, M.; Khodagholi, F.; Dargahi, L.; Zarrindast, M.R. Protective role of Apelin-13 on amyloid β25-35-induced memory deficit; Involvement of autophagy and apoptosis process. Prog. Neuropsychopharmacol. Biol. Psychiatry 2019, 89, 322–334. [Google Scholar] [CrossRef]
- Ge, Y.; Li, Y.; Chen, Q.; Zhu, W.; Zuo, L.; Guo, Z.; Gong, J.; Cao, L.; Gu, L.; Li, J. Adipokine apelin ameliorates chronic colitis in Il-10 -/- mice by promoting intestinal lymphatic functions. Biochem. Pharmacol. 2018, 148, 202–212. [Google Scholar] [CrossRef] [PubMed]
- Pałasz, A.; Tyszkiewicz-Nwafor, M.; Suszka-Świtek, A.; Bacopoulou, F.; Dmitrzak-Węglarz, M.; Dutkiewicz, A.; Słopień, A.; Janas-Kozik, M.; Wilczyński, K.M.; Filipczyk, Ł.; et al. Longitudinal study on novel neuropeptides phoenixin, spexin and kisspeptin in adolescent inpatients with anorexia nervosa - association with psychiatric symptoms. Nutr. Neurosci. 2021, 24, 896–906. [Google Scholar] [CrossRef]
- Tyszkiewicz-Nwafor, M.; Slopien, A.; Dmitrzak-Węglarz, M.; Rybakowski, F. Adiponectin and resistin in acutely ill and weight-recovered adolescent anorexia nervosa: Association with psychiatric symptoms. World J. Biol. Psychiatry 2019, 20, 723–731. [Google Scholar] [CrossRef] [PubMed]
- Tyszkiewicz-Nwafor, M.; Rybakowski, F.; Dmitrzak-Weglarz, M.; Skibinska, M.; Paszynska, E.; Dutkiewicz, A.; Słopien, A. Brain-Derived Neurotrophic Factor and Oxytocin Signaling in Association With Clinical Symptoms in Adolescent Inpatients With Anorexia Nervosa—A Longitudinal Study. Front. Psychiatry 2020, 10, 1032. [Google Scholar] [CrossRef] [PubMed]
- Pleplé, A.; Lalanne, C.; Huas, C.; Mattar, L.; Hanachi, M.; Flament, M.F.; Carchon, I.; Jouen, F.; Berthoz, S.; Godart, N. Nutritional status and anxious and depressive symptoms in anorexia nervosa: A prospective study. Sci. Rep. 2021, 11, 771. [Google Scholar] [CrossRef] [PubMed]
- Sjögren, M.; Støving, R.K. Anorexia Nervosa: Reduction in Depression during Inpatient Treatment Is Closely Related to Reduction in Eating Disorder Psychopathology. J. Pers. Med. 2022, 12, 682. [Google Scholar] [CrossRef]
- Amianto, F.; Secci, I.; Arletti, L.; Davico, C.; Abbate Daga, G.; Vitiello, B. Obsessive-compulsive symptoms in young women affected with anorexia nervosa, and their relationship with personality, psychopathology, and attachment style. Eat. Weight Disord. 2022, 27, 1193–1207. [Google Scholar] [CrossRef]
- Levinson, C.A.; Zerwas, S.C.; Brosof, L.C.; Thornton, L.M.; Strober, M.; Pivarunas, B.; Crowley, J.J.; Yilmaz, Z.; Berrettini, W.H.; Brandt, H.; et al. Associations between dimensions of anorexia nervosa and obsessive-compulsive disorder: An examination of personality and psychological factors in patients with anorexia nervosa. Eur. Eat. Disord. Rev. 2019, 27, 161–172. [Google Scholar] [CrossRef]
- Kucharska, K.; Kulakowska, D.; Starzomska, M.; Rybakowski, F.; Biernacka, K. The improvement in neurocognitive functioning in anorexia nervosa adolescents throughout the integrative model of psychotherapy including cognitive remediation therapy. BMC Psychiatry 2019, 19, 15. [Google Scholar] [CrossRef]
- Dwyer, D.S.; Horton, R.Y.; Aamodt, E.J. Role of the evolutionarily conserved starvation response in anorexia nervosa. Mol. Psychiatry 2011, 16, 595–603. [Google Scholar] [CrossRef][Green Version]
- Eckert, E.D.; Gottesman, I.I.; Swigart, S.E.; Casper, R.C. A 57-year follow-up investigation and review of the Minnesota study on human starvation and its relevance to eating disorders. Arch. Psychol. 2018, 2, 1–19. [Google Scholar]
- Rikani, A.A.; Choudhry, Z.; Choudhry, A.M.; Ikram, H.; Asghar, M.W.; Kajal, D.; Waheed, A.; Mobassarah, N.J. A critique of the literature on etiology of eating disorders. Ann. Neurosci. 2013, 20, 157–161. [Google Scholar] [CrossRef] [PubMed]
- Keeler, J.L.; Robinson, L.; Keeler-Schäffeler, R.; Dalton, B.; Treasure, J.; Himmerich, H. Growth factors in anorexia nervosa: A systematic review and meta-analysis of cross-sectional and longitudinal data. World J. Biol. Psychiatry 2022, 1, 1–19. [Google Scholar] [CrossRef] [PubMed]
- Gianotti, L.; Lanfranco, F.; Ramunni, J.; Destefanis, S.; Ghigo, E.; Arvat, E. GH/IGF-I axis in anorexia nervosa. Eat. Weight Disord. 2002, 7, 94–105. [Google Scholar] [CrossRef] [PubMed]
- Misra, M.; Klibanski, A. Anorexia Nervosa and Its Associated Endocrinopathy in Young People. Horm. Res. Paediatr. 2016, 85, 147–157. [Google Scholar] [CrossRef]
- Mazur-Bialy, A.I. Asprosin-A Fasting-Induced, Glucogenic, and Orexigenic Adipokine as a New Promising Player. Will It Be a New Factor in the Treatment of Obesity, Diabetes, or Infertility? A Review of the Literature. Nutrients 2021, 13, 620. [Google Scholar] [CrossRef]
- Hu, Y.; Xu, Y.; Zheng, Y.; Kang, Q.; Lou, Z.; Liu, Q.; Chen, H.; Ji, Y.; Guo, L.; Chen, C.; et al. Increased plasma asprosin levels in patients with drug-naive anorexia nervosa. Eat. Weight Disord. 2021, 26, 313–321. [Google Scholar] [CrossRef]
- Alan, M.; Gurlek, B.; Yilmaz, A.; Aksit, M.; Aslanipour, B.; Gulhan, I.; Mehmet, C.; Taner, C.E. Asprosin: A novel peptide hormone related to insulin resistance in women with polycystic ovary syndrome. Gynecol. Endocrinol. 2019, 35, 220–223. [Google Scholar] [CrossRef]
- Li, X.; Liao, M.; Shen, R.; Zhang, L.; Hu, H.; Wu, J.; Wang, X.; Qu, H.; Guo, S.; Long, M.; et al. Plasma Asprosin Levels Are Associated with Glucose Metabolism, Lipid, and Sex Hormone Profiles in Females with Metabolic-Related Diseases. Mediat. Inflamm. 2018, 2018, 7375294. [Google Scholar] [CrossRef]
- Zhang, L.; Chen, C.; Zhou, N.; Fu, Y.; Cheng, X. Circulating asprosin concentrations are increased in type 2 diabetes mellitus and independently associated with fasting glucose and triglyceride. Clin. Chim. Acta 2019, 489, 183–188. [Google Scholar] [CrossRef]
- Wang, C.Y.; Lin, T.A.; Liu, K.H.; Liao, C.H.; Liu, Y.Y.; Wu, V.C.C.; Wen, M.S.; Yeh, T. Sen Serum asprosin levels and bariatric surgery outcomes in obese adults. Int. J. Obes. 2019, 43, 1019–1025. [Google Scholar] [CrossRef] [PubMed]
- Long, W.; Xie, X.; Du, C.; Zhao, Y.; Zhang, C.; Zhan, D.; Li, Z.; Ning, Q.; Luo, X. Decreased Circulating Levels of Asprosin in Obese Children. Horm. Res. Paediatr. 2019, 91, 271–277. [Google Scholar] [CrossRef] [PubMed]
- Wysocka, M.B.; Pietraszek-Gremplewicz, K.; Nowak, D. The Role of Apelin in Cardiovascular Diseases, Obesity and Cancer. Front. Physiol. 2018, 9, 557. [Google Scholar] [CrossRef] [PubMed]
- Butruille, L.; Drougard, A.; Knauf, C.; Moitrot, E.; Valet, P.; Storme, L.; Deruelle, P.; Lesage, J. The apelinergic system: Sexual dimorphism and tissue-specific modulations by obesity and insulin resistance in female mice. Peptides 2013, 46, 94–101. [Google Scholar] [CrossRef] [PubMed]
- Castan-Laurell, I.; Vítkova, M.; Daviaud, D.; Dray, C.; Kováčiková, M.; Kovacova, Z.; Hejnova, J.; Stich, V.; Valet, P. Effect of hypocaloric diet-induced weight loss in obese women on plasma apelin and adipose tissue expression of apelin and APJ. Eur. J. Endocrinol. 2008, 158, 905–910. [Google Scholar] [CrossRef] [PubMed]
- Ziora, K.; Oświȩcimska, J.; Świȩtochowska, E.; Ziora, D.; Ostrowska, Z.; Stojewska, M.; Klimacka-Nawrot, E.; Dyduch, A.; Błońska-Fajfrowska, B. Assessment of Serum Apelin Levels in Girls with Anorexia Nervosa. J. Clin. Endocrinol. Metab. 2010, 95, 2935–2941. [Google Scholar] [CrossRef] [PubMed][Green Version]
- Vehapoglu, A.; Ustabas, F.; Ozgen, T.I.; Terzioglu, S.; Cermik, B.B.; Ozen, O.F. Role of circulating adipocytokines vaspin, apelin, and visfatin in the loss of appetite in underweight children: A pilot trial. J. Pediatr. Endocrinol. Metab. 2015, 28, 1065–1071. [Google Scholar] [CrossRef]
- Ishimaru, Y.; Sumino, A.; Shibagaki, F.; Yamamuro, A.; Yoshioka, Y.; Maeda, S. Endogenous Apelin Is Protective Against Age-Associated Loss of Retinal Ganglion Cells in Mice. Front. Aging Neurosci. 2020, 12, 58. [Google Scholar] [CrossRef]
- Wu, L.; Chen, L.; Li, L. Apelin/APJ system: A novel promising therapy target for pathological angiogenesis. Clin. Chim. Acta 2017, 466, 78–84. [Google Scholar] [CrossRef]
- Antushevich, H.; Wójcik, M. Review: Apelin in disease. Clin. Chim. Acta 2018, 483, 241–248. [Google Scholar] [CrossRef]
- O’Carroll, A.M.; Lolait, S.J.; Harris, L.E.; Pope, G.R. The apelin receptor APJ: Journey from an orphan to a multifaceted regulator of homeostasis. J. Endocrinol. 2013, 219, R13–R35. [Google Scholar] [CrossRef] [PubMed]
- Kleinz, M.J.; Davenport, A.P. Emerging roles of apelin in biology and medicine. Pharmacol. Ther. 2005, 107, 198–211. [Google Scholar] [CrossRef] [PubMed]
- Cheng, B.; Chen, J.; Bai, B.; Xin, Q. Neuroprotection of apelin and its signaling pathway. Peptides 2012, 37, 171–173. [Google Scholar] [CrossRef] [PubMed]
- Sunter, D.; Hewson, A.K.; Dickson, S.L. Intracerebroventricular injection of apelin-13 reduces food intake in the rat. Neurosci. Lett. 2003, 353, 1–4. [Google Scholar] [CrossRef]
- Christensen, L. The effect of food intake on mood. Clin. Nutr. 2001, 20, 161–166. [Google Scholar] [CrossRef]
- Licinio-Paixao, J. Hyperinsulinemia; A mediator of decreased food intake and weight loss in anorexia nervosa and major depression. Med. Hypotheses 1989, 28, 125–130. [Google Scholar] [CrossRef]
- Sahpolat, M.; Ari, M.; Kokacya, M.H. Plasma Apelin, Visfatin and Resistin Levels in Patients with First Episode Psychosis and Chronic Schizophrenia. Clin. Psychopharmacol. Neurosci. 2020, 18, 109–115. [Google Scholar] [CrossRef]
- Dede, S.; Sahpolat, M.; Kokacya, M.H.; Ari, M.; Sesliokuyucu, C.; Yonden, Z. Serum Apelin And Nesfatin-1 Levels in Depression Patients and Their Relationship with Treatment. Dusunen Adam J. Psychiatry Neurol. Sci. 2017, 30, 39. [Google Scholar] [CrossRef]
- Lv, S.Y.; Yang, Y.J.; Qin, Y.J.; Mo, J.R.; Wang, N.B.; Wang, Y.J.; Chen, Q. Central apelin-13 inhibits food intake via the CRF receptor in mice. Peptides 2012, 33, 132–138. [Google Scholar] [CrossRef]


| Group M ± SD/Me (Q1; Q3) | AN1 vs. AN2 | AN1 vs. CG | AN2 vs. CG | ||||||
|---|---|---|---|---|---|---|---|---|---|
| An1 n = 44 | An2 n = 44 | Control n = 29 | MD (95% CI) | p | MD (95% CI) | p | MD (95% CI) | p | |
| Age | 15.50 (14.00; 17.00) | 15.00 (14.00; 17.00) | - | - | MD (95% CI) = 0.50 (−1.00; 1.00); p = 0.995 | ||||
| Height (m) | 1.61 ± 0.08 | 1.65 ± 0.05 | - | - | MD (95% CI) = −0.04 (−0.06; <0.01); p = 0.024 3 | ||||
| Body weight (kg) | 37.00 (32.75; 40.00) 36.82 ± 4.96 | 45.00 (42.00; 48.25) 44.92 ± 5.81 | 53.70 (47.00; 56.70) | −8.10 (−10.35; −5.86) | <0.001 1 | −16.70 (−18.80; −12.10) | <0.001 | −8.70 (−11.00; −4.00) | <0.001 |
| BMI | 14.13 (13.55; 15.00) 14.20 ± 1.28 | 17.08 (15.81; 18.80) 17.48 ± 2.78 | 18.91 (17.10; 20.98) | −3.28 (−4.23; −2.34) | <0.001 1 | −4.78 (−6.29; −3.67) | <0.001 | −1.83 (−3.34; −0.55) | 0.006 |
| IBW | 55.41 ± 3.86 | 57.26 ± 2.37 | - | - | MD (95% CI) = −1.85 (−3.00; <0.01); p = 0.024 3 | ||||
| %IBW | 66.39 (62.06; 70.44) 66.30 ± 6.32 | 78.97 (74.09; 87.80) 81.44 ± 11.77 | 90.76 (82.64; 98.43) | −15.14 (−19.43; −10.84) | <0.001 1 | −24.37 (−30.45; −18.85) | <0.001 | −11.79 (−16.88; −3.98) | 0.003 |
| ASP [ng/mL] | 8.06 (2.98; 13.87) | 10.08 (5.64; 20.86) | 5.61 (3.23; 9.08) | −2.04 (−7.94; −0.92) | 0.008 2 | 2.45 (−2.83; 4.66) | 0.961 | 4.47 (−0.40; 7.75) | 0.075 |
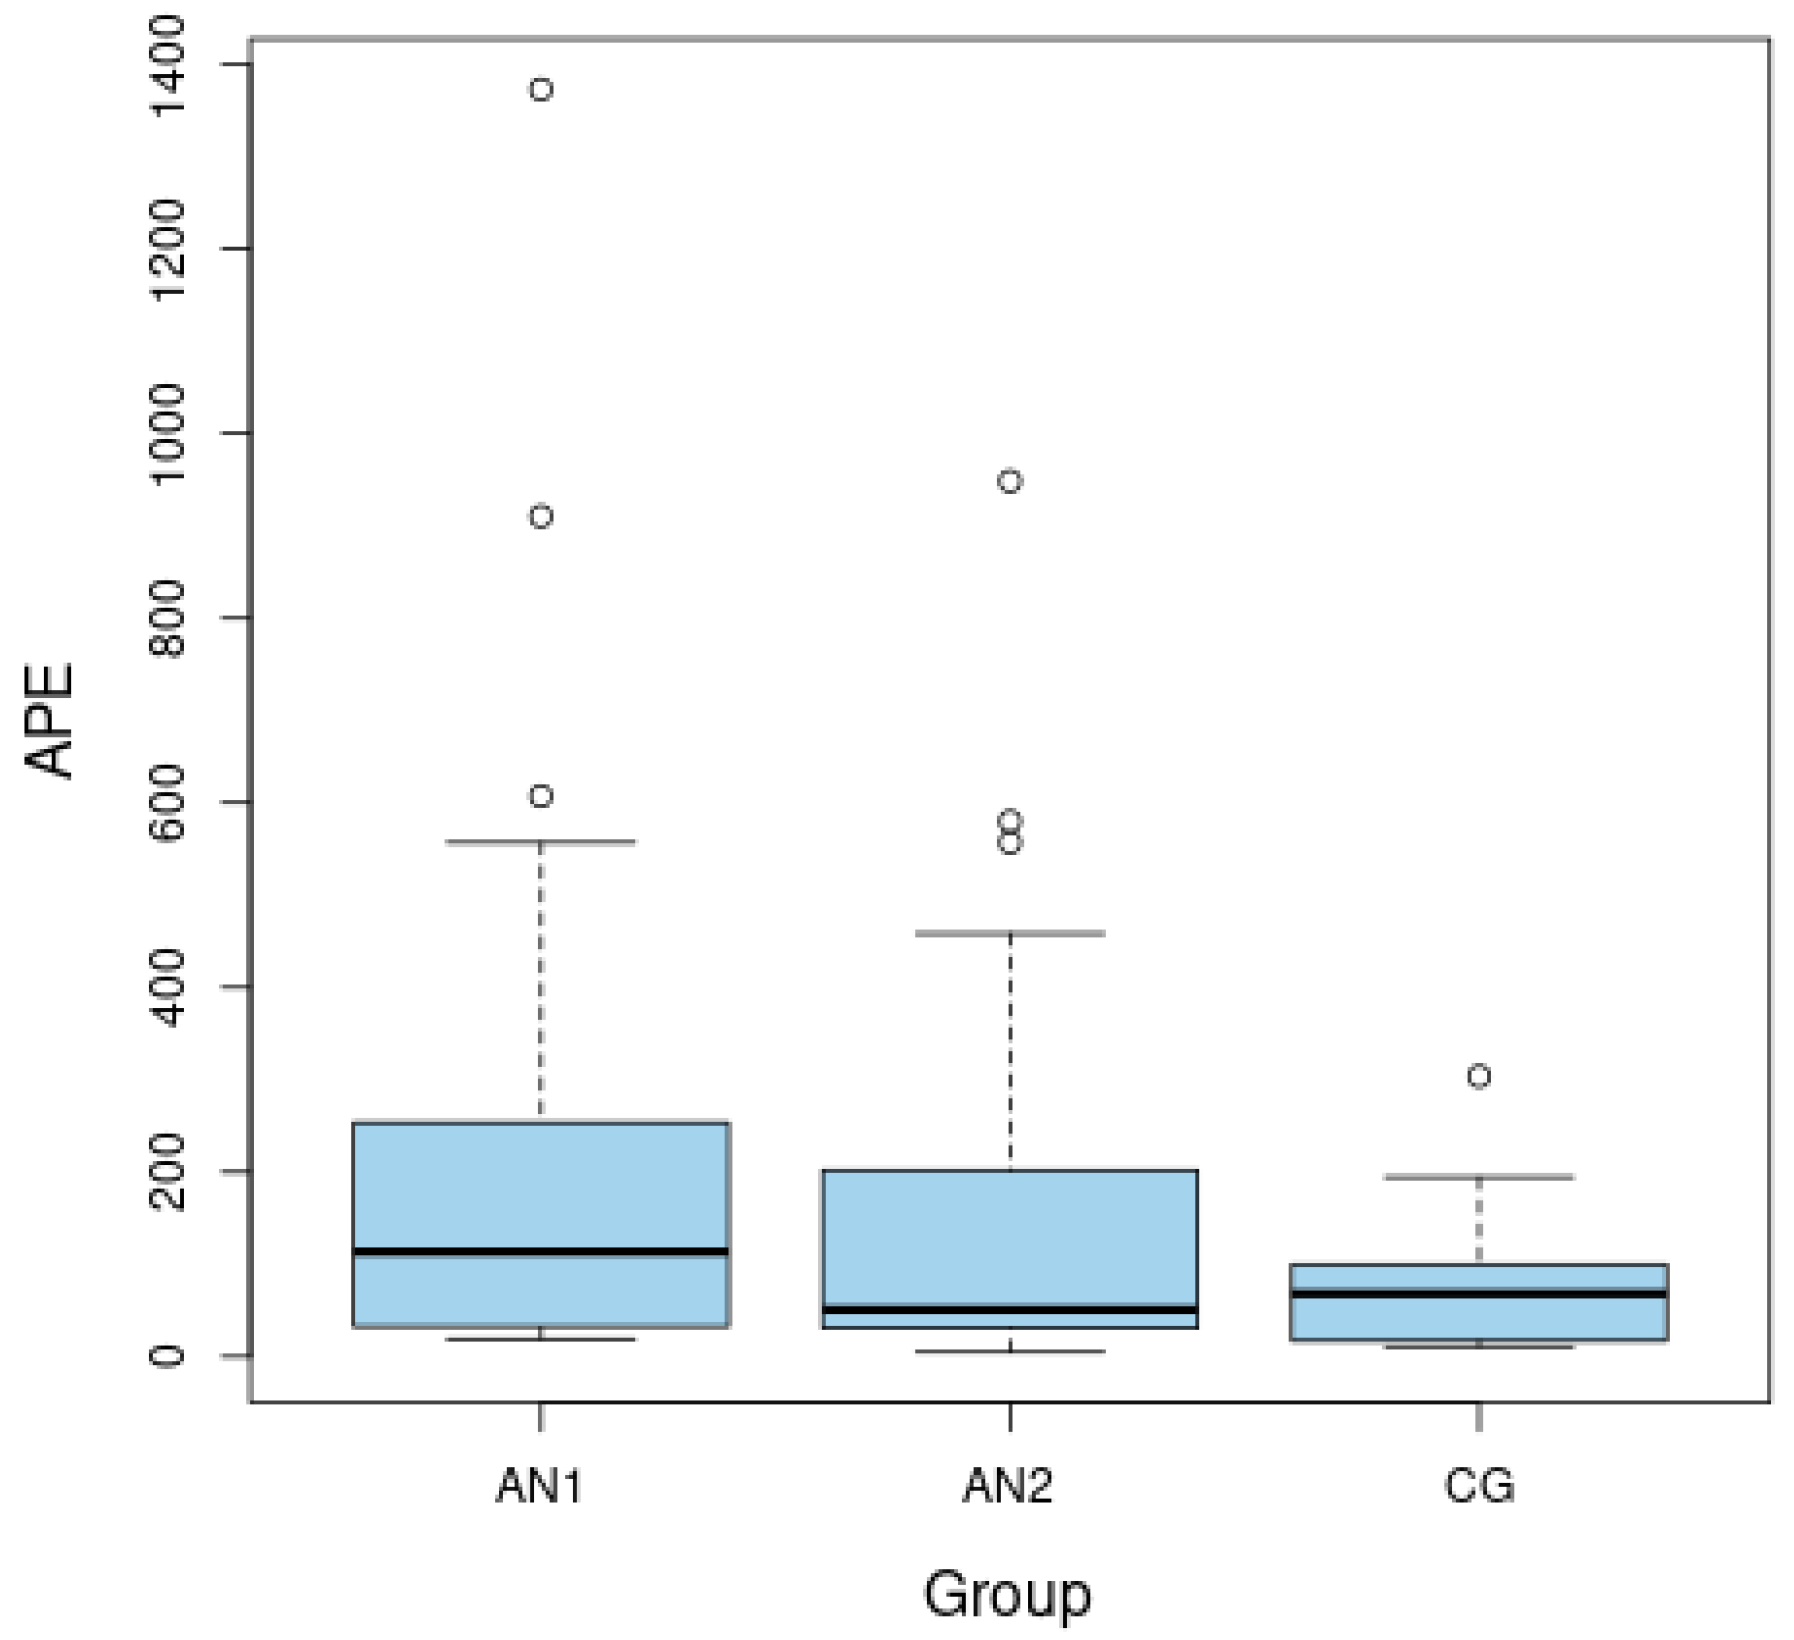
| APE-13 [pg/mL] | 113.56 (32.62; 253.56) | 50.93 (30.60; 202.18) | 68.08 (17.54; 96.94) | 30.99 (2.78; 126.76) | 0.037 2 | 45.48 (1.23; 133.96) | 0.046 | −17.15 (−25.51; 78.08) | 0.479 |
| Insulin | 5.50 (4.30; 6.65) | 10.10 (7.50; 13.50) | 8.55 (5.73; 10.13) | −5.20 (−6.95; −2.85) | <0.001 2 | −3.05 (−3.90; −0.40) | 0.017 | 1.55 (−0.10; 4.60) | 0.069 |
| Glucose | 78.00 (74.00; 83.25) 78.02 ± 7.77 | 79.00 (75.50; 86.50) | 77.00 (71.25; 82.00) 77.38 ± 7.53 | −1.00 (−9.00; 0.50) | 0.075 2 | −1.00 (−3.14; 4.42) | 0.736 3 | 2.00 (−1.00; 8.00) | 0.163 |
| HOMA-IR | 1.08 (0.80; 1.31) | 2.23 (1.51; 2.81) | 1.52 (1.09; 2.07) | −1.18 (−1.52; −0.64) | <0.001 2 | −0.44 (−0.78; −0.09) | 0.013 | 0.71 (0.09; 1.02) | 0.026 |
| Group M ± SD/Me (Q1; Q3) | AN1 vs. AN2 | AN1 vs. CG | AN2 vs. CG | ||||||
|---|---|---|---|---|---|---|---|---|---|
| TEST | An1 n = 44 | An2 n = 44 | Control n = 29 | MD (95% CI) | p | MD (95% CI) | p | MD (95% CI) | p |
| BDI | 13.00 (7.25; 24.00) | 11.50 (4.00; 22.50) | 5.00 (1.00; 11.00) | 3.00 (0.50; 6.50) | 0.012 1 | 8.00 (3.00; 15.00) | 0.003 | 6.50 (<0.01; 10.00) | 0.042 |
| HAMD | 12.00 (8.50; 17.00) | 8.00 (2.00; 16.00) | 0.00 (0.00; 3.00) | 4.50 (0.00; 7.50) | 0.050 1 | 12.00 (8.00; 13.00) | <0.001 | 8.00 (3.00; 11.00) | <0.001 |
| CYBOCS | 8.00 (4.00; 14.00) | 2.00 (1.00; 6.00) | 2.00 (0.00; 5.00) | 6.00 (2.00; 6.00) | <0.001 1 | 6.00 (1.00; 8.00) | 0.006 | 0.00 (−1.00; 0.00) | 0.079 |
| EAT-26 | 22.00 (15.00; 36.00) | 7.00 (3.00; 19.50) | 4.50 (2.75; 8.50) | 11.00 (6.00; 15.50) | <0.001 1 | 17.50 (10.00; 22.00) | <0.001 | 2.50 (<0.01; 10.00) | 0.079 |
| AN1 | AN2 | CG | ||||||||||
|---|---|---|---|---|---|---|---|---|---|---|---|---|
| ASP | APE-13 | ASP | APE-13 | ASP | APE-13 | |||||||
| rho | p | rho | p | rho | p | rho | P | rho | p | rho | p | |
| Height | −0.32 | 0.0497 | 0.16 | 0.355 | −0.50 | 0.001 | 0.43 | 0.008 | 0.03 | 0.887 | −0.02 | 0.935 |
| Body weight | −0.35 | 0.032 | 0.03 | 0.856 | 0.04 | 0.818 | 0.20 | 0.234 | 0.17 | 0.394 | −0.28 | 0.286 |
| BMI | −0.26 | 0.113 | −0.06 | 0.722 | 0.34 | 0.028 | −0.07 | 0.660 | 0.14 | 0.496 | −0.21 | 0.441 |
| IBW | −0.32 | 0.0497 | 0.16 | 0.355 | −0.50 | 0.001 | 0.43 | 0.008 | 0.03 | 0.887 | −0.02 | 0.935 |
| %IBW | −0.30 | 0.070 | −0.05 | 0.779 | 0.22 | 0.160 | 0.04 | 0.824 | 0.15 | 0.470 | −0.23 | 0.389 |
| Glucose | −0.23 | 0.175 | −0.03 | 0.858 | −0.33 | 0.037 | −0.09 | 0.616 | −0.12 | 0.588 | −0.21 | 0.458 |
| Insulin | −0.11 | 0.533 | −0.19 | 0.279 | −0.43 | 0.005 | 0.31 | 0.068 | 0.25 | 0.229 | −0.28 | 0.314 |
| HOMA-IR | −0.15 | 0.373 | −0.09 | 0.579 | −0.49 | 0.002 | 0.29 | 0.087 | 0.22 | 0.311 | 0.27 | 0.334 |
| AN1 | AN2 | CG | ||||||||||
|---|---|---|---|---|---|---|---|---|---|---|---|---|
| ASP | APE-13 | ASP | APE-13 | ASP | APE-13 | |||||||
| rho | p | rho | p | rho | p | rho | p | rho | p | rho | p | |
| BDI | 0.23 | 0.298 | −0.46 | 0.034 | 0.06 | 0.771 | 0.28 | 0.181 | −0.26 | 0.201 | −0.09 | 0.736 |
| HAMD | 0.10 | 0.661 | −0.42 | 0.051 | 0.06 | 0.751 | 0.11 | 0.579 | −0.25 | 0.214 | −0.31 | 0.242 |
| CYBOCS | 0.23 | 0.291 | <0.01 | 0.998 | 0.04 | 0.832 | 0.15 | 0.461 | −0.21 | 0.315 | −0.16 | 0.542 |
| EAT-26 | 0.51 | 0.025 | −0.50 | 0.028 | −0.13 | 0.588 | 0.53 | 0.030 | 0.19 | 0.420 | 0.34 | 0.237 |
Publisher’s Note: MDPI stays neutral with regard to jurisdictional claims in published maps and institutional affiliations. |
© 2022 by the authors. Licensee MDPI, Basel, Switzerland. This article is an open access article distributed under the terms and conditions of the Creative Commons Attribution (CC BY) license (https://creativecommons.org/licenses/by/4.0/).
Share and Cite
Jowik, K.; Dmitrzak-Węglarz, M.; Pytlińska, N.; Jasińska-Mikołajczyk, A.; Słopień, A.; Tyszkiewicz-Nwafor, M. Apelin-13 and Asprosin in Adolescents with Anorexia Nervosa and Their Association with Psychometric and Metabolic Variables. Nutrients 2022, 14, 4022. https://doi.org/10.3390/nu14194022
Jowik K, Dmitrzak-Węglarz M, Pytlińska N, Jasińska-Mikołajczyk A, Słopień A, Tyszkiewicz-Nwafor M. Apelin-13 and Asprosin in Adolescents with Anorexia Nervosa and Their Association with Psychometric and Metabolic Variables. Nutrients. 2022; 14(19):4022. https://doi.org/10.3390/nu14194022
Chicago/Turabian StyleJowik, Katarzyna, Monika Dmitrzak-Węglarz, Natalia Pytlińska, Anna Jasińska-Mikołajczyk, Agnieszka Słopień, and Marta Tyszkiewicz-Nwafor. 2022. "Apelin-13 and Asprosin in Adolescents with Anorexia Nervosa and Their Association with Psychometric and Metabolic Variables" Nutrients 14, no. 19: 4022. https://doi.org/10.3390/nu14194022
APA StyleJowik, K., Dmitrzak-Węglarz, M., Pytlińska, N., Jasińska-Mikołajczyk, A., Słopień, A., & Tyszkiewicz-Nwafor, M. (2022). Apelin-13 and Asprosin in Adolescents with Anorexia Nervosa and Their Association with Psychometric and Metabolic Variables. Nutrients, 14(19), 4022. https://doi.org/10.3390/nu14194022