

Associations between Food Groups and Health-Related Quality of Life in Korean Adults

Abstract
:1. Introduction
2. Materials and Methods
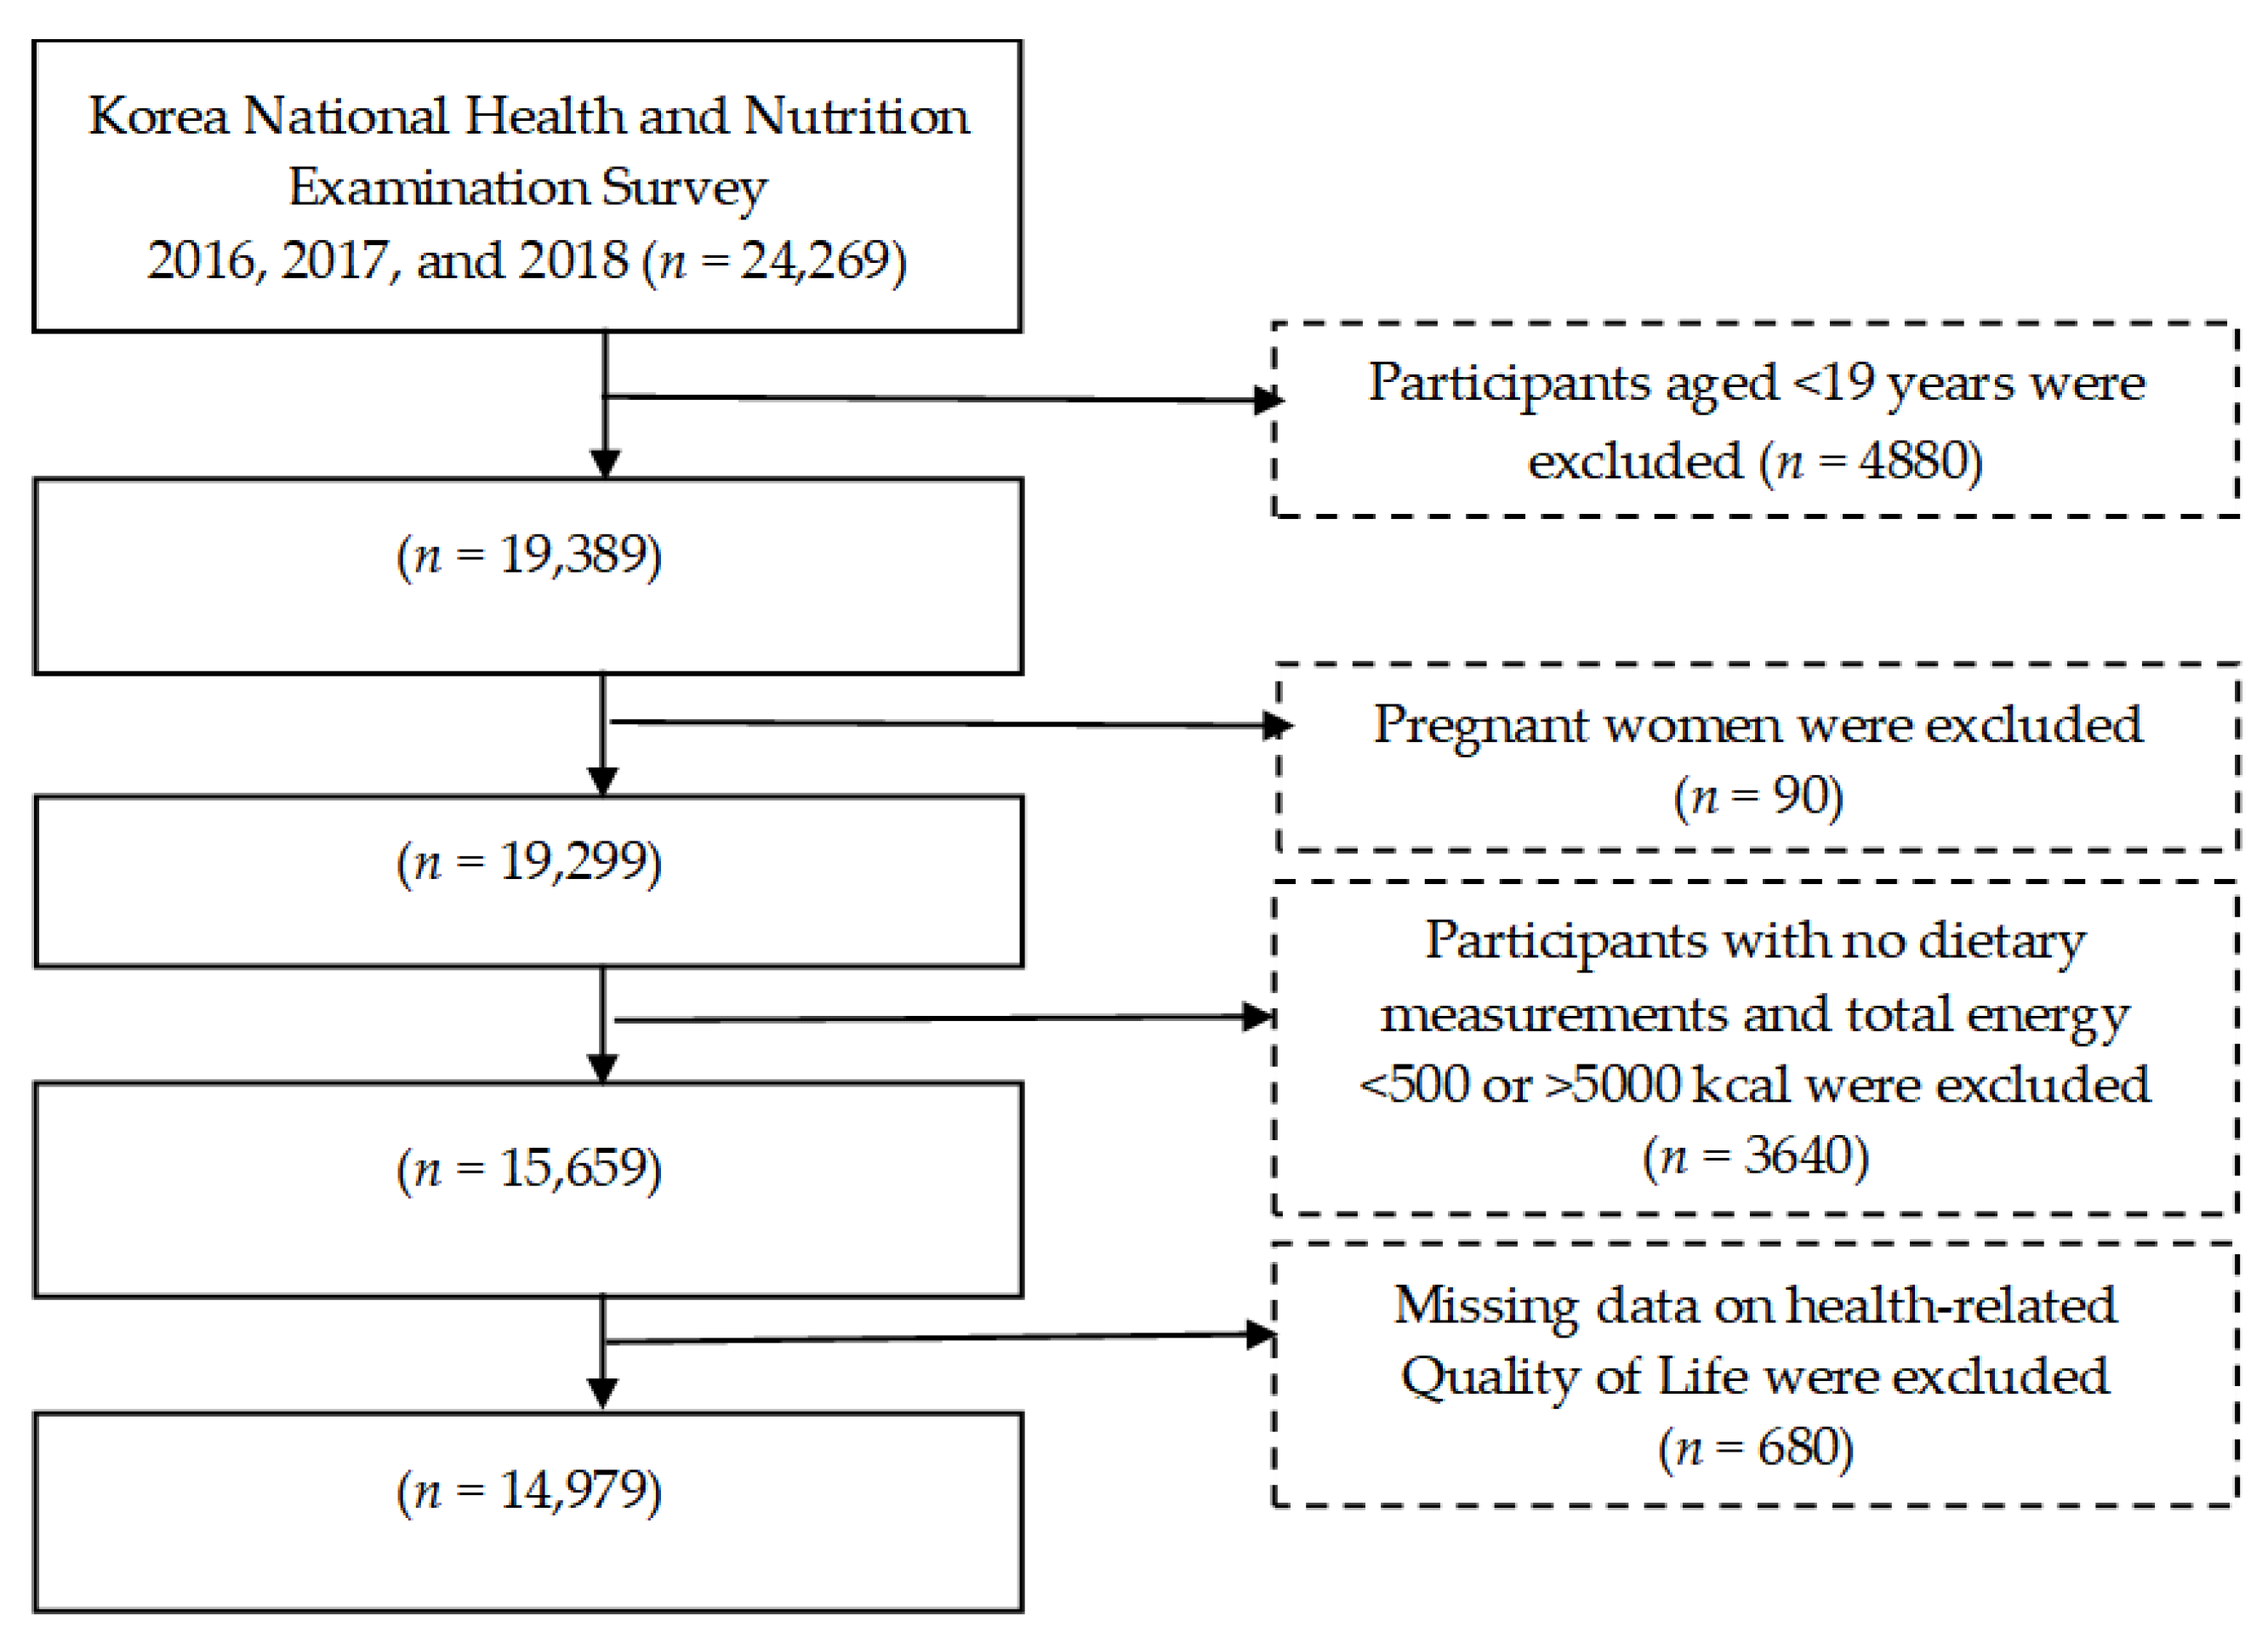
2.1. Study Participants
2.2. Assessment of Health-Related Quality of Life (HRQoL)
2.3. Assessment of Dietary Intake
2.4. Health Behavior Measurements
2.5. Statistical Analyses
3. Results
4. Discussion
5. Conclusions
Author Contributions
Funding
Institutional Review Board Statement
Informed Consent Statement
Data Availability Statement
Conflicts of Interest
References
- World Health Organization. World Health Statistics—Monitoring Health for the SDGs; World Health Organization: Geneva, Switzerland, 2016. [Google Scholar]
- Choi, Y.J.; Lee, M.S.; An, S.Y.; Kim, T.H.; Han, S.J.; Kim, H.J.; Chung, Y.S.; Lee, K.W.; Kim, D.J. The Relationship between Diabetes Mellitus and Health-Related Quality of Life in Korean Adults: The Fourth Korea National Health and Nutrition Examination Survey (2007–2009). Diabetes Metab. J. 2011, 35, 587–594. [Google Scholar] [CrossRef] [PubMed]
- Solli, O.; Stavem, K.; Kristiansen, I.S. Health-related quality of life in diabetes: The associations of complications with EQ-5D scores. Health Qual. Life Outcomes 2010, 8, 18. [Google Scholar] [CrossRef] [PubMed]
- Kim, E.H.; Chun, J.A.; Moon, S.J.; Ka, K.H.; Park, H.J. A Study on the Relevance to the Health-Related Quality of Life in South Korean People: Focusing on the Data from the Fifth Korea National Health and Nutrition Examination Survey. Int. J. Clin. Prev. Dent. 2020, 16, 28–34. [Google Scholar] [CrossRef]
- Milte, C.M.; Thorpe, M.G.; Crawford, D.; Ball, K.; McNaughton, S.A. Associations of diet quality with health-related quality of life in older Australian men and women. Exp. Gerontol. 2015, 64, 8–16. [Google Scholar] [CrossRef] [PubMed]
- Govindaraju, T.; Sahle, B.W.; McCaffrey, T.A.; McNeil, J.J.; Owen, A.J. Dietary patterns and quality of life in older adults: A systematic review. Nutrients 2018, 10, 971. [Google Scholar] [CrossRef]
- Ruano, C.; Henriquez, P.; Martínez-González, M.Á.; Bes-Rastrollo, M.; Ruiz-Canela, M.; Sánchez-Villegas, A. Empirically Derived Dietary Patterns and Health-Related Quality of Life in the SUN Project. PLoS ONE 2013, 8, e61490. [Google Scholar] [CrossRef]
- Gezer, C.; Yurt, M.; Harmancioğlu, B.; Yildirim, A.; Elmas, C. The relationship between malnutrition, diet quality and health-related quality of life among the elderly: A cross-sectional study. Prog. Nutr. 2020, 22, e2020065. [Google Scholar] [CrossRef]
- Bonaccio, M.; Di Castelnuovo, A.; Bonanni, A.; Costanzo, S.; De Lucia, F.; Pounis, G.; Zito, F.; Donati, M.B.; De Gaetano, G.; Iacoviello, L. Adherence to a Mediterranean diet is associated with a better health-related quality of life: A possible role of high dietary antioxidant content. BMJ Open 2013, 3, e003003. [Google Scholar] [CrossRef]
- Zaragoza-Martí, A.; Ferrer-Cascales, R.; Hurtado-Sánchez, J.A.; Laguna-Pérez, A.; Cabañero-Martínez, M.J. Relationship Between Adherence to the Mediterranean Diet and Health-Related Quality of Life and Life Satisfaction Among Older Adults. J. Nutr. Health Aging 2018, 22, 89–96. [Google Scholar] [CrossRef]
- Nanri, H.; Yamada, Y.; Itoi, A.; Yamagata, E.; Watanabe, Y.; Yoshida, T.; Miyake, M.; Date, H.; Ishikawa-Takata, K.; Yoshida, M.; et al. Frequency of fruit and vegetable consumption and the oral health-related quality of life among Japanese elderly: A cross-sectional study from the Kyoto-Kameoka study. Nutrients 2017, 9, 1362. [Google Scholar] [CrossRef] [Green Version]
- Kim, D.; Lim, H. Association between combinations of nutritional status and quality of life and food purchasing motives among the elderly in South Korea. Health Qual. Life Outcomes 2020, 18, 186. [Google Scholar] [CrossRef]
- Wu, X.Y.; Ohinmaa, A.; Veugelers, P.J. Diet quality, physical activity, body weight and health-related quality of life among grade 5 students in Canada. Public Health Nutr. 2012, 15, 75–81. [Google Scholar] [CrossRef] [PubMed]
- Lesani, A.; Mohammadpoorasl, A.; Javadi, M.; Esfeh, J.M.; Fakhari, A. Eating breakfast, fruit and vegetable intake and their relation with happiness in college students. Eat. Weight. Disord. 2016, 21, 645–651. [Google Scholar] [CrossRef] [PubMed]
- Rooney, C.; McKinley, M.C.; Woodside, J.V. The potential role of fruit and vegetables in aspects of psychological well-being: A review of the literature and future directions. Proc. Nutr. Soc. 2013, 72, 420–432. [Google Scholar] [CrossRef] [PubMed]
- Costarelli, V.; Koretsi, E.; Georgitsogianni, E. Health-related quality of life of Greek adolescents: The role of the Mediterranean diet. Qual. Life Res. 2013, 22, 951–956. [Google Scholar] [CrossRef]
- Lee, S.H.; Lee, S.H.; Lee, S.Y.; Lee, B.; Lee, S.H.; Park, Y.L. Psychological health status and health-related quality of life in adults with atopic dermatitis: A nationwide cross-sectional study in South Korea. Acta Derm.-Venereol. 2018, 98, 89–97. [Google Scholar] [CrossRef]
- Sirgy, M.J. Positive balance: A hierarchical perspective of positive mental health. Qual. Life Res. 2019, 28, 1921–1930. [Google Scholar] [CrossRef]
- Kim, S.; Kwon, Y.M.; Park, Y.I. Association between Physical Activity and Health-Related Quality of life in Korean: The Korea National Health and Nutrition Examination survey IV. Korean J. Fam. Med. 2014, 35, 152–159. [Google Scholar] [CrossRef]
- Lee, Y.-K.; Nam, H.-S.; Chuang, L.-H.; Kim, K.-Y.; Yang, H.-K.; Kwon, I.-S.; Kind, P.; Kweon, S.-S.; Kim, Y.-T. South Korean Time Trade-Off Values for EQ-5D Health States: Modeling with Observed Values for 101 Health States. Value Health 2009, 12, 1187–1193. [Google Scholar] [CrossRef]
- Karimi, M.; Brazier, J. Health, Health-Related Quality of Life, and Quality of Life: What is the Difference? PharmacoEconomics 2016, 34, 645–649. [Google Scholar] [CrossRef]
- Kim, J.; Jo, M.-W.; Lee, H.-J.; Ahn, S.-H.; Son, B.H.; Lee, J.W.; Lee, S.B. Validity and reliability of the Health-Related Quality of Life Instrument with 8 Items (HINT-8) in Korean breast cancer patients. Osong Public Health Res. Perspect. 2021, 12, 254–263. [Google Scholar] [CrossRef] [PubMed]
- Kim, Y.J.; Han, K.D.; Cho, K.H.; Kim, Y.H.; Park, Y.G. Anemia and health-related quality of life in South Korea: Data from the Korean national health and nutrition examination survey 2008–2016. BMC Public Health 2019, 19, 735. [Google Scholar] [CrossRef] [PubMed]
- Ferrer-Cascales, R.; Albaladejo-Blázquez, N.; Ruiz-Robledillo, N.; Clement-Carbonell, V.; Sánchez-Sansegundo, M.; Zaragoza-Martí, A. Higher adherence to the mediterranean diet is related to more subjective happiness in adolescents: The role of health-related quality of life. Nutrients 2019, 11, 698. [Google Scholar] [CrossRef] [PubMed]
- Pérez-Tasigchana, R.F.; León-Muñoz, L.M.; López-García, E.; Banegas, J.R.; Rodríguez-Artalejo, F.; Guallar-Castillón, P. Mediterranean diet and health-related quality of life in two cohorts of community-dwelling older adults. PLoS ONE 2016, 11, e0151596. [Google Scholar] [CrossRef]
- Kenkhuis, M.F.; van Duijnhoven, F.J.B.; van Roekel, E.H.; Breedveld-Peters, J.J.L.; Breukink, S.O.; Janssen-Heijnen, M.L.; Keulen, E.T.P.; Mols, F.; Weijenberg, M.P.; Bours, M.J.L. Longitudinal associations of fiber, vegetable, and fruit intake with quality of life and fatigue in colorectal cancer survivors up to 24 months posttreatment. Am. J. Clin. Nutr. 2022, 115, 822–832. [Google Scholar] [CrossRef]
- Steptoe, A.; Perkins-Porras, L.; Hilton, S.; Rink, E.; Cappuccio, F.P. Quality of life and self-rated health in relation to changes in fruit and vegetable intake and in plasma vitamins C and E in a randomised trial of behavioural and nutritional education counselling. Br. J. Nutr. 2004, 92, 177–184. [Google Scholar] [CrossRef]
- Schiepers, O.J.G.; de Groot, R.H.M.; Jolles, J.; van Boxtel, M.P.J. Fish consumption, not fatty acid status, is related to quality of life in a healthy population. Prostaglandins Leukot. Essent. Fat. Acids 2010, 83, 31–35. [Google Scholar] [CrossRef]
- Itani, L.; Sammarco, R.; El Ghoch, M. Editorial: Nutrition and Health-Related Quality of Life: Is It an Ignored Outcome? Front. Nutr. 2021, 8, 778816. [Google Scholar] [CrossRef]
- Conner, T.S.; Brookie, K.L.; Richardson, A.C.; Polak, M.A. On carrots and curiosity: Eating fruit and vegetables is associated with greater flourishing in daily life. Br. J. Health Psychol. 2015, 20, 413–427. [Google Scholar] [CrossRef]
- Oh, J.; Yun, K.; Chae, J.H.; Kim, T.S. Association Between Macronutrients Intake and Depression in the United States and South Korea. Front. Psychiatry 2020, 11, 207. [Google Scholar] [CrossRef] [Green Version]
- Mujcic, R.; Oswald, J.A. Evolution of Well-Being and Happiness After Increases in Consumption of Fruit and Vegetables. Am. J. Public Health 2016, 106, 1504–1510. [Google Scholar] [CrossRef] [PubMed]
- Ju, S.Y.; Park, Y.K. Low fruit and vegetable intake is associated with depression among Korean adults in data from the 2014 Korea National Health and Nutrition Examination Survey. J. Health Popul. Nutr. 2019, 38, 39. [Google Scholar] [CrossRef] [PubMed]
- Wurtman, R.J.; Wurtman, J.J. Brain serotonin, carbohydrate-craving, obesity and depression. Obes. Res. 1995, 3 (Suppl. S4), 477S–480S. [Google Scholar] [CrossRef] [PubMed]


| Males | Females | ||||||
|---|---|---|---|---|---|---|---|
| (n = 6273) | (n = 8706) | ||||||
| HRQoL | HRQoL | ||||||
| Low | High | Low | High | ||||
| (n = 1108) | (n = 5165) | (n = 2174) | (n = 6532) | ||||
| 13.79% | 86.21% | p-Value | 21.62% | 78.38% | p-Value | ||
| Age (years) | 56.38 ± 0.72 | 44.84 ± 0.29 | <0.001 | 58.77 ± 0.54 | 45.46 ± 0.25 | <0.001 | |
| Body Mass Index (kg/m2) | 24.36 ± 0.14 | 24.58 ± 0.06 | 0.161 | 24.20 ± 0.09 | 23.05 ± 0.06 | <0.001 | |
| Marital status | Married | 77.48 | 70.59 | <0.001 | 87.97 | 79.84 | <0.001 |
| Single | 22.52 | 29.4 | 12.02 | 20.16 | |||
| Education | Elementary | 25.09 | 7.37 | <0.001 | 45.58 | 11.89 | <0.001 |
| Middle school | 13.55 | 7.11 | 12.43 | 7.94 | |||
| High school | 33.83 | 36.67 | 23.18 | 36.26 | |||
| University | 27.53 | 48.84 | 18.80 | 43.9 | |||
| Hypertension | No | 61.07 | 82.16 | <0.001 | 62.79 | 86.64 | <0.001 |
| Yes | 38.93 | 17.84 | 37.20 | 13.36 | |||
| Diabetes | No | 81.97 | 93.64 | <0.001 | 84.73 | 95.14 | <0.001 |
| Yes | 18.02 | 6.36 | 15.27 | 4.86 | |||
| Stress recognition | <0.001 | <0.001 | |||||
| Very much | 11.53 | 2.58 | 11.77 | 3.69 | |||
| Somewhat | 27.69 | 20.78 | 30.2 1 | 22.13 | |||
| A little | 46.48 | 60.33 | 45.12 | 59.49 | |||
| Rarely | 14.29 | 16.29 | 12.89 | 14.69 | |||
| Drinking Status | <0.001 | <0.001 | |||||
| <1/month | 36.77 | 24.09 | 56.36 | 45.66 | |||
| 1–4/month | 30.01 | 39.87 | 32.27 | 38.96 | |||
| 2–3/week | 17.66 | 25.48 | 8.02 | 12.28 | |||
| ≥4/week | 15.56 | 10.56 | 3.35 | 3.09 | |||
| Smoking Status | 0.044 | 0.055 | |||||
| Current | 39.34 | 42.17 | 40.51 | 30.92 | |||
| Previous | 4.92 | 5.88 | 13.16 | 15.93 | |||
| Never | 55.74 | 51.96 | 46.33 | 53.16 | |||
| Exercise | <0.001 | <0.001 | |||||
| <1/week | 76.33 | 65.16 | 87.12 | 80.79 | |||
| 1–2/week | 7.25 | 11.75 | 4.43 | 7.83 | |||
| 3–4/week | 7.27 | 11.91 | 4.77 | 6.62 | |||
| ≥5/week | 9.16 | 11.19 | 3.68 | 4.75 | |||
| Low HRQoL (n = 1108) | High HRQoL (n = 5165) | p-Value | |
|---|---|---|---|
| Cereal and grain products | 303.38 ± 7.53 | 290.92 ± 6.22 | 0.039 |
| Potatoes and starches | 63.34 ± 7.95 | 69.24 ± 7.47 | 0.332 |
| Sugars and sweets | 11.49 ± 1.19 | 9.23 ± 0.89 | 0.037 |
| Legumes and their products | 58.82 ± 7.53 | 57.36 ± 5.62 | 0.808 |
| Seeds and nuts | 7.78 ± 1.99 | 0.37 ± 1.46 | 0.684 |
| Vegetables | 334.22 ± 11.84 | 350.83 ± 10.43 | 0.048 |
| Mushrooms | 9.41 ± 2.68 | 10.81 ± 2.21 | 0.511 |
| Fruits | 186.16 ± 18.22 | 193.21 ± 14.82 | 0.628 |
| Meats and their products | 190.79 ± 10.62 | 180.92 ± 9.00 | 0.253 |
| Eggs | 45.95 ± 3.92 | 47.82 ± 3.08 | 0.547 |
| Fish and shellfish | 120.49 ± 9.98 | 141.67 ± 9.77 | 0.013 |
| Seaweed | 50.46 ± 8.58 | 55.88 ± 7.82 | 0.396 |
| Milk and dairy products | 184.80 ± 20.46 | 178.14 ± 13.82 | 0.682 |
| Oils and fats | 8.92 ± 0.79 | 7.49 ± 0.44 | 0.027 |
| Beverages | 514.71 ± 30.44 | 529.91 ± 23.25 | 0.513 |
| Seasonings | 41.51 ± 1.96 | 40.66 ± 1.54 | 0.571 |
| Processed products | 150.75 ± 21.43 | 112.19 ± 16.02 | 0.056 |
| Others | 8.14 ± 5.33 | 10.25 ± 3.72 | 0.716 |
| Low HRQoL (n = 2174) | High HRQoL (n = 6532) | p-Value | |
|---|---|---|---|
| Cereal and grain products | 175.59 ± 12.22 | 163.92 ± 12.09 | 0.220 |
| Potatoes and starches | 73.28 ± 19.67 | 63.96 ± 14.86 | 0.512 |
| Sugars and sweets | 9.18 ± 1.46 | 6.77 ± 1.42 | 0.084 |
| Legumes and their products | 54.65 ± 13.76 | 44.42 ± 12.92 | 0.247 |
| Seeds and nuts | 20.55 ± 8.68 | 19.64 ± 8.54 | 0.749 |
| Vegetables | 229.89 ± 21.22 | 262.45 ± 18.58 | 0.022 |
| Mushrooms | 11.62 ± 5.33 | 11.27 ± 4.60 | 0.923 |
| Fruits | 161.73 ± 39.04 | 157.60 ± 36.59 | 0.881 |
| Meats and their products | 92.61 ± 15.75 | 117.39 ± 14.45 | 0.045 |
| Eggs | 52.83 ± 7.69 | 44.81 ± 6.96 | 0.125 |
| Fish and shellfish | 100.37 ± 21.15 | 118.60 ± 20.38 | 0.042 |
| Seaweed | 10.59 ± 13.30 | 4.17 ± 15.93 | 0.623 |
| Milk and dairy products | 221.93 ± 42.87 | 229.66 ± 41.57 | 0.767 |
| Oils and fats | 7.97 ± 1.17 | 6.61 ± 1.27 | 0.069 |
| Beverages | 770.78 ± 90.25 | 747.99 ± 82.89 | 0.700 |
| Seasonings | 30.32 ± 4.43 | 30.41 ± 4.06 | 0.973 |
| Processed products | 146.33 ± 39.29 | 191.72 ± 44.84 | 0.040 |
| Others | 2.43 ± 1.30 | 5.21 ± 2.10 | 0.165 |
| Consumption Amount (g) | |||
|---|---|---|---|
| OR (95%CI) | |||
| T1 | T2 | T3 | |
| Cereal and grain products | 0.63–195.55 | 195.56–303.47 | 303.48–1493.68 |
| 0.69 (0.52–0.91) | 0.80 (0.62–1.04) | 1.00 (Ref) | |
| Potatoes and starches | 0.02–13.96 | 13.97–53.03 | 53.04–1591.60 |
| 1.09 (0.75–1.57) | 1.22 (0.84–1.75) | 1.00 (Ref) | |
| Sugars and sweets | 0.00–2.10 | 2.20–7.20 | 7.30–260.00 |
| 0.86 (0.65–1.15) | 0.86 (0.65–1.13) | 1.00 (Ref) | |
| Legumes and their products | 0.03–10.19 | 10.20–39.30 | 39.40–2128.99 |
| 1.04 (0.77–1.39) | 1.08 (0.82–1.42) | 1.00 (Ref) | |
| Seeds and nuts | 0.00–0.50 | 0.60–2.50 | 2.60–1831.20 |
| 0.97 (0.72–1.29) | 1.01 (0.76–1.34) | 1.00 (Ref) | |
| Vegetables | 0.28–194.39 | 194.40–350.60 | 350.70–2531.55 |
| 1.25 (1.05–1.65) | 1.19 (0.94–1.51) | 1.00 (Ref) | |
| Mushrooms | 0.00–1.97 | 1.98–9.47 | 9.48–332.00 |
| 1.18 (0.79–1.77) | 1.09 (0.70–1.70) | 1.00 (Ref) | |
| Fruits | 0.00–95.10 | 95.20–288.13 | 288.14–3204.17 |
| 1.03 (0.76–1.38) | 1.01 (0.75–1.37) | 1.00 (Ref) | |
| Meats and their products | 0.24–50.76 | 50.77–129.87 | 129.88–1877.70 |
| 0.92 (0.67–1.25) | 1.14 (0.87−1.49) | 1.00 (Ref) | |
| Eggs | 0.07−18.78 | 18.79–52.00 | 52.10–761.35 |
| 1.04 (0.72–1.48) | 0.89 (0.64–1.23) | 1.00 (Ref) | |
| Fish and shellfish | 0.01–25.91 | 25.92–118.82 | 118.83–3042.71 |
| 1.45 (1.12–1.89) | 1.44 (1.11–1.86) | 1.00 (Ref) | |
| Seaweed | 0.00–4.00 | 4.10–22.00 | 22.10–1510.17 |
| 1.20 (0.86–1.68) | 1.20 (0.87–1.65) | 1.00 (Ref) | |
| Milk and dairy products | 0.07–102.40 | 102.50–208.00 | 208.10–1664.00 |
| 0.94 (0.61–1.44) | 0.87(0.56–1.34) | 1.00 (Ref) | |
| Oils and fats | 0.00–2.20 | 2.30–6.70 | 6.80–230.00 |
| 0.84 (0.63–1.11) | 0.78 (0.58–1.05) | 1.00 (Ref) | |
| Beverages | 0.00–35.00 | 35.10–355.20 | 355.30–7128.00 |
| 1.24 (0.91–1.69) | 1.25 (0.94–1.67) | 1.00 (Ref) | |
| Seasonings | 0.00–15.95 | 15.96–36.37 | 36.38–874.69 |
| 1.15 (0.88–1.50) | 0.89 (0.69–1.13) | 1.00 (Ref) | |
| Processed products | 0.05–40.98 | 40.99–142.90 | 143.00–1107.13 |
| 0.56 (0.25–1.22) | 0.38 (0.18–0.78) | 1.00 (Ref) | |
| Others | 0.02–0.38 | 0.39–2.29 | 2.30–282.79 |
| 1.25 (0.80–1.31) | 1.29 (0.70–1.49) | 1.00 (Ref) | |
| Consumption Amount (g) | |||
|---|---|---|---|
| OR (95%CI) | |||
| T1 | T2 | T3 | |
| Cereal and grain products | 0.32–195.56 | 195.57–303.47 | 303.48–1369.02 |
| 0.59 (0.32–1.09) | 0.61 (0.34–1.09) | 1.00 (Ref) | |
| Potatoes and starches | 0.01–14.00 | 14.10–53.04 | 53.05−1888.50 |
| 1.09 (0.52–2.34) | 0.81 (0.39–1.67) | 1.00 (Ref) | |
| Sugars and sweets | 0.00−2.10 | 2.20–7.20 | 7.30−292.10 |
| 0.81 (0.46–1.44) | 1.13 (0.70–1.81) | 1.00 (Ref) | |
| Legumes and their products | 0.02−10.20 | 10.30–39.24 | 39.25−1319.95 |
| 0.96 (0.52−1.76) | 0.52 (0.26–1.04) | 1.00 (Ref) | |
| Seeds and nuts | 0.00–0.50 | 0.60−2.50 | 2.60–603.59 |
| 0.91 (0.52–1.59) | 0.92 (0.49–1.71) | 1.00 (Ref) | |
| Vegetables | 0.03−194.35 | 194.36−350.56 | 350.57–2663.71 |
| 1.56 (1.17–3.01) | 1.50 (0.81–2.96) | 1.00 (Ref) | |
| Mushrooms | 0.00−1.97 | 1.98−9.47 | 9.48–340.65 |
| 0.88 (0.40–1.90) | 0.72 (0.35–1.50) | 1.00 (Ref) | |
| Fruits | 0.00–95.10 | 95.20–288.36 | 288.37–4320.00 |
| 0.86 (0.46–1.61) | 0.91 (0.47–1.74) | 1.00 (Ref) | |
| Meats and their products | 0.00–50.74 | 50.75–129.88 | 129.89–1321.53 |
| 1.84 (0.96–3.55) | 1.45 (0.77- 2.74) | 1.00 (Ref) | |
| Eggs | 0.03 −18.77 | 18.78–52.00 | 52.10–442.63 |
| 0.66 (0.35–1.26) | 0.87 (0.44–1.70) | 1.00 (Ref) | |
| Fish and shellfish | 0.00–25.94 | 25.95–118.84 | 118.85–1677.69 |
| 1.01 (0.55–1.85) | 1.12 (0.63–1.99) | 1.00 (Ref) | |
| Seaweed | 0.00–4.00 | 4.10–22.05 | 22.06–1403.80 |
| 1.69 (0.80–3.05) | 0.84 (0.41–1.71) | 1.00 (Ref) | |
| Milk and dairy products | 0.03–102.20 | 102.30–208.00 | 208.10–2080.00 |
| 1.55 (0.79–3.05) | 1.27 (0.58–2.77) | 1.00 (Ref) | |
| Oils and fats | 0.00–2.20 | 2.30–6.70 | 6.80–139.20 |
| 0.53 (0.29–1.08) | 0.87 (0.55–1.39) | 1.00 (Ref) | |
| Beverages | 0.00–35.00 | 35.10–355.20 | 355.30–4096.60 |
| 1.25 (0.67–1.86) | 1.49 (0.91–2.46) | 1.00 (Ref) | |
| Seasonings | 0.02–15.97 | 15.98–36.39 | 36.40–409.12 |
| 1.12 (0.67–1.86) | 1.49 (0.91–2.46) | 1.00 (Ref) | |
| Processed products | 0.03–40.98 | 40.99–142.90 | 143.00–853.59 |
| 1.36 (0.80–1.68) | 1.09 (0.37–1.72) | 1.00 (Ref) | |
| Others | 0.01–040 | 0.50–2.15 | 2.16–540.00 |
| 1.60 (0.20–1.12) | 0.04 (0.01–1.73) | 1.00 (Ref) | |
Publisher’s Note: MDPI stays neutral with regard to jurisdictional claims in published maps and institutional affiliations. |
© 2022 by the authors. Licensee MDPI, Basel, Switzerland. This article is an open access article distributed under the terms and conditions of the Creative Commons Attribution (CC BY) license (https://creativecommons.org/licenses/by/4.0/).
Share and Cite
Nabbosa, S.; Lee, S. Associations between Food Groups and Health-Related Quality of Life in Korean Adults. Nutrients 2022, 14, 3643. https://doi.org/10.3390/nu14173643
Nabbosa S, Lee S. Associations between Food Groups and Health-Related Quality of Life in Korean Adults. Nutrients. 2022; 14(17):3643. https://doi.org/10.3390/nu14173643
Chicago/Turabian StyleNabbosa, Shamirah, and Sunghee Lee. 2022. "Associations between Food Groups and Health-Related Quality of Life in Korean Adults" Nutrients 14, no. 17: 3643. https://doi.org/10.3390/nu14173643
APA StyleNabbosa, S., & Lee, S. (2022). Associations between Food Groups and Health-Related Quality of Life in Korean Adults. Nutrients, 14(17), 3643. https://doi.org/10.3390/nu14173643